

I. Executive Summary


Perhaps the most contested question from the 2016 presidential election is what factors motivated white working-class voters to support Donald Trump over Hillary Clinton by a margin of roughly two to one. New analysis by PRRI and The Atlantic, based on surveys conducted before and after the 2016 election, developed a model to test a variety of potential factors influencing support for Trump among white working-class voters. The model identifies five significant independent predictors of support for Trump among white working-class voters. No other factors were significant at conventional levels.
Overall, the model demonstrates that besides partisanship, fears about immigrants and cultural displacement were more powerful factors than economic concerns in predicting support for Trump among white working-class voters. Moreover, the effects of economic concerns were complex—with economic fatalism predicting support for Trump, but economic hardship predicting support for Clinton.
- Identification with the Republican Party. Identifying as Republican, not surprisingly, was strongly predictive of Trump support. White working-class voters who identified as Republican were 11 times more likely to support Trump than those who did not identify as Republican. No other demographic attribute was significant.
- Fears about cultural displacement. White working-class voters who say they often feel like a stranger in their own land and who believe the U.S. needs protecting against foreign influence were 3.5 times more likely to favor Trump than those who did not share these concerns.
- Support for deporting immigrants living in the country illegally. White working-class voters who favored deporting immigrants living in the country illegally were 3.3 times more likely to express a preference for Trump than those who did not.
- Economic fatalism. White working-class voters who said that college education is a gamble were almost twice as likely to express a preference for Trump as those who said it was an important investment in the future.
- Economic hardship. Notably, while only marginally significant at conventional levels (P<0.1), being in fair or poor financial shape actually predicted support for Hillary Clinton among white working-class Americans, rather than support for Donald Trump. Those who reported being in fair or poor financial shape were 1.7 times more likely to support Clinton, compared to those who were in better financial shape.
It is notable that many attitudes and attributes identified as possible explanations for Trump’s support among white working-class voters were not significant independent predictors. Gender, age, region, and religious affiliation were not significant demographic factors in the model. Views about gender roles and attitudes about race were also not significant. It is also notable that neither measure of civic engagement—attendance at civic events or religious services—proved to be a significant independent predictor of support for Trump.
The report also provides an in-depth profile of white working-class Americans, along with analysis of this group’s world view, outlook, and attitudes about cultural change and policy:
- Nearly two-thirds (65%) of white working-class Americans believe American culture and way of life has deteriorated since the 1950s.
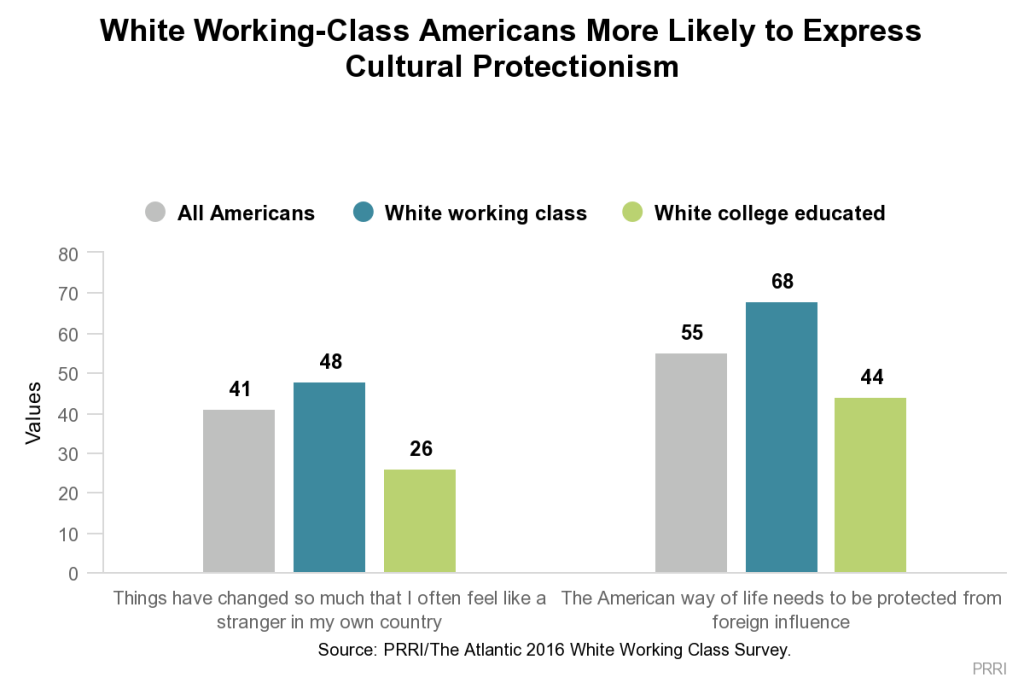
- Nearly half (48%) of white working-class Americans say, “things have changed so much that I often feel like a stranger in my own country.”
- Nearly seven in ten (68%) white working-class Americans believe the American way of life needs to be protected from foreign influence. In contrast, fewer than half (44%) of white college-educated Americans express this view.
- Nearly seven in ten (68%) white working-class Americans—along with a majority (55%) of the public overall—believe the U.S. is in danger of losing its culture and identity.
- More than six in ten (62%) white working-class Americans believe the growing number of newcomers from other countries threatens American culture, while three in ten (30%) say these newcomers strengthen society.
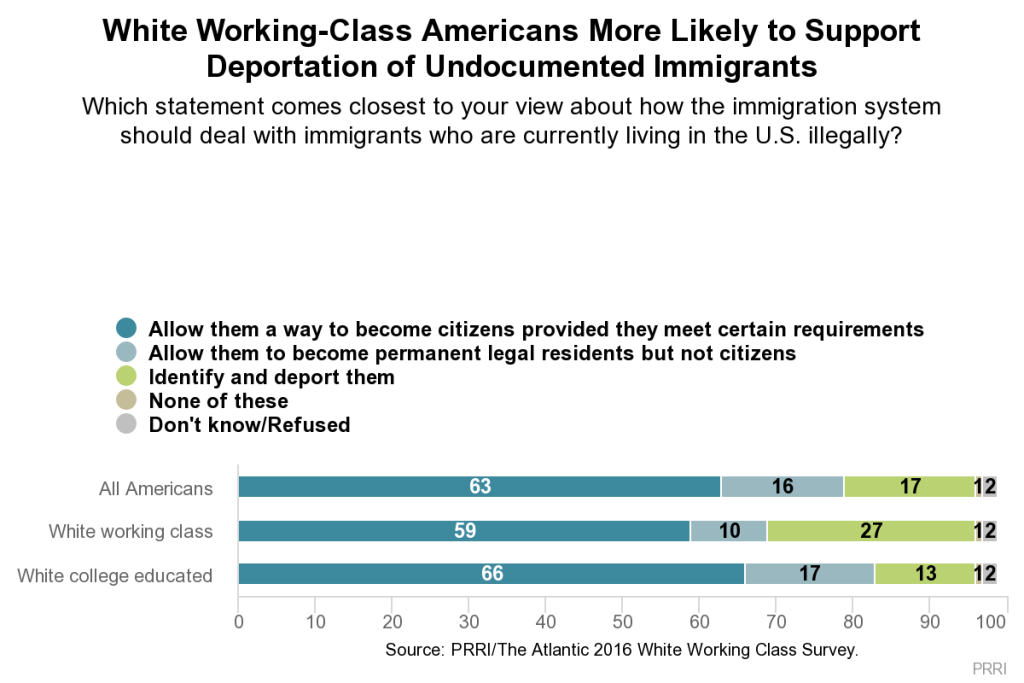
- Nearly six in ten (59%) white working-class Americans believe immigrants living in the country illegally should be allowed to become citizens provided they meet certain requirements, while 10% say they should be allowed to become permanent legal residents. More than one in four (27%) say we should identify and deport illegal immigrants. Notably, support for a path to citizenship is only slightly lower than support among the general public (63%).
- More than half (52%) of white working-class Americans believe discrimination against whites has become as big a problem as discrimination against blacks and other minorities, while 70% of white college-educated Americans disagree.
- Fewer than four in ten white working-class Americans report they are in excellent (5%) or good shape (33%) financially, compared to six in ten who say they are in fair (35%) or poor shape (25%). White working-class Americans about as likely to say their financial situation has diminished (27%) as they are to say it has improved (29%). White college-educated Americans, in contrast, are about three times as likely to say their financial circumstances have gotten better than gotten worse (41% vs. 14%, respectively).
- A majority (54%) of the white working class view getting a college education as a risky gamble, while only 44% say it is a smart investment.
- Six in ten (60%) white working-class Americans, compared to only 32% of white college-educated Americans say because things have gotten so far off track, we need a strong leader who is willing to break the rules.
II. A Profile of the White Working Class
Size and Regional Distribution
Overall, white working-class Americans make up one-third (33%) of the adult public, a substantially larger share than white Americans with at least a four-year college education (22%).1
In no region do white working-class Americans comprise a larger proportion of the population than in the Midwest, where they account for more than four in ten (43%) Americans. Roughly three in ten Americans living in the Northeast (30%) and South (31%) are white working class, while only roughly one-quarter (26%) of those living in the West are white working class.
White working-class Americans also make up a disproportionate number of those living in rural areas. Just over half (51%) of Americans living in rural areas are white working class, compared to about one in five (22%) of those living in America’s urban areas.
Union Membership
Despite the white working class’ historical connection to labor unions, relatively few members of the white working class today have a union member in their household. Only 14% of white working-class Americans report living in a household with someone who is a member of a labor union. The rate of union membership in white working-class households has not changed significantly since 2012 (16%). Union membership varies starkly among the white working class by geographic region and political affiliation.
The Northeast stands out as the region where white working-class Americans are most likely to be unionized. Nearly one-quarter (24%) of white working-class Northeasterners report living in a household where at least one person is a union member. Fewer than one in five white working-class Americans living in the Midwest (18%) and West (15%) have a family member in their household who is a member of a union. Only eight percent of white working-class Southerners say the same.
Union membership also varies among the white working class by political affiliation. White working-class Democrats are almost twice as likely as white working-class Republicans to live in a union household (21% vs. 12%, respectively). White working-class independents mirror the white working class overall.
Religious Affiliation
More than seven in ten (71%) white working-class Americans identify as Christian, and white working-class Americans are significantly more likely than the general population to identify as evangelical. Roughly one-third (31%) identify as evangelical Protestant, another one in five (20%) identify as mainline Protestant, and roughly one in five (17%) identify as Catholic. One-quarter (25%) of white working-class Americans are religiously unaffiliated, a rate comparable to the general population. Only three percent of the white working class belong to a non-Christian religious tradition.
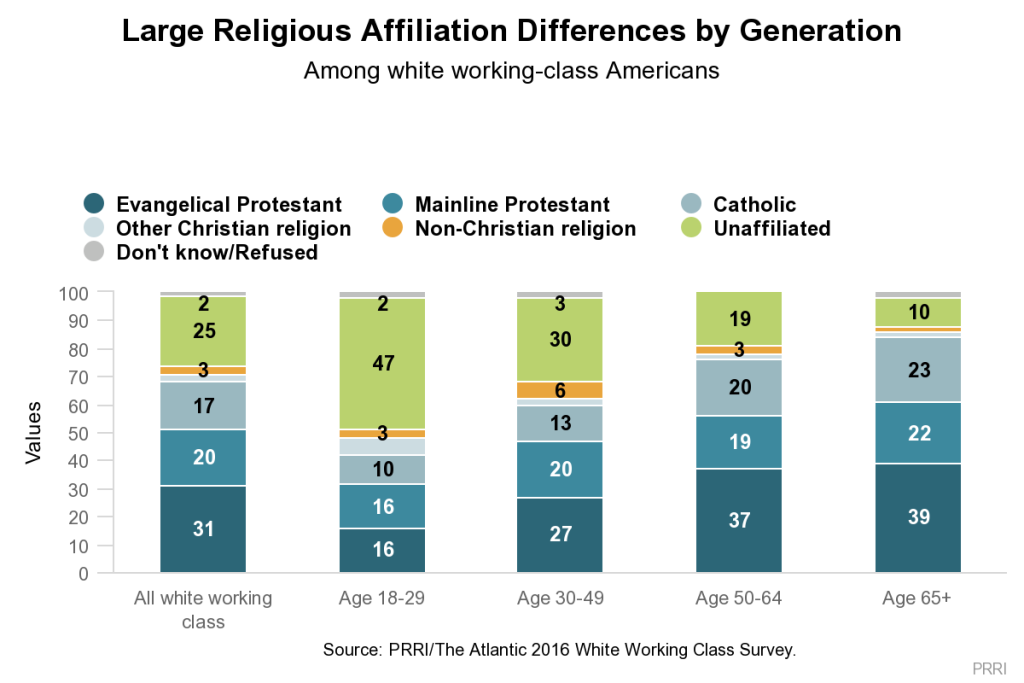 The generational differences in religious affiliation among white working-class Americans are more pronounced than among the general public. More than eight in ten white working-class seniors (age 65 and older) identify as Christian: 39% are evangelical Protestant, 22% are mainline Protestant, and 23% are Catholic. Among white working-class young adults (ages 18-29), only about four in ten identify as Christian: 16% are evangelical, 16% are mainline Protestant, and 10% are Catholic.
Young adults (age 18-29) who are white working class are more likely to identify as religiously unaffiliated than young adults overall. Nearly half (47%) of white working-class young adults are religiously unaffiliated, compared to 36% of young adults overall. Only one in ten (10%) white working-class seniors are religiously unaffiliated.
Political Profile
Political Affiliation and Ideology
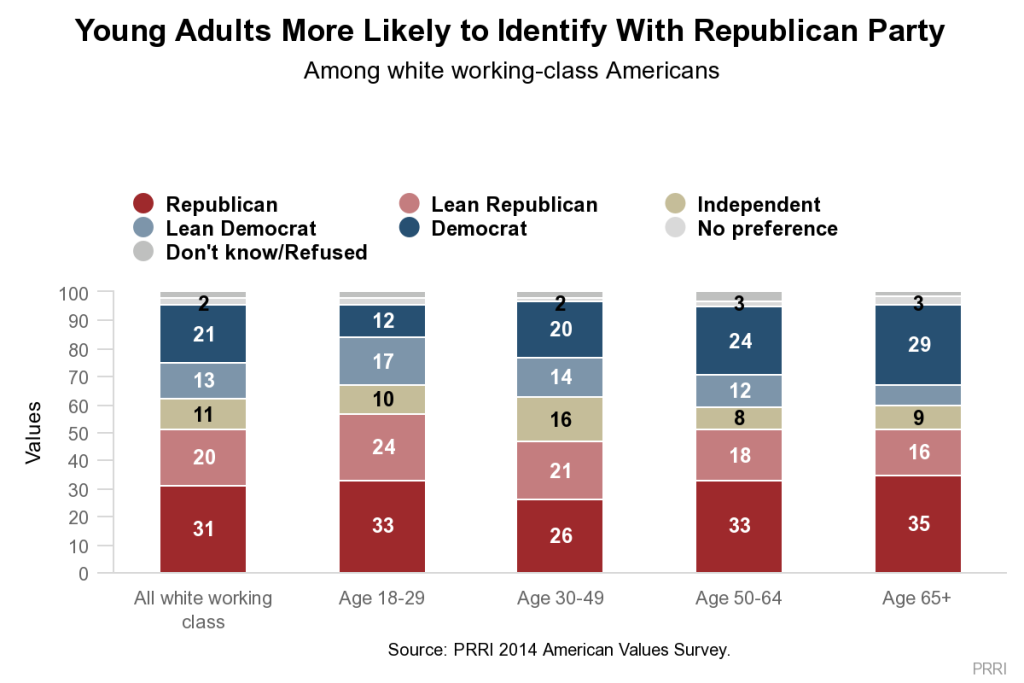
A slim majority (51%) of white working-class Americans identify with or lean toward the Republican Party.2 About one-third (34%) are affiliated with or lean toward the Democratic Party. Americans overall lean the opposite direction, with significantly more identifying with or leaning toward the Democratic Party rather than the Republican Party (47% vs. 41%, respectively).
White working-class Southerners stand out for their exceptionally strong attachment to the Republican Party. Nearly six in ten (58%) white working-class Southerners identify as Republican or lean Republican, compared to fewer than half who live in the Northeast (46%), Midwest (48%), and West (47%).
In the general population, younger Americans are significantly more likely than older Americans to identify with or lean towards the Democratic Party. But younger white working-class Americans are actually less Democratic than those who are older. A majority (57%) of white working-class young adults identify as Republican or lean towards the GOP, compared to only 29% who identify as or lean Democratic—a gap of 28 percentage points. Among white working-class seniors, the party identification gap is only 15 percentage points, with 51% at least leaning toward the Republican Party and 36% leaning toward the Democratic Party.
 The patterns of ideological identification among the white working class largely follow the patterns of partisan identification. White working-class Americans are twice as likely to identify as conservative (43%) than liberal (21%). Fewer than one in three (29%) identify as politically moderate.
Notably, however, even though younger white working-class Americans are more likely than white working-class seniors to identify as Republican, they are less likely to identify as conservative. White working-class young adults are less than half as likely as white working-class seniors to identify as conservative (23% vs. 50%, respectively). Four in ten (40%) young white working-class Americans are moderate, and more than one-quarter (26%) identify as liberal.
Trump vs. Clinton: Who Understands the Needs of the White Working Class?
White working-class Americans generally believe that President Donald Trump, rather than Hillary Clinton, better understands the problems facing their community. However, neither candidate garners a majority saying he or she understands white working-class problems well. Only about four in ten white working-class Americans believe Trump understands the problems facing their community either very (16%) or somewhat well (26%), compared to a slim majority (51%) who say he does not understand their problems well. Fewer than one-third of white working-class Americans say Clinton understands their community’s problems either very (10%) or somewhat (22%) well. More than six in ten (62%) say that she does not really understand the problems facing their community.
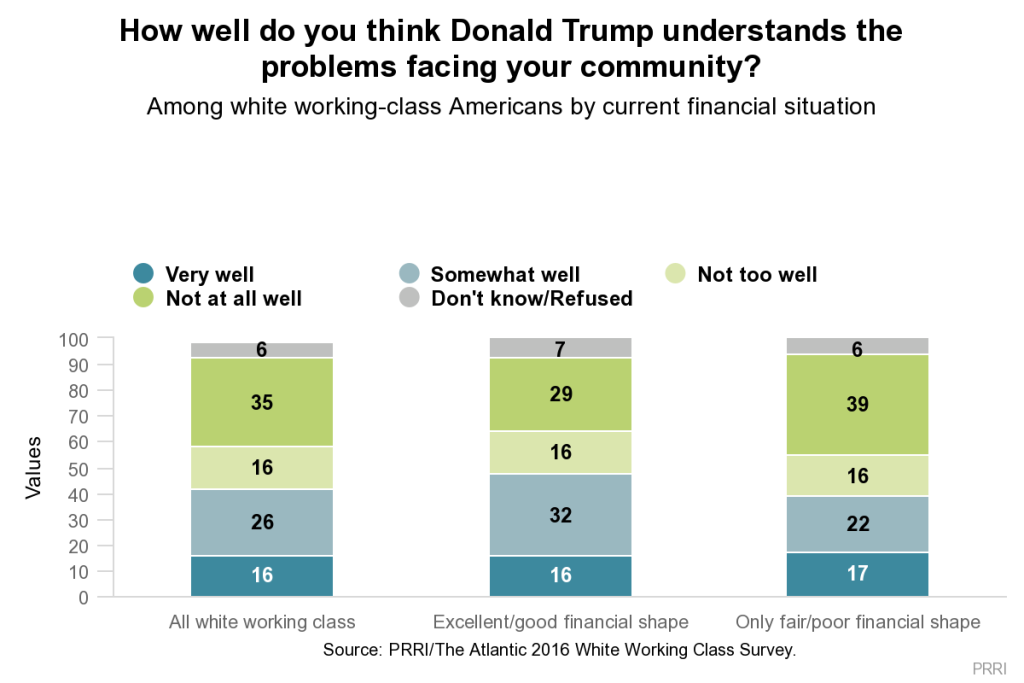 Despite the conventional wisdom that Trump attracted financially depressed voters, white working-class Americans who report being in good or excellent financial shape are significantly more likely to say that Trump understands their problems than those who report their financial condition as being fair or poor (48% vs. 39%, respectively). A majority (55%) of white working-class Americans in fair or poor shape say Trump does not understand the problems facing their communities well.
White working-class men are also more likely than women to believe Trump appreciates the challenges facing their community. Close to half (47%) of white working-class men say Trump understands the problems in their community, while only 38% of white working-class women say the same.
“I think it’s much less that Trump gets it and much more a desire to gamble on big change. It’s almost like we’re setting the reset button, we’re saying: ‘Okay, we’ve had all these politicians in here for so long, we’ve got another politician whose husband was in there for eight years, she has the potential of being in there eight years.’ There’s so many career politicians, and it seems like Trump’s entire campaign was, ‘I’m not a career politician. I may not know what I’m doing but I’m not that. So put me in there, let’s give something else, anything else, a try and see how it goes.’ And like I told everyone during the election, he’s got four years, he blows it up, we start over again.” – Man
Middle-aged white working-class Americans are more likely than either younger or older white working-class Americans to believe Trump understands the problems in their community. Only about one-third (34%) of white working-class Americans under the age of 30 say Trump understands challenges confronting their community well. Close to half of white working-class Americans age 30 to 49 (47%) and age 50 to 64 (46%) say Trump appreciates the issues they face. Among white working-class seniors (age 65 and older), fewer than four in ten (38%) believe Trump really understands the problems they face.
III. An Economic Portrait of the White Working Class
Household Income
There are profound differences in household income levels between white working-class Americans and whites with a college degree. A majority (57%) of white working-class Americans live in households earning less than $50,000 per year, including nearly four in ten (39%) making less than $30,000 per year. Fewer than one in five (19%) white college-educated Americans report household incomes of less than $50,000 a year. White college-educated Americans are nearly five times more likely to live in households with annual incomes of at least $100,000 (39% vs. 8%, respectively).
Perceptions of Personal Financial Conditions
White working-class Americans are especially pessimistic about their current finances. Fewer than four in ten report they are in excellent (5%) or good (33%) shape financially, compared to six in ten who say they are in fair (35%) or poor shape (25%). White college-educated Americans, in contrast, are much more positive: nearly two-thirds report being in excellent (18%) or good (46%) financial shape, while only about one-third say they their financial shape is fair (27%) or poor (7%).
White working-class men have slightly more negative views of their current financial situation than white working-class women. Nearly two-thirds (64%) of white working-class men say they are in fair or poor shape, compared to 58% of white working-class women.
Half (50%) of white working-class seniors report being in good or excellent financial shape—a rate significantly higher than other age groups. In contrast, fewer than four in ten white working-class Americans age 50 to 64 (31%), age 30 to 49 (39%), or age 18 to 29 (34%) say their economic circumstances are either good or excellent.
Perceptions of Socioeconomic Mobility
Nearly six in ten white working-class Americans say their family was “working class” (40%) or “lower class” (19%) when they were growing up. Notably, about four in ten white working-class Americans report that they grew up in “middle-class” (29%) or “upper-class” (11%) households. In contrast, only about four in ten white college-educated Americans report that their family’s financial standing when they were growing up was “working class” (35%) or “lower class” (6%). Additionally, white college-educated Americans are more likely than the white working class to be raised in middle-class (42%) or upper-class households (16%).
Compared to white college-educated Americans, white working-class Americans who came out of “working-class” or “lower-class” homes are more likely to report being in a similar position today. Nearly seven in ten (69%) white working-class Americans raised in “working-class” or “lower-class” households describe their current social class that way today. In contrast, only 30% of white college-educated Americans who say their family’s financial situation was “working class” or “lower class,” still identify this way today.
“It’s that kind of mentality with the businesses that we work for these days that they know they can get away with paying us nothing half the time because they know we have nowhere to go.” —Man
White working-class Americans are far less likely than white college-educated Americans to say their economic standing has improved over their lifetime. About as many white working-class Americans say their social and economic standing has improved from their childhood as say it went down (29% vs. 27%, respectively). In contrast, white college-educated Americans are about three times as likely to say their financial circumstances have gotten better than gotten worse (41% vs. 14%, respectively). Equal numbers of white working-class Americans and white college-educated Americans report that their social standing has remained about the same from when they were growing up (44% vs. 44%, respectively).
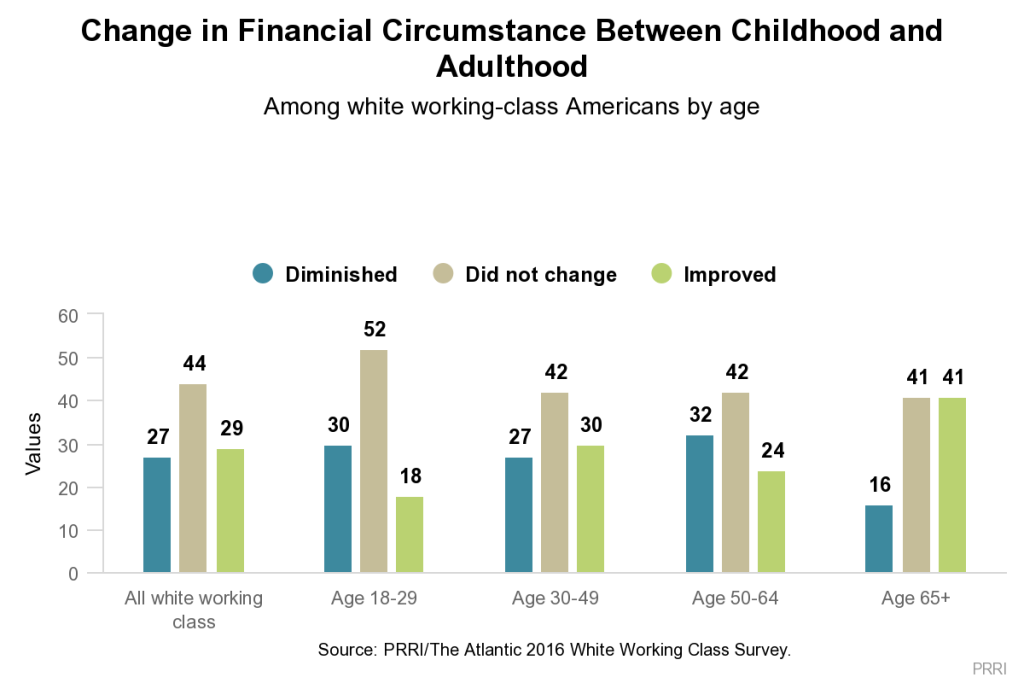 Generational differences in perceptions of economic and social mobility are telling. White working-class seniors are much more likely than those who are younger to report increased economic standing over their lifetime. More than four in ten (41%) white working-class seniors say their financial position improved from childhood compared to no more than three in ten of those age 50 to 64 (24%), age 30 to 49 (30%), and age 18 to 29 (18%). Conversely, white working-class Americans age 50 to 64 are twice as likely as seniors (32% vs. 16%, respectively) to say their economic and social position has diminished. More than half (52%) of young white working-class Americans say their economic circumstances have not changed since childhood.
Food Insecurity
White working-class Americans are more than twice as likely as white college-educated Americans to report that their household has had to cut back on food or meals in the last 12 months to save money (32% vs. 15%, respectively).
White working-class seniors—most likely due to the stabilizing effects of Medicare and Social Security—are about half as likely as every other age group to report that their household has had to cut back on food to save money. Fewer than one in five (19%) white working-class seniors report they had to make cutbacks in food spending, compared to 36% of white working-class Americans under the age of 65.
“I buy the dented cans at the grocery store because they’re cheaper. I find those places, I find the places to get the best deals on things. And I don’t think anybody in Washington today would be able to do what we do as far as living a life.” —Woman
Ability to Handle Emergency Expenses
Reflecting their current financial status, white working-class Americans are more than twice as likely as white college-educated Americans to report that they would struggle to pay a $400 emergency expense. Nearly six in ten white working-class Americans say making an emergency payment of $400 would be somewhat difficult (25%), very difficult (17%), or nearly impossible (15%). Roughly four in ten (43%) white working-class Americans say making such a payment would not be very difficult. In sharp contrast, fewer than one-quarter (22%) of white college-educated Americans report they would have at least some difficulty making a $400 expense.
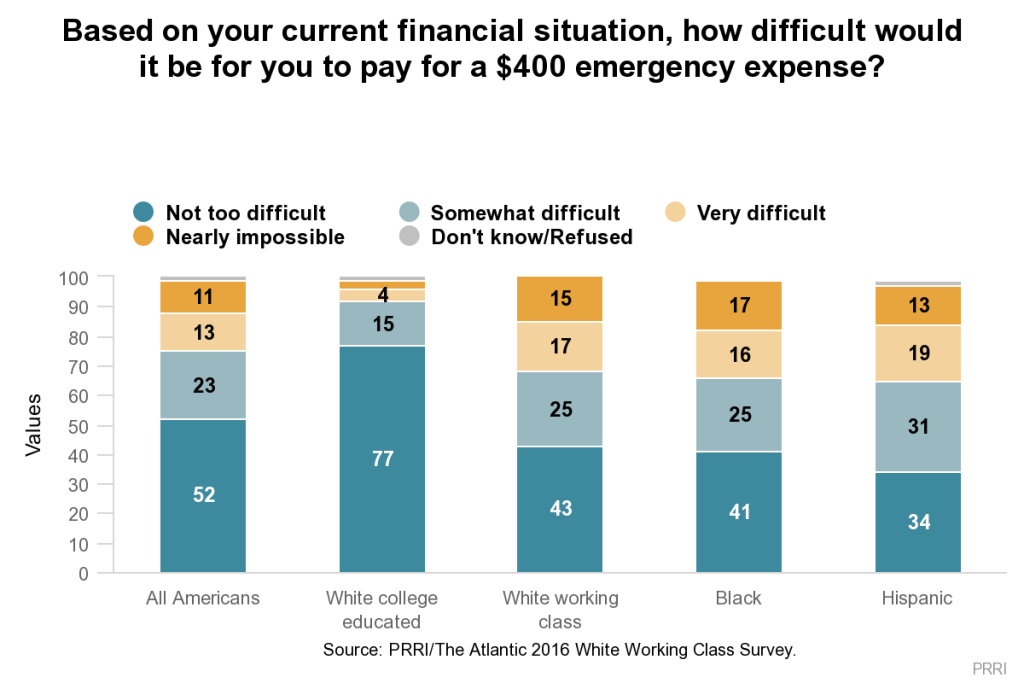 The experiences of white working-class Americans more closely resemble those of black and Hispanic Americans than those of white college-educated Americans. Only about four in ten (41%) blacks and one-third (34%) of Hispanic Americans report that it would not be that difficult to pay a $400 emergency expense given their current financial situation.
There is a sizable gender divide among white working-class Americans in their capacity to pay an emergency expense. Nearly half (48%) of white working-class men, but only 38% of white working-class women, say it would not be that difficult to pay for a $400 emergency expense.
IV. Mental Health and Substance Abuse
Health Insurance Coverage
One possible explanation for the differing levels of economic insecurity reported by older and younger white working class Americans may have to do with health insurance coverage. Nearly all (98%) white working-class seniors say they currently have health insurance coverage with the bulk of the coverage (69%) coming from Medicare or Medicaid. In contrast, nearly one in five (19%) white working-class Americans under the age of 65 say they do not currently have health insurance, including one-quarter (25%) of white working-class Americans under 30.
“I was born club-footed, and it’s hard for me to stand for certain periods of time. And I [have] such bad depression and anxiety, and they keep turning me down for social security. It’s like you don’t have enough doctor’s appointments. How can I go to [the] doctor’s if I don’t have health insurance? I don’t go to the doctor’s because I have no way to get to the doctor’s, I have no way to pay for it.” – Woman
Household Struggles with Alcoholism, Drug Addiction, and Depression
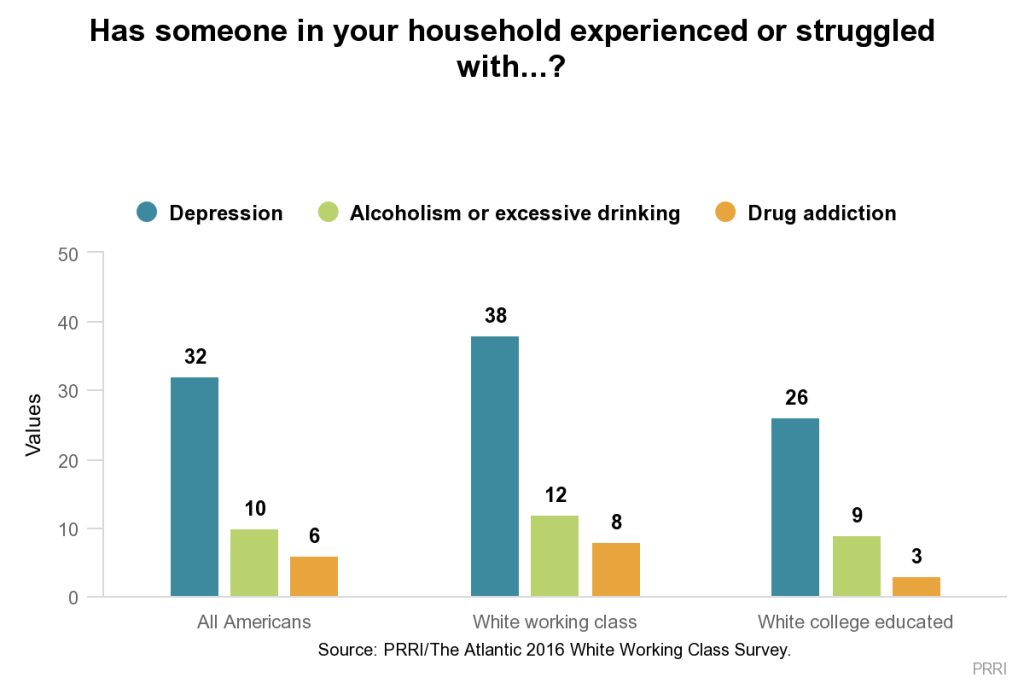
Notably, white working-class Americans are twice as likely as white college-educated Americans to say someone in their family has struggled with substance abuse. Similar numbers of white working-class Americans report a family member has struggled with either alcoholism (12%) or drug addiction (8%). Among white college-educated Americans, fewer say someone in their household has struggled with either alcoholism (9%) or drug addiction (3%). Nearly four in ten (38%) white working-class Americans, compared to 26% of white college-educated Americans, say they or someone in their household has experienced depression in the last 12 months.
 Experience with all three issues, particularly depression, varies considerably within the white working class by financial status. Nearly half (48%) of white working-class Americans who face economic distress—rating their current financial situation as fair or poor—say a member of their household has battled depression, compared to 21% of white working-class Americans who say they are in excellent or good financial shape. Rates of alcoholism and drug addiction do not differ significantly by financial status within the white working class.
White working-class women (43%) are considerably more likely than white working-class men (33%) to say a member of their household has struggled with depression in the last 12 months. However, rates of alcoholism and drug addiction do not differ markedly by gender.
Nearly half of white working-class Americans under the age of 30 (45%) and age 50 to 64 (46%) say someone in their household has struggled with depression, compared to just 22% of white working-class Americans age 65 and older. White working-class young adults are also more likely than seniors to report struggling with either alcoholism and excessive drinking (16% vs. 4%, respectively) or drug abuse (13% vs. 3%, respectively).
There are notable differences in experiencing these mental health challenges by religious affiliation, with religiously unaffiliated white working-class Americans reporting significantly higher rates of depression. Nearly half (47%) of white working-class Americans who are religiously unaffiliated report that depression is an issue in their household, compared to 38% of white working-class mainline Protestants, 35% of white working-class evangelical Protestants, and 28% of white working-class Catholics. Roughly one in five (19%) white working-class Americans with no religious affiliation report that someone in their household is suffering from alcoholism, compared to roughly one in ten white working-class mainline Protestants (12%), evangelical Protestants (9%), and Catholics (9%). Similarly, religiously unaffiliated white working-class Americans (14%) are more likely than white working-class mainline Protestants (9%), evangelical Protestants (6%), and Catholics (5%) to say a member of their household has struggles with drug addiction.
Community Problems: Drugs, Alcohol, Hunger, and Poverty
A majority (54%) of white working-class Americans say drug abuse and addiction are major problems in their community.3 Roughly one-third (32%) of white working-class Americans say they are a minor problem, while 13% say they are not a problem at all. Fewer than half (42%) of white college-educated Americans report that drugs are a major problem in their community.
Roughly one-third (34%) of white working-class Americans say alcoholism and alcohol abuse are major problems in their community, while 22% of white college-educated Americans say the same. Nearly half (48%) of white working-class Americans say alcoholism is a minor problem and 16% say it is not a problem in their community.
A similar number (33%) of white working-class Americans report hunger and poverty are major concerns in their community. About four in ten (41%) white working-class Americans say these are minor problems, and roughly one in four (26%) say these are not problems for their community. Among white college-educated Americans, only 24% say hunger and poverty are major concerns in their community.
White working-class women express much greater concern than men about all three types of community problems. More than six in ten (62%) white working-class women—but fewer than half (46%) of white working-class men—say drug abuse and addiction are major problems in their community. Roughly four in ten white working-class women say alcoholism and alcohol abuse (40%) and hunger and poverty (43%) are major problems their communities are facing. Only about one-quarter of white working-class men say the same (27% and 23%, respectively).
V. Civic and Religious Disengagement
Engagement in Civic and Social Life
About two-thirds of white working-class Americans still live in their hometown (41%) or within a two-hour drive from where they grew up (27%). Fewer than one-third (31%) white working-class Americans now live farther away from their hometown. White college-educated Americans are about half as likely to report living in their hometown with only 21% reporting having stayed. Nearly half (48%) of white college-educated Americans live farther away from their birthplace than a two-hour drive.
 Most white working-class Americans report spending time with neighbors at least somewhat regularly. A majority (52%) of white working-class Americans socialize with their neighbors at least once a month, the same rate as white college-educated Americans (54%). More than one-quarter (27%) of white working-class Americans say they socialize with people in their neighborhood less often (a few times a year or seldom), while more than one in five (21%) report never spending time with their neighbors socially.
“It ain’t like it used to be back in the old days. Everybody said ‘hi’ to everybody. Basically you can’t say ‘hi’ to people anymore—they think you’re out to get them if you’re saying ‘hi,’ waving to them. They look at you like you’re crazy.” —Woman
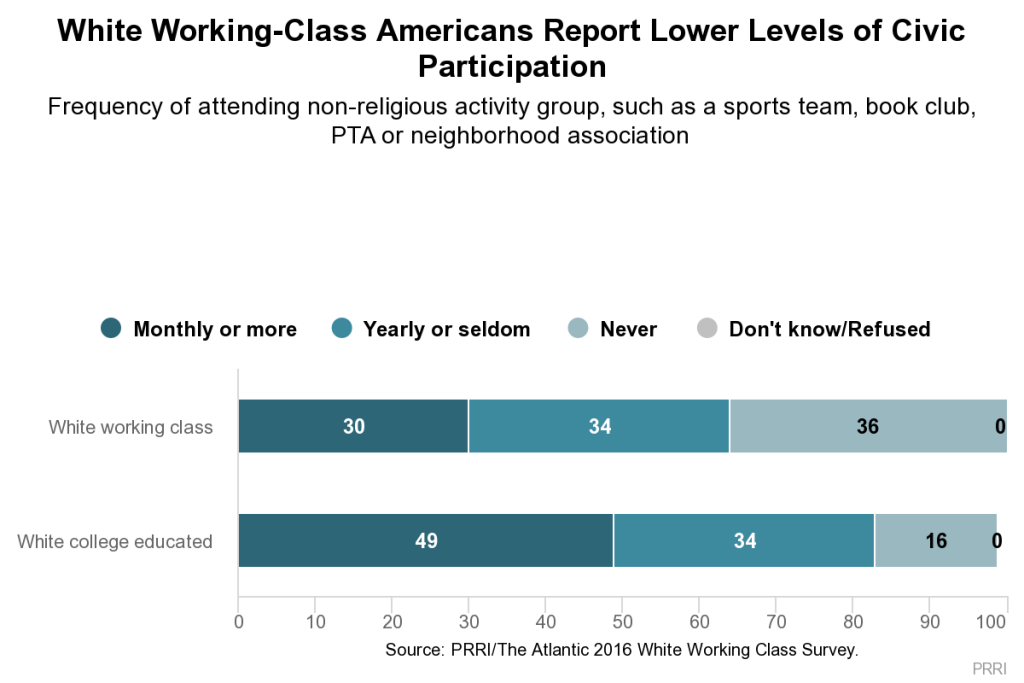
Although most white working-class Americans report socializing with neighbors at least somewhat regularly, substantially fewer say they participate in a local community groups and activities. Three in ten (30%) white working-class Americans say they participate in a sports team, book club, PTA, or neighborhood association at least once a month. Roughly one-third (34%) say they engage in these activities less frequently—a few times a year or seldom—while more than one-third (36%) say they never participate. White college-educated Americans, by contrast, exhibit far greater rates of involvement in community groups. Nearly half (49%) of white college-educated Americans say they participate in a sports team, book club, PTA, or neighborhood association at least monthly; 34% participate a few times a year or less often; and only 16% say they never engage in these activities.
“And when I talk about values, I don’t mean necessarily my spiritual or religious values but family, community. Could you really go across the street and ask that neighbor, ‘Can I borrow a cup of milk?’ Which, in my neighborhood, we can, but it’s pretty rare. I don’t know most of my neighbors. Have lived there for quite a long time. When I walk down the street with my dog or over to the pound with my dog, there’s no eye contact.” —Man
Religious Attendance
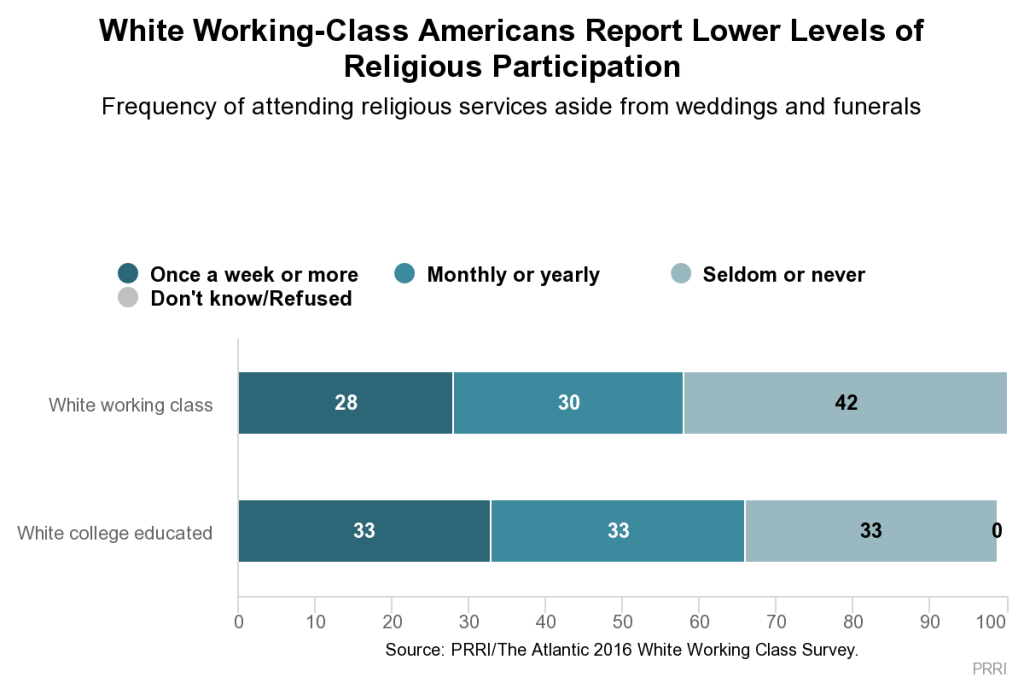
Even though roughly three-quarters (74%) of white working-class Americans identify with a religious tradition, they are less connected to religious institutions than Americans overall. Twenty-eight percent of white working-class Americans say they attend services at least once a week, 30% say they attend occasionally (once or twice a month or a few times a year), while more than four in ten (42%) say they seldom or never attend religious services. The pattern is somewhat similar among white college-educated Americans. One-third (33%) of white college-educated Americans say they attend services weekly or more often, while identical numbers report attending once or twice a month or a few times a year (33%), or seldom or never (33%).
 As with the American public overall, there are distinct differences in the frequency of religious participation among the white working class by age. White working-class seniors are nearly twice as likely as white working-class young adults to attend services at least weekly: 40% vs. 21%, respectively. Nearly half (49%) of white working-class young adults report that they seldom or never attend religious services, while only three in ten (30%) white working-class seniors say the same.
White working-class women and men are about equally likely to identify with a religious tradition, but women report being more active in their congregation. Nearly one-third (32%) of white working-class women report attending religious services at least once a week compared to fewer than one-quarter (24%) of men.
The extent to which white working-class Americans engage in civic activities is closely associated with their connection to religious communities. White working-class Americans who attend religious services at least weekly are nearly twice as likely to engage in community group activities monthly as those who seldom or never attend services (40% vs. 23%, respectively). More than two-thirds of white working-class Americans who seldom or never attend church say they seldom (21%) or never (47%) participate in non-religious activity groups such as a PTA or sports team.
VI. Pessimism and Fatalism
Belief in the American Dream
Fewer than half (46%) of white working-class Americans believe the American Dream—if you work hard, you can get ahead—still holds true, while roughly as many (48%) say it was once but is no longer true. Four percent say the American Dream was never a reality. These views stand in sharp contrast to white college-educated Americans, among whom about six in ten (62%) say the American Dream still holds true. Among the general public, half (50%) say the American Dream still holds true, while roughly four in ten (41%) say this dream once held true but does not anymore, and 6% say it never held true.
“The middle class can’t survive in today’s economy because there really isn’t a middle class anymore. You’ve got poverty level, and you’ve got your one, two percent. You don’t have a middle class anymore like you had in the ’70s and ’80s. My dad started at Cinco making a buck ten an hour. When he retired he was making $45 an hour. It took him 40 years, but he did it. You can’t find that today; there’s no job that exists like that today.” —Man
Interestingly, white working-class men have a more positive outlook about the efficacy of hard work than women. A majority (52%) of white working-class men, compared to 40% of white working-class women, say the American Dream still holds true today.
Among white working-class Americans, those approaching retirement age are most pessimistic about the promise of the American Dream. Only about four in ten (41%) white working-class Americans between the ages of 50 and 64 believe the American Dream still holds true, compared to 49% of young adults (ages 18-29), 47% of those between the ages of 30 and 49, and 47% of seniors.
Are America’s Best Days Behind Us?
Americans are almost evenly split about whether America’s best days are in the past or future: half (50%) say America’s best days are behind us, while nearly as many (48%) say the country’s best days are ahead of us.4
The white working class is decidedly more pessimistic. More than six in ten (61%) white working-class Americans say America’s best days are in the past, while fewer than four in ten (37%) say they are yet to come. Among the white college-educated, the reverse is true: nearly six in ten (57%) believe America’s best days lie ahead, while roughly four in ten (43%) say the nation’s best days are behind us.
Notably, in contrast with attitudes about the American Dream, there is virtually no gender divide among the white working class on this question. Roughly six in ten white working-class men (60%) and women (62%) say the nation’s best days are in the past.
Is a College Education a Worthwhile Investment?
Americans overall are significantly more likely to say that a college education is a smart investment (55%) than to say it is more of a gamble that might not ultimately pay off (43%).
White working-class Americans, however, are far more skeptical. A majority (54%) of the white working class view getting a college education as a risky gamble, while 44% say it is a smart investment. This puts them at odds with both white college-educated Americans and with black and Hispanic Americans, who have much more faith in the education system. Majorities of white college-educated Americans (63%), Hispanics (68%), and blacks (56%) believe a college education is a wise investment in the future.
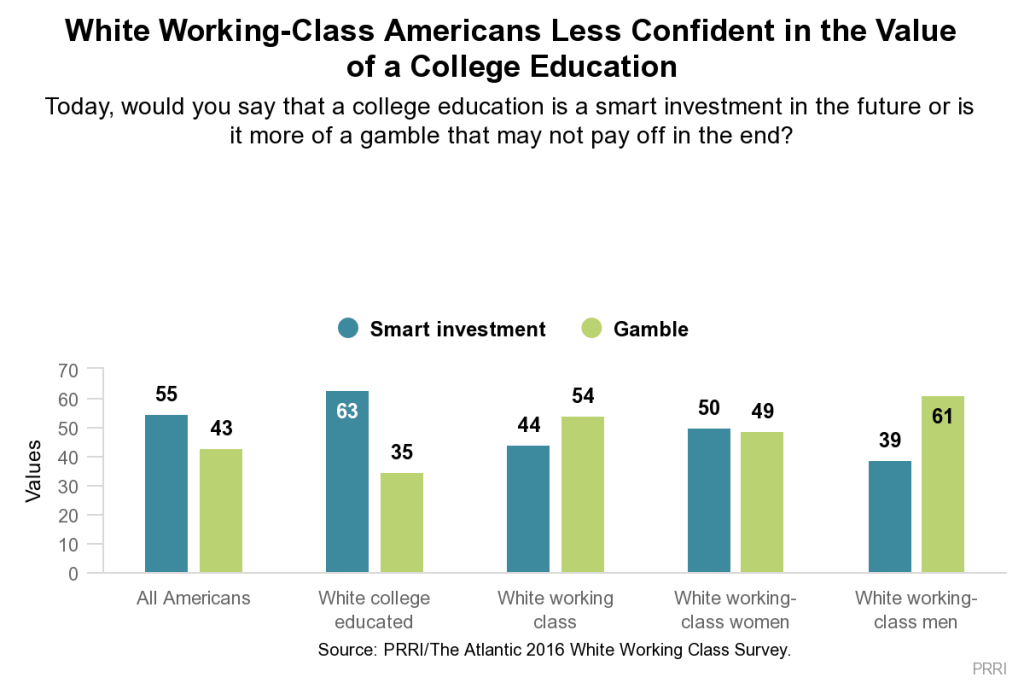 White working-class men are more dubious about the value of college educations than white working-class women. More than six in ten (61%) white working-class men say a college education is a gamble that may not pay off in the end, compared to 49% of women. Half (50%) of white working-class women view college as a smart investment.
“I feel enslaved by the student debt that I have, and I don’t have a degree, and I feel that any job that I may get I will never pay it off in my lifetime.” —Man
There are stark political differences among the white working class in their perspectives on higher education. More than six in ten (61%) white working-class Democrats believe college is ultimately a smart investment—a view held by fewer than half (47%) of white working-class Republicans and only 36% of those who are politically independent. A majority (52%) of white working-class Republicans and more than six in ten (63%) white working-class independents believe a college education is risky venture that may not pay off.
The Continuing Decline of White Working Class Communities
Few white working-class Americans who still live in their hometown report positive feelings about the direction of their community. Only 17% of white working-class Americans who still live in their hometown believe the quality of life in their hometown has gotten better since their childhood days. Close to half (45%) say the quality of life has gotten worse. Thirty-seven percent say things are about the same as they were when they were young.
Even though most white working-class Americans preferred Donald Trump in the 2016 presidential election, few feel buoyed about the future prospects for their community. Nearly half (47%) of white working-class Americans say even after the election they expect the quality of life in their community will stay about the same, and roughly one in five (19%) say it will likely get worse. Only about one-third (32%) of white working-class Americans say life will improve under the Trump administration. Among white college-educated Americans, most (55%) say the quality of life in their community will remain the same, while roughly one-quarter (26%) say it will get better, and 19% say it will get worse.5
White working-class men are somewhat more hopeful about the future of their communities than women. While similar numbers of white working-class men (48%) and women (47%) say life in their local communities is unlikely to change much at all in the wake of the election, men are more likely than women to say the quality of life in their communities will get better (36% vs. 28%, respectively) and less likely to believe things will get worse (14% vs. 24%, respectively).
Notably, white working-class Americans who voted for Donald Trump are significantly more likely than those who voted for Hillary Clinton or another candidate to have a positive outlook about the future of their local community. A majority (52%) of white working-class Trump voters say they expect life in their local community to improve, compared to just 15% of those white working-class voters who supported Clinton or another candidate. Additionally, white working-class voters who supported Clinton or a third-party candidate are more than six times more likely than Trump supporters to say the quality of life in their local community will get worse (33% vs. 5%, respectively).
Who Influences U.S. Elections?
Nearly two-thirds (64%) of white working-class Americans believe that because elections are largely controlled by the wealthy and big corporations, it does not matter if they vote.6 This view is shared by a majority (57%) of Americans, including roughly six in ten black Americans (59%) and Hispanics (61%). In contrast, only about four in ten (42%) white college-educated Americans believe their vote does not count due to the influence of wealthy people and corporations in politics.
VII. The Authoritarian Impulse
The White Working Class and Authoritarianism
PRRI’s 2012 study of white working-class Americans, Beyond God and Guns, found that white working-class Americans were much more likely than Americans with a college degree to express a preference for authoritarian traits.7 Using an authoritarian scale based on four questions about preferred childhood traits, a 2016 PRRI study found a similar gap: nearly two-thirds (64%) of white working-class Americans have an authoritarian orientation, including 37% who are classified as “high authoritarian.”8 In contrast, fewer than four in ten (39%) white college-educated Americans have an authoritarian outlook. However, there is considerable diversity among the white working class by age, gender and religious affiliation, and by perceptions of cultural change.
Younger white working-class Americans are much less likely than those who are older to express a preference for authoritarian traits. Fewer than half (43%) of white working-class young adults (age 18 to 29) have an authoritarian orientation, compared to about three-quarters (74%) of white working-class seniors (age 65 and older).9
White working-class men are somewhat less likely than women to express an authoritarian orientation. Fifty-eight percent of white working-class men, compared to more than seven in ten (71%) white working-class women, have authoritarian sympathies.
Notably, there is no variation in authoritarian orientations between white working-class Americans by income level or self-reported financial security.
There are profound differences in the degree to which white working-class Americans prefer authoritarian traits by religious identity. White working-class evangelical Protestants are more than twice as likely to have an authoritarian orientation than those who have no religious affiliation (82% vs. 39%, respectively). A majority (56%) of white working-class evangelical Protestants qualify as “high authoritarian.” Majorities of white working-class Catholics (70%) and mainline Protestants (61%) also hold authoritarian orientations.
White working-class Americans who express concerns about the changing cultural landscape, such as the influence of immigrants, are much more likely to value authoritarian traits. More than seven in ten (71%) white working-class Americans who believe immigrants are a burden on American society have an authoritarian orientation. In contrast, fewer than half (49%) of those who believe immigrants strengthen American society have an authoritarian disposition.
Yearning for a Leader Willing to Break the Rules
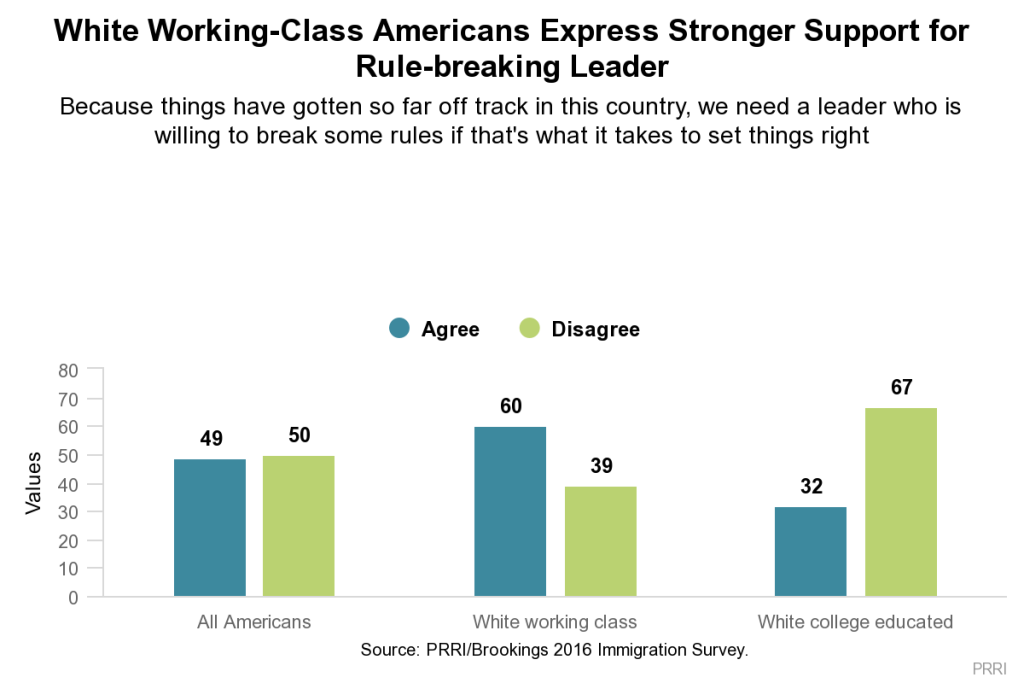
Americans are closely divided over whether the country needs a strong leader who is willing to break the rules in order to bring about needed reforms. Nearly half (49%) say things have gotten so far off track that we need a strong leader who is willing to break the rules if that is what it takes to set things right, while 50% disagree.10
Authoritarian-style leadership is much more attractive to white working-class Americans than to white college-educated Americans. Six in ten (60%) white working-class Americans, compared to only 32% of white college-educated Americans say we need such a strong leader; two-thirds (67%) of white college-educated Americans disagree.
 There is significant disagreement by age. Roughly two-thirds (66%) of white working-class seniors, compared to roughly half (52%) of white working-class young adults, say the country needs a leader who is willing to break the rules.
White working-class Christians across denominations are about equally as likely to express a preference for a leader willing to defy the standards of conduct, including approximately six in ten evangelical Protestants (63%), mainline Protestants (62%), and Catholics (67%). White working-class Americans who are religiously unaffiliated are far less likely to say such a leader is desirable (42%).
“One of two things are gonna happen: Either he’s gonna bring in drastically good policies, and they are going to work beyond what people expected them to, or they’re gonna crash and burn and everybody’s gonna say, ‘Okay, we know not to do that again next time.’” —Man
White working-class Americans who express concern about immigrants are more likely to agree the U.S. needs a leader willing to disregard the rules. Two-thirds (67%) of white working-class Americans who believe immigrants are a burden on society say the country needs such a leader. In contrast, fewer than half (48%) of white working-class Americans who believe immigrants strengthen the country agree.
Notably, the economic circumstances of white working-class Americans appear to have little influence on their preference for a rule-breaking leader. White working-class Americans who say they are in good or excellent financial shape express as much support for a leader who is willing to break the rules as those in only fair or poor shape (58% vs. 60%, respectively).
White working-class Americans who have more authoritarian leanings—are classified as either high authoritarian or authoritarian—are significantly more likely to embrace a leader who wants to upend the rules. Two-thirds (67%) of white working-class Americans with an authoritarian orientation say the country needs a candidate who is willing to defy convention and break the rules, while only 39% of white working-class Americans with an autonomous orientation agree.
VIII. Race, Gender, and Cultural Change
Fears about the Changing Culture Landscape
Americans are roughly evenly divided over whether American culture and way of life has changed for the better (48%) or for the worse (51%) since the 1950s.11 The belief that American culture has been degraded is felt strongly among the white working class. Nearly two-thirds (65%) of white working-class Americans believe the American way of life has deteriorated since the 1950s. Only about one-third (34%) of white working-class Americans believe American culture has improved. This view is sharply at odds with white college-educated Americans, a majority (56%) of whom say that American culture and way of life has improved.
“Family values in general have gone to complete shit since the 1950s, the best way to put it.” —Woman
There is a notable generational divide among white working-class Americans about the direction of the country since the mid-century mark. Young white working-class Americans are considerably less likely than seniors to say American culture has changed for the worse (54% vs. 65%, respectively). More than four in ten (44%) young white working-class Americans say the American way of life has improved since the mid-century.
One concern that white working-class Americans express about how American culture has shifted is fear the country is losing its identity. More than two-thirds (68%) of white working-class Americans—along with a majority (55%) of the public overall—believe the U.S. is in danger of losing its culture and identity. Notably, fewer than half (41%) of white college-educated Americans agree the country is at risk of losing its identity. On this question, there is broad agreement among white working-class Americans that cuts across regional and generational lines.
Among white working-class Americans of different religious backgrounds there are notable differences in the degree of concern about America’s cultural identity. Nearly eight in ten (79%) white working-class evangelical Protestants express fear that the country is losing its culture and identity, compared to 56% of those who are religiously unaffiliated.
“It just seems like it’s gotten to the point where if you don’t agree with me or I don’t agree with you, we look at each other as wrong. And how did that become that way? How did your opinion become wrong? Everybody has an opinion about life and living, and all of a sudden it’s wrong.” —Woman
For many white working-class Americans, the pace of cultural change has left them wondering about whether and where they fit in American society. Nearly half (48%) of white working-class Americans say, “things have changed so much that I often feel like a stranger in my own country.” Slightly more than half (51%) of white working-class Americans disagree. In contrast, only about one-quarter (26%) of white college-educated Americans report they often feel like a stranger, while nearly three-quarters (74%) reject the notion.
There is a substantial generational division among white working-class Americans in how they feel in relation to their country. Only about four in ten (42%) white working-class Americans under age 50 say they often feel like a stranger in their own country, while a slim majority (52%) of age 50 or older express this sentiment.
Protecting American Culture
Overwhelmingly, white working-class Americans believe the American way of life needs to be protected from foreign influence. Nearly seven in ten (68%) white working-class Americans express this view, while only 29% disagree. In contrast, fewer than half (44%) of white college-educated Americans—and a majority (55%) of the general public—also embrace this idea.
 Consistent with previous patterns of opinion, the white working class has strong generational divisions in the perception of American society’s need to be protected from cultural encroachment. White working-class Americans under age 50 are much less likely to see a need to protect American way of life than those who are at least 50 years of age (52% vs. 79%, respectively).
One response to the prevailing concern about a shifting landscape in the U.S. was to view the 2016 election as the last opportunity to push back against the tide of cultural and demographic change. For nearly half (49%) of white working-class Americans, the 2016 election represented the “last chance to stop America’s decline.” Roughly as many (50%) white working-class Americans disagree with this statement. Relatively few (27%) white college-educated Americans saw the 2016 election as the last chance to arrest America’s decline.12
Race, Discrimination, and Diversity
More than half (52%) of white working-class Americans believe discrimination against whites is as big a problem as discrimination against blacks and other minorities. Forty-six percent disagree. White college-educated Americans are sharply at odds with the white working class on this question: seven in ten (70%) say they do not believe discrimination against whites is comparable to that faced by non-whites. There are no differences of opinion among white working-class Americans by gender or region, but sizable generational disagreement exists.
Younger white working-class Americans largely disagree discrimination against whites is as big a problem as discrimination against blacks and other minorities. While only four in ten (40%) white working-class Americans under age 40 say “reverse discrimination” is an equally significant problem as discrimination against minority groups, nearly six in ten (59%) white working-class seniors (age 65 and older) believe it is. A majority (57%) of white working-class Americans under age 40 reject this idea.
“We’re supposed to make the effort to include everybody else. They don’t have to make the effort to include us. I was hysterical laughing over the thing at Eastern Kentucky University. The black student body had a welcome black event. Well, somebody on campus thought they should have a white welcome event. Well, the black one was okay, but the white one, the whole campus went bananas, and it was racist. Now what is the difference?” —Woman
When it comes to efforts aimed at increasing diversity, most white working-class Americans do not believe it is a zero-sum proposition. A majority (56%) of white working-class Americans reject the idea that “efforts to increase diversity almost always come at the expense of whites.” However, a sizable minority—four in ten (40%)—of white working-class Americans agree with this statement. In contrast, fewer than one-quarter (24%) of white college-educated Americans believe efforts at increasing diversity inherently mean whites will lose out.
White working-class men are particularly likely to believe whites lose out when efforts are undertaken to increase diversity. Nearly half (47%) of white working-class men, compared to only one-third (33%) of white working-class women, agree that diversity generally comes at the expense of whites.
Who Faces Discrimination in the U.S.?
Despite concerns about demographic change and a shifting cultural landscape, white working-class Americans are roughly as likely as Americans overall to believe many minority groups face substantial discrimination in society. Nearly two-thirds (65%) of white working-class Americans believe Muslims face a lot of discrimination in the U.S. A majority believe transgender people (61%), immigrants (59%), gay and lesbian people (56%), and blacks (54%) experience a lot of discrimination. Conversely, fewer than half of white working-class Americans say Christians (40%) and whites (38%) are facing a considerable degree of discrimination in society. However, perceptions of discrimination among white working-class Americans vary considerably by age.
Young white working-class Americans are far more likely than seniors to say that immigrants (82% vs. 43%, respectively), Muslims (79% vs. 51%, respectively), gay and lesbian people (68% vs. 45%, respectively), transgender people (70% vs. 48%, respectively), and blacks (67% vs. 46%, respectively) are experiencing a lot of discrimination in American society. There is greater agreement among young white working-class Americans and seniors about whether whites (35% vs. 32%, respectively) and Christians (36% vs. 42%, respectively) are facing a lot of discrimination.
Immigrants and Immigration
Americans overall are split over immigrants’ cultural influence. Close to half (46%) believe the growing number of newcomers from other countries threatens traditional American customs and values, while approximately as many (44%) believe the growing number of newcomers strengthens American society.13
White working-class Americans are much less divided in their opinion of immigrants. More than six in ten (62%) white working-class Americans believe the growing number of newcomers from other countries threatens American culture, while fewer than one-third (30%) disagree. The views of white college-educated Americans are nearly reversed, with a majority (54%) expressing the view that immigrants strengthen the country.
“My fiancé’s worked for the same company for 21 years, and it’s a union [job], and they are hiring Mexicans. And I don’t want to be racial, but that’s all that they’re hiring. He makes like $31 an hour, and they’re coming in at making like $8 an hour.” —Woman
Views diverge sharply by region. More than six in ten white working-class Americans living in the Northeast (66%), Midwest (62%), and South (68%) believe immigrants constitute a threat to American culture. In contrast, fewer than half (49%) of white working-class Americans in the western U.S. believe newcomers are threatening American customs.
Despite expressing largely negative views of immigrants, most white working-class Americans remain committed to a policy that would grant immigrants living in the U.S. illegally an option to become citizens. Nearly six in ten (59%) white working-class Americans believe immigrants living in the country illegally should be allowed to become citizens provided they meet certain requirements—only slightly lower than support among the general public (63%). One in ten (10%) say they should be granted permanent residency status, but denied full citizenship. More than one in four (27%) white working-class Americans support identifying and deporting immigrants who came to the U.S. illegally.
 There are modest gender divisions among the white working class, with more women than men expressing greater support for immigration reform that allows immigrants living in the U.S. illegally an opportunity to become U.S. citizens (65% vs. 53%, respectively). Nearly one-third (32%) of white working-class men say their preferred immigration policy would be to deport all immigrants living in the country unlawfully, a view shared by fewer than one-quarter (23%) of white working-class women.
Gender Roles
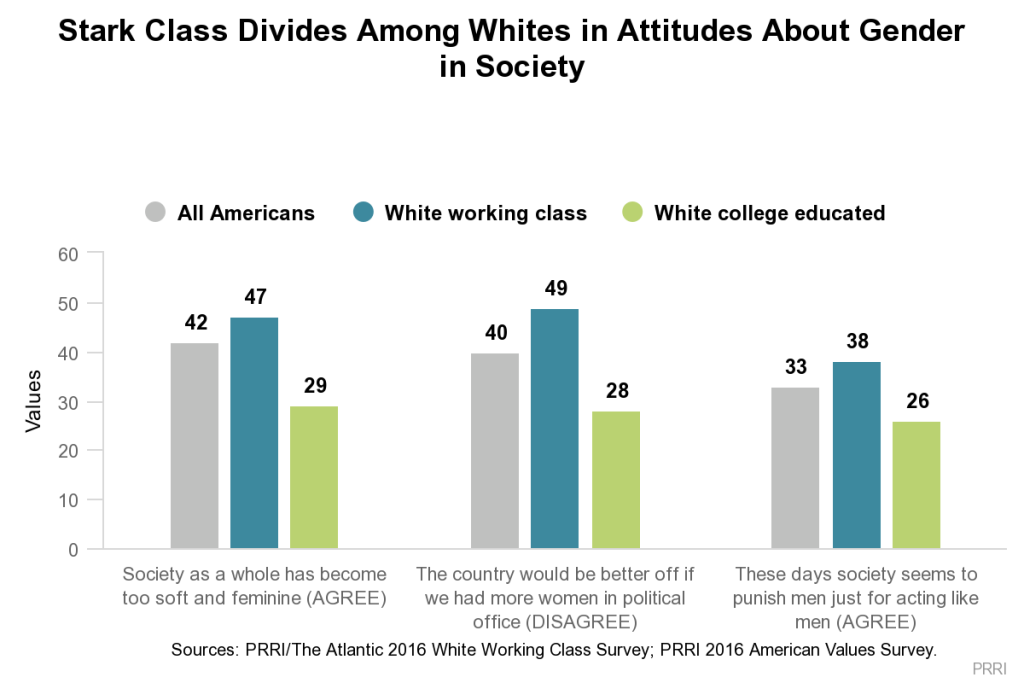
When it comes to women’s role in politics, white working-class Americans are divided. While most of the public (58%) and seven in ten (70%) white college-educated Americans believe the country would be better off if more women held political office, roughly half (48%) of white working-class Americans agree the country would be better off and just as many (49%) disagree. Notably, the gender difference is more modest among white working-class Americans than among whites with a college education.14
 Fewer than half (43%) of white working-class men, compared to a majority (53%) of white working-class women, believe the country would benefit from female leadership in politics. The divide among white college-educated Americans is even more pronounced, although majorities of both white college-educated men (56%) and women (82%) agree with this statement.
More white working-class Americans reject the idea that society punishes men for “acting like men” than embrace it (51% vs. 38%, respectively), but there are substantial differences of opinion between men and women.
White working-class men are more likely than women to believe society punishes men just for acting like men. Close to half of white working-class men (45%), compared to only about one-third of white working-class women (32%), agree society punishes men for behaving in traditionally masculine ways.
Americans overall largely reject the idea that American society has become too soft and feminine. A majority (53%) of the public disagrees that society has become overly feminine, compared to about four in ten (42%) who agree. White working-class Americans overall are more divided, with nearly half (47%) in agreement that American society has become too soft. A roughly similar number (48%) disagree that contemporary society is too soft and feminine.
White working-class men stand out for the degree to which they agree that society has become too soft and feminine. More than six in ten (61%) white working-class men embrace the notion that society has become too feminine, while only about one-third (35%) of white working-class women agree. Overall, white working-class Americans are far more likely than white college-educated Americans to believe society has become too soften and feminine (47% vs. 29%, respectively). Notably, white college-educated men are also more likely than women to agree society has become too feminine (40% vs. 20%, respectively).
IX. Economic Policy and Trade
White working-class Americans generally believe the economic system is stacked against them, are broadly supportive of populist economic policies such as raising the minimum wage and taxing the wealthy—including a larger role for government—and are skeptical of free trade. However, they tend to mirror Americans overall rather than standing out as particularly populist.
Fairness of the Economic System
Most white working-class Americans believe the economic system unfairly favors the wealthy, a view shared by many Americans. Seven in ten (70%) white working-class Americans agree with this sentiment, compared to roughly two-thirds of Americans overall (68%) and white college-educated (68%) Americans. More than three-quarters (76%) of black Americans and six in ten (63%) Hispanic Americans also express this view.
Raising the Minimum Wage and Taxing the Wealthy
A majority (53%) of the white working class favors raising the federal minimum wage from $7.25 an hour to $15 an hour, while more than four in ten (44%) are opposed. Six in ten (60%) white working-class women want to see an increase in the minimum wage, comparable to attitudes among the public (60%). However, fewer than half (45%) of white working-class men agree. Half (50%) say they oppose a $15 minimum wage.
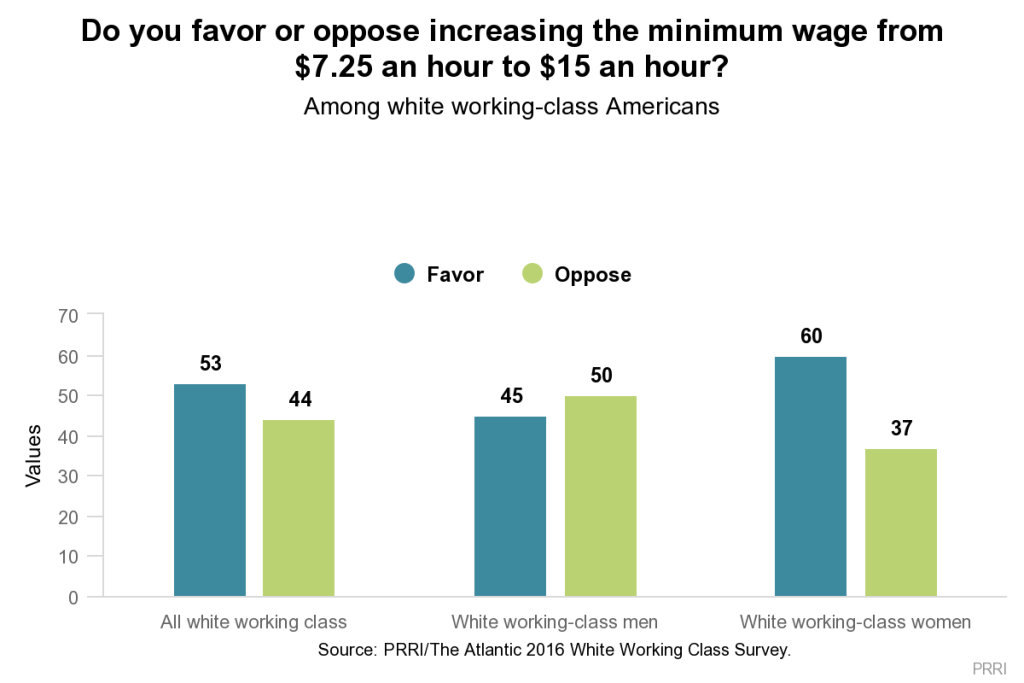 White college-educated Americans are fairly divided over the issue, with about as many expressing support (52%) as opposition (45%). White working class support for increasing the minimum wage is particularly tepid when compared to black and Hispanic Americans, who overwhelmingly favor this policy. Roughly eight in ten black (82%) and Hispanic (77%) Americans favor raising the minimum wage to $15 per hour.
Notably, fewer than half (48%) of young white working-class Americans favor a minimum wage hike to $15 an hour. More than half (51%) oppose it. The level of support among young white working-class Americans mirrors that among white working-class seniors—half (50%) favor an increase, while 44% oppose it.
“I’m tired of the minimum wage being offered so low it makes it impossible to provide for your family no matter how hard you break your back.” —Woman
Party differences among the white working class are particularly pronounced. Only one-third (33%) of white working-class Republicans say they would be in favor of raising the minimum wage, while more than six in ten (63%) are opposed. White working-class Democrats, in contrast, overwhelmingly support this policy, with more than three-quarters (78%) saying they are in favor. White working-class independents mirror the white working class overall on this issue.
There is more robust support among white working-class Americans for raising the tax rate on Americans making over $250,000 a year. Nearly six in ten (58%) members of the white working-class favor increasing the tax rate for wealthy households, similar to the level of support found among the general public (57%) and white college-educated Americans (58%).
Interestingly, differences exist between black and Hispanic Americans’ views on increasing taxes on the wealthy. Like white working-class Americans, blacks express robust support for a tax hike on those making $250,000 a year or more, while Hispanic Americans are less inclined to support such a policy (63% vs. 51%, respectively).
Similar divisions among white working-class Americans emerge by gender. White working-class women express greater support for increasing taxes on those earning more than $250,000 per year than men (62% vs. 54%, respectively).
Welfare (and Race)
Although white working-class Americans tend to favor an increase in the minimum wage and raising the tax rate on wealthy families, most take a dim view of people who receive welfare payments. A majority (54%) of white working-class Americans say people who receive welfare payments are taking advantage of the system, while approximately one-third (36%) say they are genuinely in need of help.
The white working class stands in sharp contrast to Americans overall, their white college-educated counterparts, and both black and Hispanic Americans. The general public is divided on this issue, with 46% saying most welfare recipients are in need of help and 44% saying most are playing the system. The views of Hispanic Americans are similar, with roughly as many believing welfare recipients need help (46%) as believing they are taking advantage (45%). Roughly six in ten white college-educated Americans (59%) and black Americans (61%) say most people on welfare have genuine need, while approximately three in ten take the opposing view (32% and 30%, respectively).
There are few differences among the white working class by religion, gender, or region. However, political divisions are notable: nearly two-thirds (65%) of white working-class Republicans say most people on welfare are abusing the system, while a slim majority (51%) of white working-class Democrats say most people on welfare need the help. White working-class independents largely mirror the white working class overall.
There is sharp generational disagreement among the white working class about the social welfare system. Nearly half (49%) of young white working-class Americans believe people who receive welfare payments are genuinely in need of assistance, while roughly as many (46%) say they are abusing the system. In contrast, only about one-third (34%) of white working-class seniors believe people receiving welfare need help, while a majority (53%) say they are taking advantage of the system.
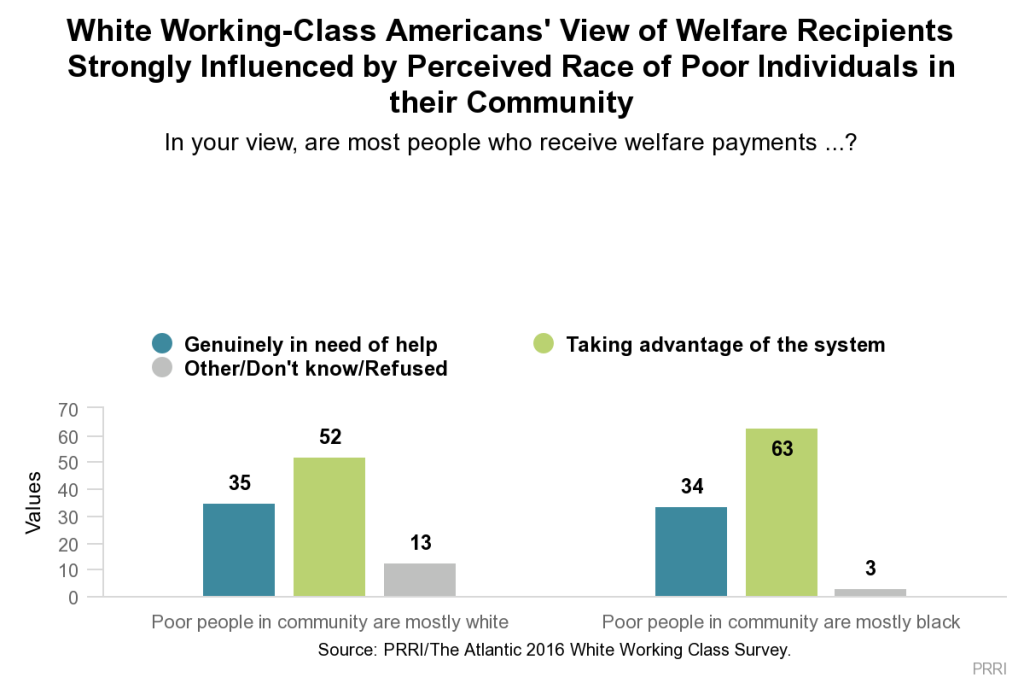 There is some evidence attitudes about welfare, particularly among white working-class Americans, are closely tied to race.15 White working-class Americans who say they live in neighborhoods where the majority of lower-income people are non-white are more likely to believe there is widespread fraud or abuse in the welfare system than those living in areas where poor people are mostly white.
More than six in ten (63%) white working-class Americans who report living in areas where poor people are predominantly black believe people on welfare are abusing the system. In contrast, roughly half (52%) of white working-class Americans who report that most poor people in their communities are white believe people who receive welfare are abusing the system, while 35% say they need help. White college-educated Americans in both types of communities reported similar views of people on welfare.
Infrastructure and Free Trade
Most (53%) white working-class Americans believe the best way to promote economic growth is to increase spending on education and the nation’s infrastructure, while raising taxes on wealthy individuals and businesses to pay for it.16 About four in ten (41%) prefer lowering taxes on individuals and businesses and paying for those tax cuts by cutting spending on some government services and programs.
White working-class attitudes on this issue are roughly in line with white college-educated Americans, but they are less likely than black and Hispanic Americans to endorse increased spending on education and infrastructure. Nationally, 56% of Americans favor more infrastructure spending, as do 53% of white college-educated people. Roughly three-quarters (74%) of black Americans and nearly two-thirds (65%) of Hispanic Americans believe economic growth is spurred through increased spending on infrastructure.
The gender divide persists in views about funding infrastructure projects and education. White working-class women are slightly more likely than men to believe investments in education and infrastructure are a better way to promote growth (57% vs. 49%, respectively).
One issue where white working-class Americans stand out from other Americans is free trade. Six in ten (60%) white working-class people say free trade agreements with other countries are mostly harmful because they send jobs overseas and drive down wages, while one-third (33%) say they are mostly helpful because they open markets for U.S. companies and allow Americans to buy goods more cheaply. Americans overall are more divided on the benefits of trade. Half (50%) of Americans say free trade deals are mostly harmful rather than mostly helpful (43%).17 White college-educated Americans similarly are divided, but somewhat more likely to say free trade is helpful (49%) rather than harmful (42%).
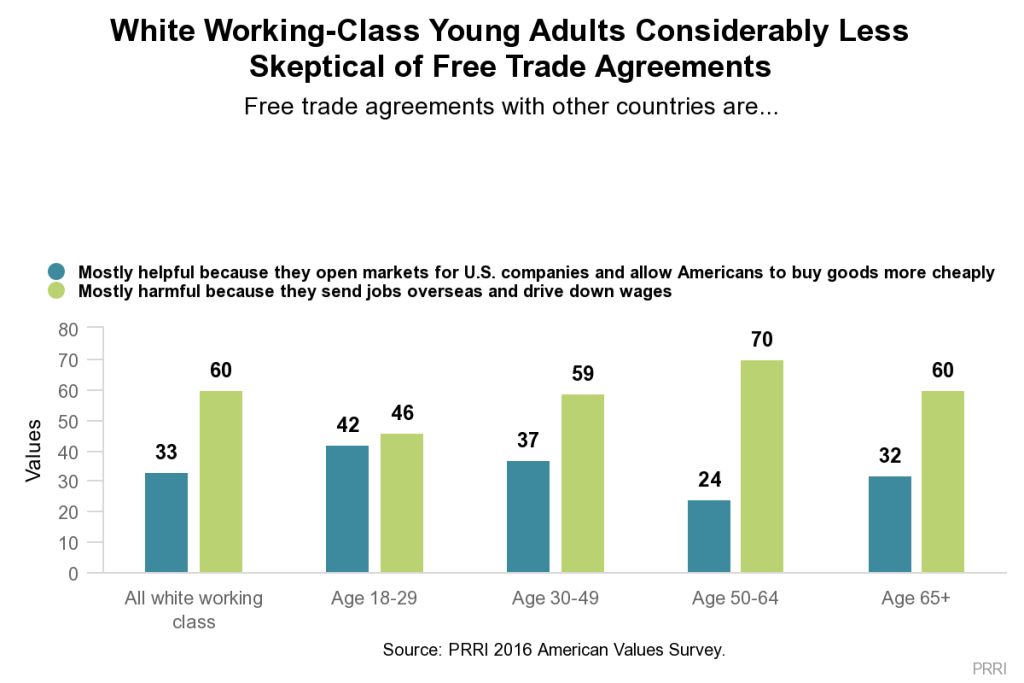 Among white working-class Americans there is a considerable generational divide in views about free trade. Young white working-class Americans are divided over whether free trade is mostly harmful because it sends American jobs overseas and lowers wages (46%) or whether it is mostly helpful because it allows Americans to buy goods more cheaply (42%). Six in ten (60%) white working-class seniors believe free trade is harmful because it sends American jobs overseas.
X. Criminal Justice and Drug Policy
Treatment vs. Jail Time for Drug Users
White working-class Americans—and the public overall—are strongly supportive of requiring drug treatment rather than jail time for drug users after a first or second offense. Approximately seven in ten (71%) white working-class Americans and three-quarters (74%) of the public believe drug treatment is preferable to prison for those using illegal drugs. More than eight in ten (82%) white college-educated Americans also support a treatment option over incarceration. Drug treatment is the preferred option among an overwhelming number of black (78%) and Hispanic (67%) Americans.
“You don’t see anyone smoking marijuana and going out and shooting people, number one. Generally it’s not a drunk driving. They’re sitting at home with a bag of Fritos, and they’re too tired to do anything. And it’s doing amazing things medically, so why are we still fighting it? And the war on drugs hasn’t done squat for us, so we need to figure out another plan.” —Woman
Felon Voting Rights
There is equally strong support among white working-class Americans for the restoration of voting rights for felons. More than seven in ten (71%) white working-class Americans and about three-quarters (74%) of the public overall agree a person who has been convicted of a felony should be allowed to vote after they have served their sentence; about one-quarter (26%) of Americans disagree.18
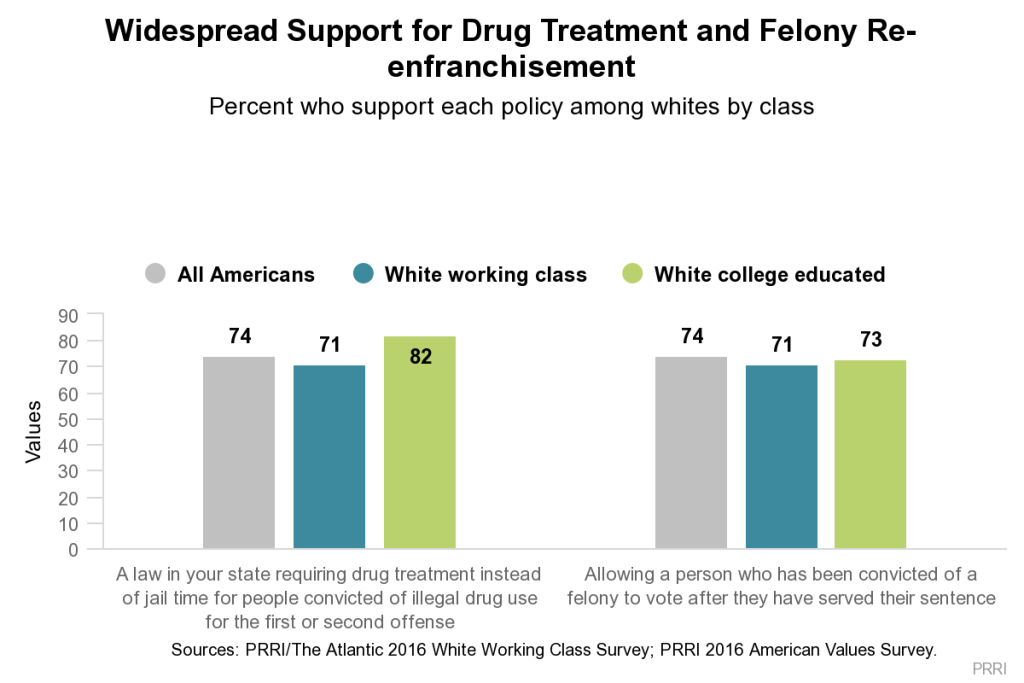 There is no gender divide among the white working class, but there is a vast generational gap. Nearly eight in ten (78%) white working-class young adults (age 18-29) say a person convicted of a felony should have their voting rights restored after serving their sentence, compared to roughly six in ten (59%) white working-class seniors (age 65 and older).
White working-class support for restoring voting rights to felons also varies somewhat by region. Two-thirds (67%) of white working-class Southerners believe felons should be allowed to vote after serving their sentences, while 70% of those in the Midwest, 73% of those in the Northeast, and 76% of those in the West agree.
XI. Understanding the White Working Class Vote in 2016
A post-election survey conducted by PRRI just days after the election found nearly two-thirds (64%) of white working-class voters reported supporting President Trump in the 2016 presidential election, while fewer than one-third (32%) said they cast a ballot for Hillary Clinton.19 A number of explanations were offered to help explain Trump’s rise and unlikely victory in 2016, with many of them focused particularly on his strong performance among white working-class voters.
“My dad specifically told me when he voted for Obama, the only reason he voted for Obama was because of his promise for change. This time he voted for Hillary and we’ve been fighting ever since. I said, ‘Where do you think you’re gonna get change with her? Just tell me one thing that you think she’s gonna change.’” —Man
Some of the most prominent factors identified by journalists and scholars include: lack of social mobility, economic distress, poor health outcomes, civic disengagement, racial resentment, anxiety about cultural change, anti-immigrant sentiment, and anxiety about shifting gender roles.
However, survey results demonstrate no evidence for several leading theories.
- White working-class voters who experienced a loss of social and economic standing were not any more likely favor Trump than those whose status remained the same or improved.
- White working-class voters who reported that someone in their household was dealing with a health issue—such as drug addiction, alcohol abuse, or depression—were actually less likely to express support for Trump’s candidacy.
- There is no correlation between the level of civic engagement and preference for Trump among white working-class voters.
Still, many factors remain correlated with support for Trump’s candidacy among white working-class voters.
- White working-class voters who said discrimination against whites is a serious problem were much more likely to favor Trump than those who did not (74% vs. 40%, respectively).
- Similarly, white working-class voters who expressed anxieties about cultural change—a composite variable that combined a belief that the U.S. needs to be protected from foreign influence and feelings of being “a stranger in my own country”—expressed a much stronger preference for Trump than those who did not (79% vs. 43%, respectively).
- White working-class voters who advocated deporting immigrants living in the country illegally overwhelmingly favored Trump, while those who favored alternative policies expressed far less support (87% vs. 49%, respectively).
- Roughly three-quarters (74%) of white working-class voters who say society punishes men “just for acting like men” supported Trump, compared to 48% of those who reject this statement.
Independent Predictors of Support for Donald Trump Among White Working-Class Americans
In order to sort out which attributes, attitudes, and experiences mattered most in predicting support for Trump among working-class voters, we constructed a multivariate logistic regression model.20 The model included a variety of demographic traits such as gender, age, region, hometown residence, Republican identity, and evangelical Protestant identity. The model also tested two measures of civic engagement: frequency of worship attendance (seldom or never) and frequency of civic engagement (seldom or never). Additionally, the model tested a variety of measures of cultural anxiety: beliefs about whether changing gender roles disadvantage men, perceptions of reverse discrimination, anxieties about cultural change, support for deporting immigrants, and negative views of Muslims. Finally, the model also included measures of economic anxiety, including adverse health outcomes, a belief that education is a gamble, the perception of being in poor financial shape, and perceived downward socioeconomic mobility.
Overall, the model demonstrates that besides partisanship, fears about immigrants and cultural displacement were more powerful factors than economic concerns in predicting support for Trump among white working-class voters. Moreover, the effects of economic concerns were complex—with economic fatalism predicting support for Trump, but economic hardship predicting support for Clinton.
- Identification with the Republican Party. Identifying as Republican, not surprisingly, was strongly predictive of Trump support. White working-class voters who identified as Republican were 11 times more likely to support Trump than those who did not identify as Republican. No other demographic attribute was significant.
- Fears about cultural displacement. White working-class voters who say they often feel like a stranger in their own land and who believe the U.S. needs protecting against foreign influence were 3.5 times more likely to favor Trump than those who did not share these concerns.
- Support for deporting immigrants living in the country illegally. White working-class voters who favored deporting immigrants living in the country illegally were 3.3 times more likely to express a preference for Trump than those who did not.
- Economic fatalism. White working-class voters who said that college education is a gamble were almost twice as likely to express a preference for Trump as those who said it was an important investment in the future.21
- Economic hardship. Notably, while only marginally significant at conventional levels (P<0.1), being in fair or poor financial shape actually predicted support for Hillary Clinton among white working-class Americans, rather than support for Donald Trump. Those who reported being in fair or poor financial shape were 1.7 times more likely to support Clinton, compared to those who were in better financial shape.22
It is notable that many attitudes and attributes identified as possible explanations for Trump’s support among white working-class voters were not significant independent predictors. Gender, age, region, and religious affiliation were not significant demographic factors in the model. Views about gender roles and attitudes about race were also not significant. It is also notable that neither measure of civic engagement—attendance at civic events or religious services—proved to be a significant independent predictor of support for Trump.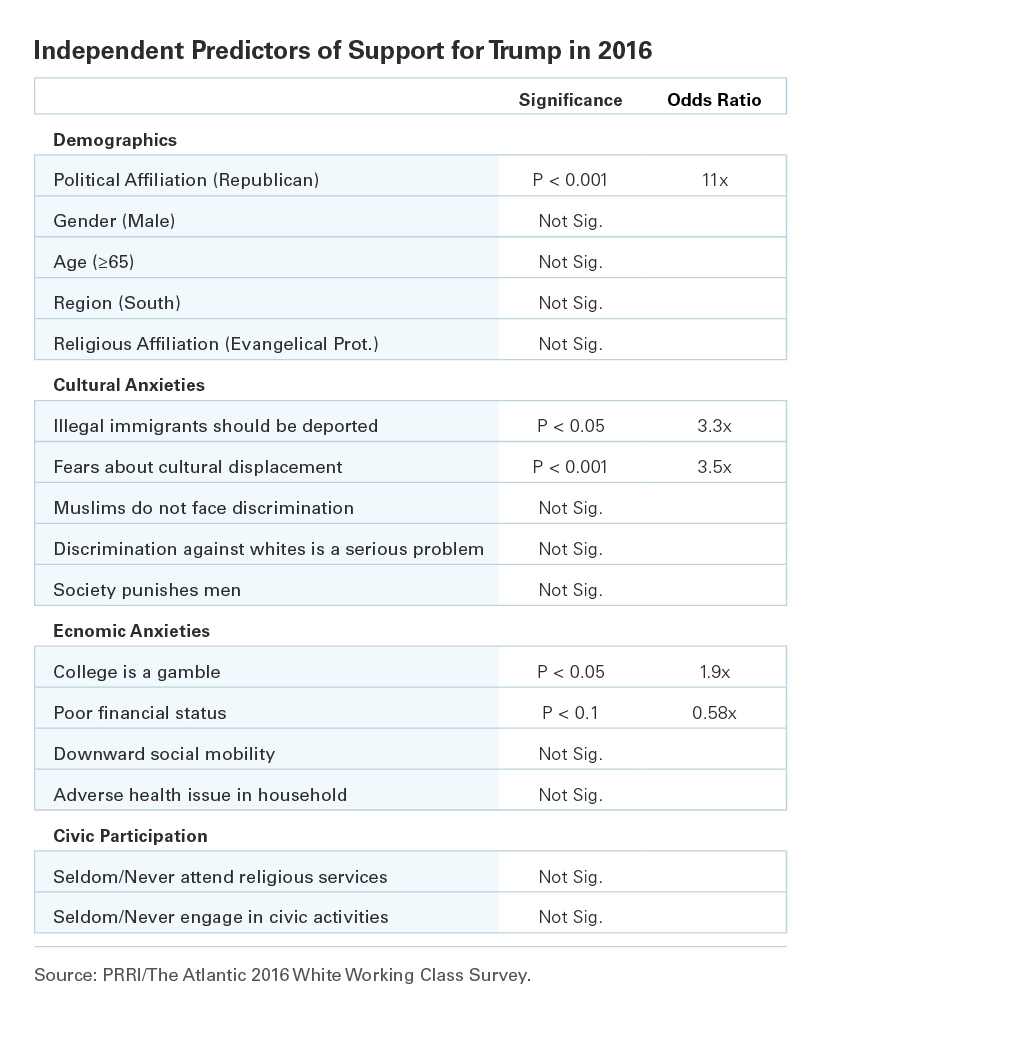
Methodology
This report is based primarily on a large national survey and a series of four focus groups conducted Dec. 12-13, 2016 in Cincinnati, Ohio.23 The focus group participants included white, non-Hispanic adults between the ages of 25 and 55, who did not have a four-year college degree. Groups were gender segregated and all participants identified as politically independent. The focus groups were conducted at L&E Research.
The survey was designed and conducted by PRRI in partnership with The Atlantic. The survey was made possible by generous grants from Open Society Foundations and the Ford Foundation. Results of the survey were based on bilingual (Spanish and English) RDD telephone interviews conducted between September 22, 2016 and October 9, 2016 by professional interviewers under the direction of SSRS. Interviews were conducted among a random sample of 3,043 adults 18 years of age or older living in the United States (1,823 respondents were interviewed on a cell phone). The selection of respondents within households was accomplished by randomly requesting to speak with the youngest adult male or female currently living in the household.
Data collection is based on stratified, single-stage, random-digit-dialing (RDD) sample of landline telephone households and randomly generated cell phone numbers. The sample is designed to represent the total U.S. adult population and includes respondents from all 50 states, including Hawaii and Alaska. The landline and cell phone samples are provided by Marketing Systems Group.
The weighting is accomplished in two separate stages. The first stage of weighting corrects for different probabilities of selection associated with the number of adults in each household and each respondent’s telephone usage patterns.24 In the second stage, sample demographics are balanced to match target population parameters for gender, age, education, race and Hispanic ethnicity, region (U.S. Census definitions), population density and telephone usage. The population density parameter was derived from Census 2010 data. The telephone usage parameter came from an analysis of the July-December 2015 National Health Interview Survey. All other weighting parameters are derived from an analysis of the U.S. Census Bureau’s May 2016 Current Population Survey.
The sample weighting is accomplished using an iterative proportional fitting (IFP) process that simultaneously balances the distributions of all variables. Weights were trimmed to prevent individual interviews from having too much influence on the final results. The use of these weights in statistical analysis ensures that the demographic characteristics of the sample closely approximate the demographic characteristics of the target populations.
The margin of error for the survey is +/- 2.1 percentage points at the 95% level of confidence. The survey included a subsample of 1,956 likely voters. The margin of error for the subsample of likely voters is +/- 2.6 percentage points at the 95% level of confidence. The design effect for the survey is 1.3. In addition to sampling error, surveys may also be subject to error or bias due to question wording, context and order effects.
Endnotes
1 This report uses the definition of the white working class that was developed in the 2012 PRRI report, Beyond God and Guns: Understanding the Complexities of the White Working Class in America: white, non-Hispanic Americans without a four-year college degree who hold non-salaried jobs. Source: Jones, Robert P., and Daniel Cox. “Beyond Guns and God: Understanding the Complexity of the White Working Class in America.” PRRI. 2012. http://www.prri.org/research/race-class-culture-survey-2012/.
2 PRRI 2014 American Values Survey.
3 PRRI/The Atlantic 2016 Post-election White Working Class Survey.
4 PRRI 2016 American Values Survey.
5 PRRI/The Atlantic 2016 Post-election White Working Class Survey.
6 PRRI 2016 American Values Survey.
7 Authoritarianism was defined in this report using Lipset’s (1959) conceptualization: a lowered tolerance for differing viewpoints and the groups who espouse them, and greater support for traditional sources of authority. Following Feldman (2003), Stenner (2005), and Owen et al. (1991), we rely on a battery of paired traits originally derived from American National Election Study that require respondents to identify the most desirable childhood traits from the following pairs: “respect for elders” or “independence,” “good manners” or “curiosity,” “self-reliance” or “obedience,” and “well-behaved” or “creative.” From these four questions, we computed a single additive scale that identifies five distinct orientations: Highly Autonomous, Autonomous, Mixed, Authoritarian, and Highly Authoritarian. Source: Jones, Robert P., and Daniel Cox. “Beyond Guns and God: Understanding the Complexity of the White Working Class in America.” PRRI. 2012.
8 PRRI/Brookings 2016 Immigration Survey.
9 Sample size for young adult white working class is 99.
10 PRRI/Brookings 2016 Immigration Survey.
11 PRRI 2016 American Values Survey.
12 PRRI/The Atlantic 2016 Post-election White Working Class Survey.
13 PRRI 2016 American Values Survey.
14 PRRI 2016 American Values Survey.
15 Approximately one-third (34%) of white working-class respondents report most of the poor people in their community were white, while another 12% said most were black.
16 PRRI/The Atlantic 2016 Post-election White Working Class Survey.
17 PRRI 2016 American Values Survey.
18 PRRI 2016 American Values Survey.
19 PRRI’s post-election survey was consistent with the National Exit Polls, which found 67% of white voters without a four-year college degree supporting Donald Trump and 30% supporting Hillary Clinton (National Exit Poll, 2016).
20 Because we were looking at factors predicting the voting behavior of a relatively modest subset of voters—white working-class voters—we conducted this analysis using a large pre-election survey. To further test these results, we ran a model with the same parameters using a post-election survey that produced a similar pattern of results. The factors described here as significant predictors of Trump support were significant in both the pre-election and post-election models. The multivariate analysis is conducted among voters who reported supporting a particular candidate, including third-party candidates. Voters who reported being unsure of who they voted for or who refused to identify the candidate they supported were not included in the analysis. All voters were included in the model.
21 This group also includes respondents who offered no opinion.
22 This group also includes respondents who offered no opinion.
23 This report also includes analysis based on the following surveys: PRRI 2014 American Values Survey, PRRI 2016 American Values Survey, PRRI/The Atlantic 2016 Post-election White Working Class Survey, PRRI/Brookings 2016 Immigration Survey.
24 Telephone usage refers to whether respondents have only a landline telephone, only a cell phone, or both types.
Recommended Citation
Jones, Robert P., Daniel Cox, and Rachel Lienesch. “Beyond Economics: Fears of Cultural Displacement Pushed the White Working Class to Trump
PRRI/The Atlantic Report.” PRRI. 2017.


