

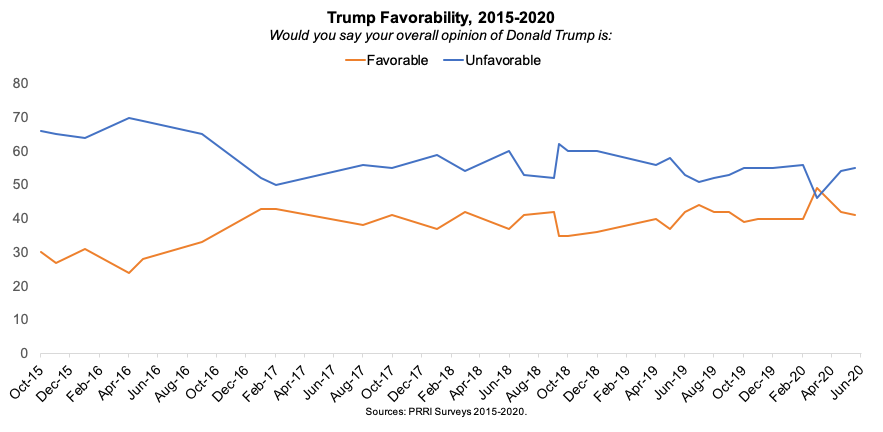
New data from PRRI shows that 41% of Americans hold favorable views of President Donald Trump, while a 55% majority hold unfavorable views of him. These numbers are similar to Trump’s favorability in April (43% favorable, 54% unfavorable). The lack of change in a tumultuous week again underscores that the president’s favorability numbers seem to have a hard floor in the low 40s. During a tense field period last week, widespread protests intensified, sparked by the police killing of George Floyd in the wake of already-high racial tensions after recent high-profile killings of Ahmaud Arbery and Breonna Taylor. Additionally, U.S. COVID-19 cases reached nearly 1.7 million and deaths reached a landmark number of 100,000 near the beginning of the week, with a disproportionate number of these deaths among African Americans. At the same time, many states had begun allowing some non-essential businesses to reopen.[1]
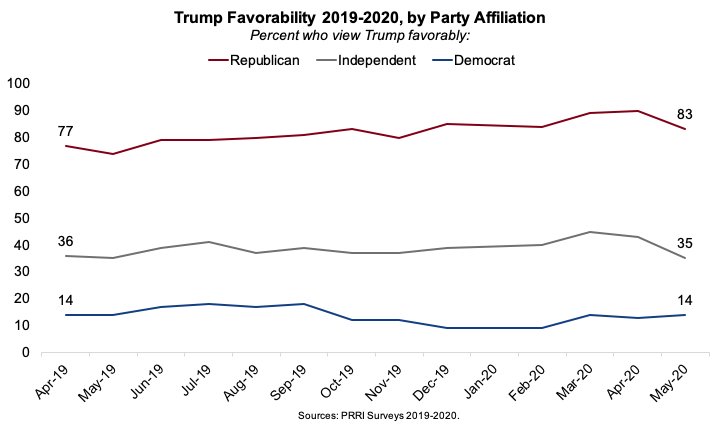
Party
Currently, 83% of Republicans hold favorable views of Trump, down from 90% in April. This percentage is also lower than in March (89%), but slightly higher than 79% across 2019. Among independents, 35% hold a favorable view of Trump, down from 43% in April and 45% in March, but similar to favorable views across 2019 (37%). Among Democrats, Trump’s favorability levels (14%) have remained fairly consistent since 2019 (15%).
Since the protests intensified later in the week — most notably after the night of May 28 when a police precinct was burned in Minneapolis where George Floyd was killed — we divide the analysis into two roughly equal time periods: before and on May 28 and after May 28 to see if the increasing protests produced significant effects in attitudes toward President Trump.
While there is no significant difference by date across the full survey, favorable views of Trump among Republicans declined significantly between the first (88%) and second half (79%) of the field period. The same is true for independents. While 40% of independents held favorable views of Trump during the first half of the survey, this percentage shrinks to 30% during the second half. Among Democrats, there are no notable differences in Trump’s favorability levels by date.
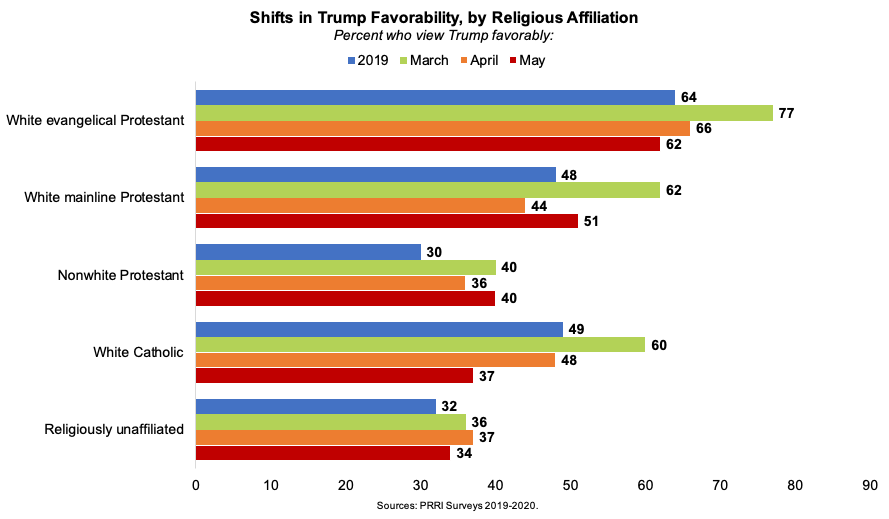
Religious Groups
After spiking upward in March 2020, Trump’s favorability ratings have retreated back to 2019 levels among most religious groups. Currently, more than six in ten (62%) white evangelical Protestants, about half (51%) of white mainline Protestants, and 34% of religiously unaffiliated Americans hold favorable views of Trump. These groups are essentially unchanged in their views of Trump since April.
White Catholics and nonwhite Protestants show the largest changes in attitudes toward the president. Currently, 37% of white Catholics hold favorable views of Trump, a significant drop from 49% across 2019, and a substantial downward trend from a high of 60% in March and 48% in April. By contrast, 40% of nonwhite Protestants hold favorable views of Trump, which is mostly steady since March 2020 but a significant increase from 30% across 2019.
Among all white Christians, a majority (52%) hold favorable views of Trump, which is unchanged since April, but there are differences by date of the May survey. Between the first and second halves of the survey field period, Trump’s favorability levels declined from 57% to 46% among white Christians.
Race, Gender, Age, and Education
As in April, a wide gender gap persists, with men much more likely than women to hold favorable views of Trump (50% vs. 34%).
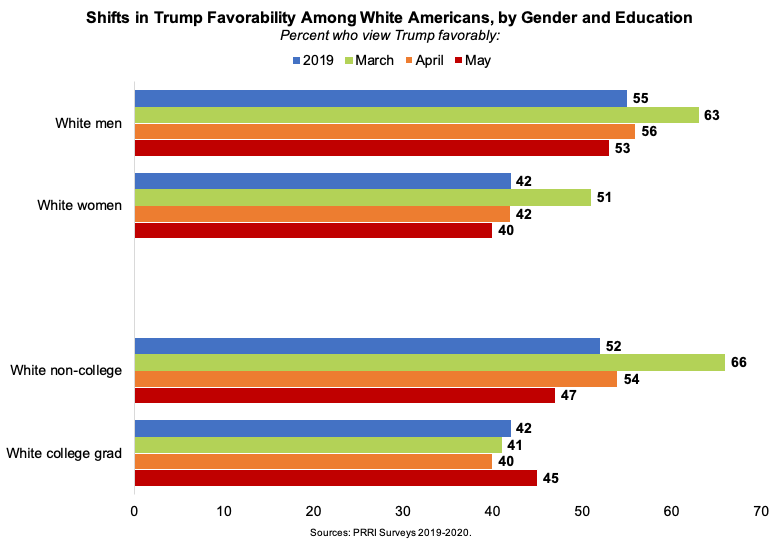
Among white Americans, Trump’s favorability levels also remain virtually the same (46% in May and 48% in April). The same is true among white men (53% in May and 56% in April) and white women (40% in May and 42% in April), although white men were slightly more likely to hold favorable views of the president in the early part of the week (59%) than the later part (48%). Hispanic Americans’ opinion of the president is also steady (41% favorable in May and 38% in April). However, there is a decrease among black Americans, from 26% in April to 19% in May.[2]
Among age cohorts, seniors (ages 65 and over) stand out as somewhat volatile. Trump favorability among seniors dropped from 56% in March to 42% in April but went back up to 50%
in May. Notably, however, favorable views of the president among seniors started out stronger (58%) early in the week and fell to 41% in the latter half of the survey.
Among white Americans without a four-year college degree, views of Trump have continued a downward trend. The proportion who hold favorable views of the president decreased to 47% from 54% in April and 66% in March. Among white Americans with a college degree, there is a slight but not significant increase to 45% favorable from 40% in April. College-educated white Americans were more enthusiastic about Trump earlier in the week (49% favorable) than later in the week (39% favorable).
Battleground States
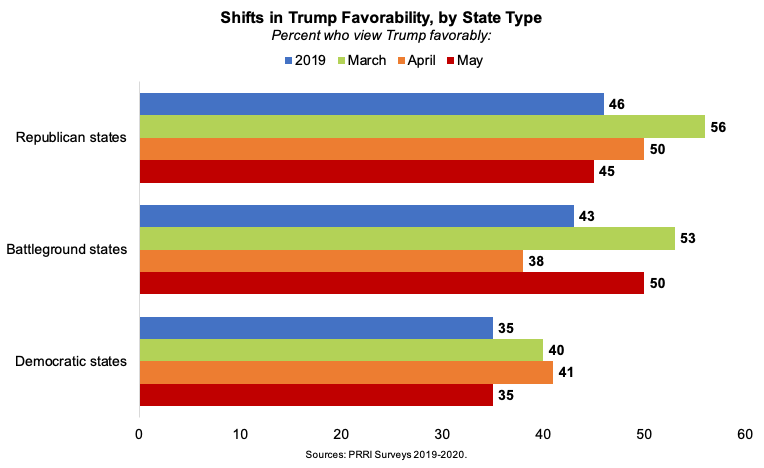
Among Americans living in battleground states, attitudes toward Trump have also been somewhat volatile. Half (50%) of those living in battleground states hold favorable views of Trump, up from 38% in April and nearly the same as 53% in March. This percentage is a significant increase of 7 percentage points from the 2019 average (43%). A little over one-third (35%) of Americans in Democratic and Democratic-leaning states hold favorable views of Trump, while 45% of Americans in Republican and Republican-leaning states hold the same views. These numbers are a retreat back to the 2019 average after increases in favorable views of Trump in both Democratic and Republican states in March and April.[3]
Survey Methodology and Footnotes
Methodology: The survey was designed and conducted by PRRI. Results of the survey are based on bilingual (Spanish and English) RDD telephone interviews conducted between May 26 and May 31, 2020, by professional interviewers under the direction of SSRS. Interviews were conducted among a random sample of 1,003 adults 18 years of age or older living in the United States (699 respondents were interviewed on a cell phone). The margin of error for the survey is +/- 3.5 percentage points at the 95% level of confidence, which includes the design effect for the survey of 1.3.
[1]Coronavirus data comes from the Centers for Disease Control and Prevention (CDC). Cases include both confirmed and presumptive positive cases of COVID-19 reported to CDC or tested at CDC, with the exception of testing results for persons repatriated to the United States from Wuhan, China and Japan. https://www.cdc.gov/covid-data-tracker/index.html
[2]Results should be interpreted with caution as sample size among black Americans is n=79 for April.
[3]Battleground states are Arizona, Florida, Michigan, North Carolina, Pennsylvania, and Wisconsin. These states are listed in the “Toss-up” category by Cook Political Report, as of March 9th. https://cookpolitical.com/sites/default/files/2020-03/EC%20030920.4.pdf


