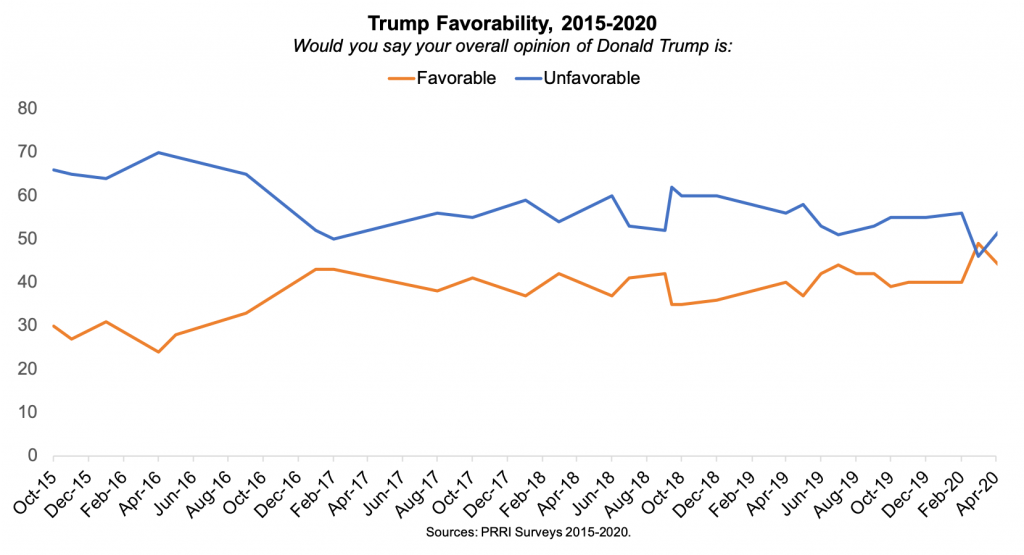
New data from PRRI shows that President Donald Trump’s favorability rating has dropped seven points over the last four weeks. Today, just over four in ten (43%) Americans hold mostly or very favorable views of Trump, compared to a 54% majority who hold mostly or very unfavorable views of him. In mid-March, Trump’s favorable rating was 49%, the highest at any point since 2015, and the first time in PRRI polling that Americans have been more likely to say they have a favorable than the unfavorable view (46%).
Trump benefited from a brief “rally around the flag” effect as the coronavirus pandemic began to spread in the U.S. But over the last four weeks — as the total number of reported U.S. cases of the coronavirus increased exponentially from around 33,000 cases to more than 900,000 cases — this boost has rapidly dissipated.[1]Trump’s current favorability rating (43%) is similar to the 40% of Americans who held favorable views of him in February shortly after he was acquitted of impeachment charges, and the 41% of Americans who held favorable views of him between March and December 2019.
As part of our analysis, PRRI analyzed Trump favorability in relationship to the per capita incidences of COVID-19 cases at the county level.[2]Generally speaking there is an inverse relationship between the rates of COVID-19 cases and holding favorable views of Trump. Americans who live in counties with higher rates of COVID-19 cases (more than the median number of cases per capita) are less likely than those who live in counties with lower rates (fewer than the median number of cases per capita) to hold a favorable view of Trump (42% vs. 52%).
Notably, the proportion of Americans living in counties above the median (83%) is much higher than the proportion of Americans living in less-affected counties (17%). Counties above the median are also more likely than those below the median to be urban (41% vs. 21%) or suburban (48% vs. 32%), and less likely to be rural (12% vs. 47%). There are also more Democrats in the more affected counties (37% vs. 28%) and fewer Republicans (22% vs. 32%). The proportion of independents remains stable across areas, with 38% in more affected counties and 37% in less affected counties.
Party
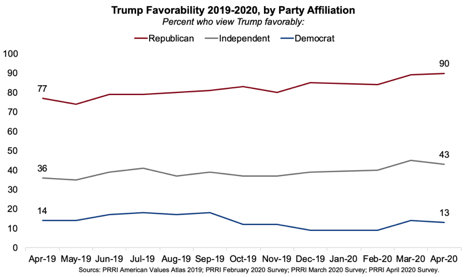
Currently, 90% of Republicans hold favorable views of Trump, up from 79% in 2019 and nearly identical to March 2020 (89%). Among independents, 43% hold a favorable view of Trump, up from 37% in 2019 and largely unchanged from March (45%). Among Democrats, Trump’s favorability levels (13%) have remained fairly consistent since 2019 (15%).
Trump’s favorability levels are not significantly different within partisan groups based on the number of coronavirus cases per capita. In counties with the top 50% of coronavirus cases, Trump’s favorability ratings by party are similar to the national rating by party, with 92% of Republicans, 42% of independents, and 12% of Democrats holding favorable views of Trump.
Religious Groups
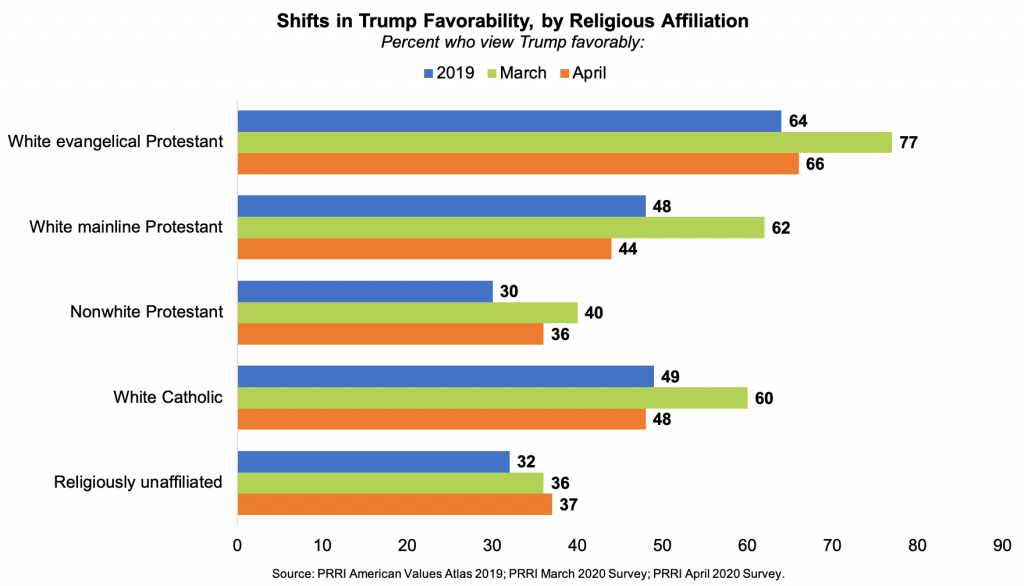
Trump’s favorability ratings have retreated back to 2019 levels among most demographic groups, with a few exceptions. Currently, two-thirds (66%) of white evangelical Protestants, nearly half (48%) of white Catholics, and 44% of white mainline Protestants hold a favorable view of Trump, a significant decline from their March 2020 ratings (77%, 60%, and 62%, respectively). Among nonwhite Protestants, Trump’s favorability ratings have not significantly changed (from 40% in March to 36% in April 2020).[3] The same is true for religiously unaffiliated Americans. Nearly four in ten (37%) religiously unaffiliated Americans express favorable views of Trump, and these numbers have not changed notably since 2019.
Among all white Christians, there is a divide based on living in counties below or above the median number of coronavirus cases. White Christians in less affected counties are more likely than those in more affected counties to say they view Trump favorably (63% vs. 50%). There is no such difference among other religious groups.
Race, Gender, and Education
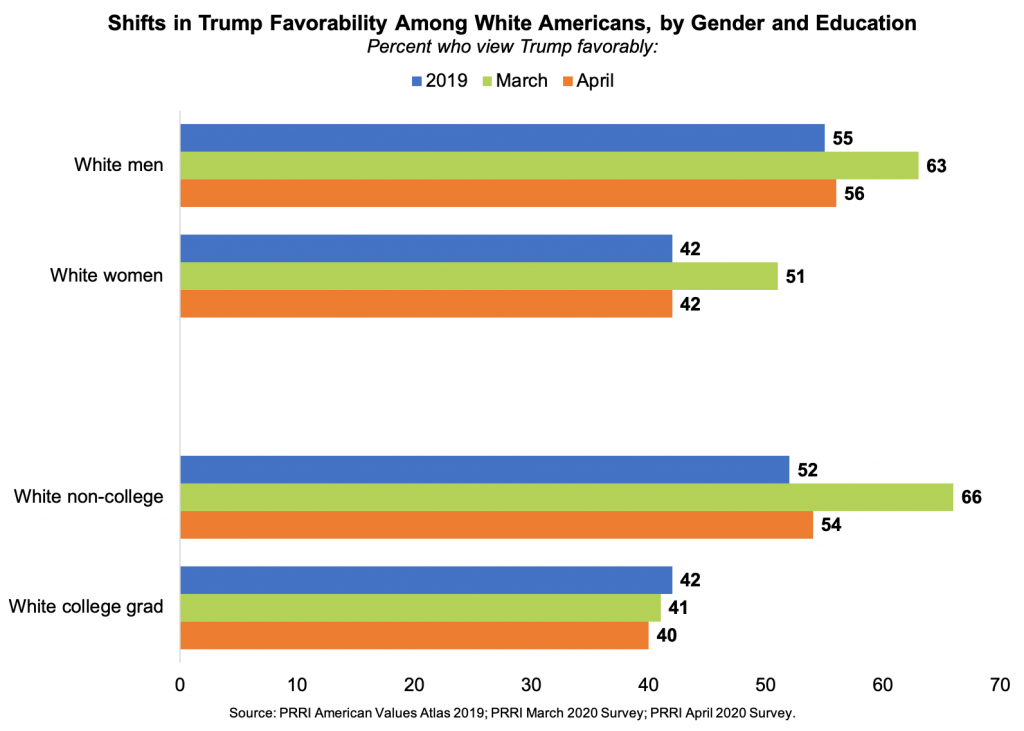
A wide gender gap persists, with men much more likely than women to hold favorable views of Trump (51% vs. 37%), a gap that remains largely unchanged since March. Also, while favorability levels did not decline significantly among white men (63% in March to 56% in April), the decline is significant among white women, from 51% in March to 42% in April.
Trump’s favorability has decreased since March 2020 among white Americans but has held steady among Hispanic and black Americans.[4]Nearly half (48%) of white Americans hold favorable views of Trump, a drop from a March high of 56%. Fewer than four in ten (38%) Hispanic Americans and just over one in four (26%) black Americans hold favorable views of Trump, compared to 39% and 29%, respectively, in March.
Favorable views of Trump have declined substantially among white Americans without a four-year college degree (54%) since March (66%). White Americans with a college degree are less likely to hold favorable views of Trump (40%), but this group did not see a spike in favorability in March (41%).
Trump’s favorability levels among white Americans are higher in counties at the bottom 50% of coronavirus cases compared to counties with the top 50% of coronavirus cases (55% vs. 47%), but this difference is not statistically significant.
Age
Among age cohorts, seniors (ages 65 and over) stand out. Trump favorability among seniors has declined from 56% in March to 42% in April. Changes between March and April numbers for those ages 18-29, 30-49, and 50-64 are not statistically significant.
Battleground States
Trump’s favorability in battleground states has dropped substantially since March, from 53% to 38%.[5]The president’s favorability in Democratic-leaning and Republican-leaning states has not significantly changed. About four in ten Americans in Democratic-leaning states hold favorable views of Trump now (41%) and in March (40%), although this is a notable improvement for Trump in these states compared to 2019 (35%). Half (50%) of Americans in Republican and Republican-leaning states view Trump favorably, a marginal drop from 56% in March and a slight increase from 2019 (46%), although the differences are not statistically significant.
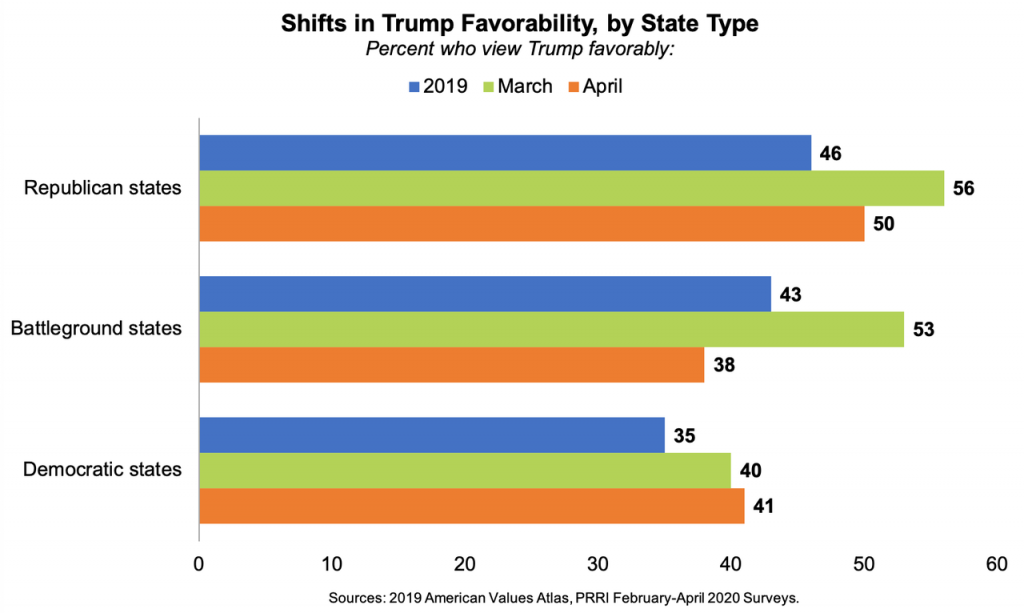
In areas with higher numbers of COVID-19 cases per capita, about half (49%) of Americans in Republican-leaning states view Trump favorably compared to about four in ten Americans in Democratic-leaning (40%) and battleground (36%) states. For all three types of states, Trump’s favorability in these counties with higher counts of COVID-19 cases closely resembles his favorability overall.
Trump’s favorability among non-college graduates in battleground states has dropped 20 percentage points between March and April (59% to 39%), putting it more in line with his favorability in 2019 (45%). College graduates in battleground states are just as likely to view Trump favorably (39%) as they were in 2019 (39%).[6]
Trump’s favorability among both men and women in battleground states has declined since March. Trump favorability among men has decreased from a majority (55%) in March to 43% in April, while Trump favorability among women has declined from half (50%) in March to 35% in April. Both men and women in battleground states closely resemble their views toward Trump from 2019 (48% and 37%).
Trump’s favorability among white Christians in battleground states (48%) has dropped by almost 30 percentage points since March (75%), putting it more in line with his favorability in 2019 (55%). There are no significant shifts among Americans living in battleground states who are not white Christians.
Largest Declines in Favorability Among Trump Base Groups
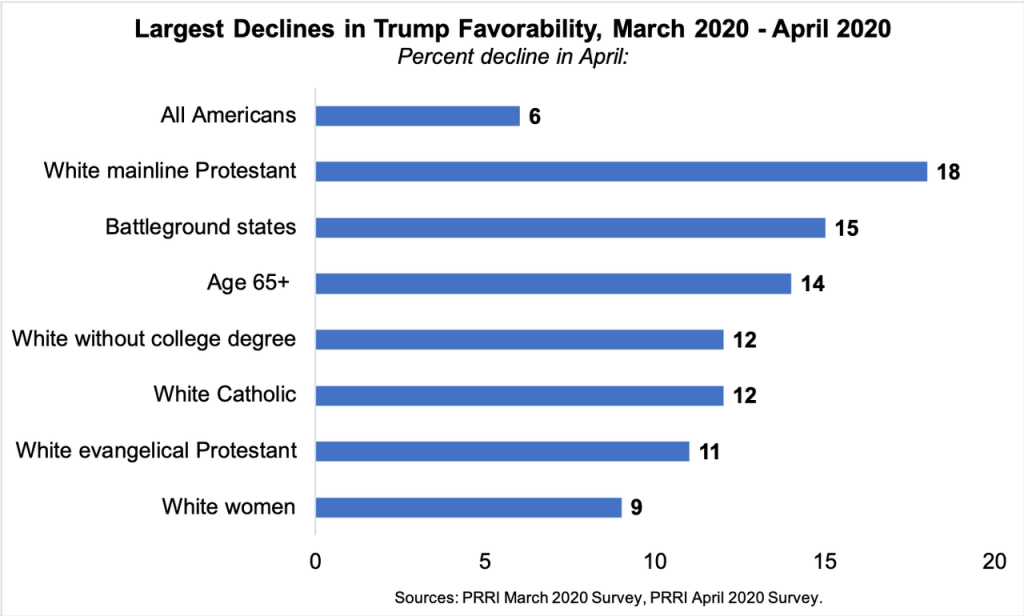
Trump’s favorability declined by six percentage points between March and April, from 49% to 43%. The decline was not uniform across demographics, and the largest declines were among some of Trump’s key base groups. These include white Christian groups, specifically white mainline Protestants (-18 percentage points), white Catholics (-12 percentage points), and white evangelical Protestants (-11 percentage points). Large declines are also evident among those living in battleground states (-15 percentage points), those age 65 and over (-14 percentage points), white Americans without a college degree (-12 percentage points), and white women (-9 percentage points).
Survey Methodology
The survey was designed and conducted by PRRI. Results of the survey are based on bilingual (Spanish and English) RDD telephone interviews conducted between April 21 and April 26, 2020, by professional interviewers under the direction of SSRS. Interviews were conducted among a random sample of 1,008 adults 18 years of age or older living in the United States (704 respondents were interviewed on a cell phone). The margin of error for the survey is +/- 3.5 percentage points at the 95% level of confidence, which includes the design effect for the survey of 1.3.
Citations
[1]Coronavirus data comes from the Centers for Disease Control and Prevention (CDC). Cases include both confirmed and presumptive positive cases of COVID-19 reported to CDC or tested at CDC, with the exception of testing results for persons repatriated to the United States from Wuhan, China and Japan. https://www.cdc.gov/coronavirus/2019-ncov/cases-updates/previouscases.html
[2]National county-level data suggests that as of April 15th, the median number of confirmed cases per capita was 32 per 10,000 residents, with a range from 0 to 2,558 cases per capita. County-level data from The New York Times, compiled by Jed Kolko: http://jedkolko.com/2020/04/15/where-covid19-death-rates-are-highest/
[3]The sample size for nonwhite Protestants is n=99.
[4] Sample size among black Americans is less than 100 (n=92 for March and n=79 for April); results should be interpreted with some caution.
[5]Battleground states are Arizona, Florida, Michigan, North Carolina, Pennsylvania, and Wisconsin. These states are listed in the “Toss-up” category by Cook Political Report, as of March 9th. https://cookpolitical.com/sites/default/files/2020-03/EC%20030920.4.pdf
[6]March favorability for college graduates in battleground states is not included due to small sample size.