

As Coronavirus Pandemic Spreads, President Trump’s Favorability Increases
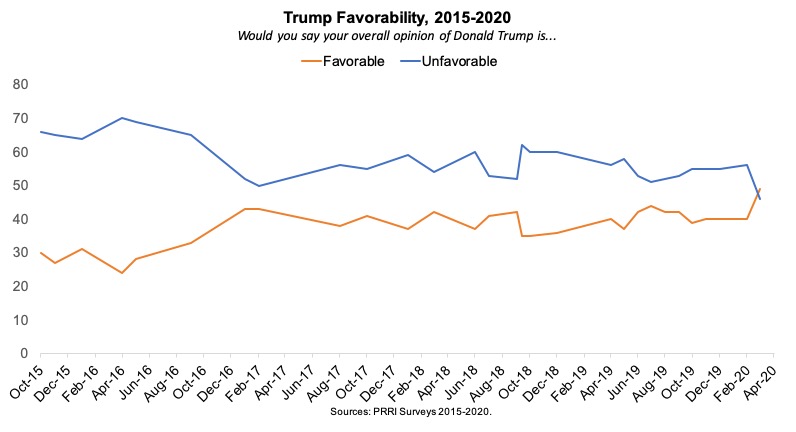
New data from PRRI shows that amidst the major shifts in public life due to the coronavirus pandemic, Americans are more likely to view President Donald Trump favorably than at any point since 2015. Nearly half (49%) of Americans say they hold favorable views of Trump, including 24% who say they have very favorable views. A similar 46% say they hold unfavorable views of the president. It is the first time in PRRI polling that Americans have been more likely to give Trump a net favorable rating as president, though the difference is within the margin of error.
The survey fielded from March 17 to 22, beginning four days after Trump declared a national emergency in response to the spreading virus. On March 17, there were around 7,000 reported U.S. cases of coronavirus, and by March 22, the number of cases had increased to more than 33,000.[1] During the same period, many state and local governments issued a range of instructions to close non-essential businesses and encourage telecommuting, and some areas instituted “shelter in place” orders.
Amid these dramatic changes to American life, there appears to be evidence for a moderate “rally around the flag” effect for Trump. His favorability numbers are up nine points (from 40% in February to the current 49%), and the proportion viewing him unfavorably has decreased ten points (from 56% to 46%). PRRI will continue tracking Trump’s favorability ratings with regular releases through Election Day and the end of 2020.
Partisan Trends Remain Stable with Small Upticks
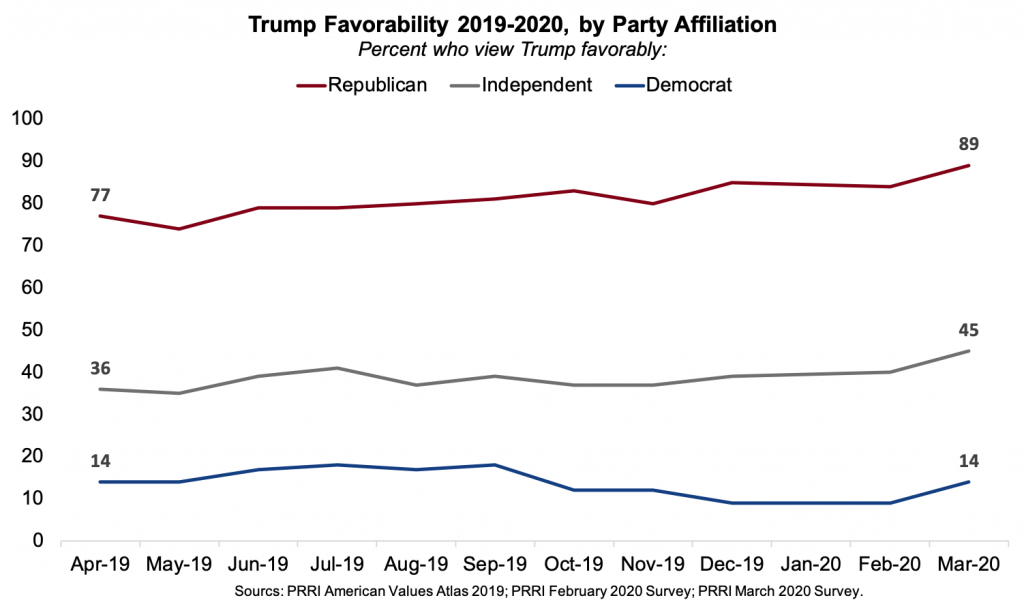
Trump’s favorability has improved by 5 percentage points since February in every partisan group, but the differences are not statistically significant. Currently, 89% of Republicans hold favorable views of Trump, up from 84% in February and higher than at any point in the past year. The same is true of independents (up from 40% to 45%) and Democrats (up from 9% to 14%). Notably, respondents who claimed affiliation with some other party or refused the question (7% of the sample), jumped 28 points, from 30% to 58%.[2]
Demographic Changes Largest Among Trump’s Base Groups
Trump’s favorability ratings have risen among most demographic groups, but the largest increases are among white subgroups: white Christians, white men, and white Americans without college degrees. More than six in ten members of these groups hold favorable views of Trump, and all have become more likely to express favorable views of him since February.
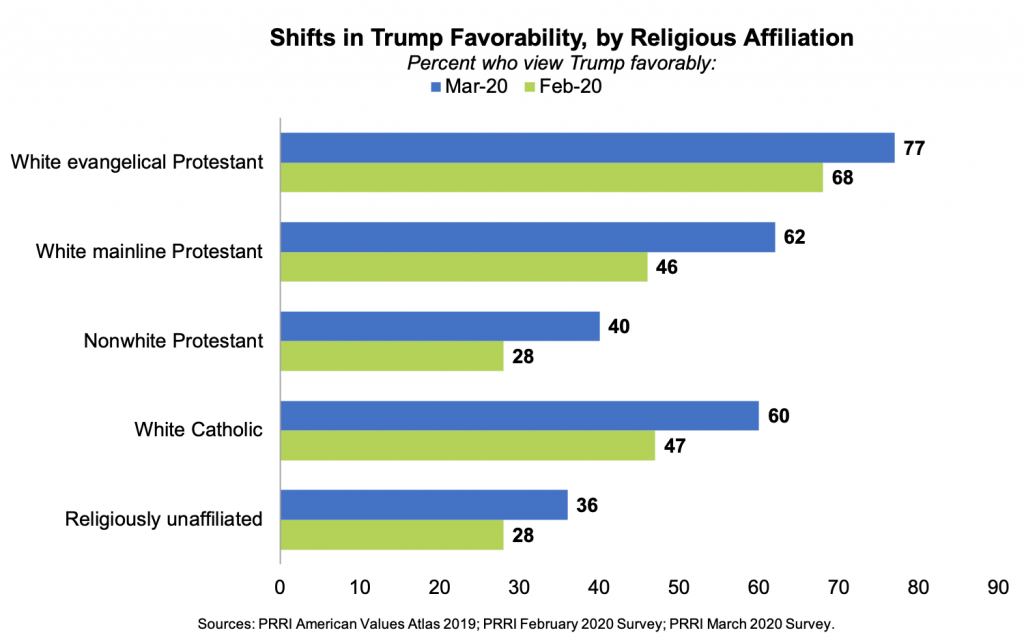
Trump’s favorability ratings among white Christian groups are at or near their peaks since 2015. The president’s strongest numbers among religious groups continue to come from white evangelical Protestants, among whom 77% now hold a favorable view of Trump. This matches their previous high of 77% in June 2018, though it is not a statistically significant change from February (68%). Favorability among white mainline Protestants has grown to more than six in ten (62%), the highest level since PRRI started tracking Trump’s favorability in 2015, and the first time a majority of this group has held favorable views of Trump since July 2018. Six in ten (60%) white Catholics hold favorable views of Trump, similar to their previous high of 57% in August 2019. Around four in ten nonwhite Protestants (40%), and just over one-third (36%) of religiously unaffiliated Americans express favorable views of Trump, and these numbers have not changed significantly since February.
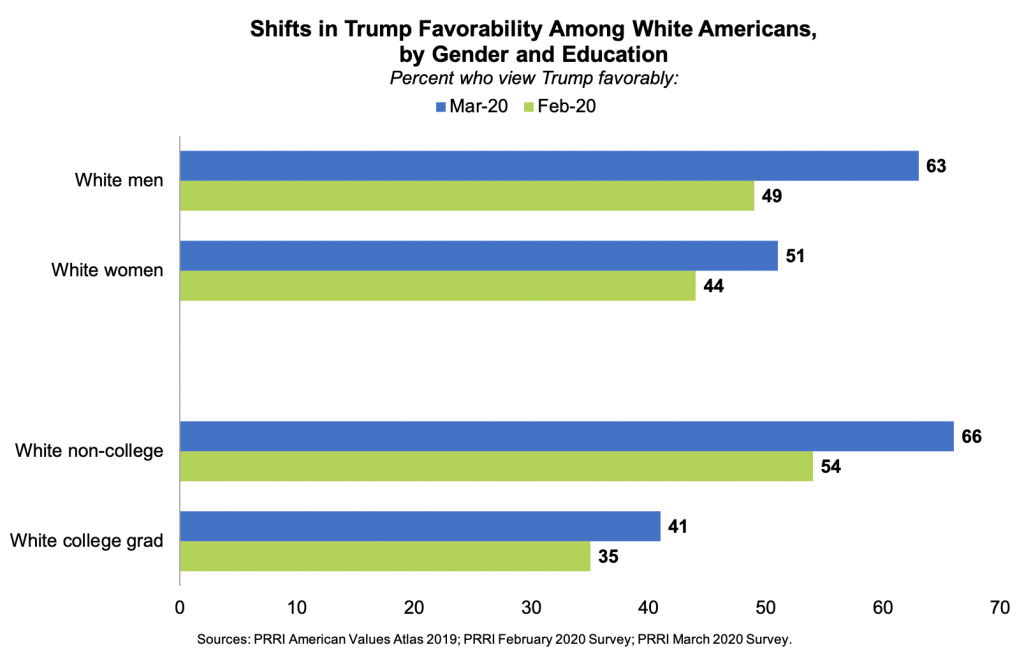
A wide gender gap persists, with men much more likely than women to hold favorable views of Trump (54% vs. 43%). Current favorability levels represent about a seven-point increase for both groups, from 46% of men and 36% of women in February. More than six in ten (63%) white men and a slim majority (51%) of white women hold favorable views of Trump. Favorability among white men has increased 14 points from February (49%), and seven points among white women (previously 44%).
Trump’s favorability has increased since February among white Americans but is statistically similar among Hispanic and black Americans.[3] A majority (56%) of white Americans hold favorable views of Trump, slightly above than the previous high of 53% in March 2018. There are substantial education gaps among white Americans. White Americans without a four-year college degree are much more likely than those who have a four-year degree or more to hold favorable views of Trump (66% versus 41%). Fewer than four in ten (39%) Hispanic Americans and three in ten (29%) black Americans hold favorable views of Trump.
Older Americans are more likely than younger Americans to hold more favorable views of Trump. Majorities of senior Americans over age 65 (56%) and those 50-64 (54%) hold favorable views of Trump. That drops to 42% of young Americans under age 30 and 45% of those ages 30 to 49. All age groups show increased favorable views of Trump since February, with the largest increases among those 18-29 (30% to 42%) and 65 and older (45% to 56%). Smaller increases have occurred among those 30-49 (37% to 45%) and 50-64 (49% to 54%).
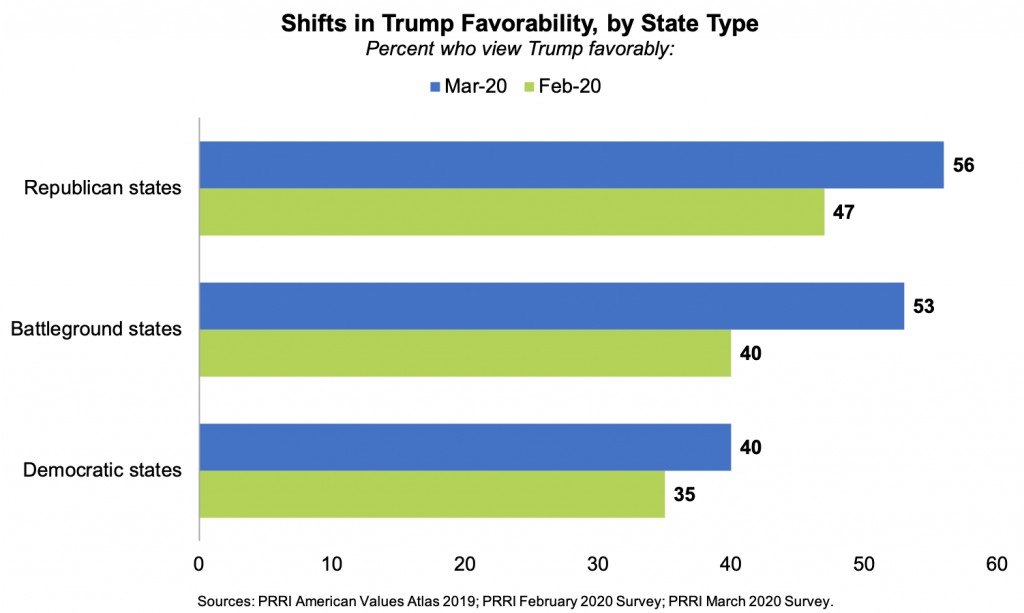
Trump Favorability Up Substantially in Battleground States
Americans in 2020 battleground states are about as likely as Americans in Republican or Republican-leaning states to hold favorable views of Trump.[4] Notably, Trump favorability among residents of battleground states has jumped 13 points since February, from 40% to 53%. A similar majority (56%) of Americans in Republican-leaning states hold favorable views of Trump, an increase from 47% in February. Americans in Democratic-leaning states rate Trump marginally more favorably now (40%) than in February (35%).
Trump’s favorability among Americans who live in urban areas (44%) has increased significantly since February (32%). Trump’s favorability as also increased among suburban (41% to 48%) and rural residents (52% to 59%), although these shifts are not statistically significant.
Survey Methodology
Survey Methodology
The survey was designed and conducted by PRRI. Results of the survey are based on bilingual (Spanish and English) RDD telephone interviews conducted between March 17 and March 22, 2020, by professional interviewers under the direction of SSRS. Interviews were conducted among a random sample of 1,008 adults 18 years of age or older living in the United States (703 respondents were interviewed on a cell phone). The margin of error for the survey is +/- 3.5 percentage points at the 95% level of confidence, which includes the design effect for the survey of 1.3.
Citation
[1]Coronavirus data comes from the Centers for Disease Control and Prevention (CDC). Cases include both confirmed and presumptive positive cases of COVID-19 reported to CDC or tested at CDC, with the exception of testing results for persons repatriated to the United States from Wuhan, China and Japan. https://www.cdc.gov/coronavirus/2019-ncov/cases-updates/cases-in-us.html
[2] The other/refused group is very small: In February this group had a sample size of 32 and in March a sample size of 50. Interpret results with caution.
[3] Sample size among black Americans is less than 100 (n=92 for March and n=72 for February); results should be interpreted with some caution.
[4]Battleground states are Arizona, Florida, Michigan, North Carolina, Pennsylvania, and Wisconsin. These states are listed in the “Toss-up” category by Cook Political Report, as of March 9th. https://cookpolitical.com/sites/default/files/2020-03/EC%20030920.4.pdf


