Americans’ Views of Donald Trump Throughout 2019
More Americans viewed President Donald Trump unfavorably (55%) than favorably (41%) throughout most of the 2019 calendar year. In a series of surveys conducted weekly from late March through December, totaling more than 40,000 interviews, Trump’s overall favorability rating ranged between 46% and 33%. The proportion of Americans with unfavorable views of the president remains in a similarly small range, from a low of 49% to a high of 62%.
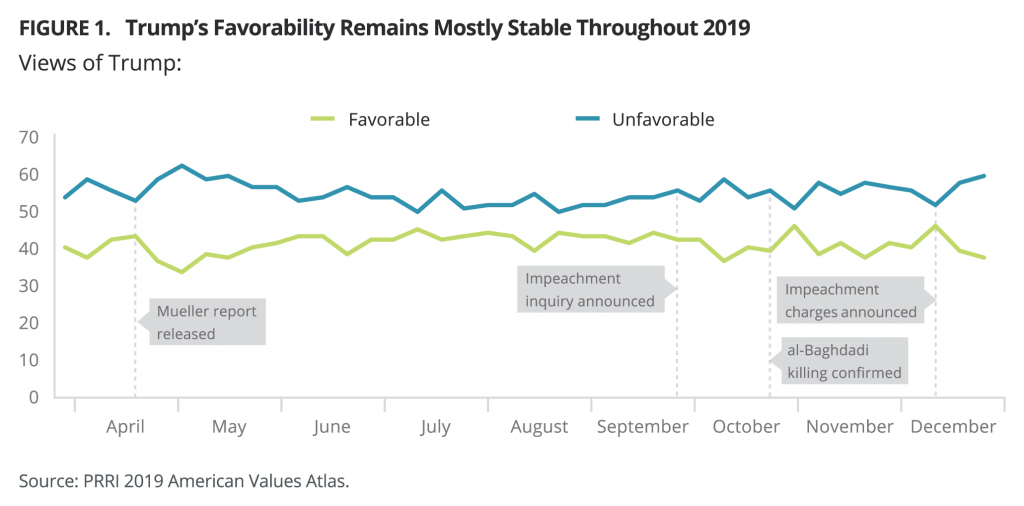
The low point for Trump’s favorability occurred in the first half of 2019. The president’s favorability rating began a downward shift in mid-April, culminating in a low of 33% favorable (and the unfavorable high of 62%) the week of April 30. This drop-off in favorability coincided with the long-awaited completion and release of former Special Counsel Robert Mueller’s report on the investigation into the Trump campaign’s alleged collusion with Russia to influence the 2016 election. An initial summary from Attorney General William Barr was released on March 24, and the redacted report was released on April 18. Trump’s favorability rebounded over the course of May, likely as news about the Mueller report faded.
Notably, Trump’s highest favorability ratings among all Americans come much later in the year, after the announcement of the impeachment inquiry. His favorability reached 46% the week of October 29, amid impeachment inquiry hearings, but also immediately after the October 27 confirmation that a U.S. operation had resulted in the death of ISIS leader Abu Bakr al-Baghdadi. The spike was short-lived, and Trump’s favorability rating returned to around 40% throughout November.
Another spike up to 46% favorability occurred the week of December 10. This increase appears to be a show of support for Trump by Republicans opposed to the articles of impeachment released by the U.S. House of Representatives that same week. This bump in favorability was also short-lived and Trump ended the year with a favorability rating of 37% at the end of December.
With the exception of these few variations in Trump’s favorability rating, Americans’ views of the president have been remarkably stable, perhaps the defining feature of the Trump presidency. Despite, or perhaps because of, an almost daily onslaught of controversial actions and pronouncements throughout 2019, very few appear to have meaningful effects on his favorability.
Republican Support Doesn’t Waver, Nor Does Democrat Opposition
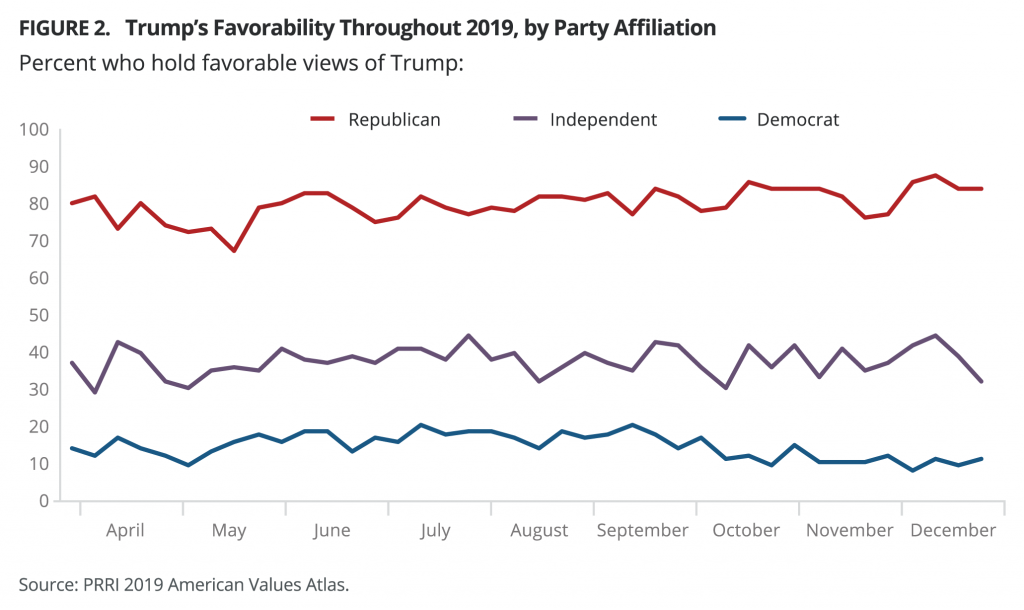
Trump has firm support from his own party. Just under eight in ten (79%) Republicans view him favorably across the year, and the low point is a brief dip to 67% in early May, coinciding with the Mueller report release and its news dominance. Favorability among Republicans immediately rebounds to around the 80% mark and remains there until a brief spike to the upper 80s in mid-December when the impeachment charges were released.
By contrast, the president only garnered the favor of 15% of Democrats throughout the year. During the summer of 2019, Trump’s favorability among Democrats hovered just below 20% before dipping down to around the 10% level once the impeachment inquiry began.
Among independents, Trump’s favorability averaged 37% during 2019, but their views showed more variability than their partisan counterparts. The proportion of independents who view Trump favorably wobbled between 30% and 45%, with a dip coinciding with the Mueller report controversy in late April and early May, and clear downturns around the time the impeachment inquiry was announced in late September and again when the impeachment charges were announced in December.
White Christians Boost Trump’s Favorability Numbers
Among religious affiliations, Trump’s strongest support comes mostly from adherents to white Christian traditions. Majorities, or near majorities, of white evangelical Protestants (64%), Mormons (55%), white Catholics (49%), white mainline Protestants (48%), and Orthodox Christians (48%) rate the president favorably.[1]
By contrast, among nonwhite Christian groups, just over one-third (37%) of Hispanic Protestants, one in four (25%) Hispanic Catholics, and fewer than one in five (18%) black Protestants report holding favorable views of the president. Additionally, only 26% of Jehovah’s Witnesses view Trump favorably.
Among non-Christian traditions, around one-third adherents of not listed religions (36%), Hindus (35%), Jews (34%), and Muslims (33%) hold favorable views of Trump. Fewer Buddhists (28%) and Unitarian Universalists (21%) view the president favorably.[2] Among the religiously unaffiliated, 32% say they have a favorable view of Trump.
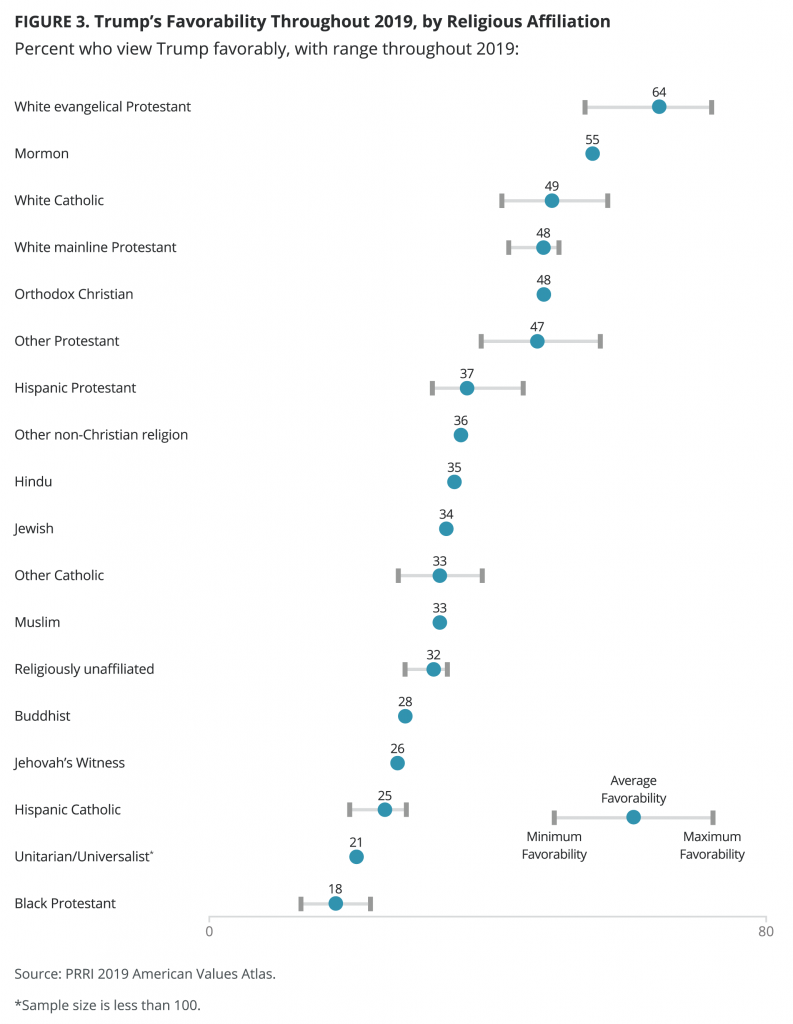
As with the overall numbers and party affiliation, Trump’s favorability did not change much throughout the year within religious groups. He maintained a majority of white evangelical Protestants’ support all year, and his favorability among other white Christian groups did not drop below 40% at any point. By contrast, Trump’s favorability peaked at 23% among black Protestants and rarely reached 40% among the unaffiliated group, as well as most nonwhite and non-Christian religious groups.
Trump’s Base
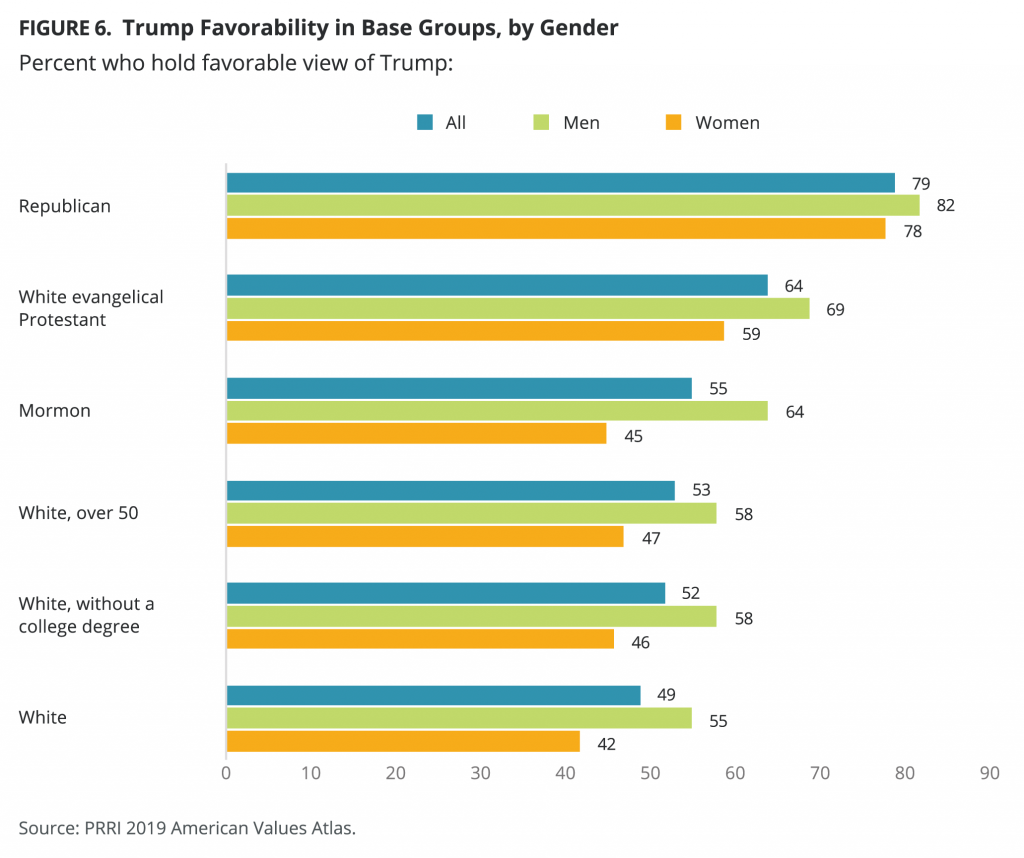
Trump’s favorability remains high across a range of Republican demographic subgroups, including those least likely to support the president. Large majorities of Republican women (78%), Republican college graduates (78%), religiously unaffiliated Republicans (76%), young Republicans ages 18-29 (75%), Hispanic Republicans (71%), and black Republicans (62%) hold favorable views of the president.
Beyond Republicans, the only groups in which a majority view Trump favorably are various white subgroups: White evangelical Protestants, Mormons, white men, white Americans without college degrees, and older white Americans (those age 50 and over).
White Evangelical Protestants
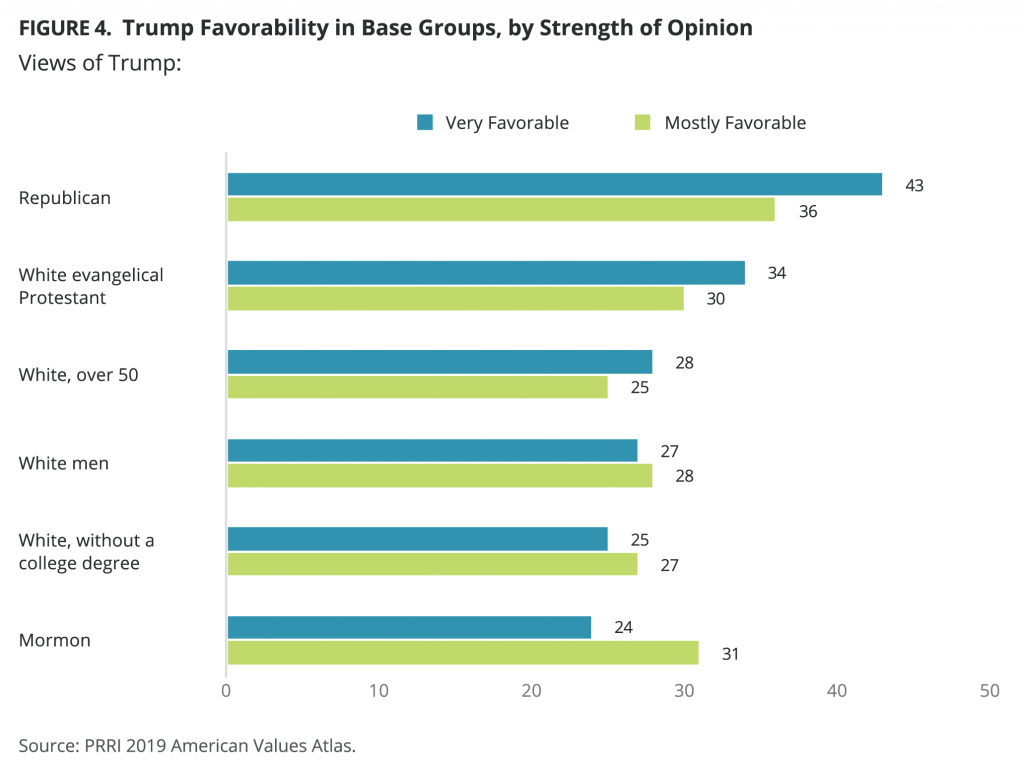
White evangelical Protestants make up 15% of the total population. They are among Trump’s strongest supporters, with the highest favorability ratings of Trump of any major non-political demographic group. On average, nearly two-thirds (64%) of white evangelical Protestants have a favorable view of Trump across 2019, including one-third (34%) who say they are very favorable toward him.
Trump’s favorability ratings among white evangelical Protestants increased over the course of 2019. Fewer than six in ten white evangelical Protestants view him favorably during the months of April (56%) and May (54%), corresponding with lower overall favorable ratings for the president in those months, likely related to the Mueller report.[3] Trump’s favorability ratings rose to about two-thirds of white evangelical Protestants for the rest of 2019, with a peak in September (72%). Unlike many other groups, Trump’s favorability among white evangelical Protestants did not decline after the announcement of the impeachment inquiry and subsequent impeachment charges.
White evangelical Protestant Republicans are much more likely than white evangelical Protestant independents or Democrats to rate Trump favorably. Among white evangelical Protestants, almost nine in ten (88%) Republicans rate Trump favorably, compared to a majority (56%) of independents. About one in four (23%) white evangelical Protestant Democrats rate Trump favorably; however, only 21% of white evangelical Protestants identify as Democrats.
Majorities of white evangelical Protestants view Trump favorably regardless of gender, age, education, marital status, or geographic region. White evangelical Protestant men (69%) are more likely than white evangelical Protestant women (59%) to say they have a favorable impression of the president. Trump’s favorability rises to about seven in ten among seniors ages 65 and older (70%) and middle-aged white evangelical Protestants ages 50-64 (68%). Fewer than six in ten white evangelical Protestants ages 18-29 (57%) and 30-49 (55%) have favorable views of the president.
Almost seven in ten (68%) white evangelical Protestants with a high school or less education view Trump favorably. Favorability drops to about six in ten among white evangelical Protestants with some college experience (60%), college graduates (61%), and those holding postgraduate degrees (63%).
Married or formerly married white evangelical Protestants are more likely than single white evangelical Protestants to say they are favorable to Trump. Almost two-thirds of married (65%), divorced (65%), and widowed (65%) white evangelical Protestants view Trump favorably. Among white evangelical Protestants, just under six in ten (59%) unmarried singles and a slim majority (51%) of singles living with partners hold a favorable view of Trump.
White evangelical Protestants living in the South (68%) and Midwest (63%) are more likely than white evangelical Protestants living in the West (58%) and Northeast (57%) to rate Trump favorably.
White evangelical Protestants are a critical part of Trump’s base leading up to the 2020 presidential election. Two-thirds (66%) say they will support Trump no matter who the Democratic candidate is, while about one in four (23%) say their vote will depend on which Democratic candidate becomes the nominee. More than eight in ten (82%) white evangelical Protestant Republicans and independent-leaning Republicans say they prefer having Trump as the Republican nominee as opposed to someone else. [4]
Additionally, white evangelical Protestants have consistently opposed impeaching and removing Trump from office. More than eight in ten opposed impeachment and removal both before and after the impeachment inquiry began in October 2019 (88% and 82%, respectively), though the difference is not significant.[5]
Mormons
Mormons make up 2% of the total population, and a majority (55%) view Trump favorably, including almost one in four (24%) who hold very favorable views.
Republican Mormons are much more likely to view Trump favorably than Mormons who identify as independent or Democrat. Among Mormons, about three in four (74%) Republicans, compared to 47% of independents and only 18% of Democrats, hold favorable views of Trump. A plurality of Mormons identify as Republican (44%), with 38% identifying as independent and only 14% identifying as Democrat.
Mormon men (64%) are much more likely than Mormon women (45%) to say they hold a favorable view of Trump. Additionally, Mormons ages 65 and older (62%) and ages 50-64 (67%) are more likely than Mormons ages 30-49 (52%) and ages 18-29 (45%) to hold favorable views of Trump. Six in ten (60%) Mormons with a college degree, compared to 53% of Mormons without a college degree, hold favorable views of Trump.
White Men
White men make up 30% of the population, and a majority (55%) view Trump favorably, including more than one in four (27%) who have very favorable views of him. Majorities of white men view Trump favorably throughout every month of 2019. Smaller majorities report favorable views of Trump in April (53%) and May (51%), coinciding with Trump’s lower overall favorability in those months likely related to the release of the Mueller report. His numbers among white men rise in the summer and early fall with highs in July (58%) and September (57%). Support among this group dips slightly in October (52%), perhaps in response to the beginning of the impeachment inquiry, before ending the year at 57%.
Republican white men are much more likely to view Trump favorably than white men who say they are independents or Democrats. Among white men, more than eight in ten (84%) Republicans, compared to half (50%) of independents and 21% of Democrats, view Trump favorably. A plurality of white men identify as Republican (37%), but a fair number identify as independent (34%) or Democrat (26%).
Support for Trump among white men is highest among those who are 65 or older (58%) and those ages 50-64 (59%). About half of white men ages 30-49 (52%) and ages 18-29 (48%) also have a favorable impression of the president.
Favorability toward Trump among white men declines with higher levels of educational attainment. Six in ten (60%) white men with high school or less education, and a majority (56%) of those with some college experience, view Trump favorably. Favorability drops to half (50%) among college graduates and 44% among white men with postgraduate degrees.
Majorities of white men across every major Christian religious tradition favor Trump. About two-thirds of white evangelical Protestant men (69%) and white Mormon men (65%) view the president favorably. Majorities of both white Catholic men (58%) and white mainline Protestant men (55%) also favor Trump. Support for Trump drops to less than half among non-Christian groups including the religiously unaffiliated white men (41%) and Jewish white men (33%).
A plurality of white men express a preference for Trump in the 2020 election. Just under four in ten (38%) say that they prefer Trump regardless of who becomes the Democratic nominee, while about three in ten say they prefer the Democratic nominee (31%) or that their preference will depend on who wins the Democratic primary (30%).[6] Three in four (75%) Republican and Republican leaning-independent white men say they prefer Trump to be the Republican nominee over another Republican. About six in ten white men say they oppose impeaching and removing Trump from office both before (63%) and after (59%) the impeachment inquiry began.[7]
White Americans Without a College Degree
White Americans without four-year college degrees, sometimes referred to as white working-class Americans, are another core component of Trump’s base. This group makes up 39% of the population and holds broadly favorably views of Trump. A majority (52%) of white Americans without a college degree view Trump favorably, while one in four (25%) hold very favorable views of him. Trump’s favorability ratings in this group dipped to just under half in April (49%) and May (48%) around the release of the Mueller report, but his numbers increased to a slim majority for the rest of the year with a high in July (56%) and no noticeable reaction to the impeachment proceedings.
White Republicans without a college degree are much more likely to rate Trump favorably than their independent and Democratic peers. About one-third of white Americans without a college degree identify as Republican (35%) or independent (33%), and 28% identify as Democrat. Among whites without a college degree, more than eight in ten (83%) Republicans view Trump favorably, compared to less than half (46%) of independents and just over one in five (22%) Democrats.
White men without a college degree (58%) are much more likely than white women without a degree (46%) to hold favorable views of Trump. White Americans without a college degree favor Trump across most age groups. Majorities of seniors ages 65 and older (55%), those ages 50-64 (57%), and those ages 30-49 (51%) support Trump. Notably, just over four in ten (42%) young white Americans without a college degree ages 18-29 hold favorable views of Trump.
More than four in ten (42%) white Americans without a college degree say they will vote for Trump regardless of who becomes the Democratic nominee. About one in four (24%) say they will vote for whoever wins the Democratic nomination, while one-third (33%) report that their vote will depend on who the Democratic nominee is.[8]
Clear majorities of white Americans without a college degree oppose impeaching and removing Trump from office. Just before the announcement of an impeachment inquiry, more than two-thirds (68%) opposed impeachment and removal, but after the beginning of impeachment proceedings, this opposition dropped to six in ten (61%). This change is driven by white women without a college degree, less than six in ten (58%) of whom opposed impeachment and removal down from seven in ten (70%) prior to the start of the impeachment inquiry. White men without a college degree did not move substantially (67% to 63%) in that period. [9]
White Americans Over Age 50
White Americans ages 50 and over make up just under one-third (31%) of the population, and most (53%) view Trump favorably. Trump’s favorability among older whites remained relatively static throughout the year, with no evident reaction to events that affected favorability ratings among other groups. Older whites show some divisions on Trump around gender, education, and party lines.
Older white Republicans are significantly more likely than independents or Democrats to hold favorable views of Trump. More than eight in ten (84%) older white Republicans view Trump favorably. Trump’s favorability drops to less than half (48%) among older white independents and about one in ten (14%) among older white Democrats. A plurality of older whites are Republicans (38%), while about three in ten identify as independents (30%) or Democrats (28%).
White men over 50 are more likely than white women over 50 to say they are favorable toward Trump. Almost six in ten (58%) older white men compared to less than half (47%) of older white women say they favor Trump. Majorities of older whites with a high school degree or less (58%) or some college experience (54%) view Trump favorably. Just under half (49%) of older white college graduates and only 40% of postgraduates hold a favorable view of Trump.
About two-thirds of older white evangelical Protestants (68%) and Mormons (65%) view Trump positively, as do about half of older white Catholics (51%) and white mainline Protestants (48%). Trump’s favorability drops to just over one-third (36%) among religiously unaffiliated older whites and to less than three in ten (28%) among older white Jews.
Compared to other segments of Trump’s base, older whites appear to be less reliable Trump supporters in the 2020 election. Just over four in ten (41%) say they would prefer Trump over the Democratic candidate, while about one-third (34%) say they would support whoever becomes the Democratic nominee. Less than one in four (23%) older whites say their preference will depend on who becomes the nominee.[10] Six in ten (61%) older whites report that they would oppose impeaching and removing Trump from office after the impeachment inquiry was announced.[11]
What are the Strongest Predictors of Holding Favorable Views of Trump?
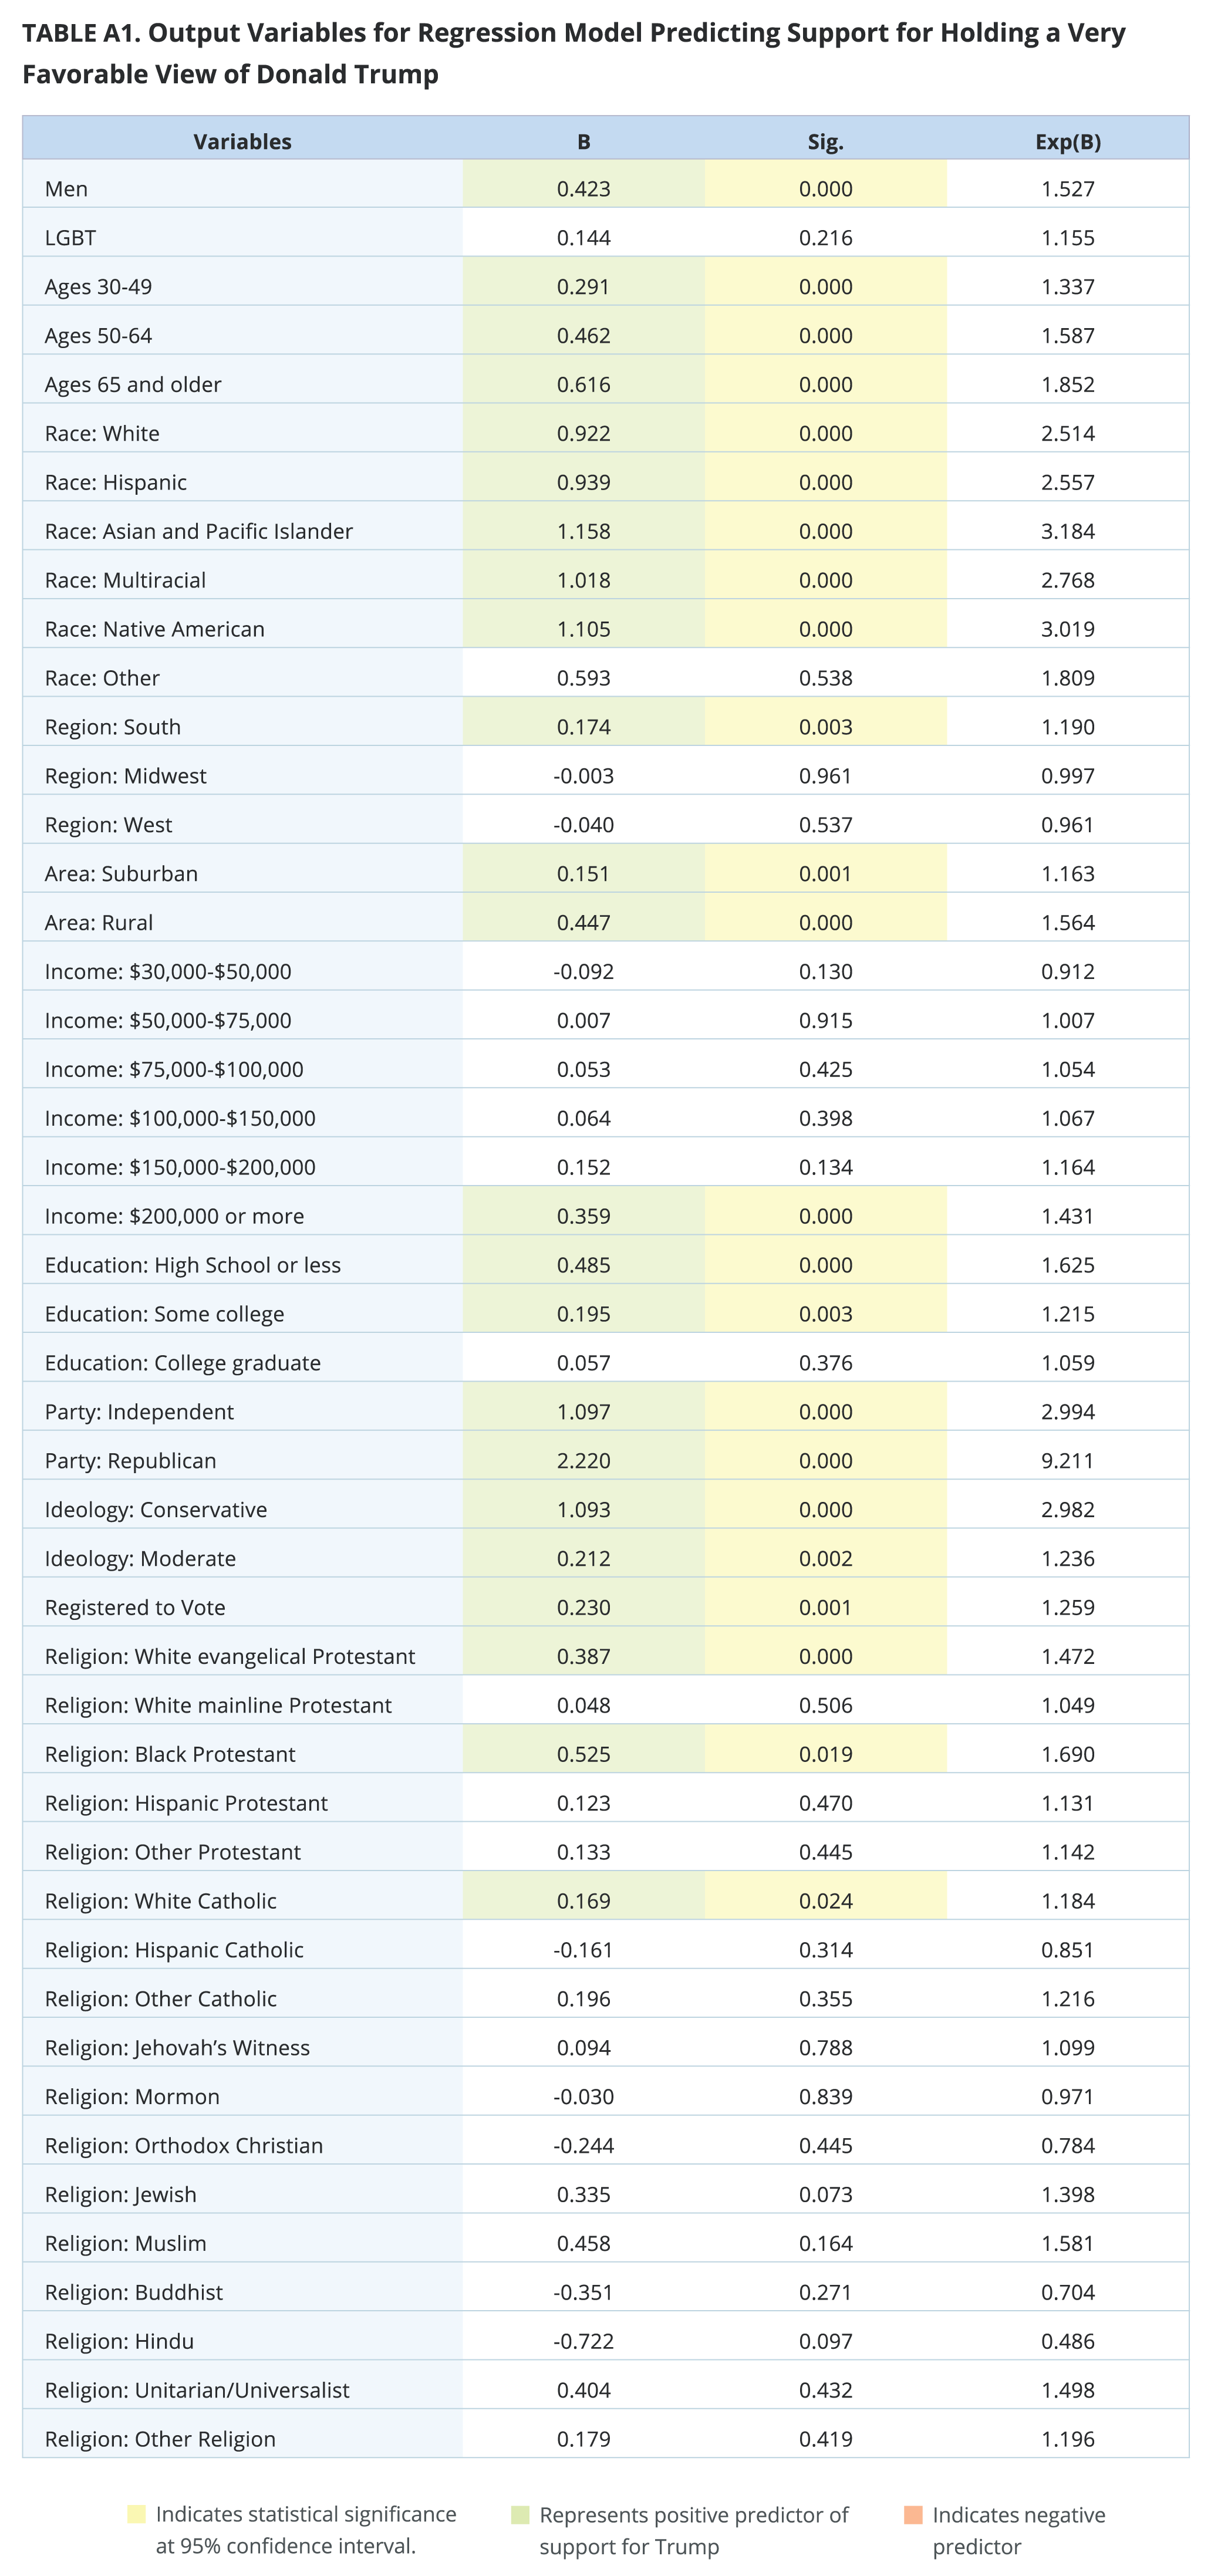
In order to understand the strongest independent predictors of holding favorable views of Trump, we constructed a logistic regression model. The most important determinants of viewing Trump very favorably, even while accounting for a range of other possible characteristics, are party affiliation, ideology, and race.
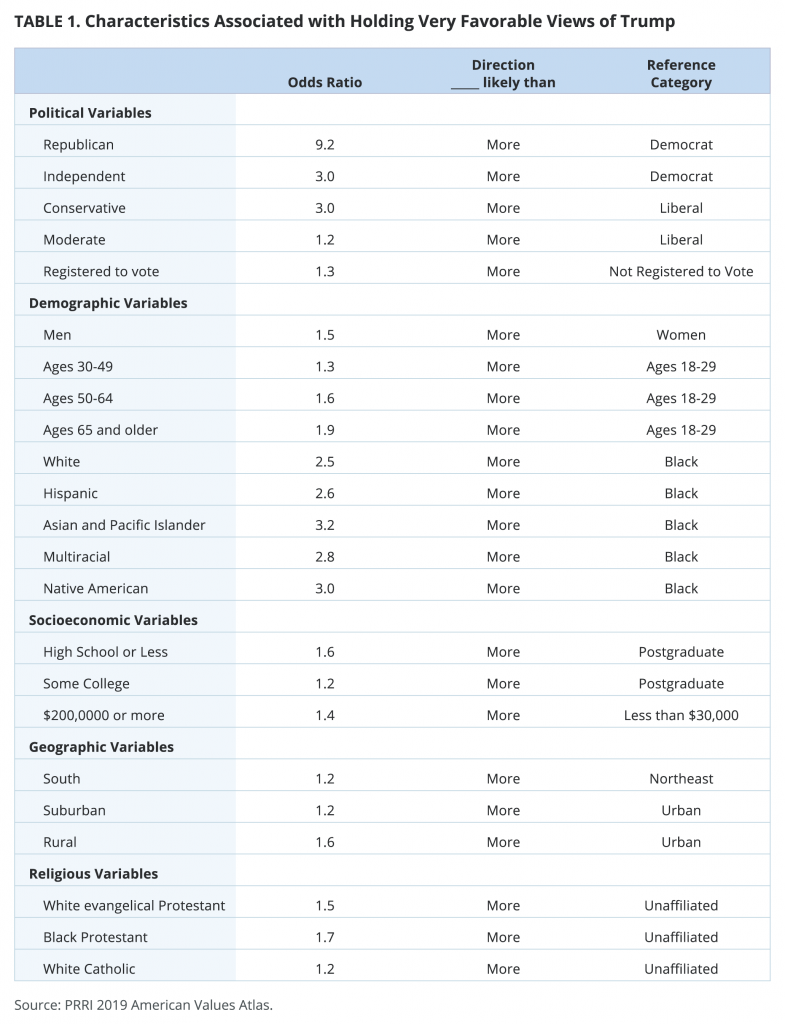
Unsurprisingly, party affiliation serves as the best predictor of holding a very favorable view of Trump. Republicans are 9.2 times more likely than Democrats to hold a very favorable view of Trump. The Republican effect is by far the largest in the entire model. Independents are 3 times more likely than Democrats to view the president very favorably. Compared to liberals, conservatives are 3 times more likely to hold a very favorable view of Trump. Moderates are only 1.2 times more likely than liberals to be very favorable to Trump.
Among demographic variables, every major racial group is about 3 times more likely than black Americans to hold a very favorable view of Trump: White (2.5), Hispanic (2.6), Asian and Pacific Islander (3.2), multiracial (2.8), and Native American. This seemingly paradoxical lower odds ratio for whites is due to the fact that the model simultaneously accounts for party, age, and religion.
There is a clear gender gap, with men 1.5 times more likely to be very favorable to Trump than women. Age plays a major role in determining strong support for Trump as well, with each of the older age groups more likely to say they are very favorable toward Trump than those ages 18-29.
Both education and income levels help predict the likelihood of holding a very favorable opinion of Trump. A person with a high school degree or less is 1.6 times more likely to hold strongly favorable views of Trump than someone with a postgraduate degree, while a person with some college experience is 1.2 times more likely. Americans with household incomes over $200,000 per year are 1.4 times more likely to be very favorable toward Trump than someone with a household income of less than $30,000 per year. This income finding might seem counterintuitive at first, but there are only 4% of Americans in the over $200,000 per year income category. This very small group of top earners buck the general trend that Trump’s favorable ratings generally decrease as education and income increase.
Americans living in the South are 1.2 times more likely than those in the Northeast to hold very favorable views of Trump. Rural residents are 1.6 times more likely, and suburban residents are 1.2 times more likely, than urban residents to hold very favorable views of the president.
A few religious characteristics stand out as more predictive of high levels of favorability for Trump. Black Americans identifying as Protestants are 1.7 times more likely than the religiously unaffiliated to say they are very favorable to Trump. This finding might seem counterintuitive, given black Americans’ strong dislike of the president, but since race and partisanship are accounted for elsewhere in the model, the effect of religion increases the likelihood of very favorable views. Even with race and party affiliation accounted for, however, white evangelical Protestants are 1.5 times more likely to hold a very favorable view of Trump than the religiously unaffiliated, while white Catholics are 1.2 times more likely.
Trump’s Opposition
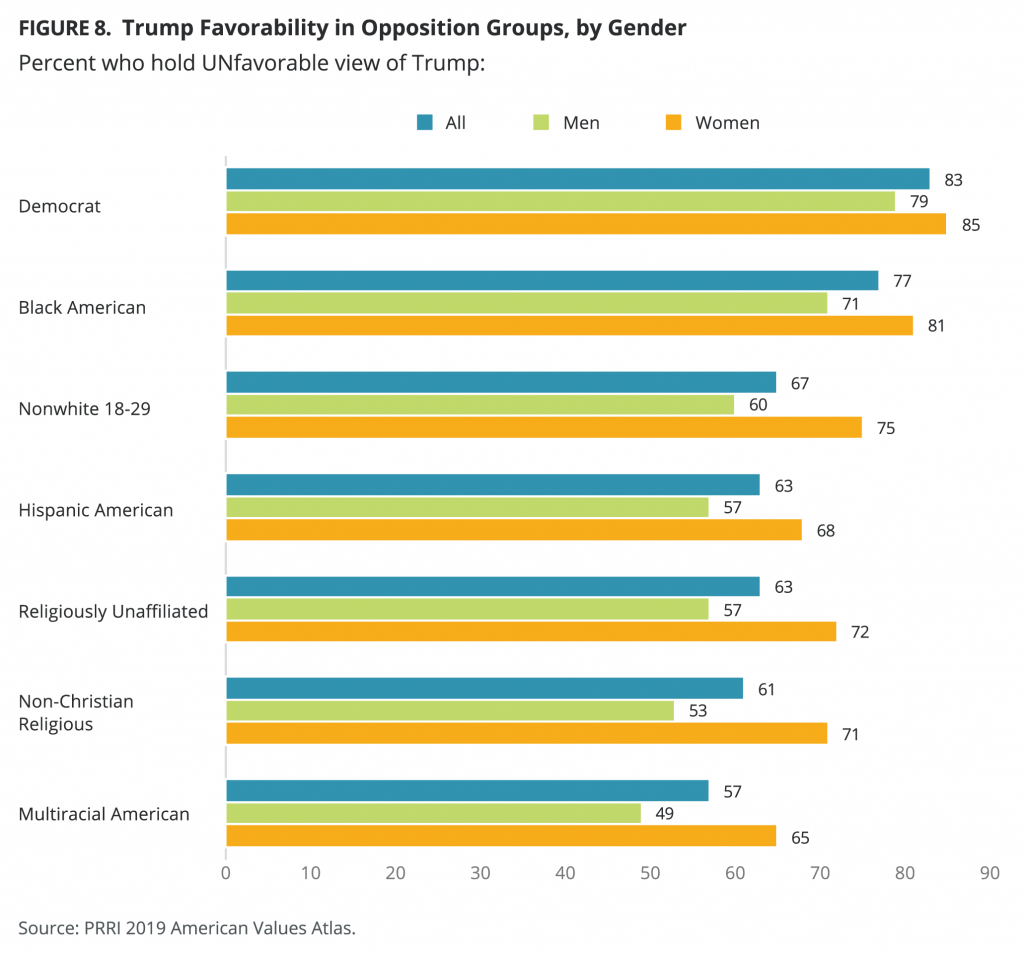
While Republicans are mostly united behind Trump, Democrats are even more united against him. More than eight in ten (83%) Democrats say they hold an unfavorable view of Trump, including a 61% majority who say they have a very unfavorable view. Americans who identify as Democrats hold unfavorable views of Trump, even within groups who are more likely to view Trump favorably overall. Majorities of Democratic seniors age 65 and older (85%), white Democratic men (78%), and white Democrats without a college degree (72%) all hold solidly unfavorable views of Trump.
Besides Democrats, a few key constituencies stand out in their opposition to Trump: black Americans, Hispanic Americans, religiously unaffiliated Americans, non-Christian religious Americans, and multiracial Americans. Regardless of most other demographic factors, these groups are overwhelmingly opposed to Trump across nearly every metric.
Black Americans
Black Americans are remarkably unified in their opposition to Trump. Black Americans make up 12% of the population, and more than three in four (77%) say they hold mostly or very unfavorable views of Trump. A 56% majority say they have very unfavorable views of him. Fewer than one in five (18%) say they are favorable toward Trump.
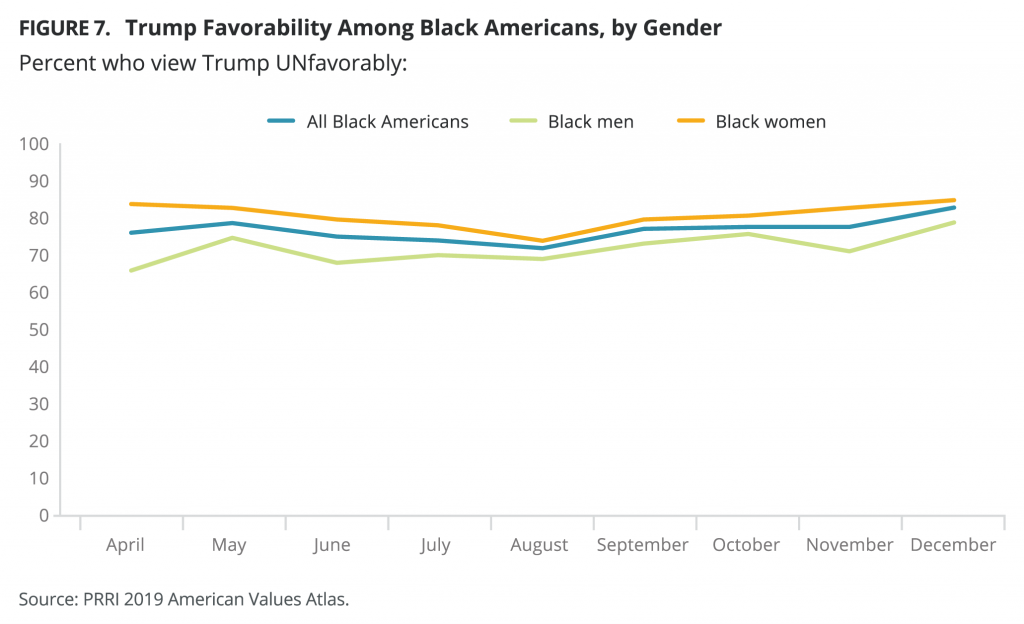
Black Americans’ assessments of Trump have been overwhelmingly unfavorable throughout 2019. Nearly eight in ten black Americans said they held unfavorable views of Trump through April (76%) and May (79%). Trump’s unfavorable ratings among black Americans dipped to a low of 72% in August before increasing to a high of 83% in December.
Black Democrats and independents are overwhelmingly unfavorable toward Trump, though the relatively small share of black Republicans hold mostly favorable views of him. A 55% majority of black Americans identify as Democrats, an additional 31% identify as independents, and 10% identify as Republicans. Nearly nine in ten (88%) black Democrats hold unfavorable views of Trump, including two-thirds (67%) who hold very unfavorable views of Trump. Nearly three in four (74%) black independents say they hold unfavorable views of Trump. Partisanship takes over for black Republicans, though, among whom only 36% hold unfavorable views of Trump.
Black women (81%) are more likely than black men (71%) to rate Trump unfavorably. A month-by-month look at differences by gender among black Americans shows that black men’s ratings of Trump are generally in the 70s, while Trump’s unfavorable ratings among black women declined in the spring and summer from 84% in April to 74% in August, then steadily returned to 85% by December after the announcement of impeachment proceedings. Aside from these gender differences, black Americans are remarkably similar in their attitudes toward Trump, regardless of religion, age, or level of education.
In the lead up to the 2020 election, black Americans have largely united around the Democratic Party. A majority (57%) say they have already decided that they will support the Democratic candidate over Trump, regardless of who wins the nomination. Around one-third (34%) say their vote depends on who the Democratic nominee is, and fewer than one in ten (6%) say they will support Trump no matter who wins the nomination.[12]
Black Americans overwhelmingly support impeaching and removing President Trump. Prior to the announcement of the impeachment inquiry, 71% supported impeachment and removal, while 27% were opposed. After the announcement of impeachment proceedings, support for impeachment and removal among black Americans grew to 85%.[13]
Young Nonwhite Americans
Young nonwhite Americans ages 18-29 make up 10% of the population. Almost half (49%) of this group identifies as Hispanic, one-quarter (25%) as black, 13% as Asian American or Pacific Islander, 10% as multiracial, 3% as Native American, and less that 1% as another race. Two-thirds (67%) of this group hold unfavorable views of Trump, including a 43% plurality who hold very unfavorable views of him. Throughout 2019, young nonwhite Americans’ unfavorable ratings remained stable between 65% and 71% through the year.
Despite their consistently unfavorable views of Trump, nonwhite Americans are not as Democratic as other groups who express similar views of Trump. A 45% plurality of young nonwhite Americans identify as independents, while 34% identify as Democrats, and 11% identify as Republicans. More than eight in ten (84%) young nonwhite Democrats hold unfavorable views of Trump, compared to around two-thirds (66%) of young nonwhite independents, and more than one-quarter (28%) of young nonwhite Republicans.
Young nonwhite women are more likely than young nonwhite men to hold unfavorable views of Trump (75% vs. 60%). The gender gap is even wider for very unfavorable views of Trump, with a 53% majority of young nonwhite women compared to 34% of young nonwhite men who say they hold very unfavorable views of Trump.
Hispanic Americans
Throughout 2019, Hispanic Americans’ unfavorable ratings of Trump remained relatively stable, staying between 59% and 65%. In April Trump’s unfavorable rating stood at 64% before dropping to 61% through June and July, then returning to 65% in August. Trump’s unfavorable rating among Hispanic Americans dipped to 59% in October before climbing back to 65% in December.
More than eight in ten (81%) Hispanic Democrats and 63% of Hispanic independents, but only 24% of Hispanic Republicans hold unfavorable views of Trump. Notably, however, only 13% of Hispanic Americans identify as Republicans. Just over four in ten (42%) Hispanic Americans say they are independent, while around one-third (35%) identify as Democrats.
Despite Trump’s fiery immigration rhetoric, Hispanic Americans’ place of birth does not appear to have a particularly large effect on their opinions of him. Around two-thirds (65%) of U.S.-born Hispanic Americans hold unfavorable views of Trump, along with 62% of Puerto Rican-born Hispanic Americans, and 60% of foreign-born Hispanic Americans. Foreign-born Hispanic Americans are more likely to say they do not have an opinion on Trump or don’t know enough to assign him a rating (13%) than those born in the U.S. states (5%).
Hispanic women are more likely than Hispanic men to hold unfavorable views of Trump. More than two-thirds (68%) of Hispanic women rate Trump unfavorably, including nearly half (49%) who say they are very unfavorable toward him. A majority (57%) of Hispanic men hold unfavorable views of Trump, including 38% who hold very unfavorable views.
Despite their negative assessments of Trump, many Hispanic Americans have not completely united behind a Democratic candidate in the 2020 race for president. Almost half (46%) say their vote will depend on who the Democratic nominee is, while 40% say they will support the Democratic candidate. Just over one in ten (12%) say they will support Trump no matter who wins the Democratic nomination.[14]
Religiously Unaffiliated Americans
Most religiously unaffiliated Americans report viewing Trump quite unfavorably. The religiously unaffiliated make up nearly one in four (24%) Americans, and more than six in ten (63%) hold unfavorable views of Trump. More than four in ten (45%) religiously unaffiliated Americans say they are very unfavorable toward Trump. Less than one third (32%) hold favorable views. Among the religiously unaffiliated, atheists and agnostics are more unfavorable toward Trump (73% and 72% respectively) than Americans who are unaffiliated but say they are a religious person (51%) or those who are secular and not religious (63%).
Unaffiliated Americans’ unfavorable assessments of Trump have increased somewhat through the year. Throughout April, May, and June, 63% said they hold unfavorable views of Trump. Unfavorable ratings dipped to 60% through July and August before climbing to 64% in September, 66% in October around the time of the announcement of impeachment proceedings. Trump’s unfavorable ratings among this group reached a high of 67% in November and December.
Religiously unaffiliated Americans have a unique political profile: They are not overwhelmingly Democratic but are still highly unfavorable toward Trump. A 43% plurality of religiously unaffiliated Americans identify as independents, 35% identify as Democrats, and 16% identify as Republicans. Religiously unaffiliated Democrats (87%) and independents (64%) are even more likely to say they are unfavorable toward Trump than their religiously affiliated peers (83% and 57%, respectively). Only 21% of unaffiliated Republicans, however, view the president negatively.
It is unlikely that Trump will be able to win much electoral support among unaffiliated Americans going into the 2020 election. A 55% majority of unaffiliated Americans say they will support the Democratic nominee no matter who it is, while 32% say it depends on who the nominee is, and just 11% say they will support Trump no matter who wins the Democratic nomination.[15]
Religiously unaffiliated Americans are some of the most likely to support impeaching and removing Trump from office. Prior to the announcement of the formal impeachment process, more than six in ten (63%) unaffiliated Americans supported impeachment and removal. After the impeachment process began in October, support for impeachment and removal among unaffiliated Americans grew to 68%, although the difference is not statistically significant.[16]
Non-Christian Religious Americans
Non-Christian religious Americans, which includes those who identify as Jewish, Buddhist, Muslim, Hindu, Unitarian Universalist, and other smaller non-Christian religions, make up 4% of the population and hold broadly unfavorable views of Trump (61%), including 43% who say they are very unfavorable toward Trump.
Non-Christian religious Americans are more than twice as likely to identify as independent (42%) or Democratic (35%) than as Republican (15%). Like most other Democratic groups, non-Christian religious Democrats hold overwhelmingly unfavorable views of Trump (85%). Independents are more divided, with 58% who are unfavorable toward Trump and 35% who hold favorable views. About one in four (27%) non-Christian religious Republicans rate Trump unfavorably.
Non-Christian religious women are 18 percentage points more likely than non-Christian religious men to hold unfavorable views of Trump. Around seven in ten (71%) non-Christian religious women say they have unfavorable views of Trump, including a slim majority (52%) who say they have very unfavorable views of Trump. In comparison, 53% of non-Christian religious men have unfavorable views of Trump.
Unlike many other demographic groups, older non-Christian religious Americans are more likely than their younger counterparts to hold unfavorable views of Trump. Two-thirds (66%) of non-Christian religious Americans over age 50 hold unfavorable views of Trump, including a 54% majority who say they are very unfavorable toward Trump. Among non-Christian religious Americans under age 50, 58% hold unfavorable views of Trump, including 37% who say they hold very unfavorable views.
Multiracial Americans
Multiracial Americans, who report belonging to two or more races or ethnicities, make up 4% of the population. Nearly six in ten (57%) Americans who identify as multiracial hold unfavorable views of Trump, including a 38% plurality who say they hold very unfavorable views.
Just under half (47%) of multiracial Americans identify as independents, while fewer identify as Democrats (30%) or Republicans (16%). More than eight in ten (82%) multiracial Democrats hold unfavorable views of Trump, compared to 55% of multiracial independents and only 21% of multiracial Republicans.
There is a distinct gender gap among multiracial Americans, with multiracial women rating Trump significantly more unfavorably than multiracial men. Nearly two-thirds (65%) of multiracial women hold unfavorable views of Trump, compared to 49% of multiracial men. More than four in ten (44%) multiracial men hold favorable views of Trump.
Groups Divided over Trump
Several major demographic groups express more divided views of Trump. While Republicans and Democrats have mostly remained united in their partisan corners, the 35% of Americans who identify as independents are more divided, though as a whole they are less likely to hold favorable views of Trump (37%) than unfavorable views (57%). Americans with college degrees, suburban residents, and white women are three key groups whose opinions of Trump are particularly divided.
Americans With College Degrees
Americans with a four-year college degree or more make up 32% of the population. Within this group, nearly four in ten (38%) hold favorable views of Trump, while almost six in ten (58%) hold unfavorable views. A closer look at Americans with college degrees shows that they are anything but monolithic: There are divisions by party, race, gender, and religion.
Americans with college degrees divide almost evenly between identifying as Democrat (35%) or independent (34%) and are somewhat less likely to identify as Republican (27%). Unsurprisingly, Republicans and Democrats with college degrees are some of the most polarized groups in their ratings of Trump. Fewer than one in ten (8%) Democrats with college degrees say they are favorable toward Trump, compared to nearly eight in ten (78%) Republicans with college degrees. Just under four in ten (38%) hold favorable views of Trump, while a 58% majority hold unfavorable views.
Trump’s favorability among white women with college degrees is significantly lower than white male college graduates (37% vs. 47%). Among white college graduate men, Trump’s favorability remained relatively stable through the spring and summer, but dipped beginning in October around the impeachment announcement and has remained at 45% or below through the end of the year.
The views of white women with college degrees seem more sensitive to events on the ground. Favorability among white women with college degrees dipped in the spring around the time of the release of the Mueller report — from 38% in April to a low water mark of 28% in May before recovering to 40% in June. Favorability remained around four in ten through the summer. By the fall and the announcement of impeachment proceedings, Trump’s favorability declined to around one-third (33%) of white college grad women.
White evangelical Protestant college graduates (62%) are much more likely to say they are favorable toward Trump than college graduates of almost every other religious affiliation or religiously unaffiliated college graduates. Favorability among white evangelical Protestants with college degrees dipped to a low of 50% in May, before climbing to around seven in ten from July to October. Between October and November, favorability among this group dipped to 55%, and remained at 58% to close out the year.
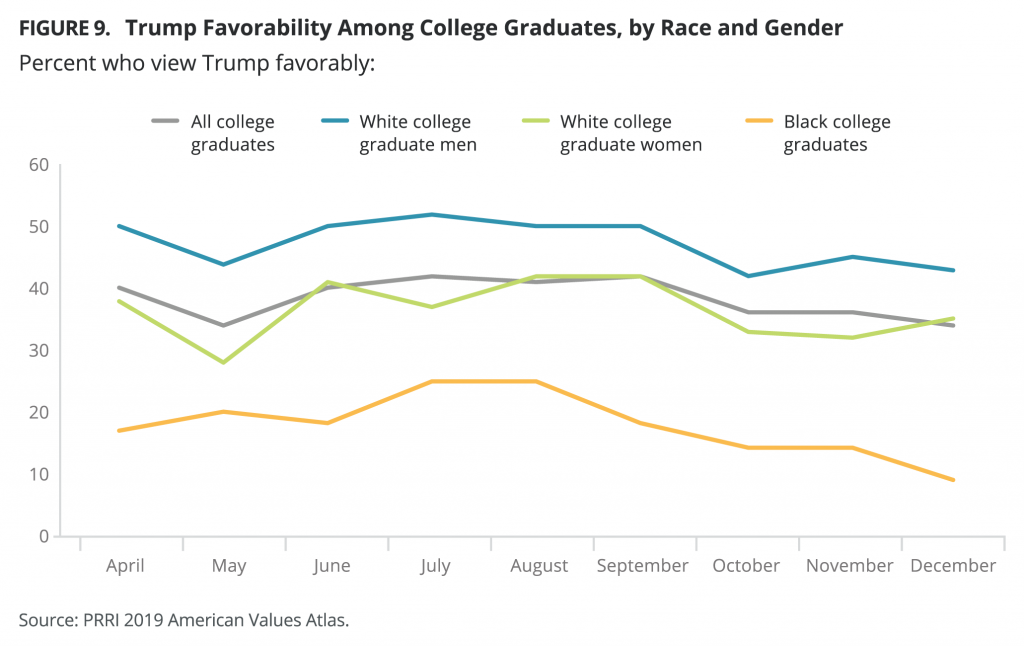
Religiously unaffiliated college graduates are much less favorable toward Trump than those who affiliate with Christianity. Fewer than three in ten said they were favorable toward him from April to September, and favorability dipped even lower after the news broke of the Ukraine scandal and the beginning of impeachment proceedings (18% in October, 23% in November, and 19% in December).
In the timeframe before and after the impeachment inquiry announcement, white college graduates shifted their stance on impeaching and removing Trump from office. Trump’s favorability ratings declined around the time of the announcement, and support for impeachment and removal flipped from 46% to 53% once the impeachment was announced.[17]
White college graduate women are more likely than white college graduate men to support impeaching and removing Trump from office. Before impeachment proceedings were announced, half (50%) of white women with college degrees supported impeachment and removal, compared to 42% of men who said the same. After the announcement of impeachment proceedings, support grew to 59% among women and 47% among men.[18]
Suburban Americans
Americans who live in suburban areas have been about as likely as all Americans to say they hold favorable views of Trump. Throughout the year, Trump’s favorability among the 44% of Americans who live in suburban areas has hovered close to 40%, ranging from a low of 38% in April and May to a high of 44% in August and September. However, there are deep divisions in suburban areas by party, race, and gender.
Americans who live in suburban areas are somewhat more likely to identify as independents (36%) or Democrats (33%) than as Republicans (27%). Unsurprisingly, suburban partisans follow the standard pattern: suburban Republicans are overwhelmingly favorable toward Trump (81%), while Trump wins poor ratings from suburban Democrats (14%). Independents are more divided, with 38% saying they hold favorable views of Trump and 55% saying they hold unfavorable views.
Again, race is a significant diving line among suburbanites. Nearly two-thirds (65%) of suburban residents are white, while 34% are nonwhite (16% are Hispanic, 10% are black, 3% are Asian or Pacific Islander, 1% are Native American, and 4% are multiracial). Trump’s favorability among white suburbanites rose through the spring from 45% in April to a 52% high in August, before falling to 45% in November after the impeachment announcement. However, unlike many groups, Trump’s favorability among white suburbanites increased slightly between November and December, growing to 49% by the end of the year.
White men (54%) are the primary drivers of higher than average favorability for Trump among white suburban residents. White suburban women (43%) are about as likely as all suburban residents to say they are favorable toward Trump (42%). Nonwhite suburbanites (28%) are significantly less favorable toward Trump than white suburbanites, and their assessments of him remained largely stable throughout 2019.
White Women
White women’s favorability ratings of Trump generally mirror those of Americans as a whole, with 42% who view him favorably and 55% unfavorably. Favorability ratings among white women increased through the spring before declining in the fall and dropped to a low of 40% in December during the impeachment proceedings. Despite rating Trump similarly to Americans as a whole, white women are not a homogenous group: there are important divides by party, religious affiliation, and marital status.
White women are relatively evenly divided in their partisan leanings, though they are slightly more likely to identify as Democrats (35%) than independents (31%) or Republicans (31%). Like most other partisan groups, white Republican women are overwhelmingly favorable toward Trump (79%), while few white Democratic women (14%) hold favorable views of the president. Much like independents overall, white independent women are more divided: 37% rate Trump favorably, while 59% rate him unfavorably.
White evangelical Protestant women (26% of all white women) are much more likely than white women of other religious affiliations to say they have favorable views of Trump (59%). By contrast, Trump’s favorability among white religiously unaffiliated women (21% of all white women) is much lower (28%).
Married white women (46%) are more likely than women of most other marital statuses to say they are favorable toward Trump. White women who have never been married (30%) are much less likely to hold favorable views of Trump. Favorability ratings among white women who are divorced or separated (42%) generally mirror the ratings of all white women.
In September, ahead of the impeachment inquiry announcement, more than six in ten (62%) white women opposed impeachment and removal while 37% supported it. After the announcement of impeachment proceedings, the gap in support narrowed to 47% of white women in support of impeachment, though a slim majority (51%) still opposed impeachment and removal.[19]
Trump Favorability in Battleground States
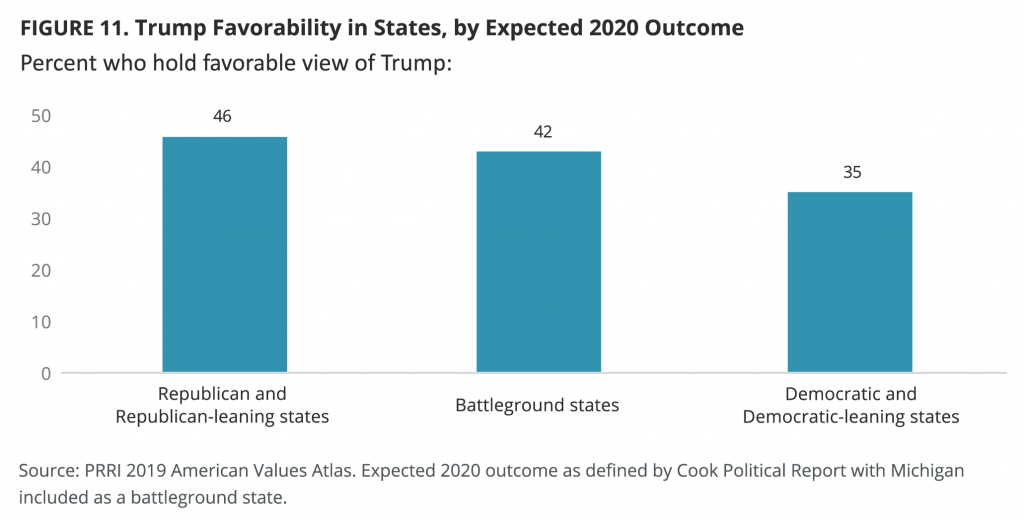
Trump’s favorability ratings will be of particular interest in states expected to be decisive in the 2020 presidential election. The Cook Political Report lists five states as true toss-ups for 2020: Arizona, Florida, North Carolina, Pennsylvania, and Wisconsin.[20] Due to its very small margin of victory for Trump and pivotal role in the 2016 election, this report adds Michigan to the group even though Cook has that state in the “leans Democratic” column.[21]
Across all 50 states plus the District of Columbia, Trump’s favorability ranges from a high of 59% in South Dakota to a low of 23% in the District of Columbia. Not surprisingly, the six battleground states are in the middle of the pack but slightly higher than Trump’s national favorability (41%). More than four in ten residents of Arizona (44%), Florida (42%), Michigan.
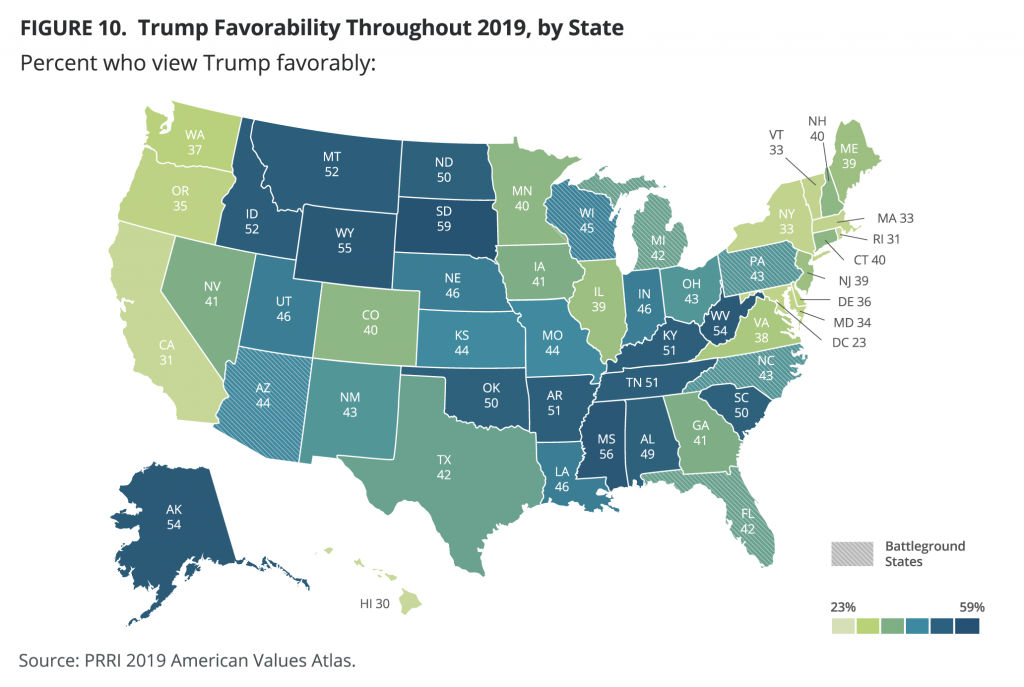
State-level views of Trump throughout 2019 generally follow the same trajectory as the national numbers: Trump’s favorability is at or just under the yearly average at the beginning of the second quarter of the year, drops in late April and May, likely due to the Mueller report and surrounding controversy, then climbs over the summer of 2019 and dips in the fourth quarter of the year in the midst of the impeachment inquiry. The pattern is more pronounced in North Carolina and Florida than other battleground states, but Wisconsin, Arizona, Pennsylvania, and Michigan also show signs of these events impacting Trump’s favorability.
Wisconsin
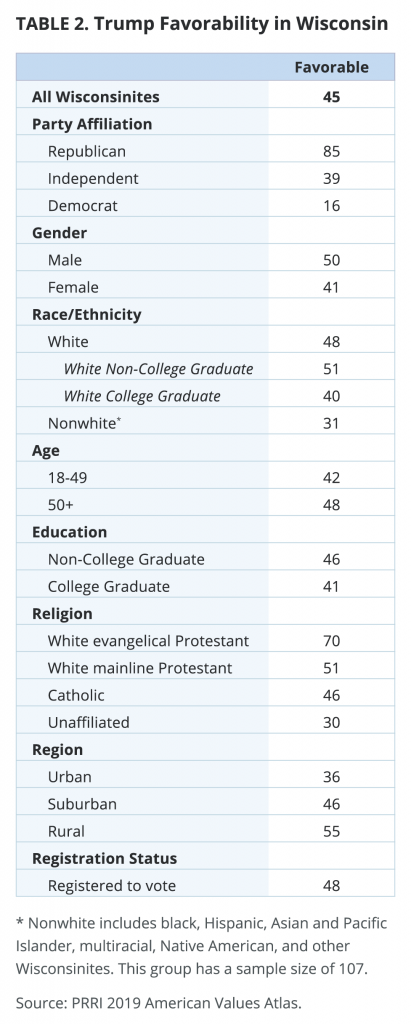
More than four in ten (45%) Wisconsinites hold a favorable view of Trump, with more than one in five (22%) saying they are very favorable to Trump. Of the six battleground states, Wisconsin shows the highest level of support for Trump and is the only battleground state where residents are significantly more likely than all Americans to view him favorably. Wisconsin Republicans, men, and Catholics all stand out as more likely to favor Trump than those same groups at the national level.
More than eight in ten (85%) Wisconsin Republicans say they are favorable to Trump compared to just under eight in ten (79%) Republicans nationally. Neither Democrats nor independents in Wisconsin differ significantly from the national numbers.
Wisconsin women hold more favorable views of Trump than women throughout the country (41% vs. 35%), though Wisconsin men are more in line with men nationally.
Nearly half (46%) of Wisconsin Catholics hold a favorable view of Trump, compared to less than four in ten (38%) Catholics overall. However, white Catholics in Wisconsin closely resemble white Catholic Americans. No other religious tradition in Wisconsin stands out in comparison to their religious counterparts at the national level.
Arizona
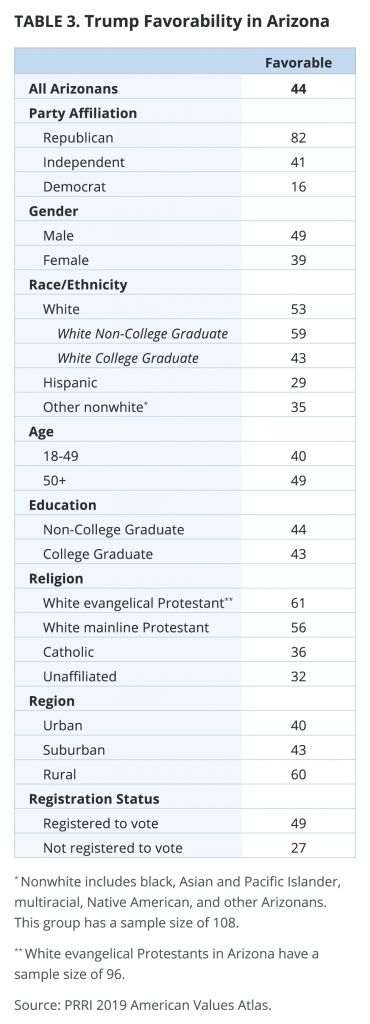
More than four in ten (44%) Arizonans say they have a favorable view of Trump, including more than one in five (21%) who say they are very favorable toward the president. Whites without a college degree and urban residents in Arizona both display a greater likelihood to favor Trump than those two same groups nationally.
White Arizonans without a college degree are particularly likely to support Trump. Almost six in ten (59%) view Trump favorably compared to a slim majority (52%) of white Americans without a college degree. No notable differences between Arizonans without a college degree and Americans without a degree appear.
Arizonans living in urban areas also show a greater likelihood to favor Trump than Americans living in urban areas (40% vs. 33%). No such differences appear between Arizonans and Americans among suburban or rural residents.
North Carolina
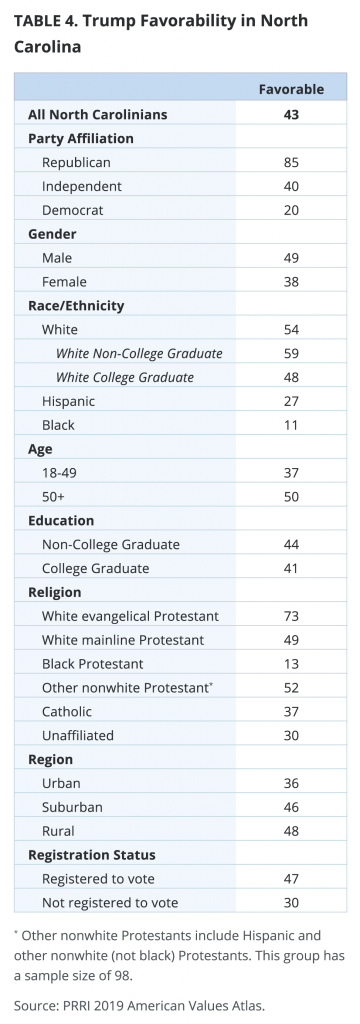
More than four in ten (43%) North Carolinians hold favorable views of Trump, including one in five (20%) who hold very favorable views. Several groups in North Carolina stand out as more likely to favor Trump than their national counterparts, including Republicans, Democrats, whites, those over age 50, and white evangelical Protestants. Black North Carolinians stand out as the only group in these six battleground states to be less likely to support Trump than their national counterparts.
Well over eight in ten (85%) North Carolina Republicans say they hold favorable views of Trump compared to just under eight in ten (79%) Republicans nationally. North Carolina Democrats are also more likely to favor Trump than Democrats throughout the country (20% vs. 15%). Independents in North Carolina closely resemble independents nationally.
A majority (54%) of white North Carolinians rate Trump favorably compared to just under half (49%) of white Americans. Only one in ten (11%) black North Carolinians hold a favorable view of Trump, which makes them stand out as both the least supportive group to Trump in North Carolina and less likely to favor Trump than black Americans overall (18%).
Older North Carolinians over age 50 show a slightly greater likelihood to favor Trump than the same group nationally (50% vs. 46%). North Carolinians also demonstrate a sizable age gap, with fewer than four in ten (37%) of those ages 18-49 reporting favorable views of Trump.
Almost three in four (73%) white evangelical Protestants in North Carolina view Trump favorably, making them second only to Republicans in their level of support. They are also more favorable toward Trump than white evangelical Protestants nationally (64%).
Pennsylvania
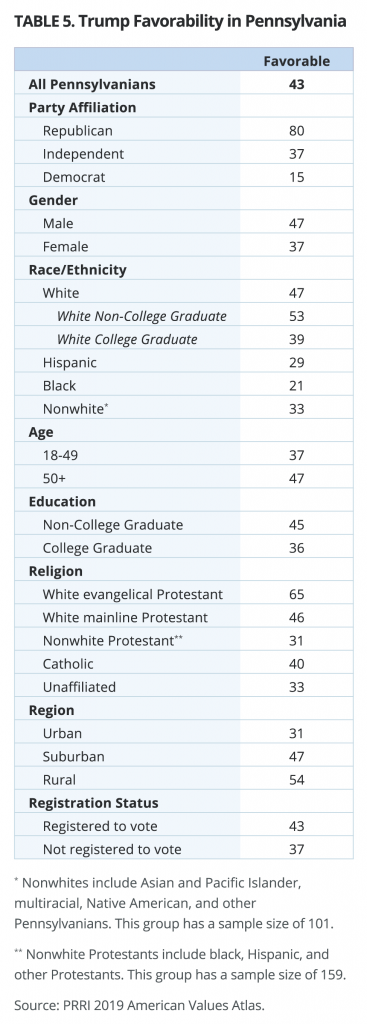
More than four in ten (43%) Pennsylvanians hold favorable views of Trump, including one in five (21%) who hold very favorable views. Pennsylvanians without a college degree and those living in a suburban area both display greater levels of support than Americans in those two groups.
Pennsylvanians without a college degree are slightly more likely than Americans without a college degree to favor Trump (45% vs. 41%). No such notable differences between Pennsylvanians and the country at large appear among college graduates.
Close to half (47%) of Pennsylvania suburban residents favor Trump compared to just over four in ten (42%) suburban Americans. Both urban and rural Pennsylvanians more closely resemble the national averages.
Florida
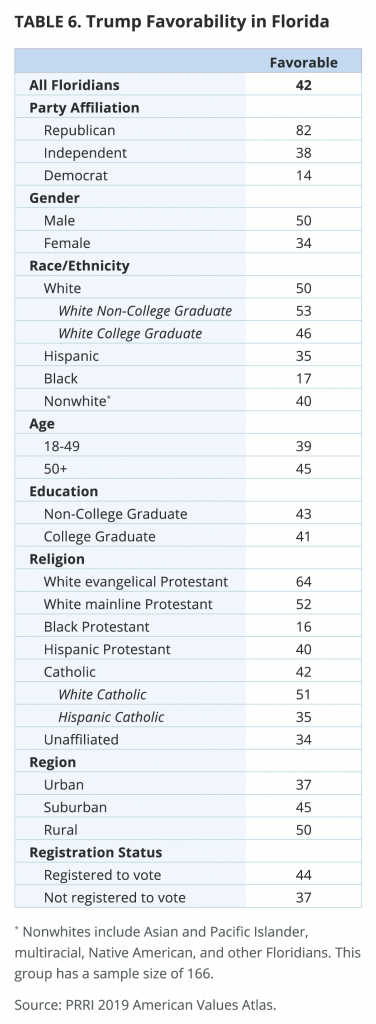
Just over four in ten (42%) Floridians view Trump favorably, with one in five (20%) saying they are very favorable to Trump. A number of Floridian groups show higher levels of support for Trump than those same groups nationally, including Republicans, men, Hispanics, Hispanic Catholics, white college graduates, and urban residents.
Florida Republicans are slightly more likely than Republicans overall to hold favorable views of Trump (82% vs. 79%). Florida Democrats and independents do not show any notable differences from their national counterparts.
Florida men exhibit a slightly greater likelihood to view Trump favorably than American men (50% vs. 47%). About one-third (34%) of Florida women favor Trump, though they do not differ from women throughout the country.
More than one-third (35%) of Hispanic Floridians view Trump positively compared to less than three in ten (28%) Hispanic Americans. This gap is even greater among Hispanic Catholics (35% vs. 25%).
White Floridian college graduates are somewhat more likely than white Americans with a college degree to favor Trump (46% vs. 42%). No such difference appears among either college graduates or whites without a college degree.
Urban Floridians also differ somewhat from urban Americans in their views of Trump (37% vs. 33%). Both suburban and rural Floridians more closely resemble their national counterparts.
Michigan
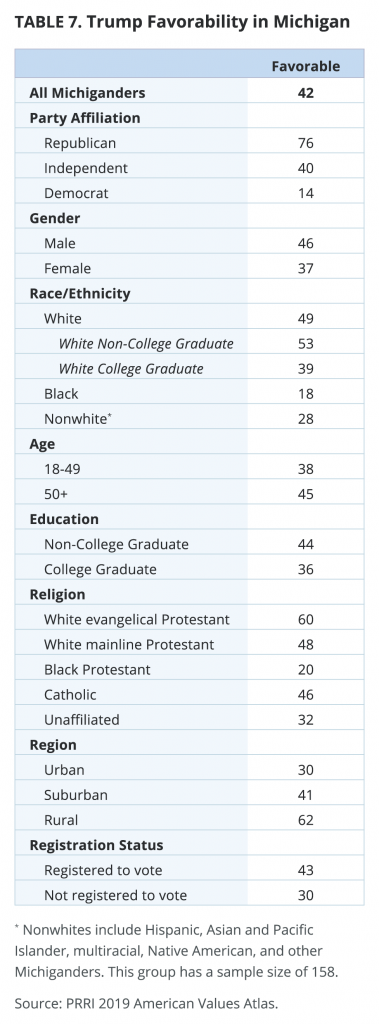
Just over four in ten (42%) Michiganders hold a favorable opinion of Trump, including 18% who say they hold very favorable views. Michigan Catholics and rural residents are both more likely than those two groups at the national level to favor Trump.
Close to half (46%) of Michigan Catholics view Trump favorably, compared to less than four in ten (38%) American Catholics. White Catholics in Michigan do not differ notably from white Catholics nationally.
More than six in ten (62%) rural Michiganders view Trump favorably, making them second only to Republicans in their support for Trump. Rural Michiganders also are more likely than rural Americans (53%) to favor Trump. Suburban and urban Michiganders more closely resemble those same groups nationally.
Regression Output
Survey Methodology
The 2019 American Values Atlas (AVA) is a project of PRRI. Results for all demographic, religious affiliation and political affiliation questions were based on 53,474 bilingual telephone interviews (including 33,708 cell phone interviews) conducted between January 2, 2019, and December 30, 2019, by professional interviewers under the direction of SSRS. Results for questions on specific issues are based on a subset of 40,357 telephone interviews (including 26,142 cell phone interviews) conducted between March 26, 2019 and December 29, 2019. The survey was made possible by generous support from the Arcus Foundation, the E. Rhodes & Leona B. Carpenter Foundation, the Evelyn and Walter Haas, Jr. Fund, the Gill Foundation, and Unitarian Universalist Veatch Program at Shelter Rock.
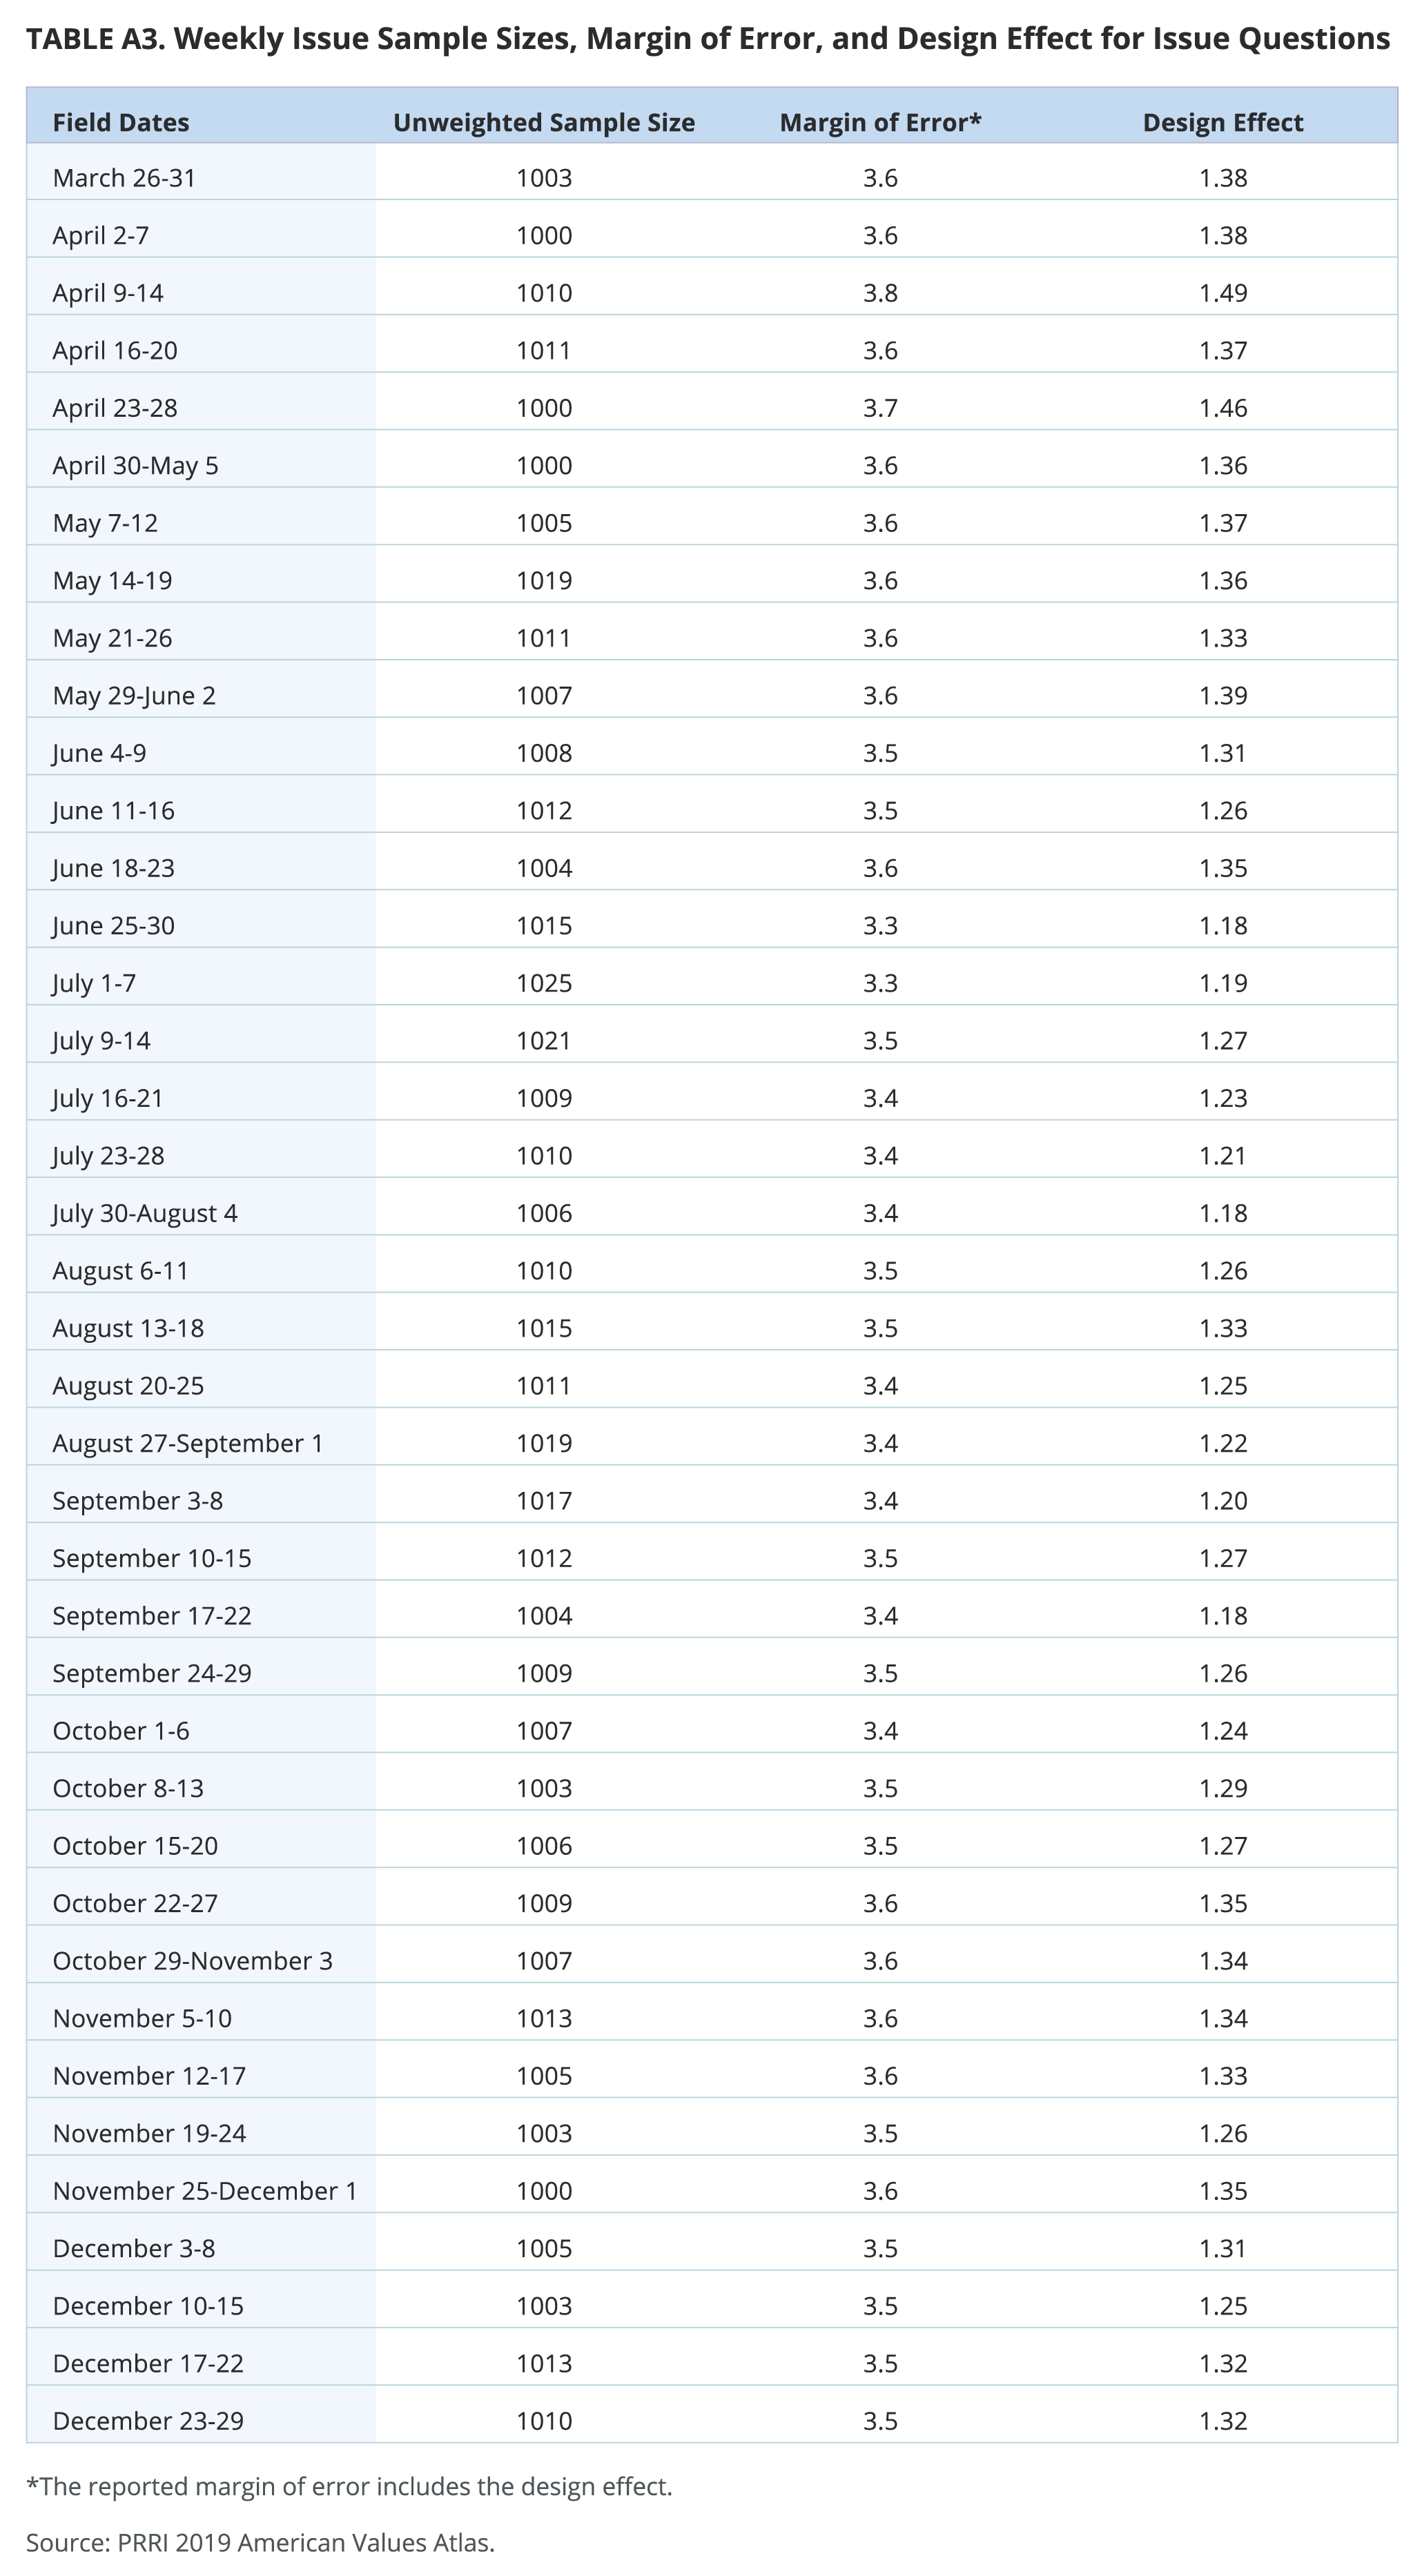
Throughout 2019, at least 1,000 interviews were completed each week, with about 600 interviews conducted among respondents on their cell phones. Mid-year, the cell phone proportion was increased to about 700 per week. Each week, interviewing occurred over a five- or six-day period, starting Tuesdays or Wednesdays and going through Sunday or Monday. The selection of respondents within households was accomplished by randomly requesting to speak with the youngest adult male or female currently living in the household.
Data collection was based on stratified, single-stage, random-digit-dialing (RDD) of landline telephone households and randomly generated cell phone numbers. The sample was designed to represent the total U.S. adult population from all 50 states, including Hawaii and Alaska, and the District of Columbia. The landline and cell phone samples were provided by Marketing Systems Group.
The weighting was accomplished in two separate stages. The first stage of weighting corrects for different probabilities of selection associated with the number of adults in each household and each respondent’s telephone usage patterns. In the second stage, sample demographics were balanced to match target population parameters for gender, age, education, race and Hispanic ethnicity, region (U.S. Census definitions), population density, and telephone usage. The population density parameter was derived from 2010 Census data. The telephone usage parameter came from an analysis of the January-June 2017 National Health Interview Survey. All other weighting parameters were derived from an analysis of the U.S. Census Bureau’s March 2017 Current Population Survey.
The sample weighting was accomplished using iterative proportional fitting (IFP), a process that simultaneously balances the distributions of all variables. Weights are trimmed so that they do not exceed 4.0 or fall below 0.25 to prevent individual interviews from having too much influence on the final results. The use of these weights in statistical analysis ensures that the demographic characteristics of the sample closely approximate the demographic characteristics of the target populations. FINDINGS FROM THE 2019 AMERICAN VALUES ATLAS43.
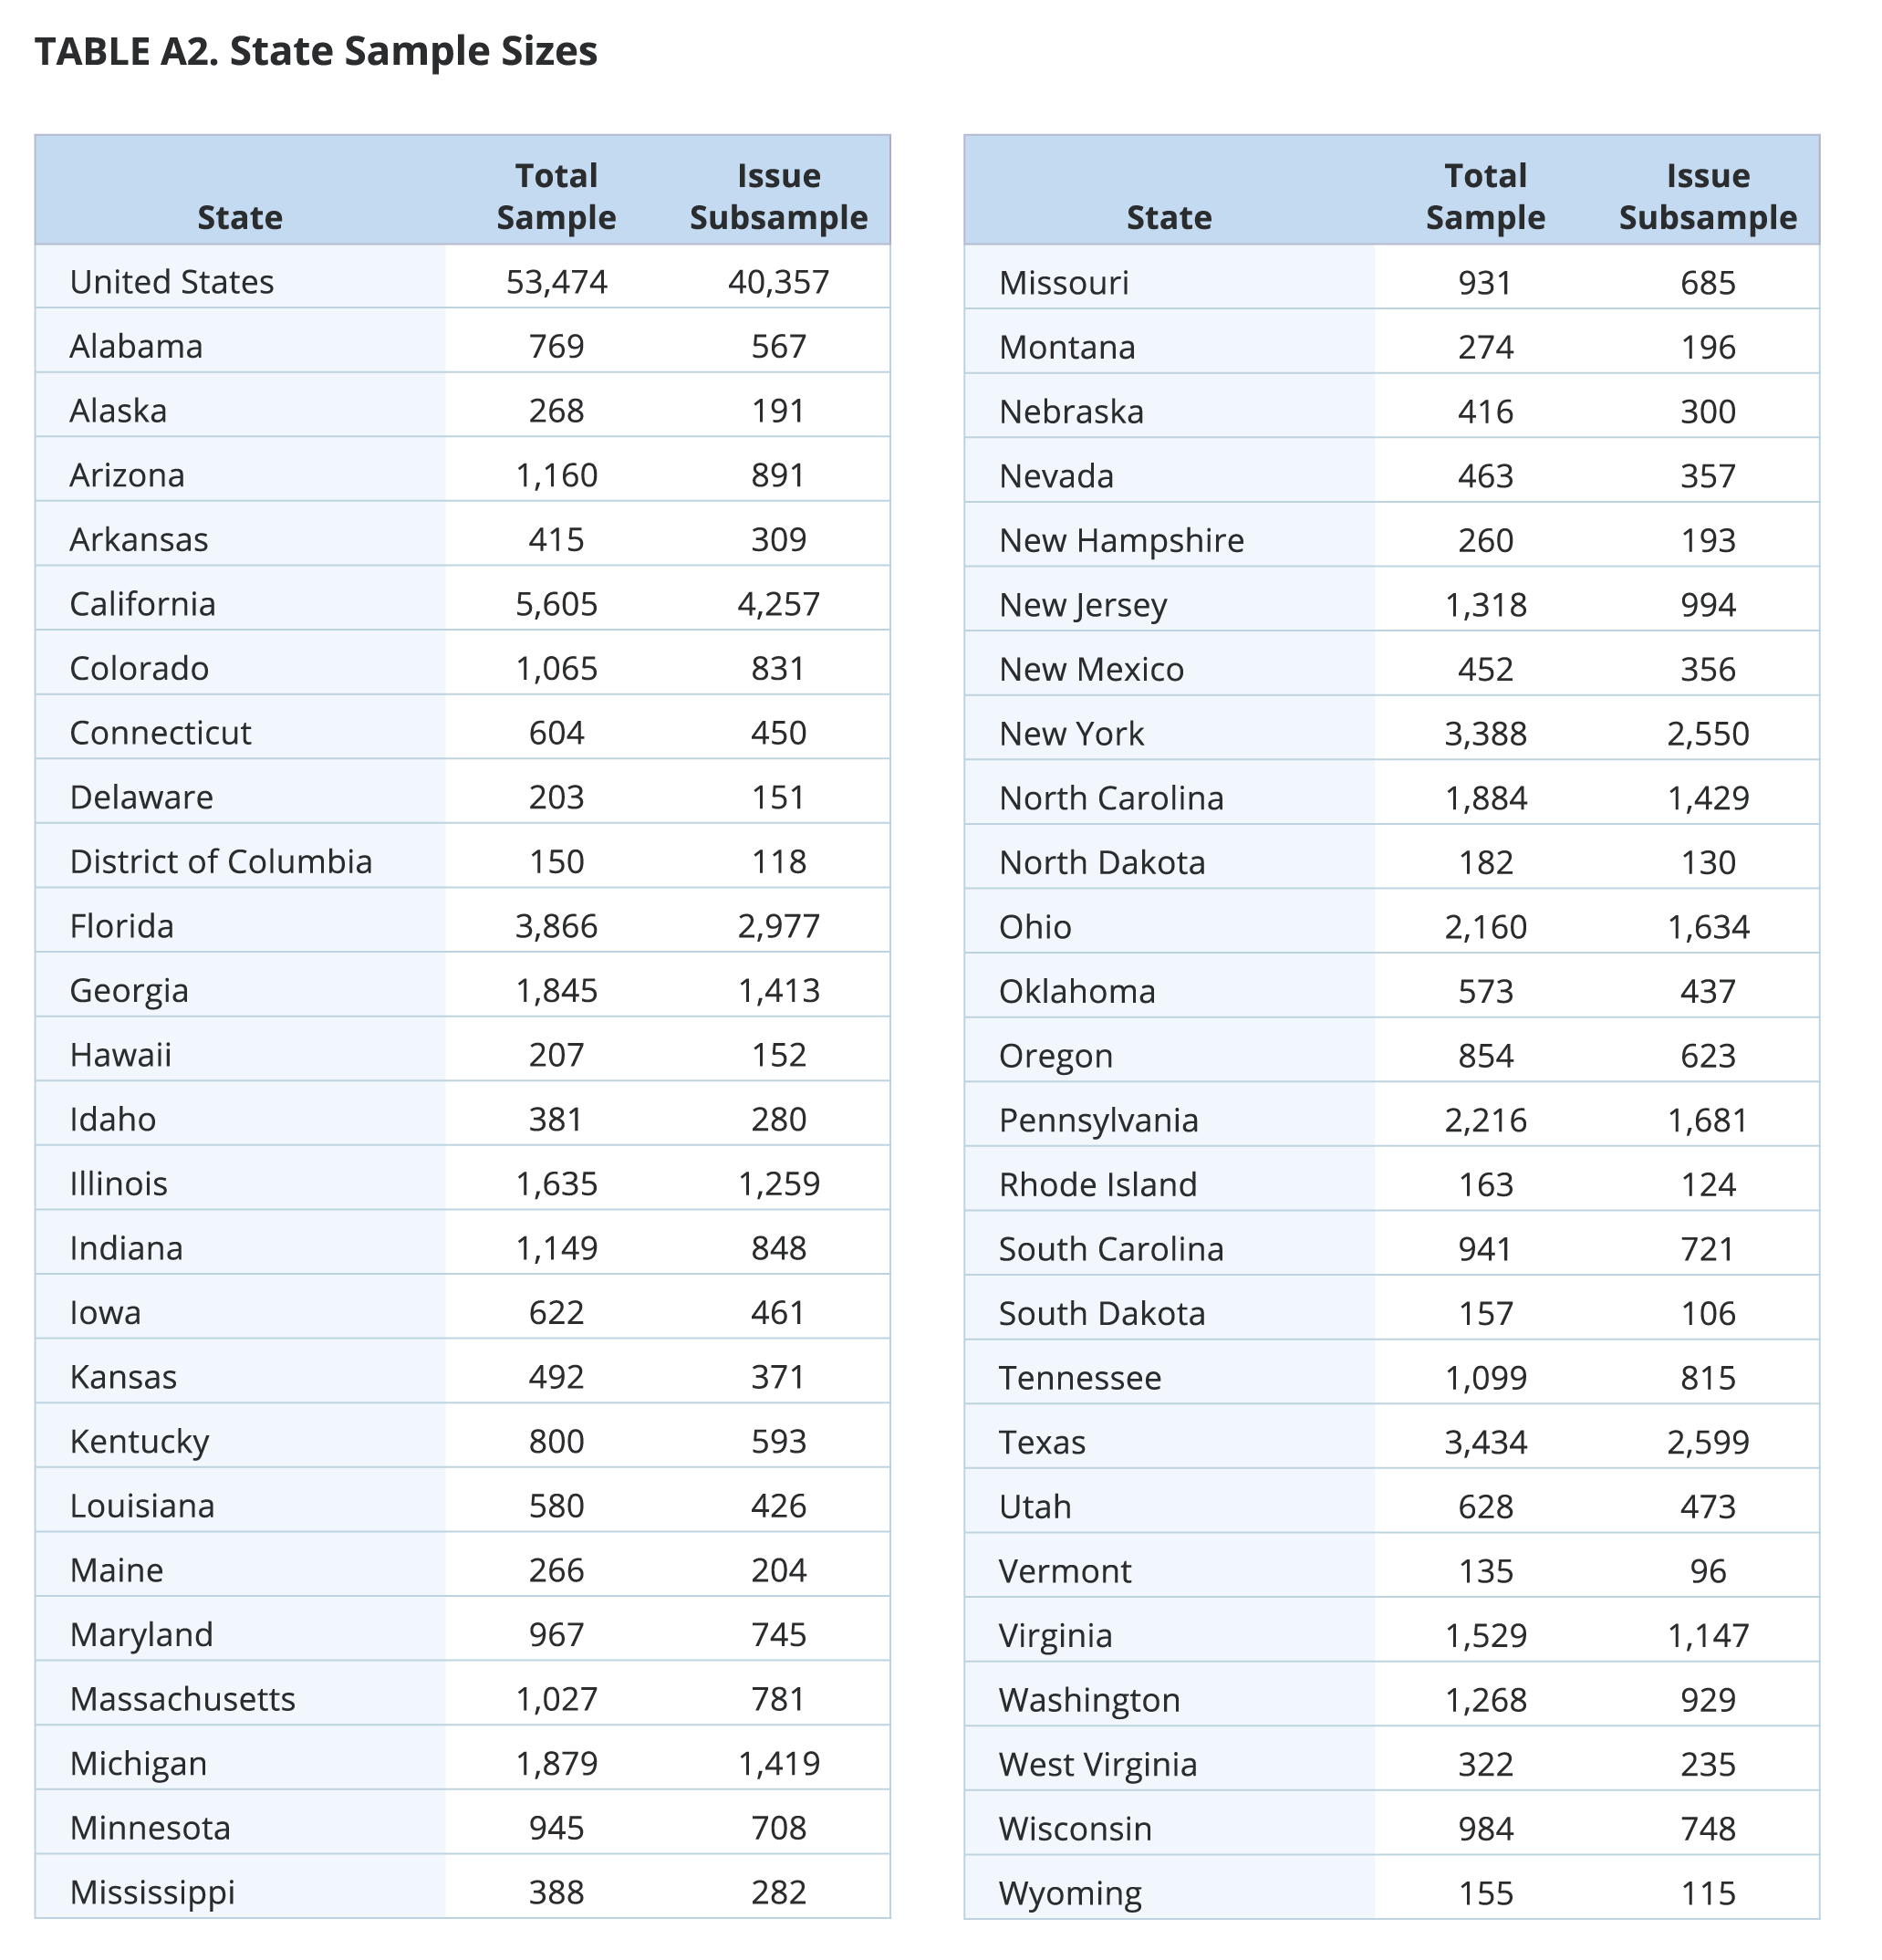
The table below shows the sample sizes for all 50 states for both sample and issue subsample. The margin of error for the total sample is +/- 0.4 percentage points at the 95% level of confidence. The margin of error for issue subsample is +/- 0.6 percentage points at the 95% level of confidence. The design effect for the total sample and the issue subsample is 1.3. In addition to sampling error, surveys may also be subject to error or bias due to question-wording, context, and order effects.
Endnotes
[1] A plurality (47%) of “other nonwhite Protestants” who do not identify as black or Hispanic also rate Trump favorably. This group includes Protestants who identify as Asian or Pacific Islander Americans, Native Americans, multiracial Americans, and those who identify as another race.
[2] Unitarian Universalist sample size is less than 100.
[3] The Survey began on March 26, 2019. Results from March 26-31 are included under April.
[4] Source: PRRI 2019 American Values Survey.
[5] Source: PRRI 2019 American Values Survey and PRRI 2019 American Values Survey Supplement.
[6] Source: PRRI 2019 American Values Survey.
[7] Source: PRRI 2019 American Values Survey and PRRI 2019 American Values Survey Supplement.
[8] Source: PRRI 2019 American Values Survey.
[9] Source: PRRI 2019 American Values Survey and PRRI 2019 American Values Survey Supplement.
[10] Source: PRRI 2019 American Values Survey.
[11] Source: Source: PRRI 2019 American Values Survey and PRRI 2019 American Values Survey Supplement.
[12] Source: PRRI 2019 American Values Survey.
[13] Source: PRRI 2019 American Values Survey and PRRI 2019 American Values Survey Supplement. The sample size of black Americans post-impeachment announcement is 84. Differences in support for impeachment before and after the announcement are statistically significant despite the sample size.
[14] Source: PRRI 2019 American Values Survey.
[15] Source: PRRI 2019 American Values Survey.
[16] Source: PRRI 2019 American Values Survey and PRRI 2019 American Values Survey Supplement.
[17] Source: PRRI 2019 American Values Survey and PRRI 2019 American Values Survey Supplement.
[18] Source: PRRI 2019 American Values Survey and PRRI 2019 American Values Survey Supplement.
[19] Source: PRRI 2019 American Values Survey and PRRI 2019 American Values Survey Supplement.
[20] As of the October 29, 2019 Electoral College Ratings update, the most recent list as of January 2020. https://cookpolitical.com/sites/default/files/2019-11/EC%20102919.pdf
[21] Trump unexpectedly won Michigan by about 0.3% of the vote (around 10,000 votes).