The older you are, the less likely you are to support same-sex marriage. However, new analysis of the American Values Atlas shows just how important age is in determining the likelihood of whether one favors or opposes allowing gay and lesbian couples to marry legally. The unprecedented sample size (40,000 interviews) allows PRRI to explore differences in age at a much more granular level.
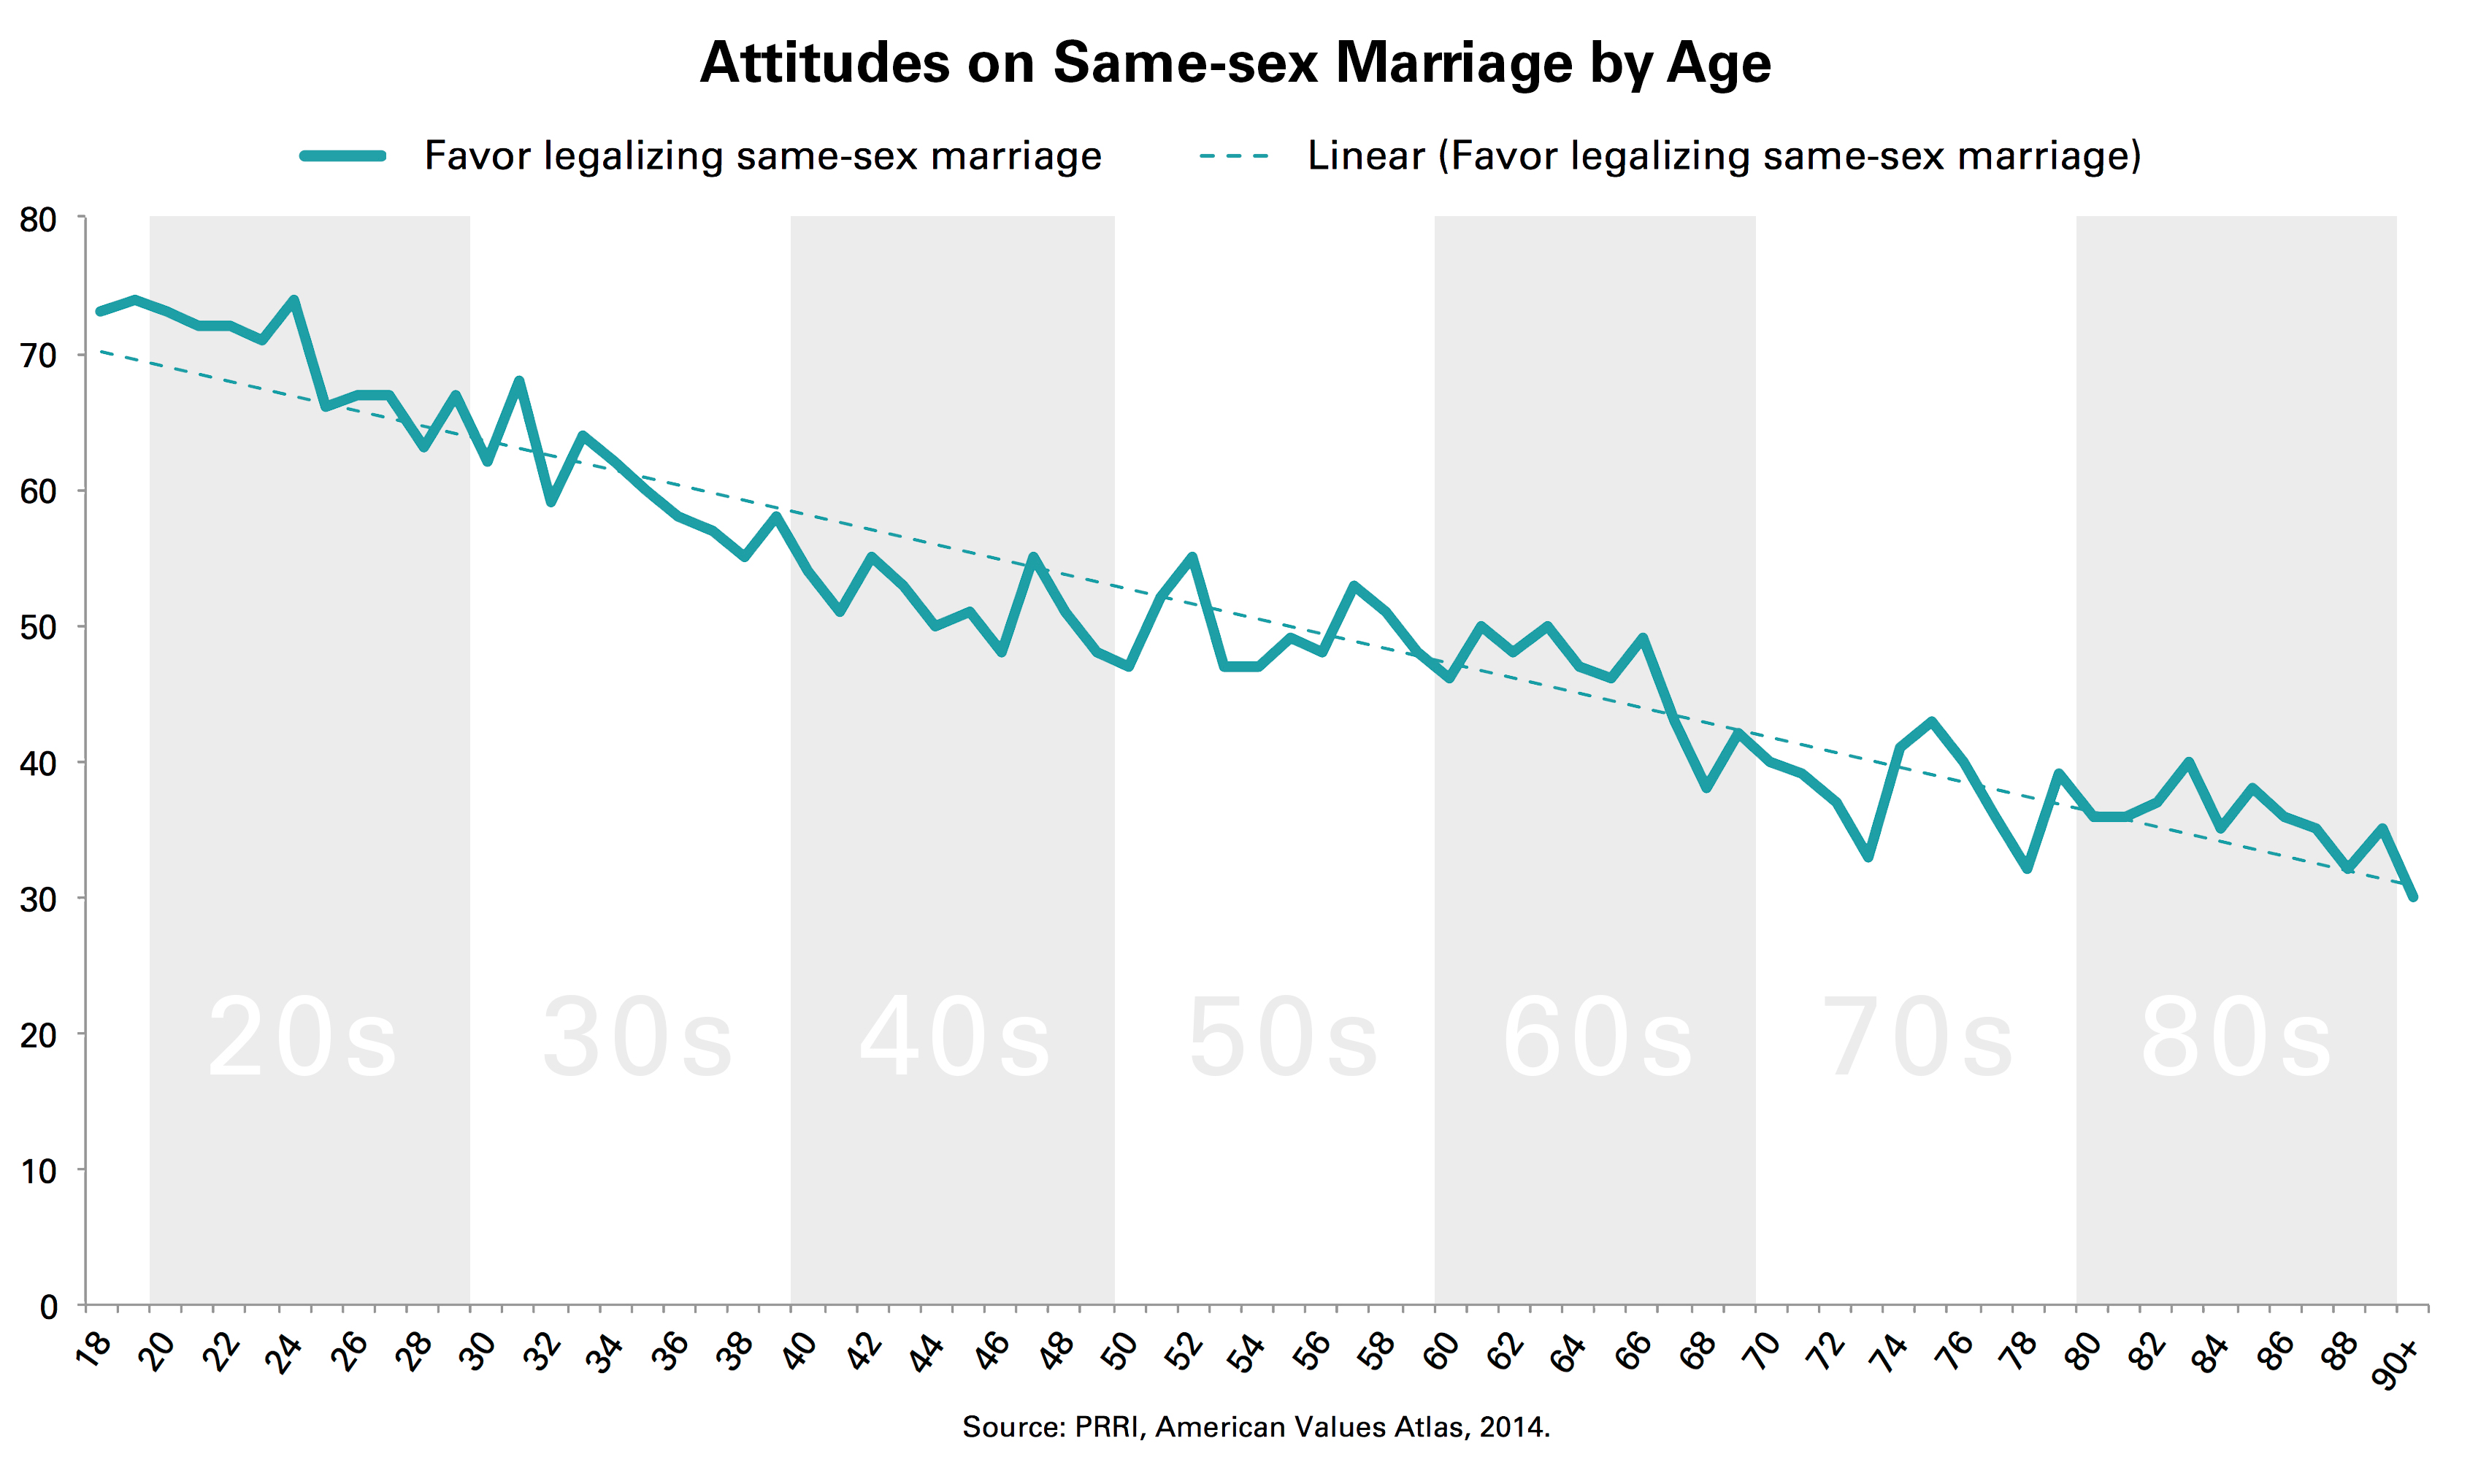
The most supportive Americans are also the country’s youngest adults—nearly three-quarters (73 percent) of 18-year-olds favor legalizing same-sex marriage. From there, support drops—about seven-percentage points for every ten years.
Twenty-somethings strongly support legalizing same-sex marriage: Even among young adults in their late 20s, support remains robust. More than six in ten (63 percent) 28-year-olds favor same-sex marriage.
Americans in their 30s remain quite supportive of same-sex marriage. At age 38, a majority of the public expresses support for allowing gay and lesbian couples to marry.
Things start to turn among Americans in their late forties and fifties, with majority support teetering until finally falling below majority territory. Americans in their 50s are fairly divided over the issue of same-sex marriage, but are slightly more likely to oppose the issue than to support it. Once in their late 60s, Americans express robust opposition and generally weak support. Only 38 percent of 68-year-olds favor same-sex marriage, while 53 percent oppose it. Opposition is strongest with Americans over the age of 70, with fewer than one-third (32 percent) of 78-year-olds favor same-sex marriage.
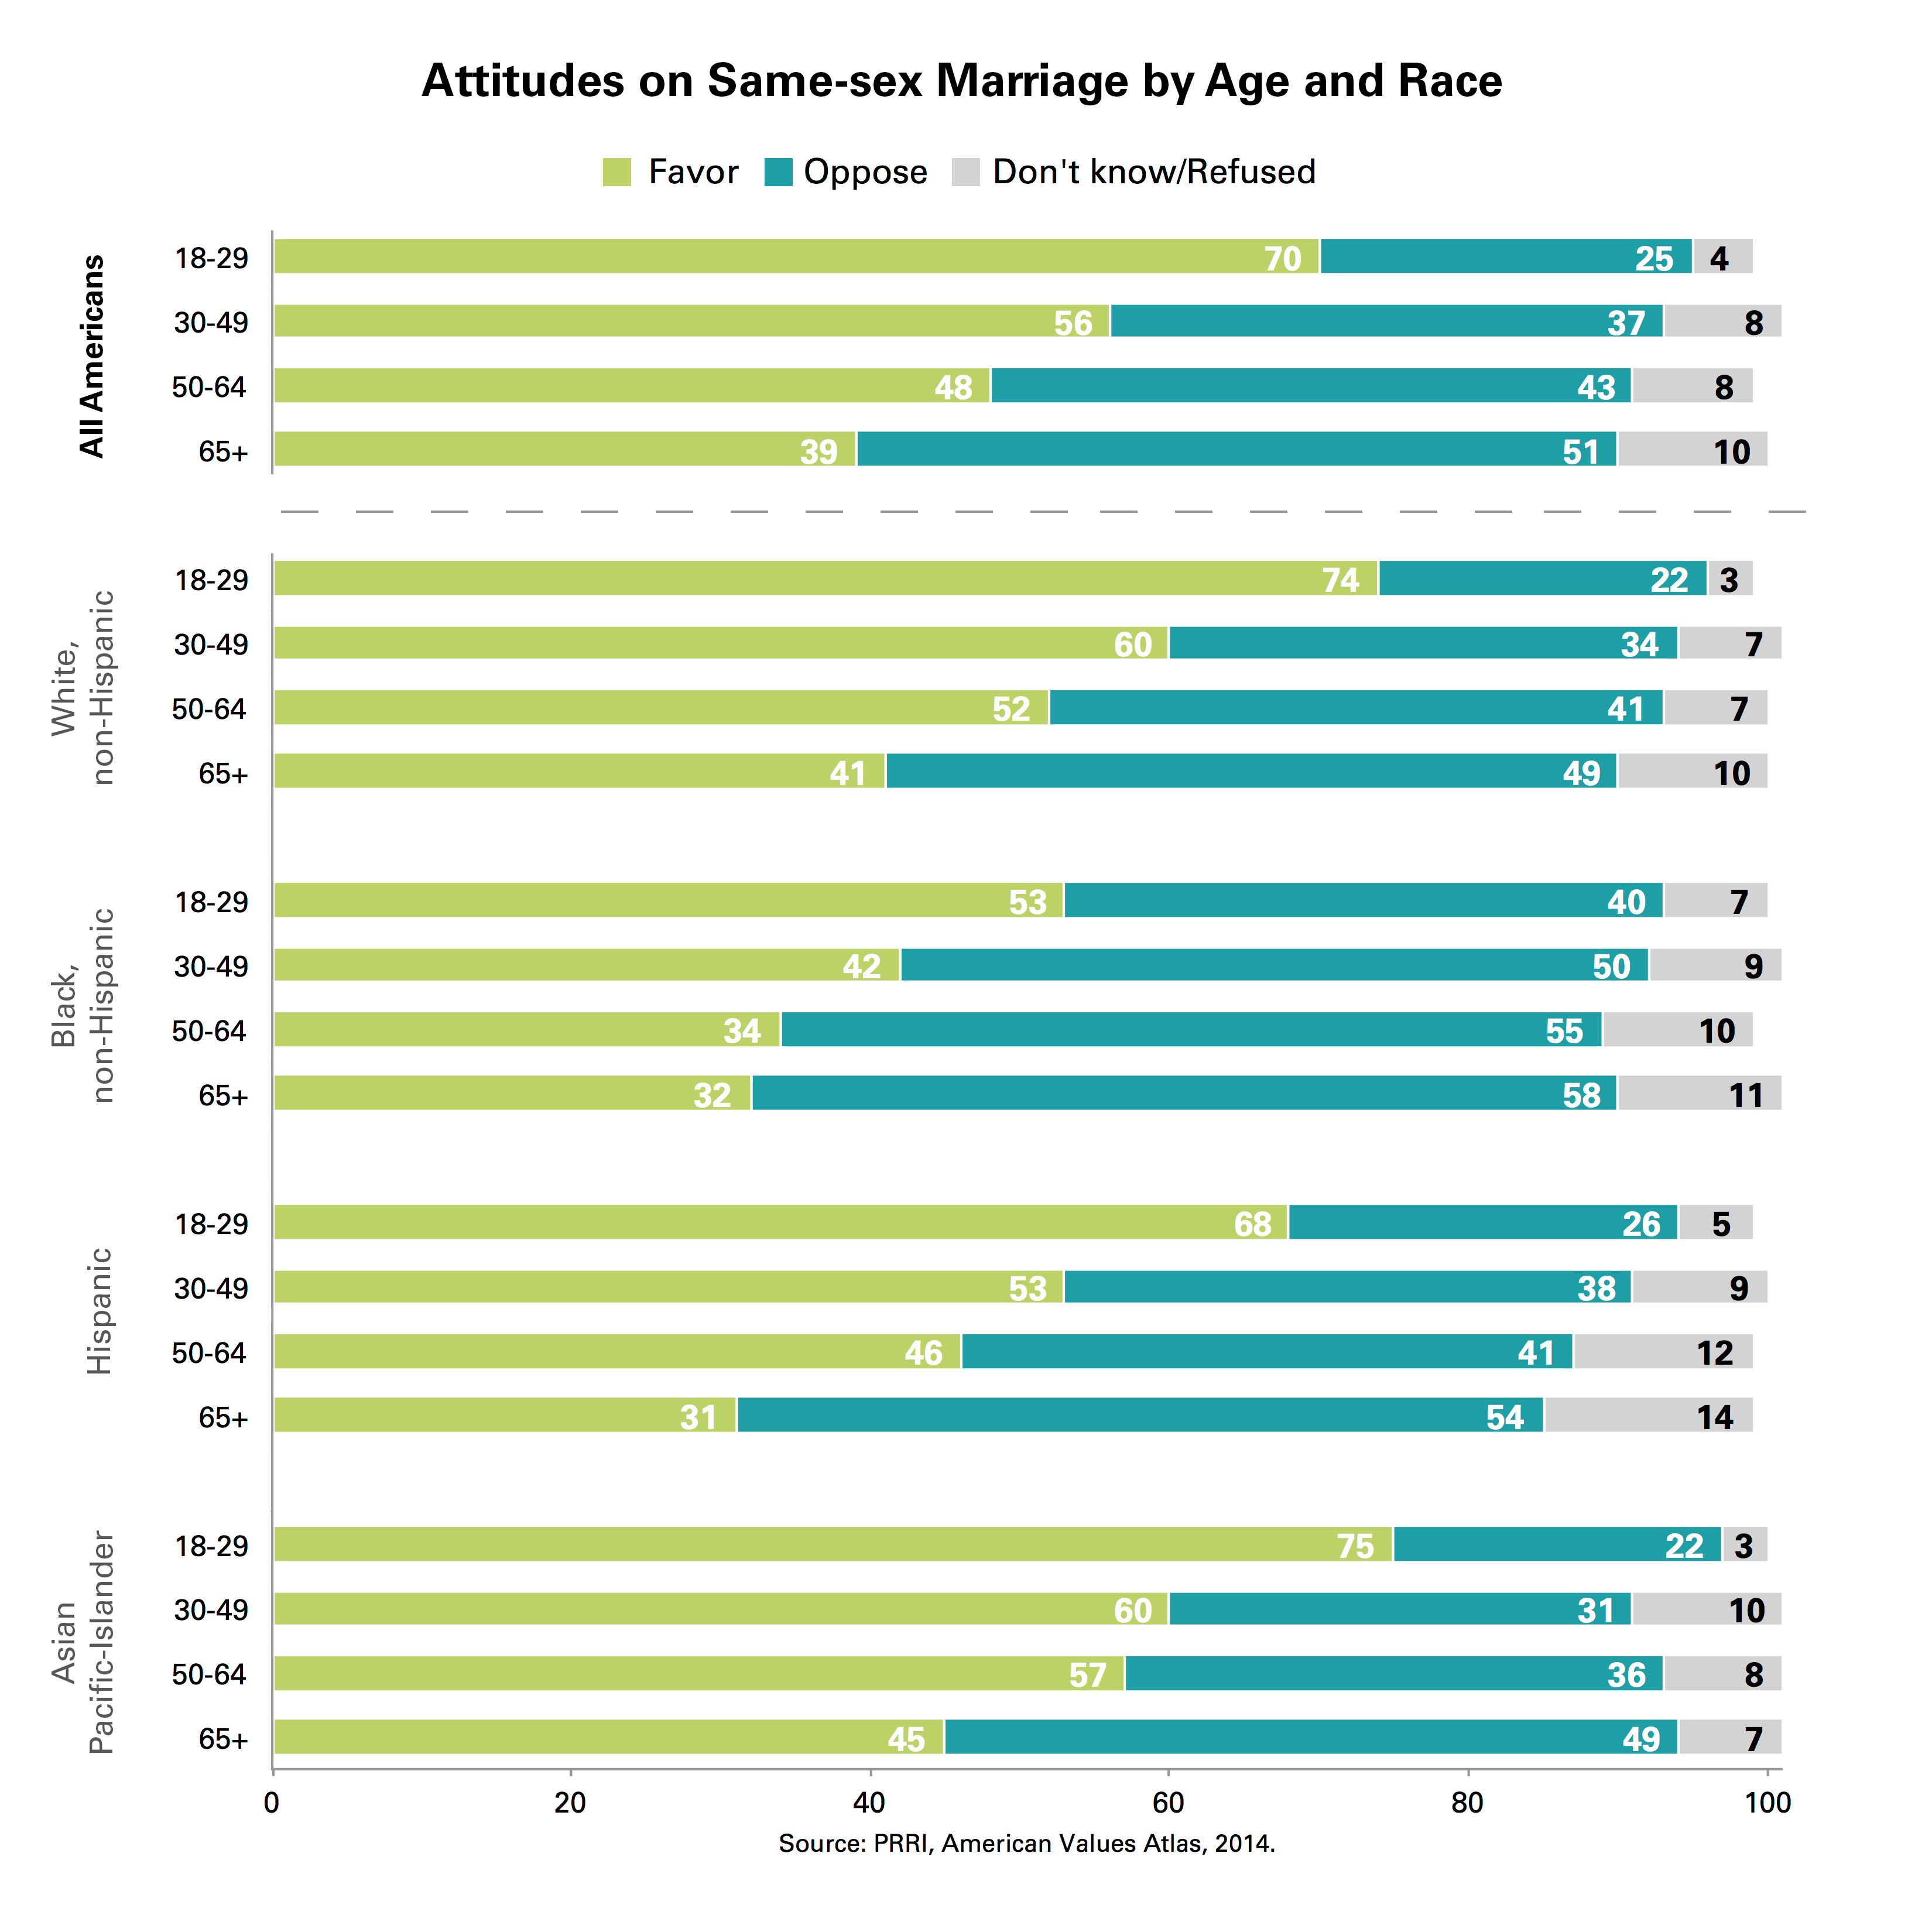
The generational patterns are also evident across different racial and ethnic groups. There is at least a 20-percentage point gap between the youngest and oldest generation on support for same-sex marriage across all racial groups.
Generational support for same-sex marriage between white and Asian-Pacific Islander (API) Americans is nearly identical. Seventy-four percent of white and 75 percent of API young Americans, age 18-29, are in favor legalizing same-sex marriage. Conversely, 41 percent of white and 45 percent of API seniors, age 65 and older, register support.
The age gap is notable, but more modest, among black Americans, mostly driven by the lower overall support among young blacks. Only 53 percent of young black Americans favor same-sex marriage, compared to one-third (32 percent) of black seniors.
At 68 percent, young Hispanics show similar support for same-sex marriage as young Americans overall, but support drops among Hispanic seniors—only about three in ten (31 percent) say the support legalizing same-sex marriage.
For more public opinion on same-sex marriage, see PRRI’s “Everything You Need to Know about Same-sex Marriage for the Upcoming SCOTUS Case.”