In commemoration of National Hispanic Heritage Month, which takes place September 15-October 15, this Spotlight Analysis explores the political and religious make up of Hispanic Americans. In recent elections, greater attention has been paid to the Hispanic vote as Hispanic Americans have become the largest ethnic minority group in the United States. Although Hispanic Americans make up less than 20% of the population, they are an important portion of the American electorate.
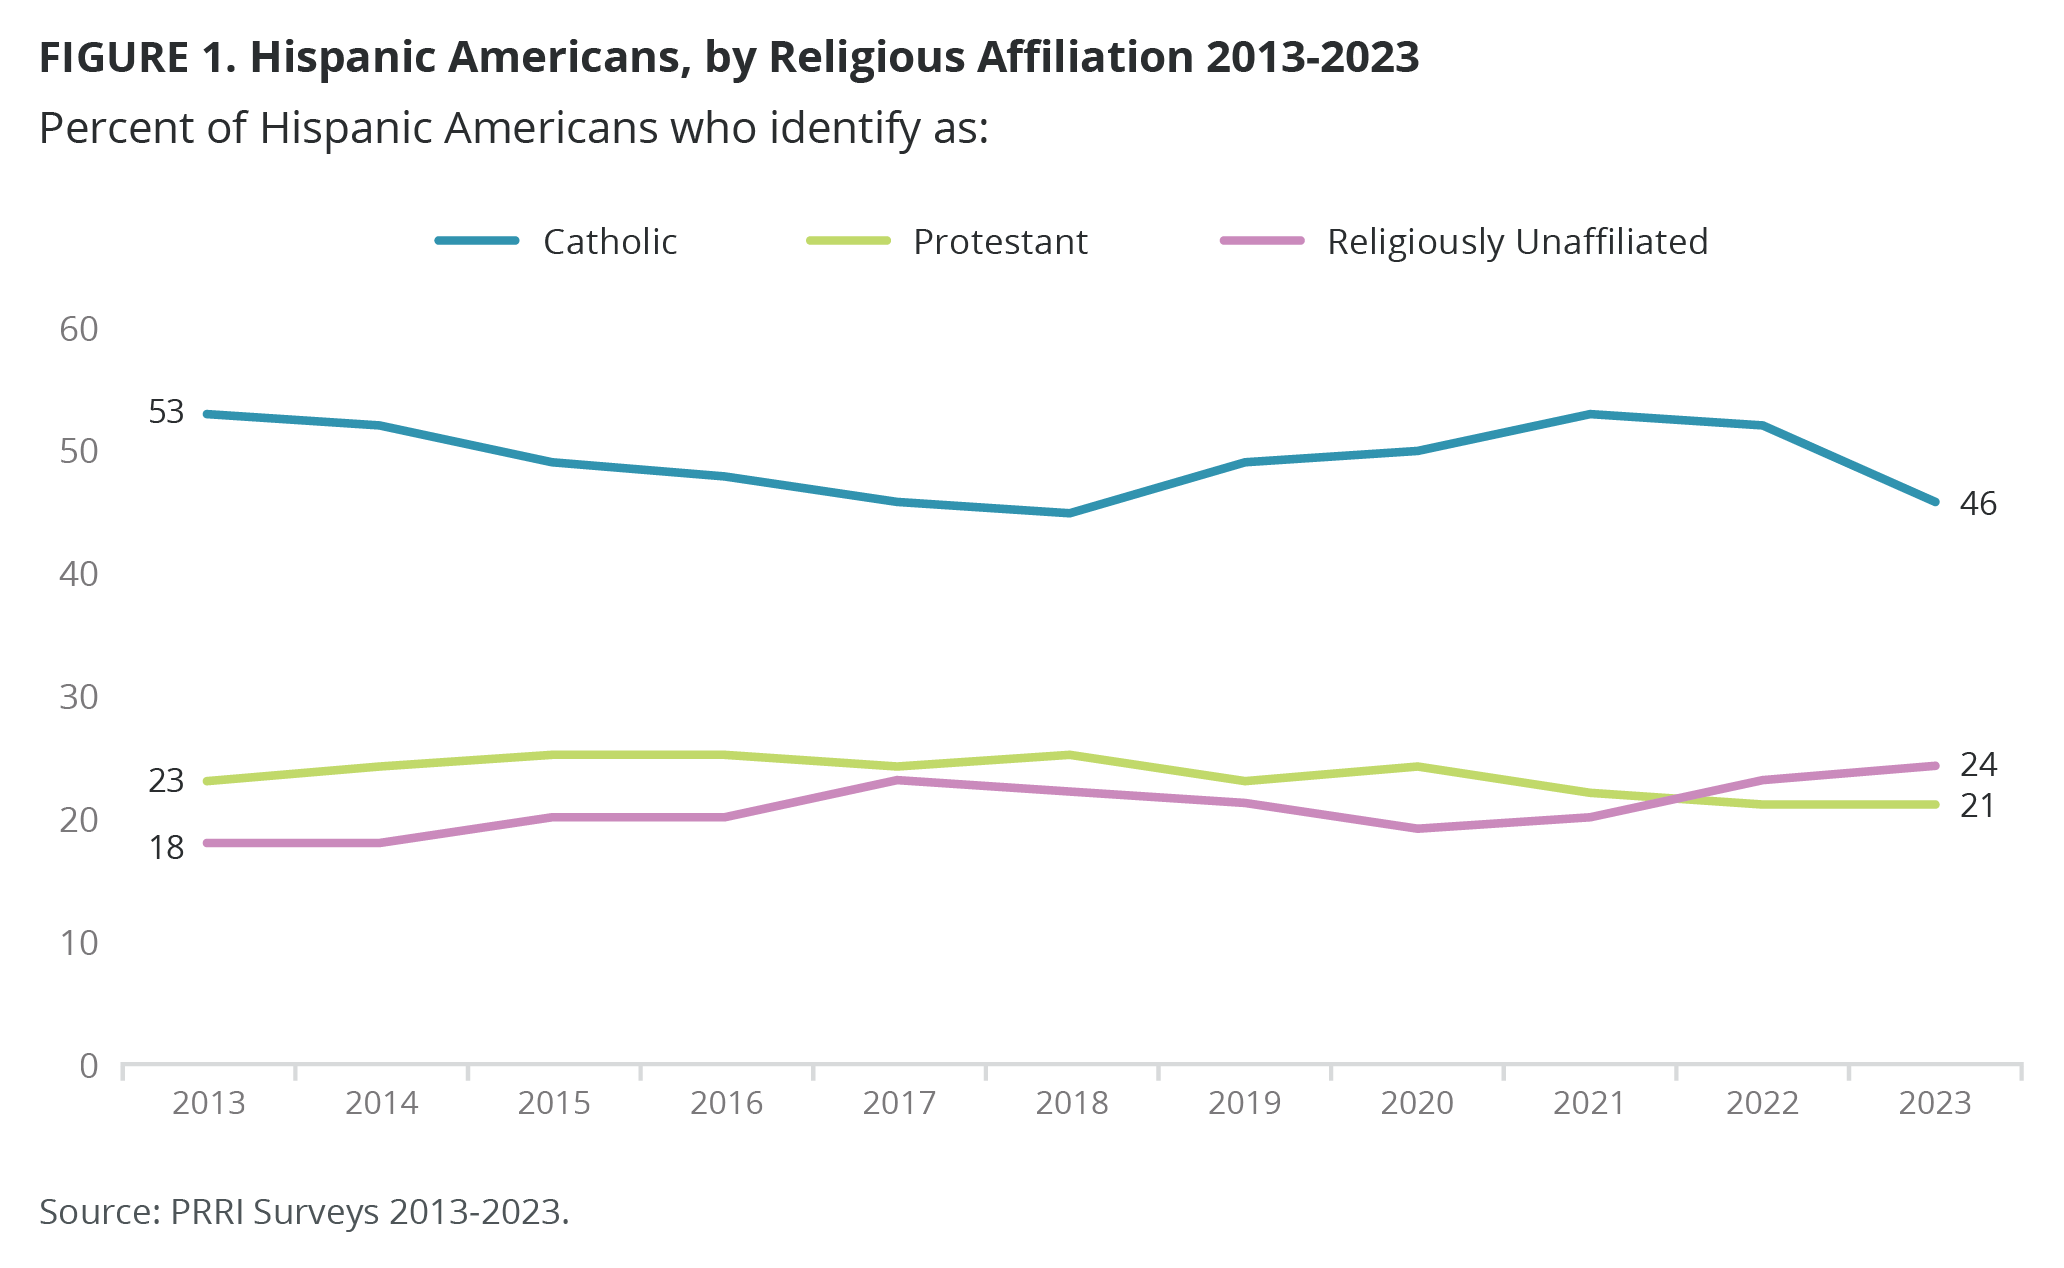
According to PRRI surveys, including the recent Climate Change survey, the percentage of Hispanic Americans who identify as religiously unaffiliated has grown consistently over the past decade from 18% in 2013 to 24% in 2023. Those who identify as Christian have decreased slightly from 79% in 2013 (including 53% who were Catholic and 23% who were Protestant) to 73% today (46% who identify as Catholic and 21% who identify as Protestants).
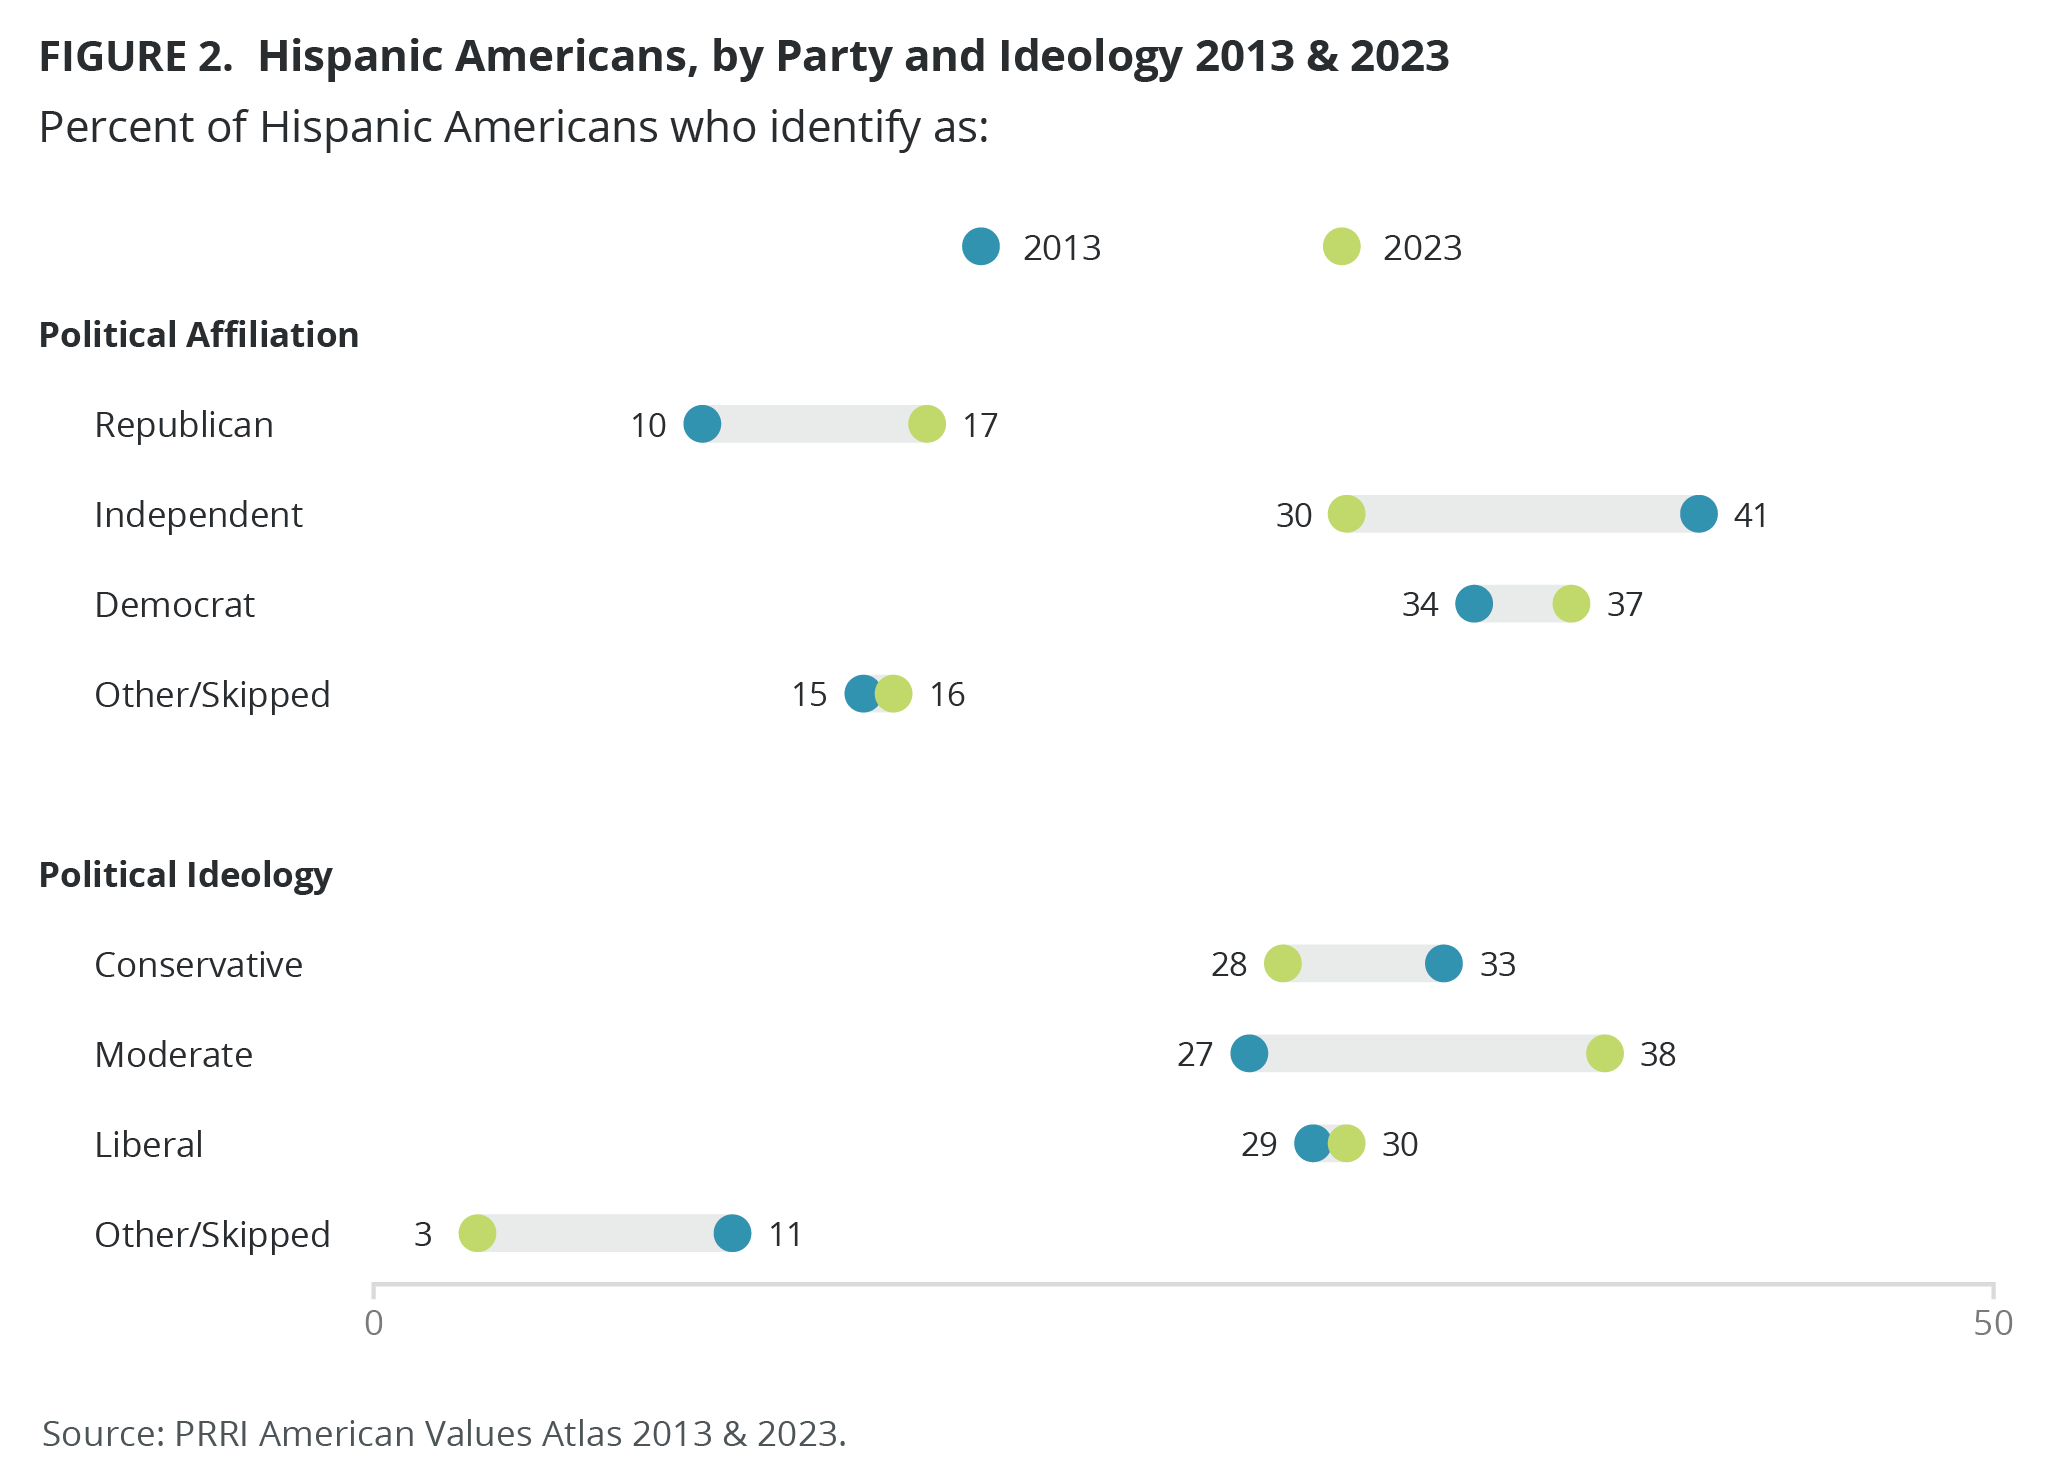
When it comes to partisanship, more than one-third of Hispanic Americans identify as Democrats (37%), three in ten identify as independent (30%), and 17% identify as Republicans. Hispanics’ political identification has changed significantly from a decade ago. Hispanic Americans remain similarly likely to identify as Democrat (37% in 2023 vs. 34% 2013), but have grown more likely to identify as Republican (17% in 2023 vs. 10% in 2013) and less likely to identify as independent (30% in 2023 vs. 41% in 2013). Apart from liberal Hispanics (30% in 2023 vs. 29% in 2013), political ideology among Hispanic Americans has also shifted. Hispanic Americans are more likely to be moderate today than they were in 2013 (38% vs. 27%), and five percentage points less likely to be conservative (28% in 2023 vs. 33% in 2013).
Religiously Unaffiliated Hispanic Americans
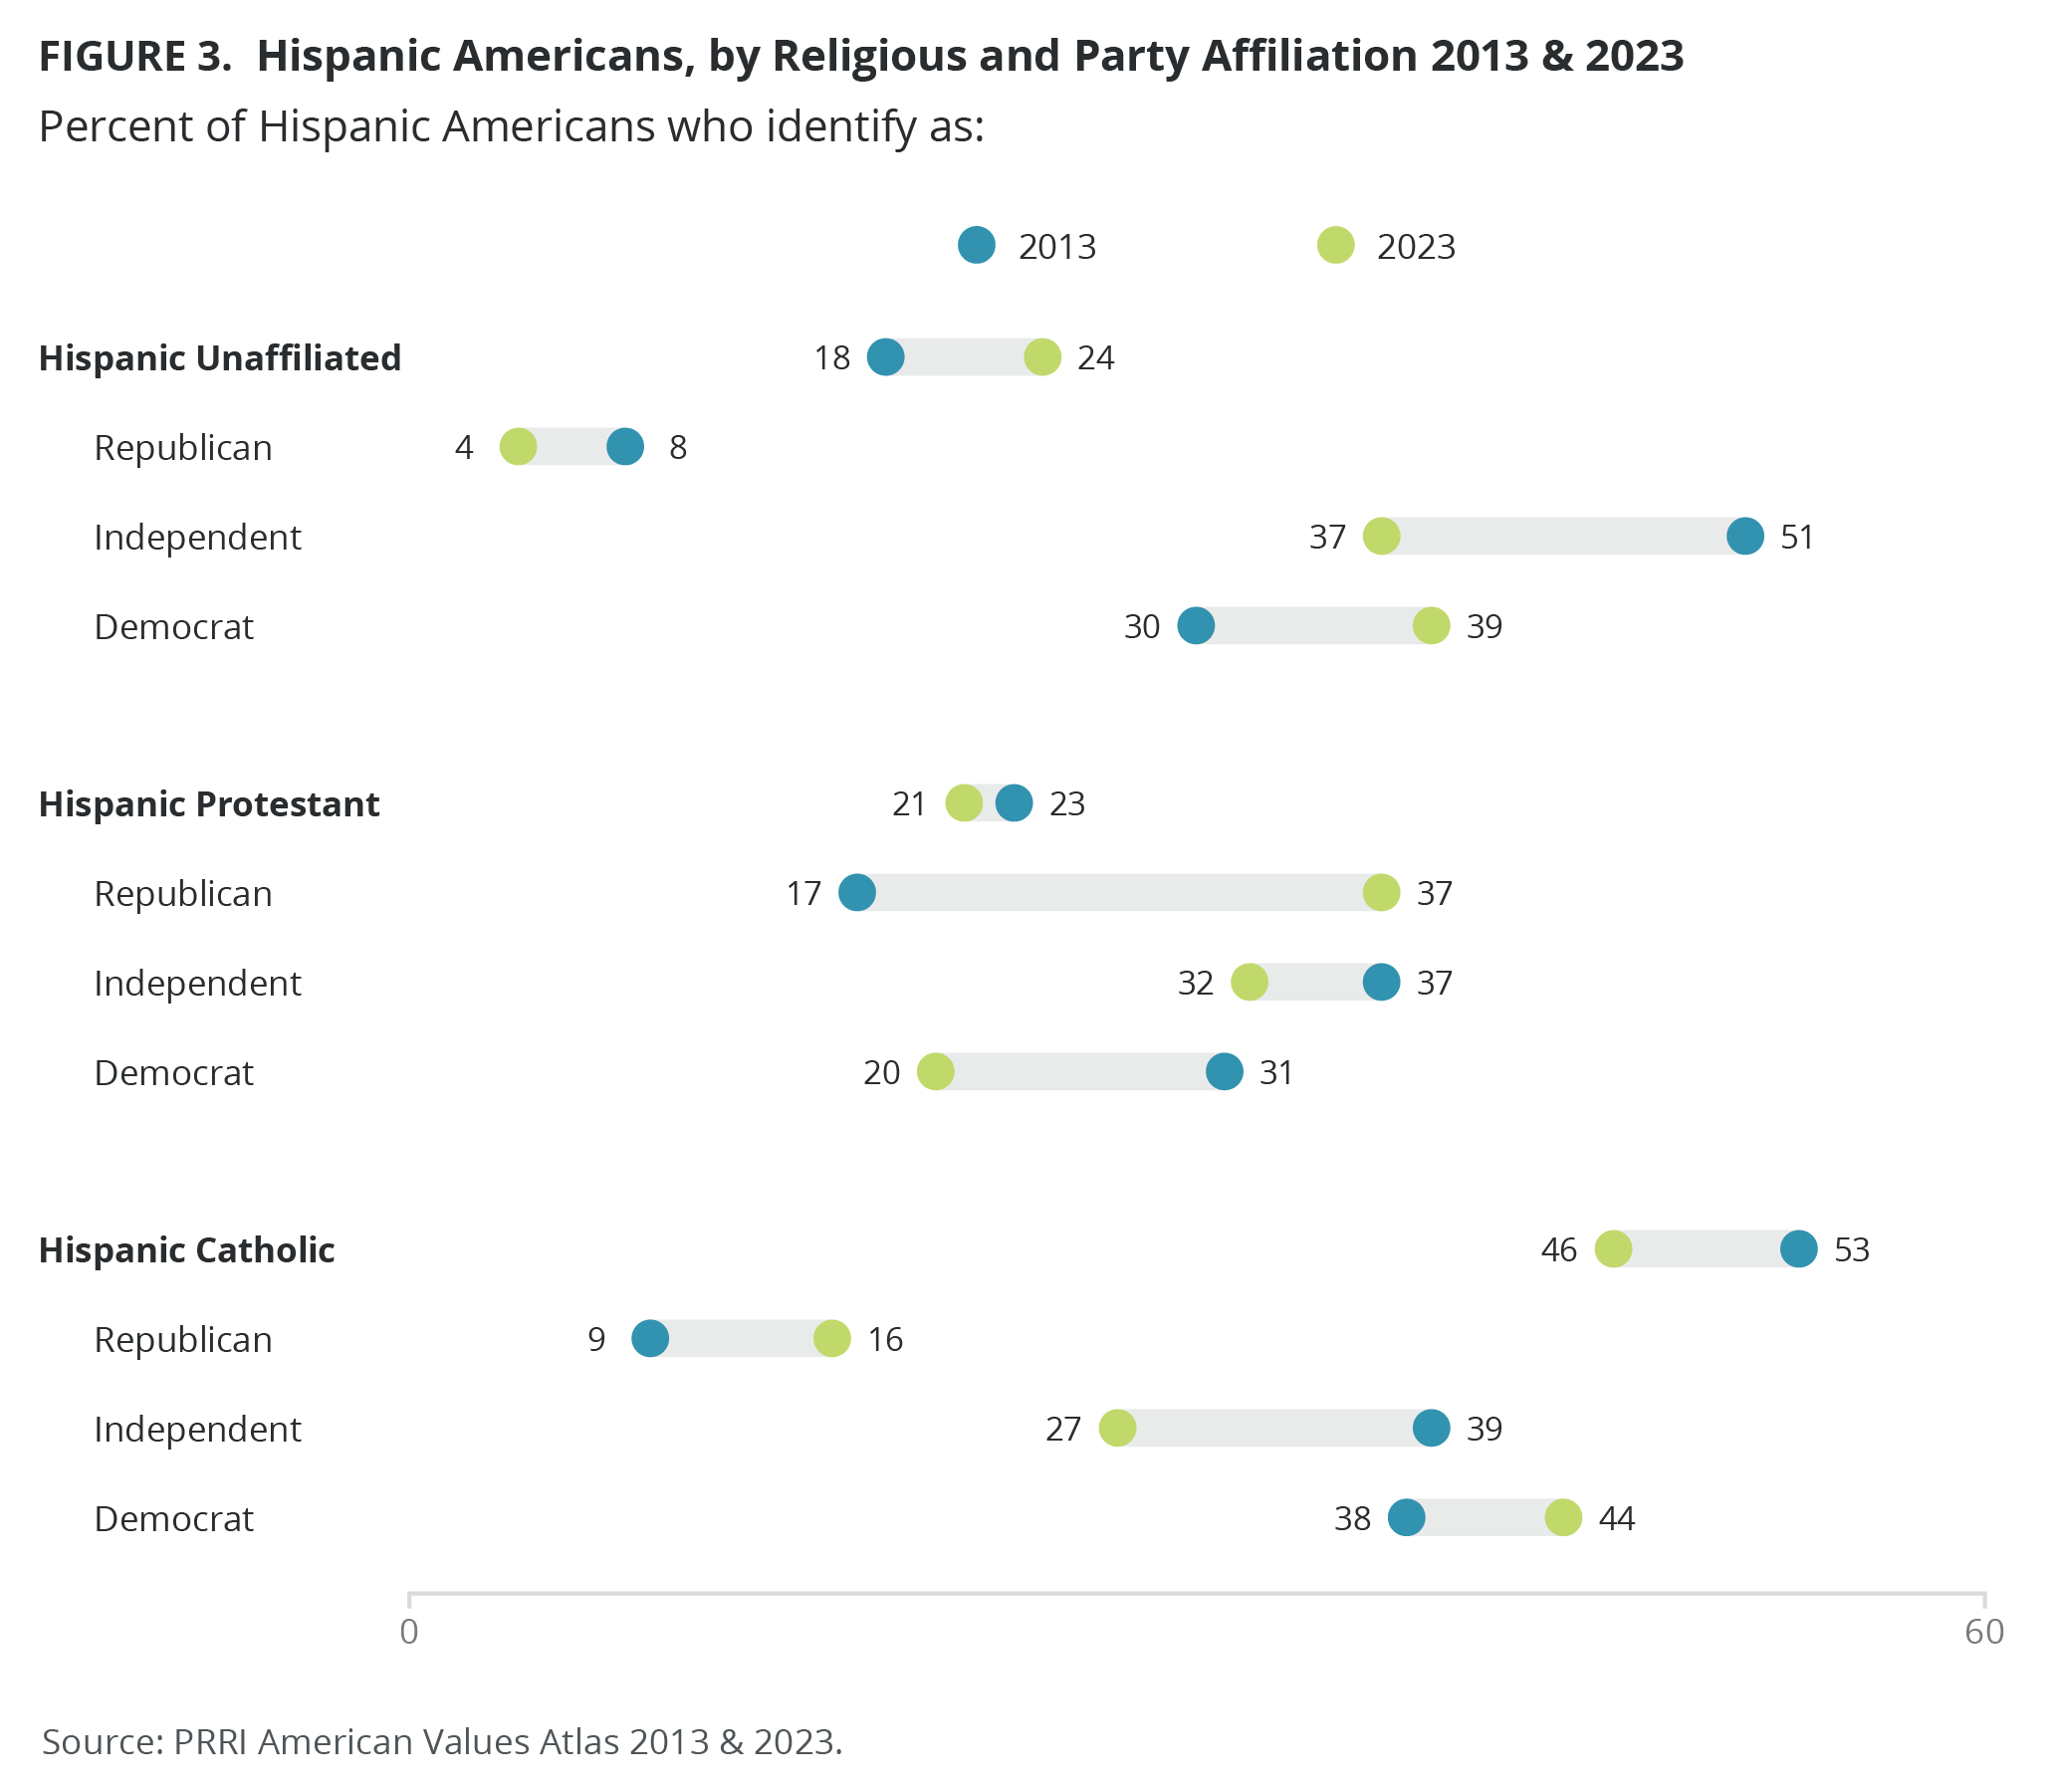
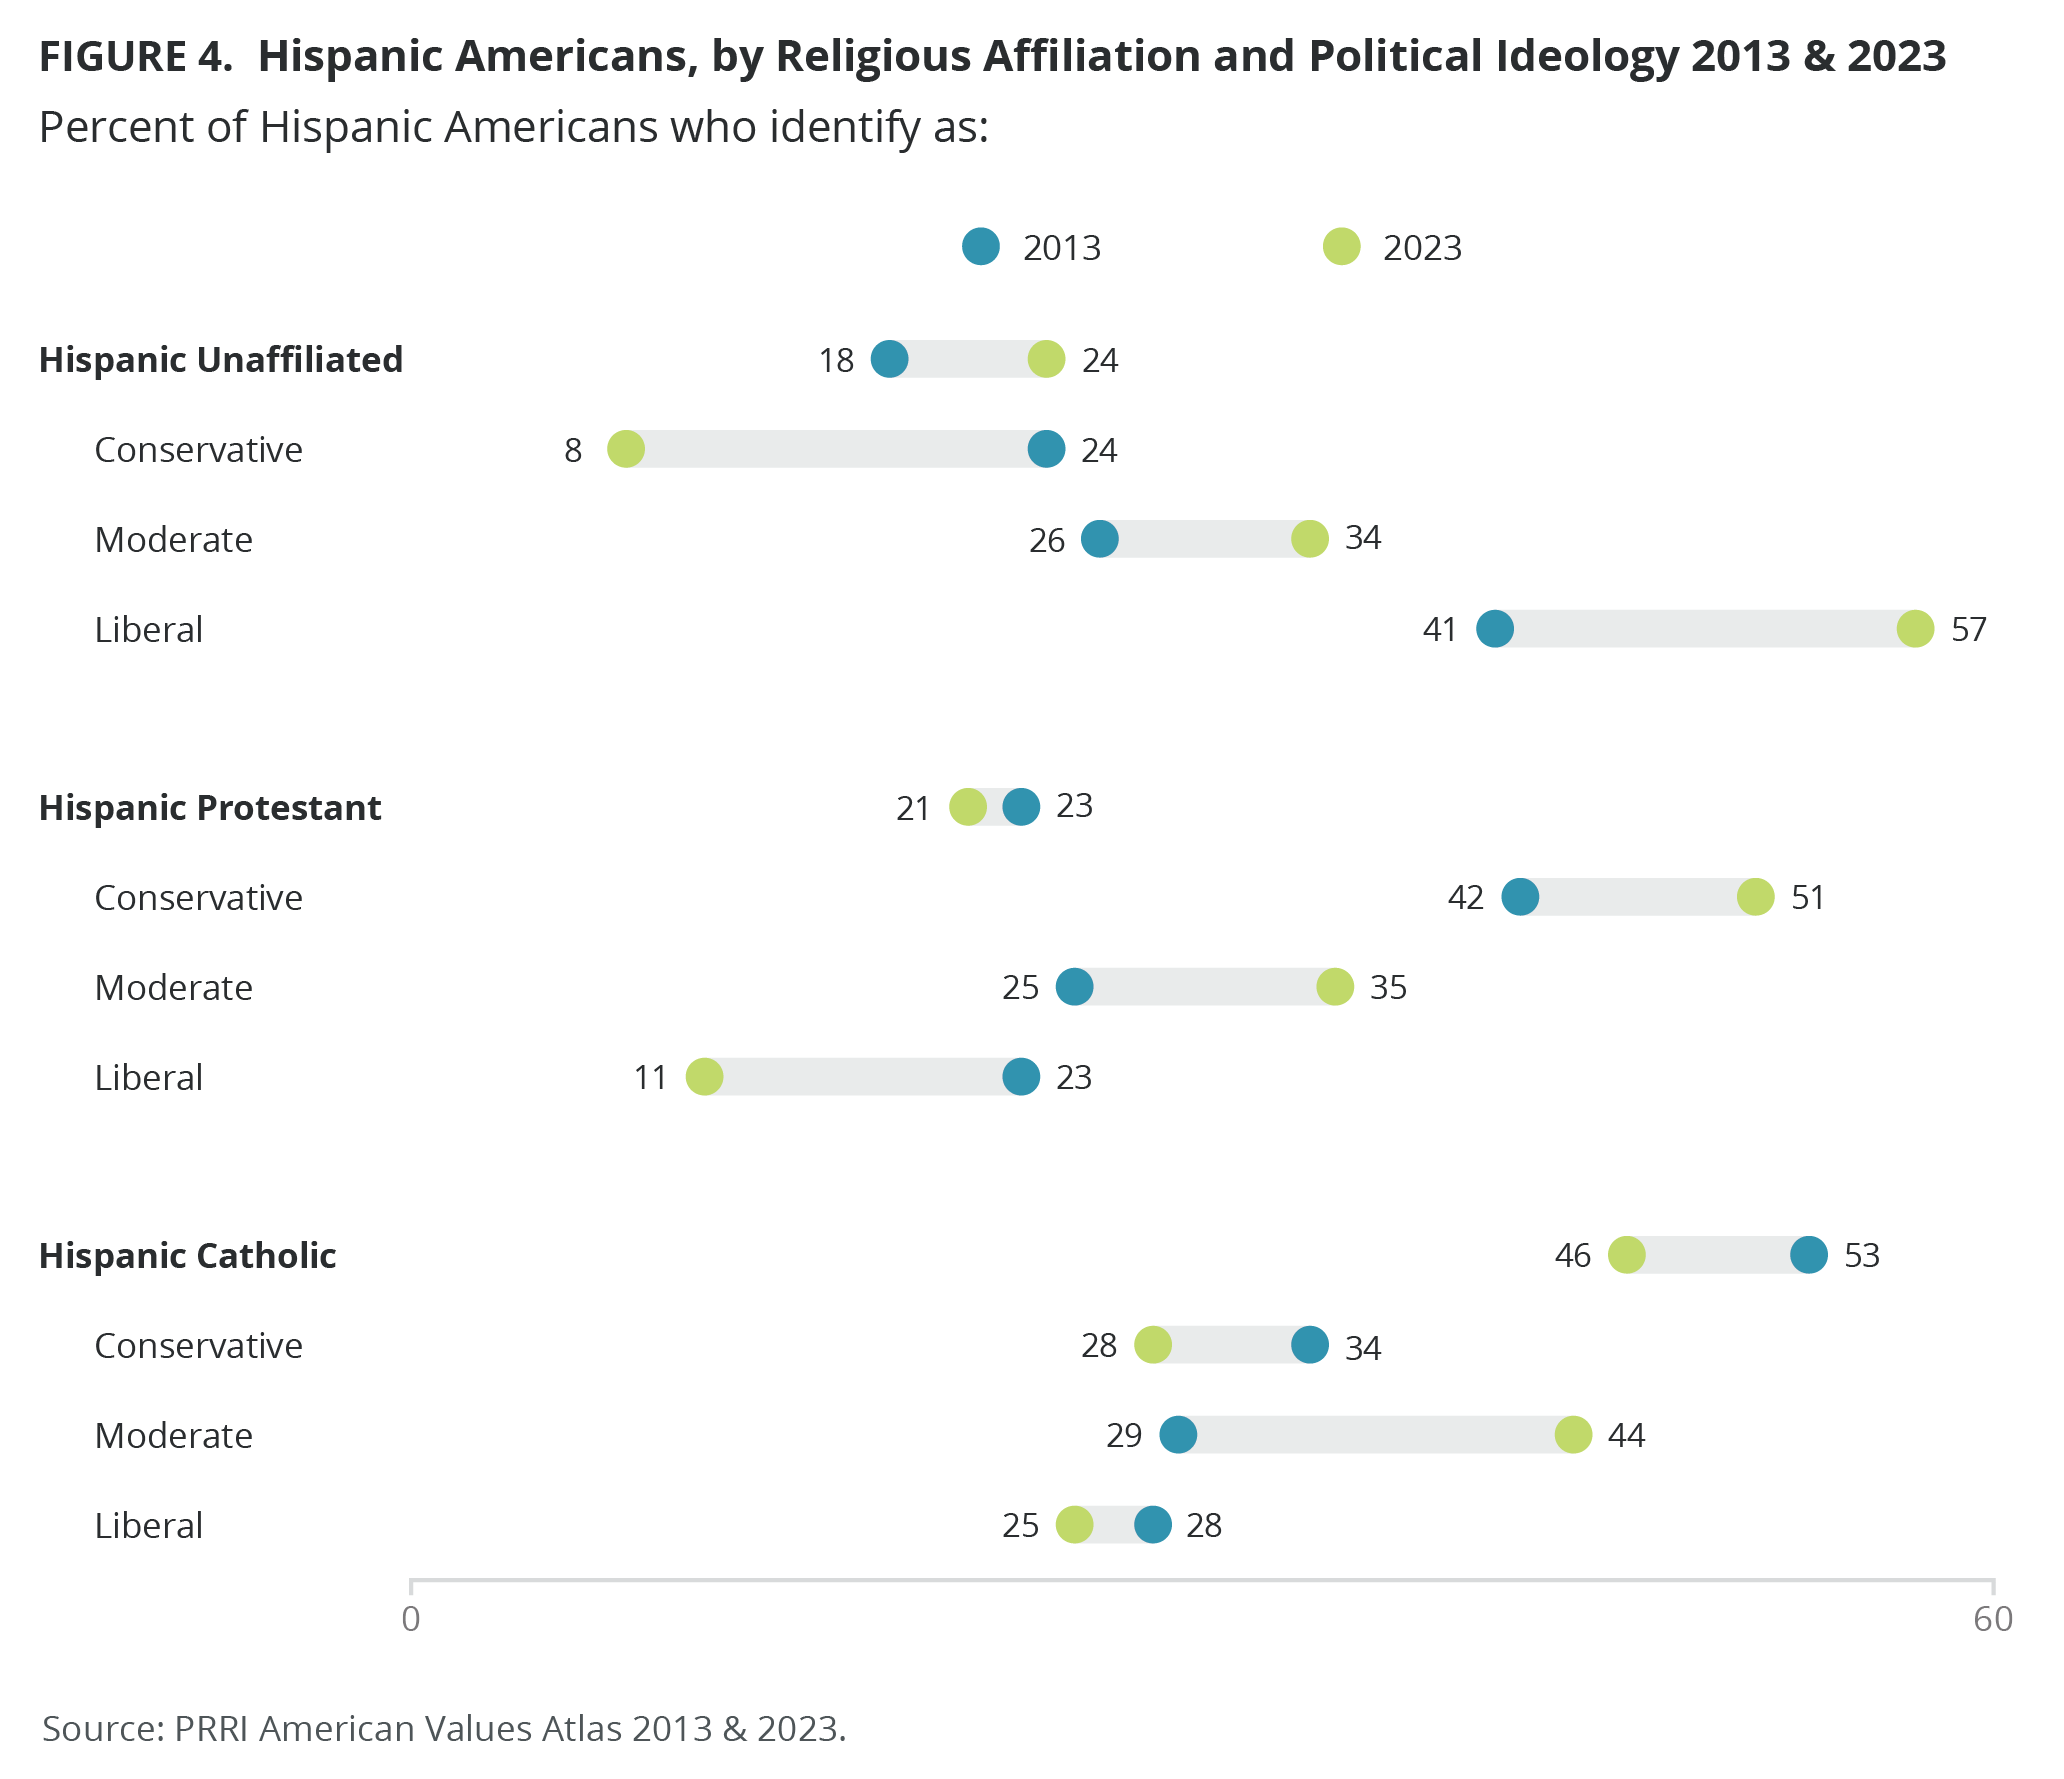
Data from the PRRI American Values Atlas show that in 2023, 39% of Hispanic Americans who are religiously unaffiliated identify as Democrats, an increase of nine percentage points from 30% in 2013. By contrast, unaffiliated Hispanic Americans who identify as Republicans and independents have declined from 8% and 51%, respectively, in 2013 to 4% and 37%, respectively, in 2023. Similarly, unaffiliated Hispanic Americans are three times less likely to identify as conservative today than they did in 2013 (8% vs. 24%), growing more moderate (from 26% to 34%) and liberal (from 41% to 57%) during this period.
Hispanic Protestants
Hispanic Protestants have shifted significantly in their political affiliation over the past decade. Hispanic Protestants who identify as Republicans more than doubled from just 17% in 2013 to 37% in 2023, while the percentage of Hispanic American Democrats shrunk by 11 percentage points (20% in 2023 vs. 31% in 2013) and independents dropped by 5 percentage points (32% in 2023 vs 37% in 2013). Similarly, while Hispanic Protestants who identified as conservative were a minority in 2013 (42%), today they are a majority (51%). Also, the percentage of moderate Hispanic Protestants has grown from 25% in 2013 to 35% in 2023. Accordingly, Hispanic Protestants are now half as likely to identify as liberal than they were a decade ago (11% in 2023 vs. 23% in 2013).
Hispanic Catholics
Among Hispanic Catholics, identification with both parties has grown. In 2013, 9% and 38% of Hispanic Catholics identified as Republicans or Democrats, respectively; today representation for both parties has grown to 16% for the Republican Party and 44% for the Democratic party. Hispanic Catholics who identify as independents, by contrast, have declined from 39% in 2013 to 27% in 2023. Hispanic Catholics are six percentage points less likely to identify as conservative today than they were a decade ago (28% in 2023 vs. 34% in 2013), instead, they are significantly more likely to identify as moderate (44% vs. 29%). Meanwhile, the percentage of Hispanic Catholics who consider themselves liberal remains stable (25% in 2023 compared to 28% in 2013).
