

Political battles over education have become increasingly heated, with efforts to ban books teaching African American history on the rise, and even the College Board changing its pilot AP class on African American Studies due to pressure from Governor Ron DeSantis of Florida. Despite these incidents, there is public support for racial justice policies relating to education across political and racial lines.
While efforts to ban books have risen dramatically in 2022, PRRI’s 2022 Social Networks Survey show that they are very unpopular with nearly nine-in-ten Americans opposing “banning books that include depictions of slavery from being taught in public schools” (89%), compared with a small minority in favor (9%). This unpopularity remains consistent when the population is broken down by political affiliation, with the vast majority of Republicans (90%) and Democrats (90%) opposing. Interestingly, non-white Republicans (15%) are twice as likely as white Republicans (7%) to support this policy.[1]
When looking at how the history of slavery, racial violence, and discrimination is taught, the support for the statement “efforts to tell the truth about the history of slavery, violence, and discrimination against racial minorities” mirrors the opposition to book bans. PRRI-EPU’s 2022 Religion and Inclusive Public Spaces Survey show that an overwhelming majority of Americans (90%) support the teaching of this sensitive topic compared with just seven percent who are opposed. While support for this type of education is lower among Republicans (84%) than Democrats (95%), there are no differences within white and non-white partisans.
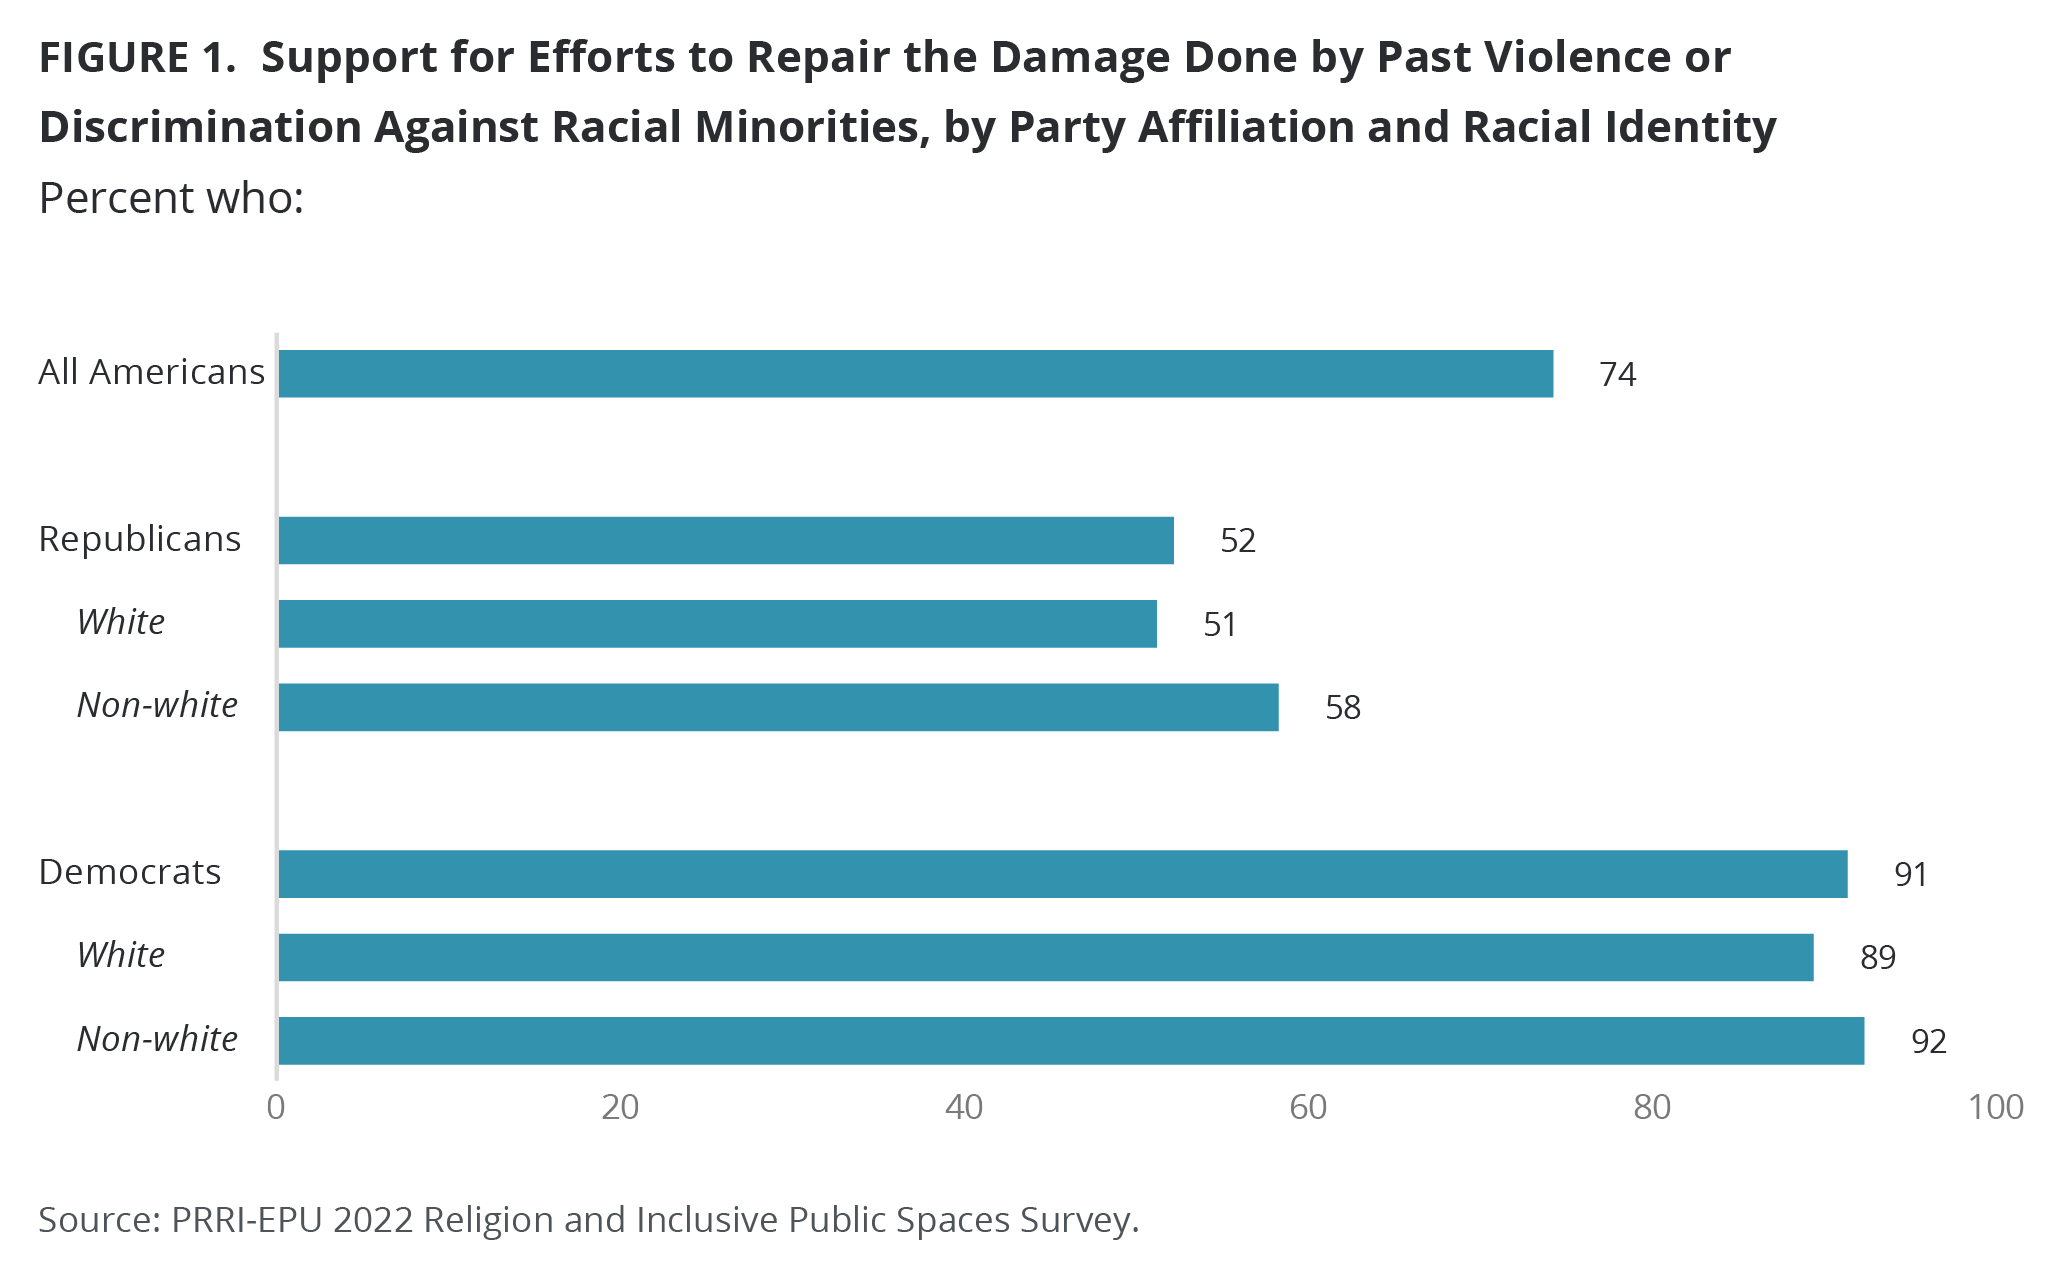
Attitudes begin to shift when people are asked about their reactions to certain actionable policies regarding racial justice. When it comes to “efforts to repair the damage done by past violence or discrimination against racial minorities in your community,” there is still strong support (74%), but there is also a notable increase in opposition (24%). Looking at the differences among partisans, the gulf between them is incredibly pronounced, with a slim majority of Republicans (52%) supporting these policies compared with the overwhelming majority of Democrats (91%). Non-white Republicans (58%) are more likely than white Republicans (51%) to support these policies, while white Democrats (89%) and non-white Democrats (92%) have similar levels of support.
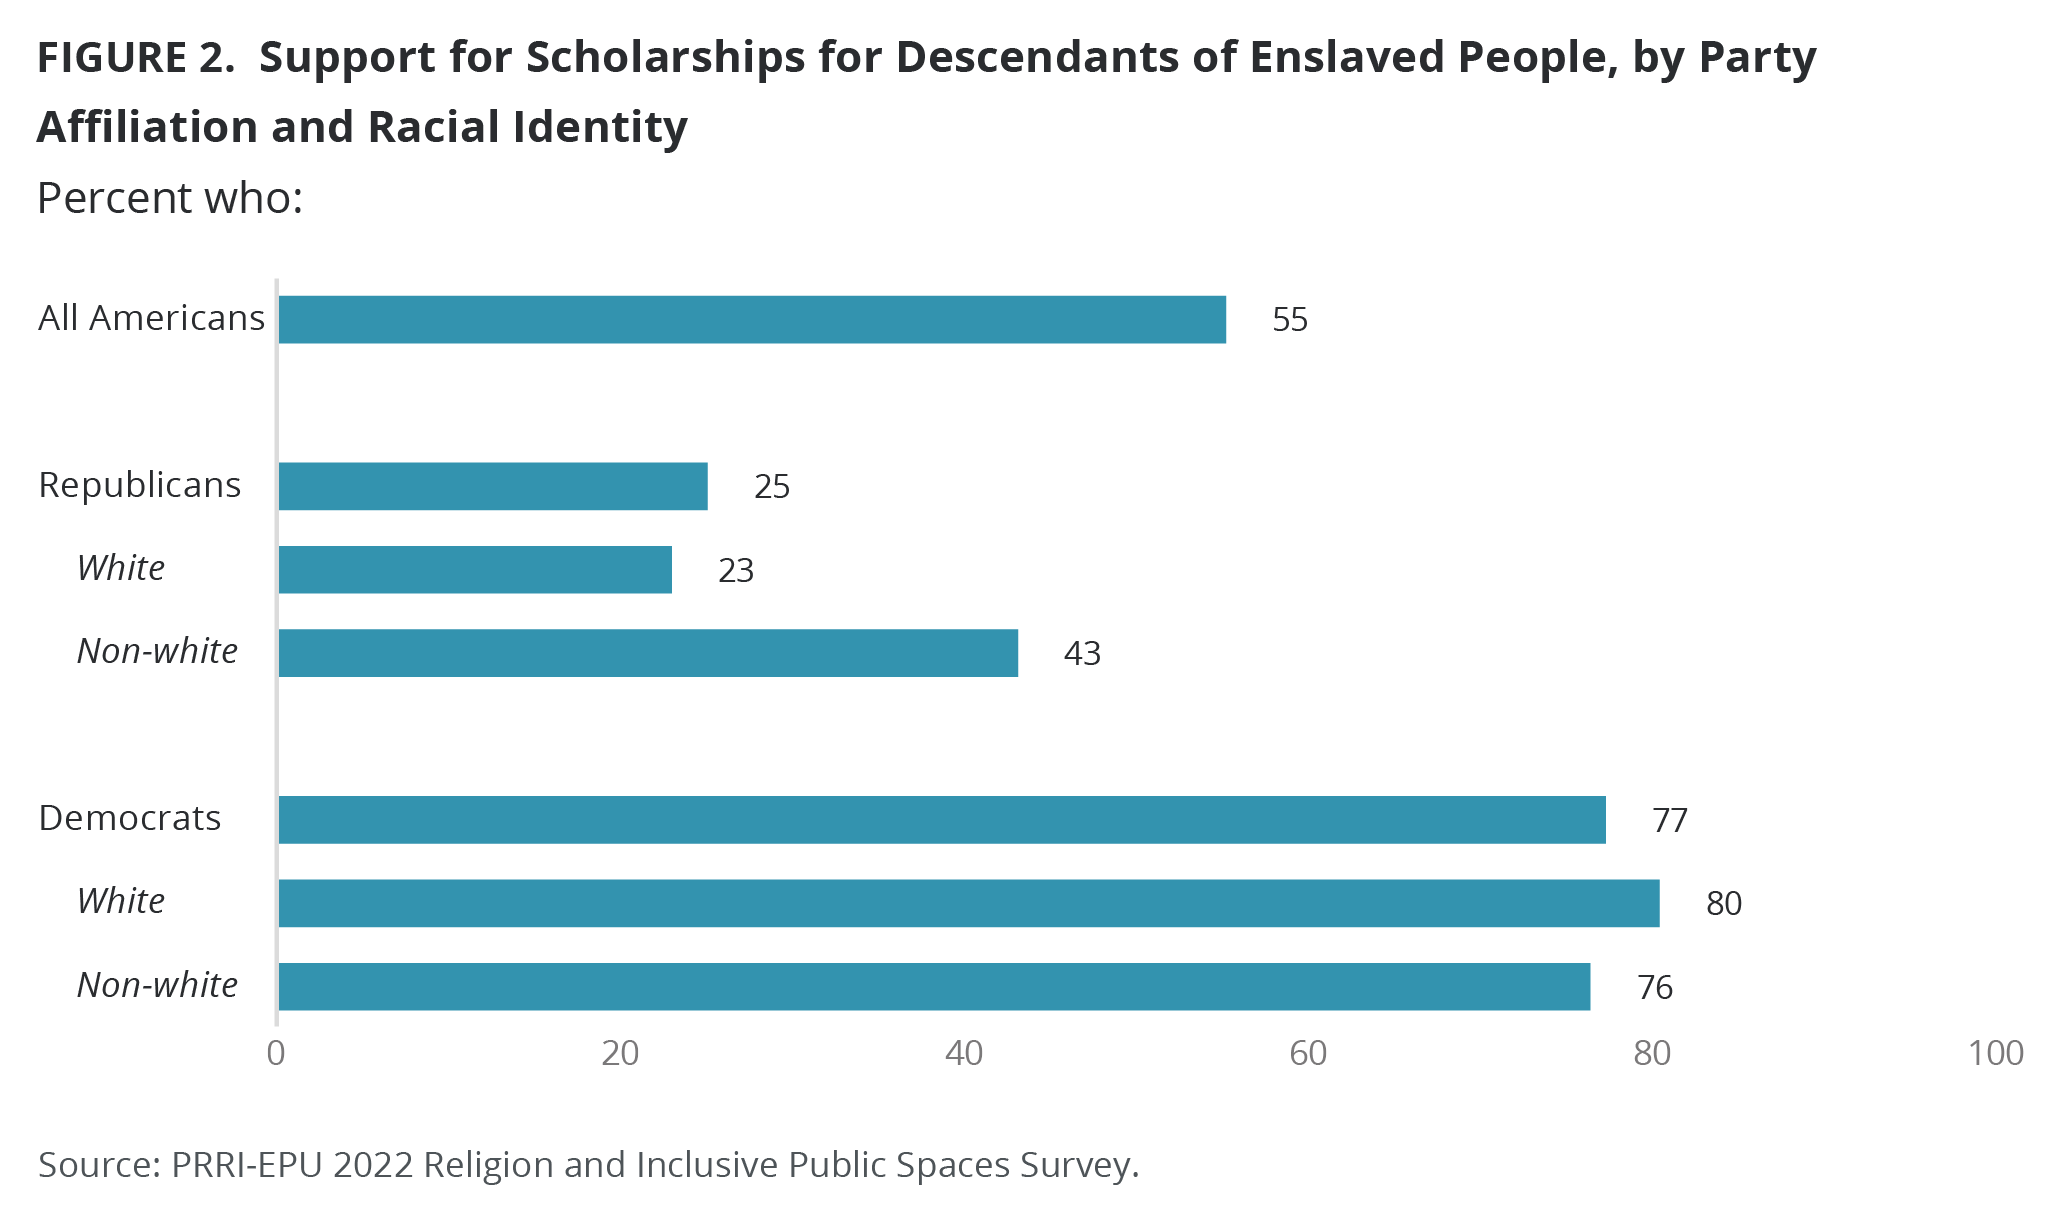
The most divisive policy involves having colleges and universities provide scholarships for the descendants of enslaved people that helped build their campuses, with a slim majority of Americans (55%) in favor and 41% in opposition. Despite the general public being more closely divided, the vast majority of Democrats (77%) favor helping the descendants of enslaved people, similar to white Democrats (80%) and non-white Democrats (76%). By contrast, Republicans’ levels of support are essentially the opposite of Democrats, with only one-in-four Republicans (26%) in favor. Interestingly, non-white Republicans (43%) are nearly twice as likely as white Republicans (23%) to support “colleges and universities providing scholarships for descendants of enslaved people who were forced to construct buildings and work on their campuses.”
While there is some partisan opposition to policies that would address historical injustices within education, there is much public support for ensuring that the history of slavery, racial violence, and discrimination can be taught in schools, despite the efforts of some elected officials to stop that history from being taught.
[1] Most Republicans are white (81%). Non-white Republicans include the following racial/ethnic categories and make up the following percentage of Republicans nationally: Hispanic American (11%), Asian, Native Hawaiian or Other Pacific Islander (4%), Black or African American (2%), American Indian or Alaska Native (2%), and multiracial Americans (1%).


