

Mapping Americans’ Core Friendship Networks
To better understand the composition of Americans’ core friendship networks, PRRI designed a study to assess the scope and diversity of Americans’ social relationships. The method of measuring Americans’ core social networks was modeled after the General Social Survey and follows up on a study PRRI conducted in 2013. Respondents were asked to name people with whom they “discussed important matters” in the previous six months, regardless of the nature of the relationship or the frequency of interaction. This approach is designed to measure the ways in which individuals’ choices and attitudes are influenced by their family and close friends.[1]
Size
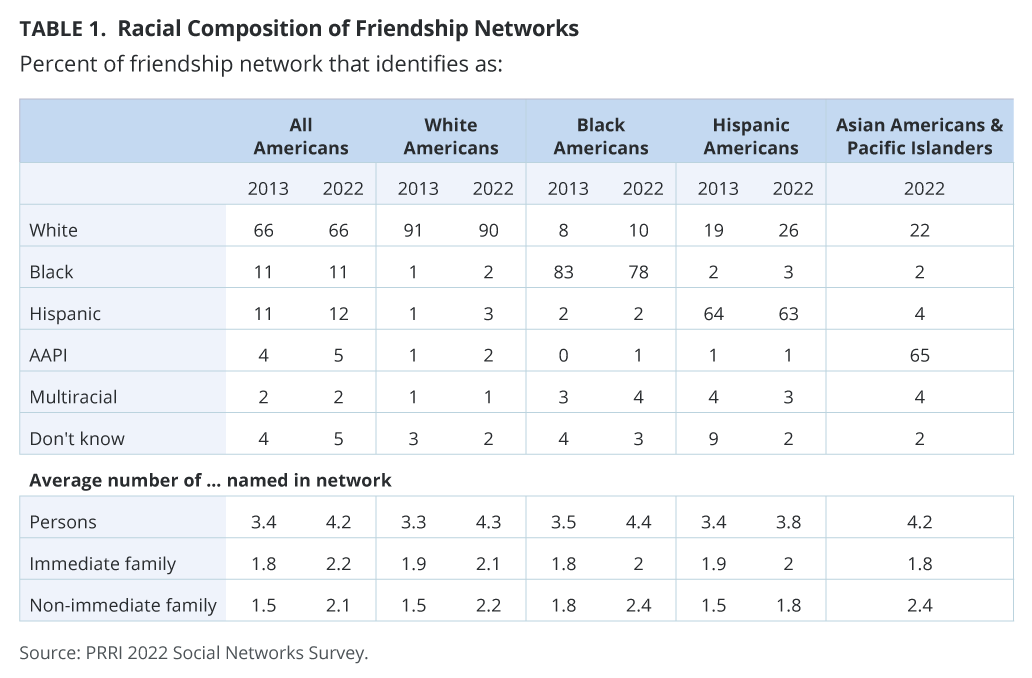
Survey respondents were asked to list up to seven people with whom they discuss important matters. Americans overall reported, on average, a social network of 4.2 people out of a maximum of seven people, compared to 3.4 people in 2013.[2]
Women list more contacts than men, on average (4.5 people compared to 3.9 people). Black men (4.0 people), Asian American and Pacific Islander (AAPI) men (4.0), and white men (3.9 people) tend to report slightly more contacts than Hispanic men (3.6 people). White men with college degrees are more likely than white men without college degrees to report more contacts (4.2 people compared to 3.7 people). College-educated men are generally more likely than men without a college education to report more contacts (4.2 people compared to 3.7 people).
Overall, three in ten Americans (30%) name one to three close contacts, while a majority (61%) name four or more people, including 29% who named the maximum of seven people. These proportions are notably different from those recorded in 2013, when half of Americans (50%) named one to three close contacts and 43% named four or more, including 17% who named the maximum of seven. Only nine percent of Americans name no people in their social networks, similar to proportions recorded in 2013 (8%).
When prompted a second time, among Americans who did not mention any particular person with whom they discuss important matters, 39% reiterated none, while a majority said either one or two (34%) or a few (20%), and only five percent said several or many.
Types of Relationships
Overall, the people respondents named in these networks are roughly evenly divided between immediate family members (2.1 people on average) and non-immediate family contacts (an average of 2.2 people). In 2013, people named in these networks were slightly more likely to be immediate family members (an average of 1.8 people) than non-immediate family contacts (an average of 1.5 people).
White Americans are equally likely to name immediate family members (2.1 on average) and non-immediate family contacts (2.2 on average). Black Americans are less likely to name immediate family members than non-immediate family contacts (an average of 2.0 and 2.4 people, respectively). Hispanic Americans are slightly more likely to name immediate family members (an average of 2.0 people) than non-immediate family members (an average of 1.8 people). Among Asian Americans and Pacific Islanders (AAPI), social networks are less likely to be comprised of immediate family members (an average of 1.8 people) than non-immediate family contacts (an average of 2.4 people).
Racial Composition of Social Networks
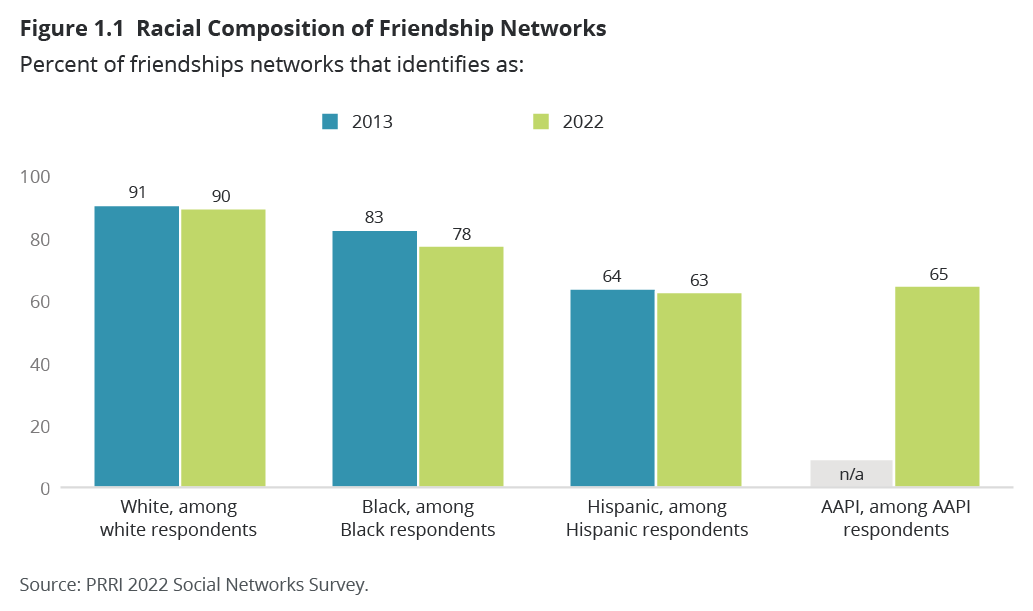
Across racial groups, Americans’ core social networks tend to be dominated by people of the same race or ethnic background. Among white Americans, 90% of people comprising their social networks are also white, similar to 2013 (91%). Among Black Americans, 78% of people in their social networks are also Black, a notable decrease from 83% in 2013. Among Hispanic Americans, 63% of the people who comprise their core social networks are also Hispanic, while about one in four (26%) are white, similar to 2013 (64% and 19%, respectively). Among Asian Americans and Pacific Islanders (AAPI), 65% of the people who comprise their core social networks are also AAPI, while over one in five (22%) are white and 13% are another race.
Notably, political partisans have sharply contrasting core social networks in terms of their racial composition. The core friendship networks of Republicans are on average 83% white, compared to 67% white among independents and 53% white among Democrats. There are slight differences between white Republicans and white Democrats. On average, the core social network of white Democrats is 90% white, while the core social network of white Republicans is 93% white.
Racial Homogeneity
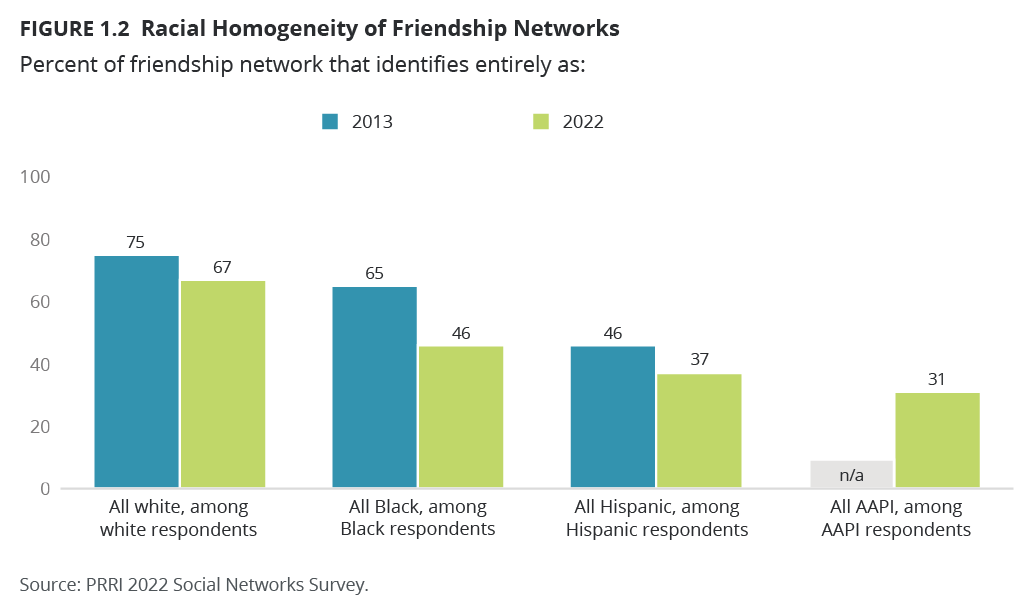
Measuring the homogeneity of Americans’ core social networks—that is, the percentage of Americans with social networks that are entirely comprised of people from the same racial or ethnic background—shows that completely homogeneous networks have become less common today than they were in 2013. In 2022, 67% of white Americans have networks that are entirely white, compared to 75% in 2013. Black Americans’ networks have diversified most, with less than half (46%) today composed entirely of people who are also Black, compared to 65% in 2013. Hispanics are also more likely to report a racially mixed network today than they were in 2013: 37% of Hispanics report that their social networks are comprised entirely of other people who also identify as Hispanic, compared to 46% in 2013. Notably, about one in ten Hispanics (11%) report having an all-white core social network, a similar percentage to 2013 (9%). About three in ten AAPI residents (31%) report having a core social network that is composed entirely of people who are also AAPI, and 15% of AAPI residents report having an all-white core social network.
Racial Homogeneity of Friendship Networks Among White Subgroups
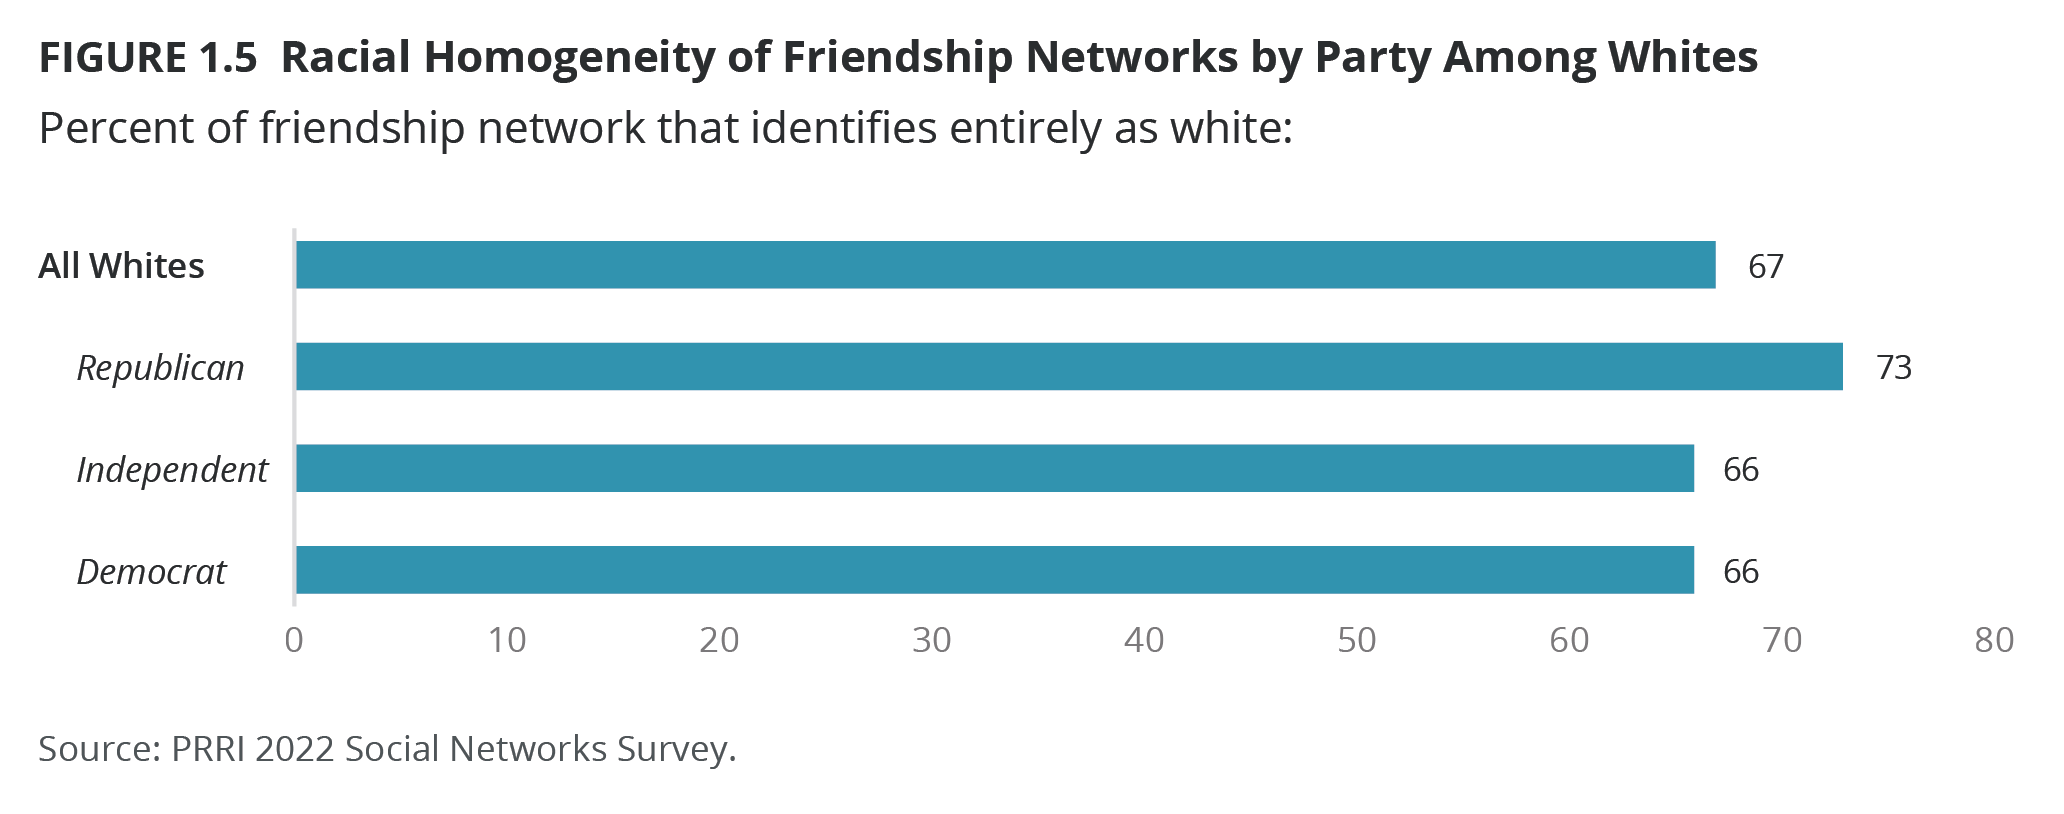
White Americans are the most likely to have racially homogeneous networks, but there is some variation by partisanship, religious affiliation, and age. White Republicans (73%) are more likely than white independents (66%) and white Democrats (66%) to report entirely white social networks.
White evangelicals (71%) are similarly likely as white mainline Protestants (71%), white Catholics (73%), and other white Christians (72%) to report that their core social networks are entirely composed of whites, compared to 62% of whites who belong to non-Christian religions and 57% of religiously unaffiliated whites.
Younger white Americans ages 18–29 are considerably less likely than older age groups to have all-white social networks (54%, compared to 66% among ages 30–49, 69% among ages 50–64, and 74% among ages 65 and over). However, there is little variation among white Americans in terms of the racial homogeneity of their core social networks by education. White Americans with college degrees (68%) are as likely as white Americans without college degrees (66%) to report social networks composed entirely of whites.
Religious Composition of Friendship Networks
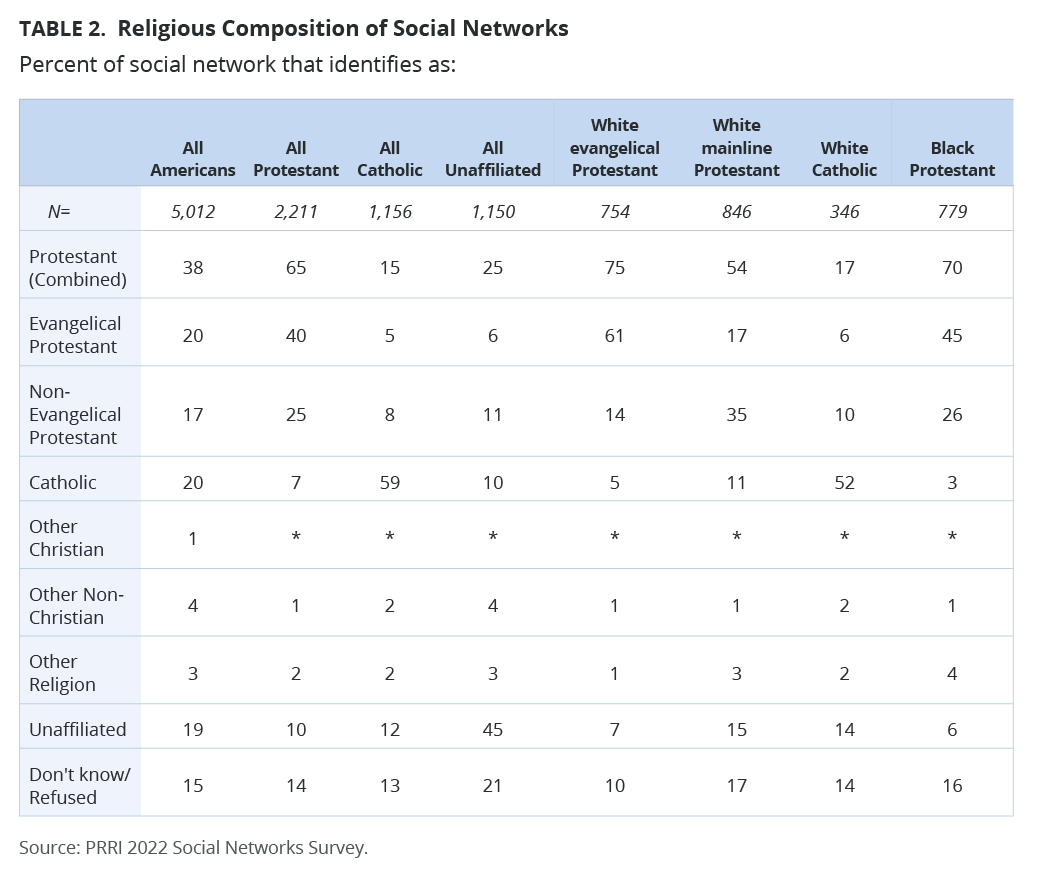
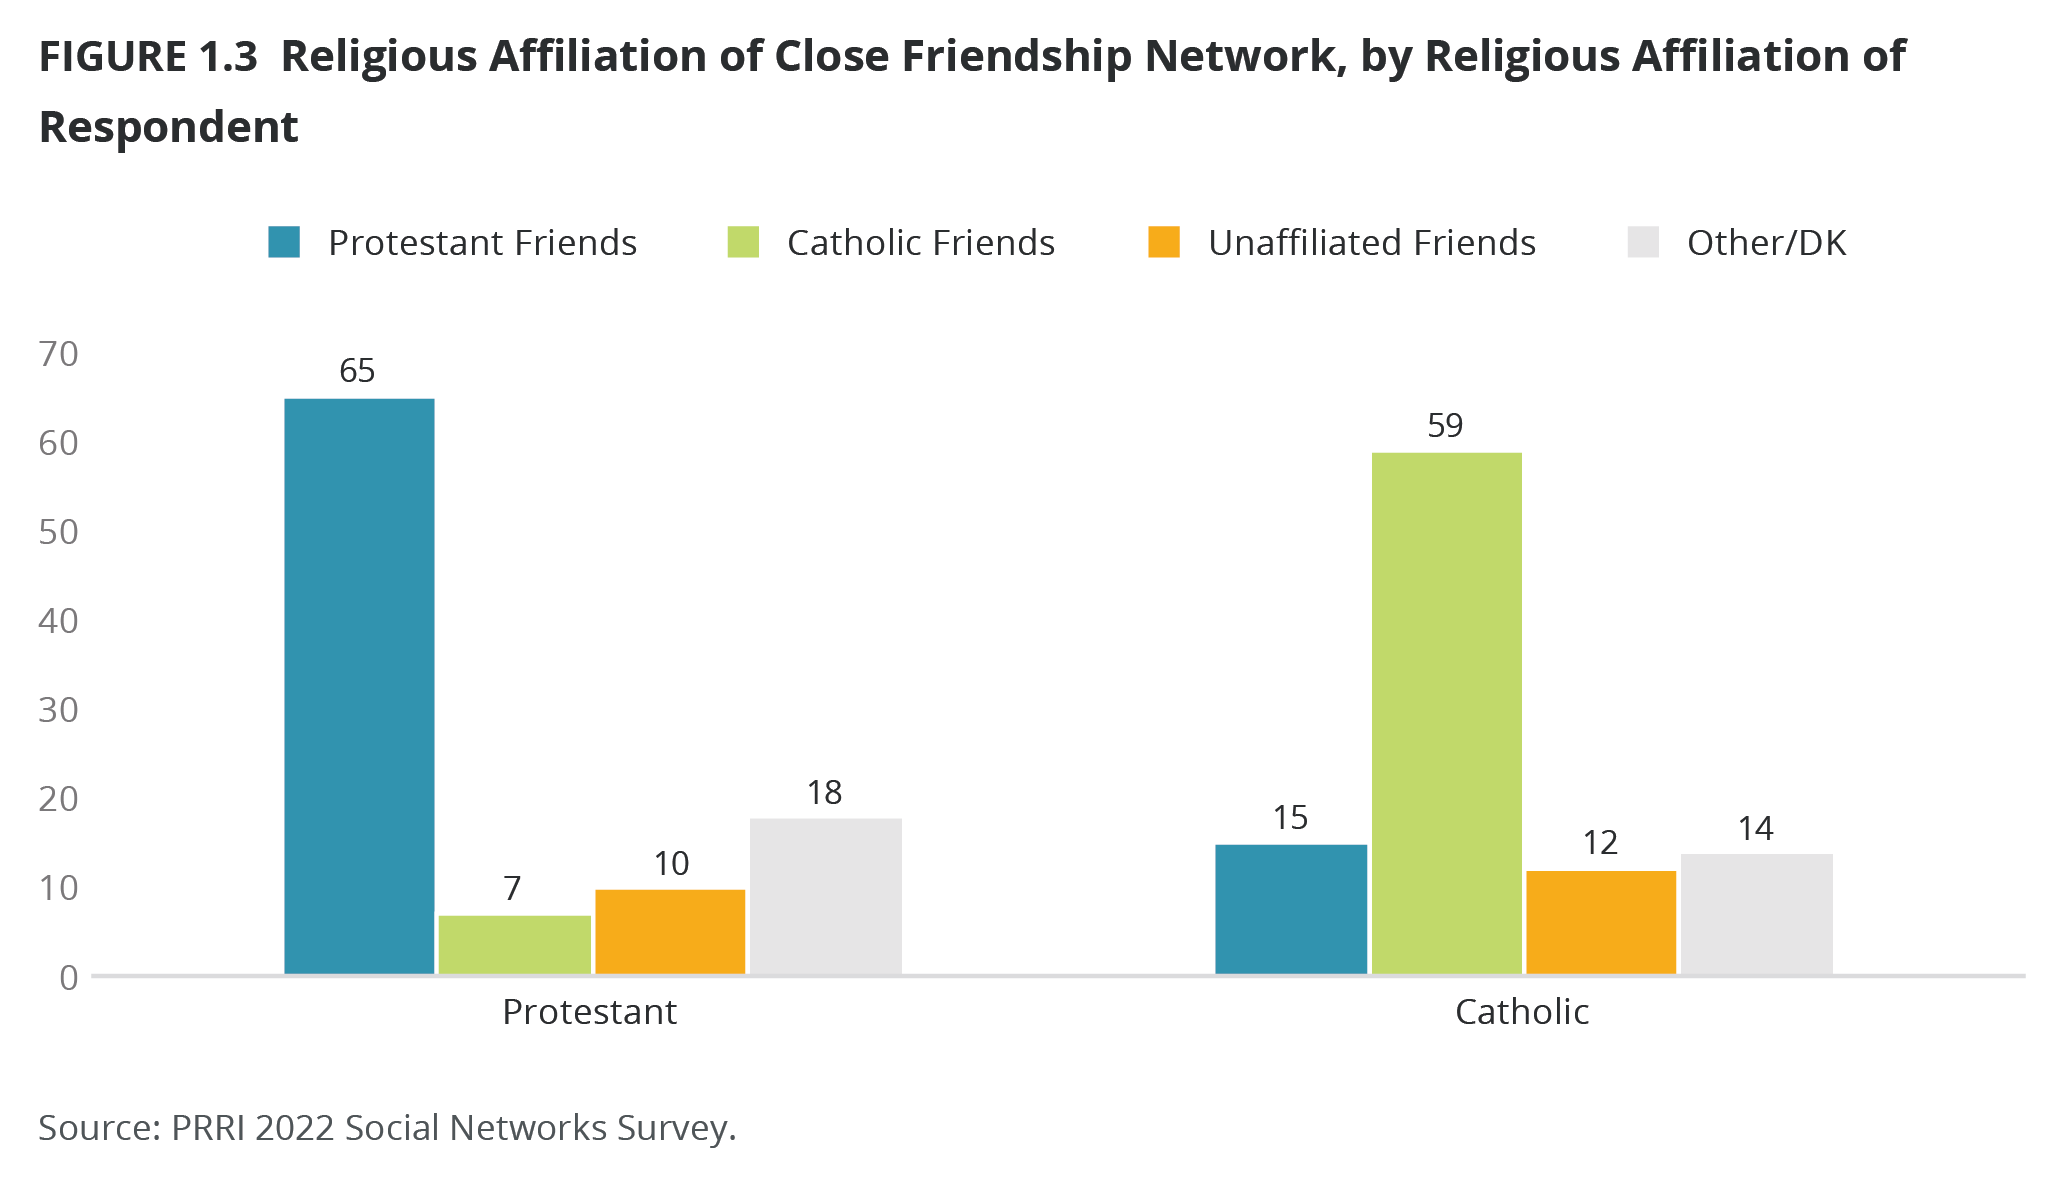
Americans are also much more likely to associate with people who share their religious background. Nearly two-thirds (65%) of Protestants’ social networks are also Protestants (similar to 68% in 2013), and 59% of individuals in Catholics’ social networks also identify as Catholic (a slight decrease from 72% in 2013). Similarly, 58% of the social networks of Americans who belong to non-Christian religions also belong to a non-Christian religion (up from 38% in 2013). Less than half (45%) of religiously unaffiliated Americans’ social networks are also religiously unaffiliated, which makes their social networks far more religiously diverse than those of Protestants, Catholics, or followers of non-Christian religions. This is mostly unchanged from 44% in 2013.
The core social networks of different Protestant denominations vary in terms of their religious diversity. White evangelical Protestants have more religiously homogeneous networks than white mainline or black Protestants. Six in ten white evangelical Protestants (61%) report that their social networks also identify as evangelicals, while only 14% identify as nonevangelical. Fewer white evangelical Protestants report that their social networks identify as unaffiliated (7%), Catholic (5%), members of non-Christian religions (1%), or other religions (1%). About one-third of white mainline Protestants (35%) report their social networks identify as non-evangelicals, compared to 17% who identify as evangelical. Three in ten members of white mainline Protestants’ friendship networks identify as either unaffiliated (15%), Catholic (11%), another religion (3%), or non-Christian (1%).
Among Protestants of color, 45% of Black Protestants identify their social networks as evangelical, compared to 26% who identify as non-evangelical. A little over one in ten Black Protestants report that their social networks identify either as unaffiliated (6%), members of other religions (4%), or non-Christians (1%). One-third of Hispanic Protestants identify their social networks as evangelical (34%), similar to 30% who identify as non-evangelical. More than one in ten identify their social networks as Catholic (15%), compared to eight percent who identify as another religion, two percent who identify as non-Christian, and eight percent who identify as unaffiliated.
A slim majority of white Catholics identify their social networks as Catholic (52%), 14% as unaffiliated, 10% as non-evangelical, and six percent as evangelical. Less than five percent identify as non-Christian or another religion. Similarly, the majority of Hispanic Catholics identify their social networks as Catholic (70%), compared to about two in ten who identify as either unaffiliated (8%), non-evangelical (5%), evangelical (2%), non-Christian (1%), or another religion (1%).
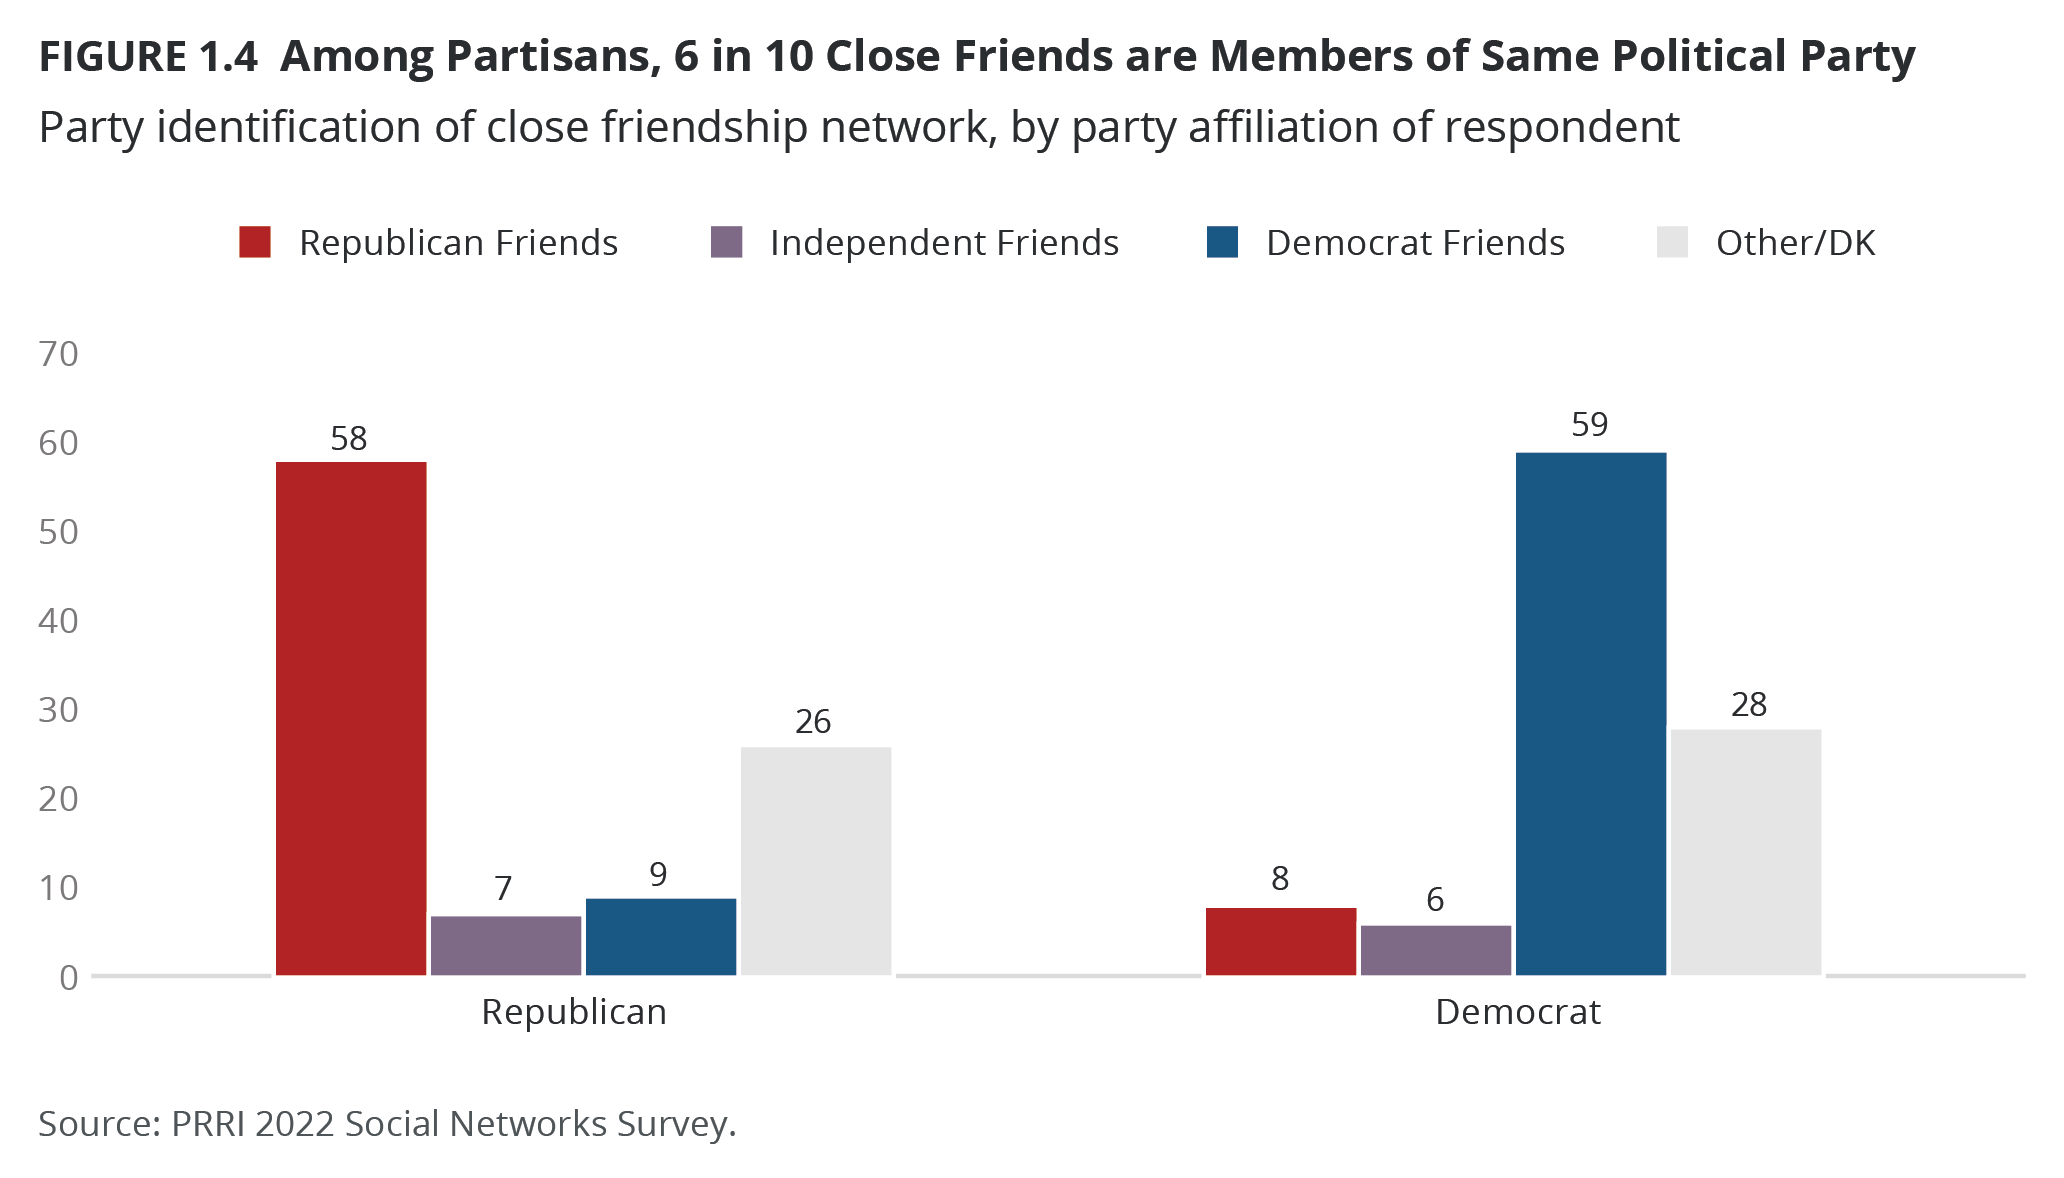
Political Composition of Friendship Networks
Americans’ friendship networks are also socially sorted by partisanship. Nearly six in ten people in Democrats’ and Republicans’ social networks are also Democrats (59%) or Republicans (58%). Independents have more politically diverse networks than Democrats and Republicans. Within independents’ networks, about one in four contacts are also independents (25%), with roughly equal portions who are Democrats (19%) and Republicans (17%). Ten percent of Americans’ social networks are nonpolitical, including slightly more within independents’ social networks (11%) than in those of Democrats (7%) and Republicans (8%).
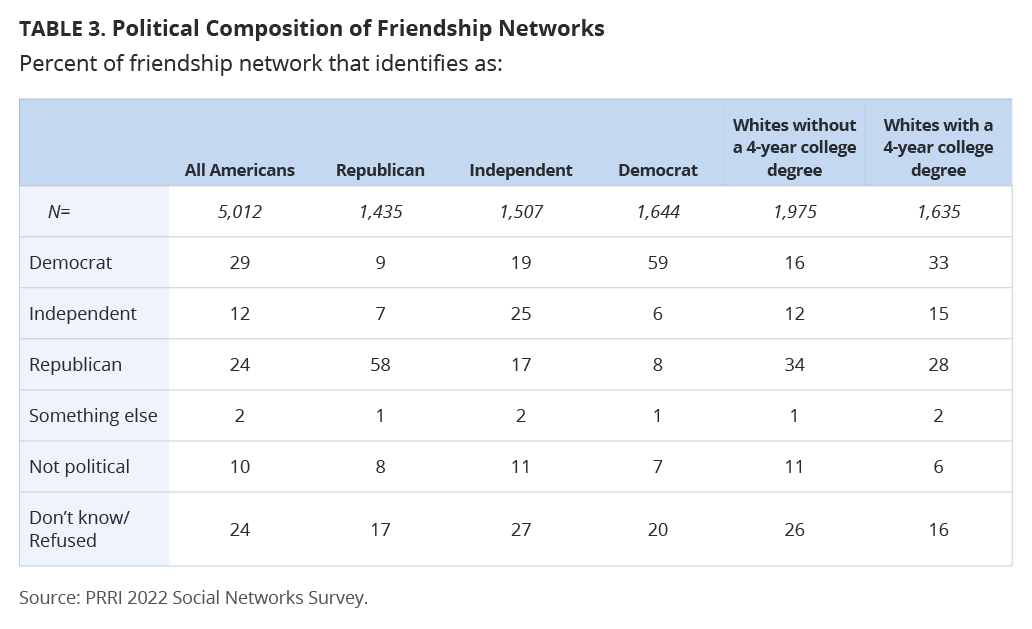
On average, one-third of white Americans’ friendship networks are Republicans (32%), compared to 18% of multiracial Americans’ social networks, 13% of AAPI Americans’ social networks, 12% of Hispanic Americans’ social networks, and five percent of Black Americans’ social networks. By contrast, the majority of Black Americans’ social networks are Democrats (54%), compared to 35% of Hispanic Americans’ social networks, 32% of AAPI Americans’ social networks, 28% of multiracial Americans’ social networks, and 23% of white Americans’ social networks.
Among white Americans without college degrees, about one-third of their social networks are Republicans (34%), compared to only 16% of their networks who are Democrats. By contrast, among white Americans with college degrees, one-third of their social networks are Democrats (33%), compared to 28% of their networks who are Republicans.
Around three in four white Republicans (73%) have social networks that consist only of white people, compared to 66% of white independents and 66% of white Democrats whose networks are exclusively white.
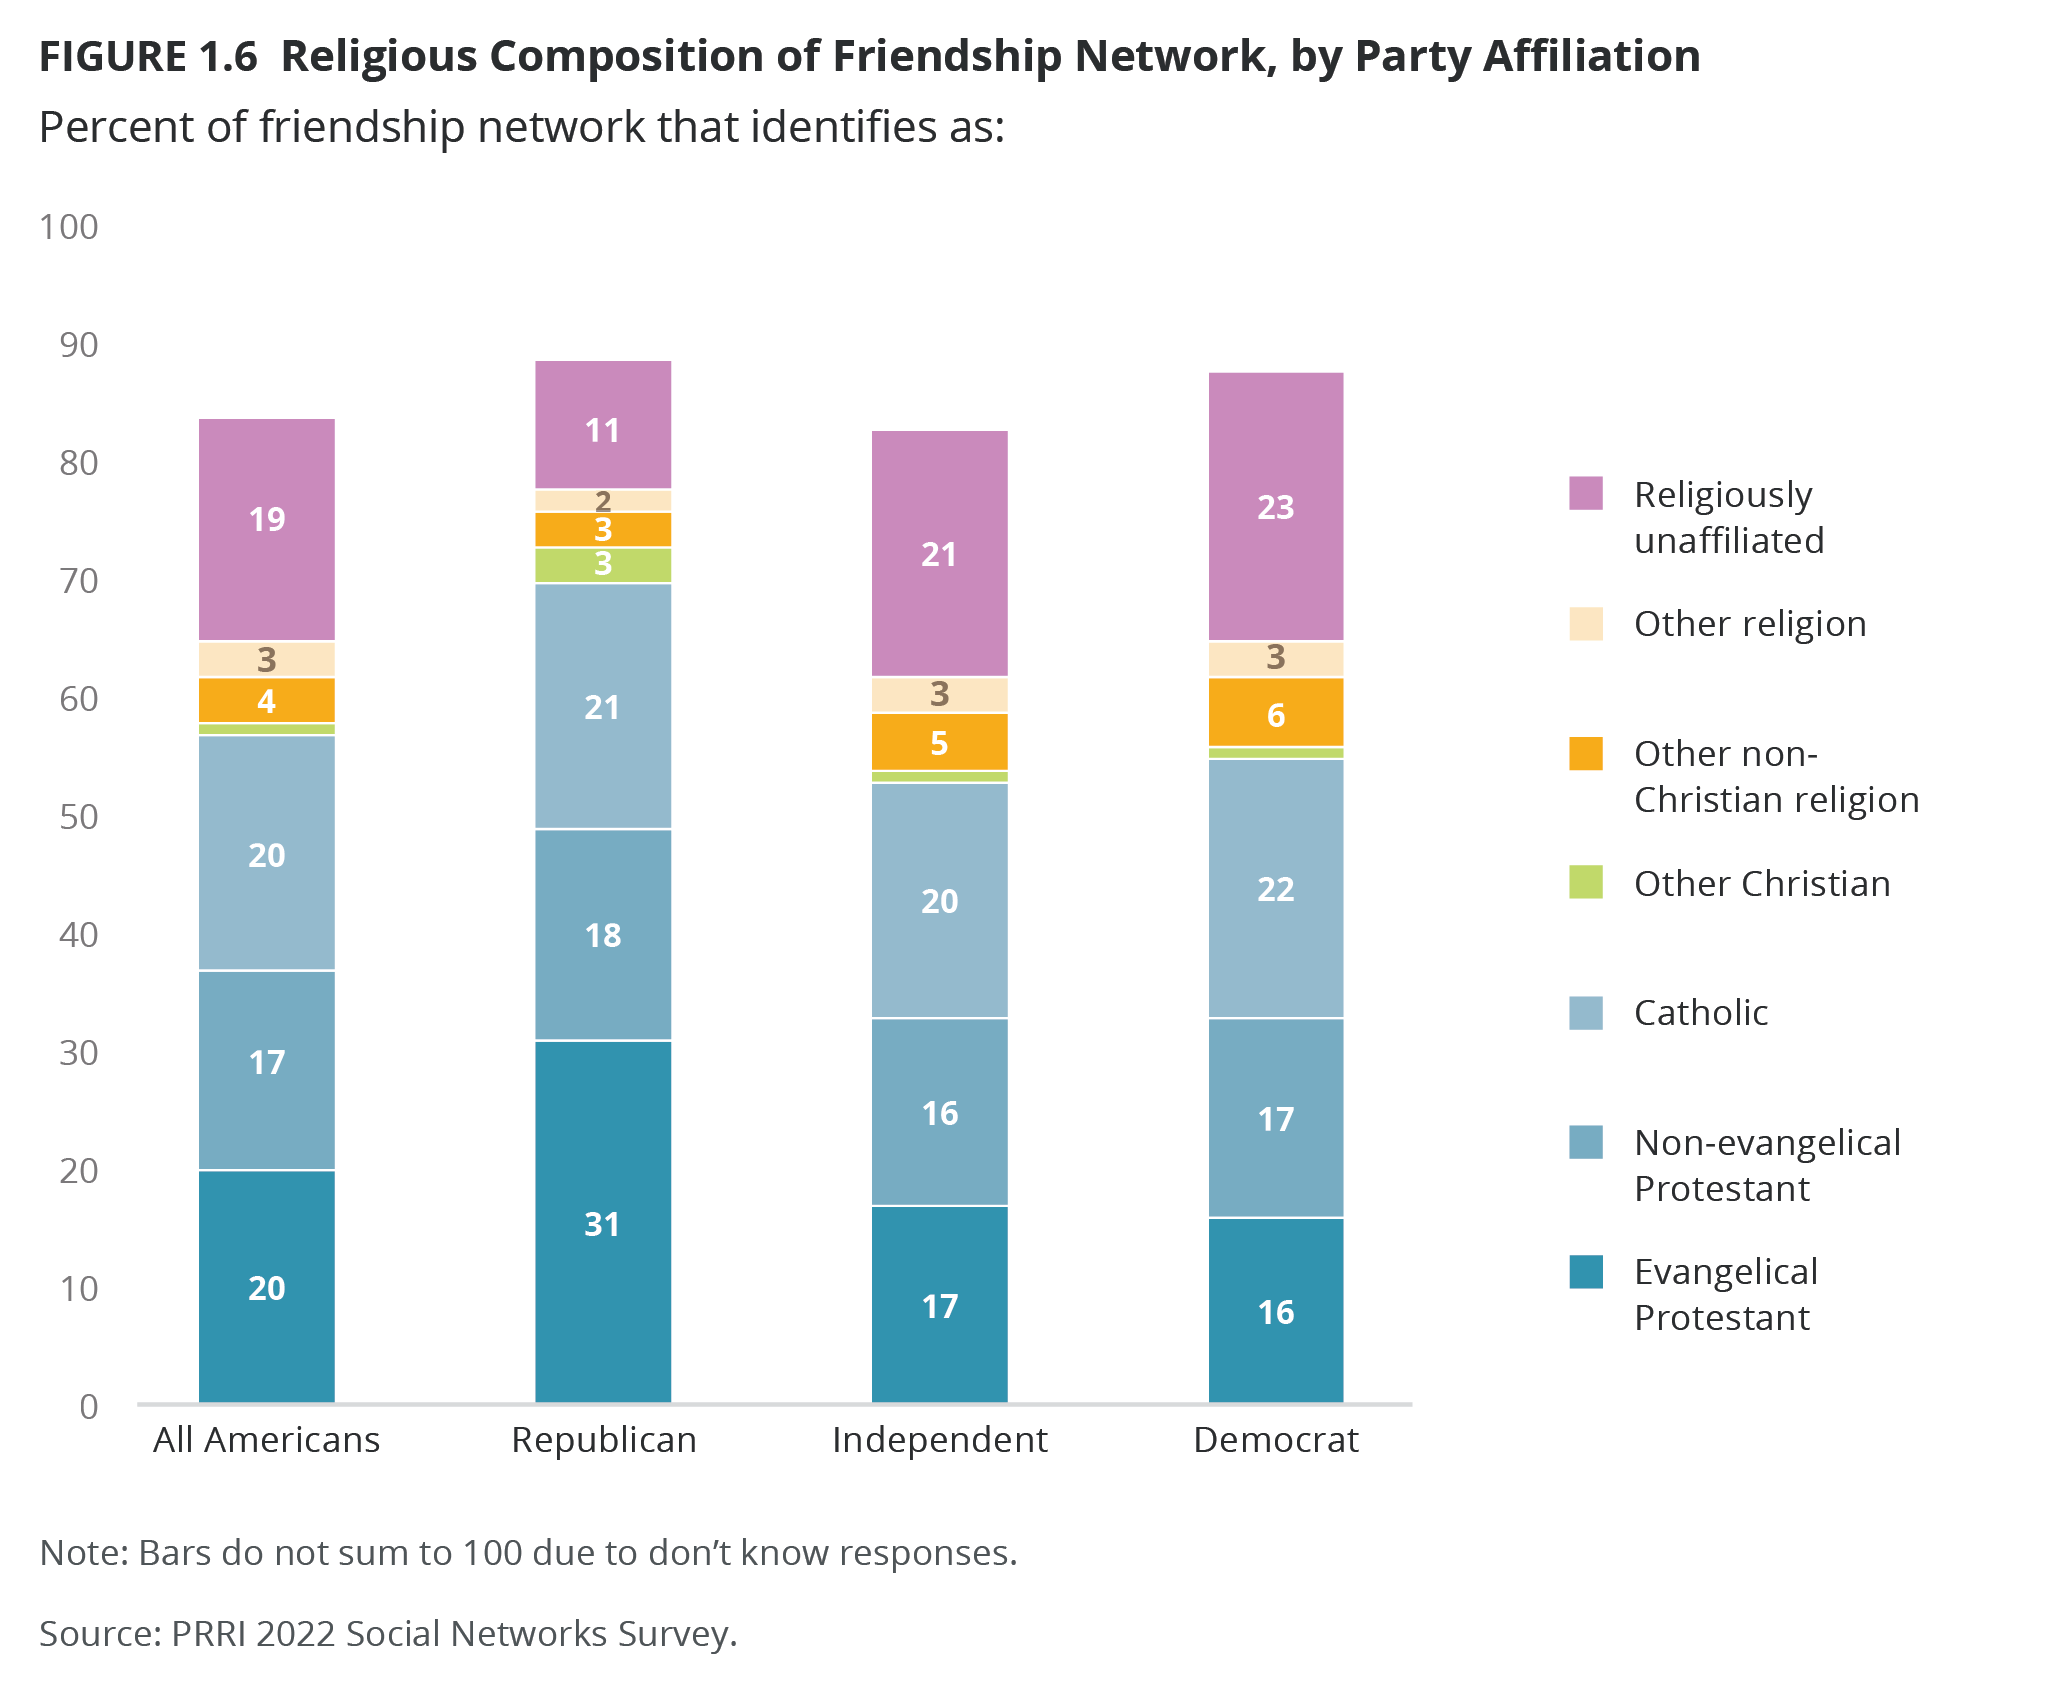
Americans’ political social networks tend to be dominated by Protestants, especially among Republicans. Among Republicans, a notably higher percentage of people comprising their social networks identify as Protestants (49%), compared to 33% among independents and 33% among Democrats. In addition, among Republicans, 31% of people who make up their social networks identify specifically as evangelicals, compared to 17% among independents and 16% among Democrats. Among Republicans (21%), people who make up their social networks are equally likely as those among independents (20%) and Democrats (22%) to identify as Catholic, while among Democrats (23%), people who make up their social networks are notably more likely to identify as unaffiliated than among Republicans (11%).
Attributes of Friendship Networks
Primary Form of Communication
When discussing important issues with the individuals in their social networks, a majority of Americans (57%) say they primarily communicate in person. Another 37% of Americans say they primarily have these discussions via phone calls or text messages, and only four percent say online or social media is their primary medium.
Republicans (61%) and independents (59%) are more likely than Democrats (53%) to communicate with their friendship networks in person. Democrats are more likely than Republicans and independents to discuss important issues over phone or text message (41% vs. 35% and 36%, respectively).
Hispanic Americans are much more likely to discusses issues in person (63%) than over phone or text (32%). Nearly six in ten white Americans (58%) discuss important issues within their social networks in person, and 37% do so via phone or text message. Majorities of both AAPI Americans (53%) and multiracial Americans (53%) primarily speak in person on these issues, while four in ten of both groups (40%) communicate by phone or text. Black Americans are evenly divided in how they communicate with their social networks (46% in person vs. 48% over phone or text message).
A majority of Americans ages 18–29 (54%) talk about important issues in person but are slightly less likely to do so than other age groups (59% for 30–49, 58% for 50–64, and 57% for 65+). Around the same percentage of all age groups have these discussions on the phone or over text message; however, the age groups 18–29 (5%) and 30–49 (5%) are slightly more likely to discuss online or on social media than the 50–64 and 65+ age groups (2% and 3%, respectively). Six in ten men (60%) communicate primarily in person, compared to 55% of women; however, men are less likely than women to communicate over the phone or text message (34% vs. 41%).
Interconnectedness
Most Americans (56%) say that most or all of the individuals in their networks talk to one another regularly, 37% say a few or hardly any of them communicate with one another, and only seven percent say none of them talk to one another.
The more connections a person has within their social network, the less likely they are to all or mostly talk to one another regularly. For those who named two people that they discuss important issues with, 67% say that most or all of them talk regularly, including 57% who say that all those they named talked with one another regularly. Those proportions decrease as network size increases: 62% of those with three people in their social networks say most or all talk regularly; four in ten (41%) say all of them talk on a regular basis. This continues to drop with four (55%), five, six, and seven (52%) in people’s social networks.
Majorities of Republicans (58%), Democrats (56%), and independents (55%) say that most or all of the individuals in their social networks talk on a regular basis. Republicans, however, are more likely than Democrats and independents to say everyone in their social networks talks regularly (34% vs. 29% and 29%, respectively).
More than six in ten Asian Americans and Pacific Islanders (64%) and Hispanic Americans (62%) say that most or all of their social network talks regularly. Majorities of both Black and white Americans also say the same about their social networks (56% and 54%, respectively). Multiracial Americans (46%) are less likely than other groups to report that most or all of their social network talks regularly.
Geographic Distribution
A majority of Americans (66%) say that most or all of their social networks live within a two-hour drive, including a plurality (42%) who say that all of their social networks live within a two-hour drive of them. About one in five (19%) say only a few of their contacts live within a two-hour drive, while eight percent say hardly any and six percent say none live nearby. Despite the comparative mobility of young people, there are no significant age differences.
More than seven in ten Republicans (73%) say they live two hours or less from most or all of the individuals in their close social networks, including nearly half (48%) who say that they live that close to all of the people within their networks. Independents and Democrats are somewhat less likely than Republicans to live within a two-hour drive of most or all their social networks (65% and 64%, respectively).
White Americans are more likely than others to live within a two-hour drive of the majority of the people in their social networks. Seven out of ten white Americans (71%) live within two hours of most or all their social networks, compared to about six in ten multiracial (62%) and Black Americans (60%), and 57% of Hispanic Americans, and 56% of Asian American and Pacific Islanders.
Discussing Politics
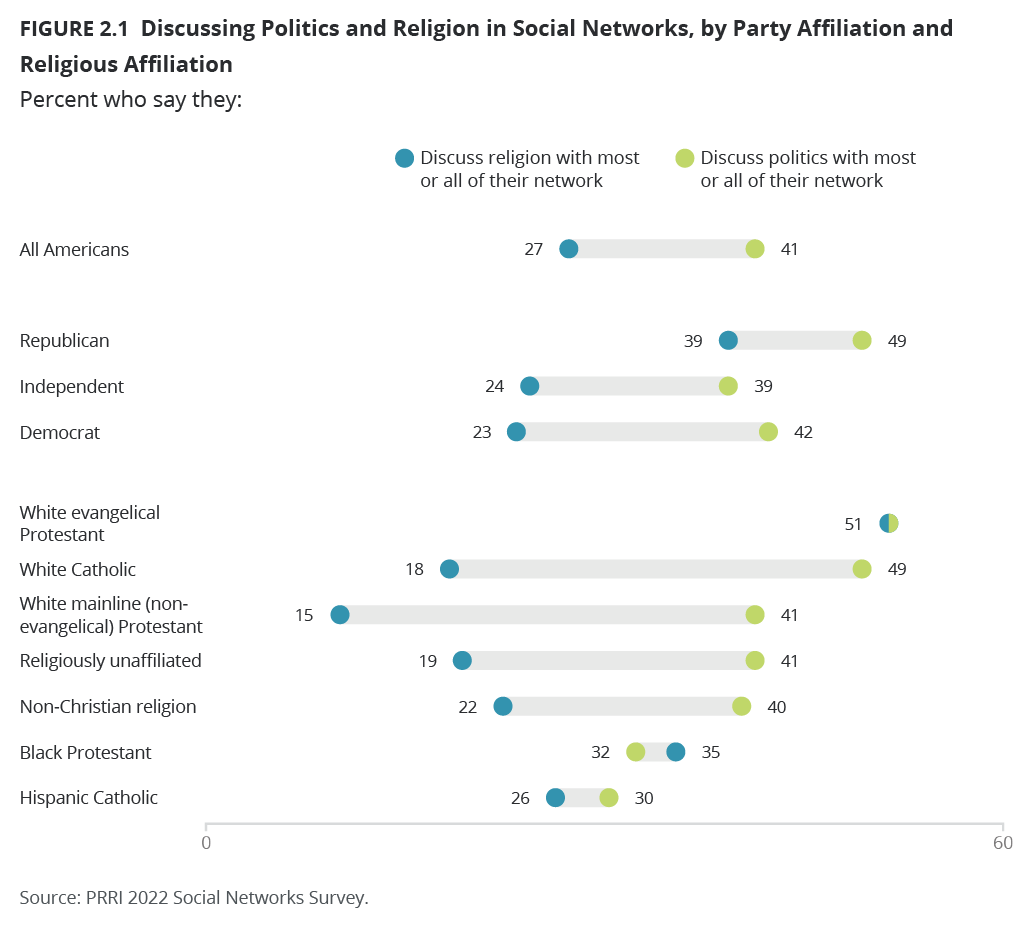
Less than half of Americans (41%) say they discuss politics with most or all of their social networks. About three in ten (31%) discuss politics with a few people in their network, while 16% discuss it with hardly any and 12% do not discuss politics with anyone in their networks.
Republicans (49%) are more likely than Democrats (42%) and independents (39%) to say they discuss politics with most or all of their listed network connections. Republicans are also significantly less likely than Democrats and independents to say they do not discuss politics with any connections (6% vs. 10% and 14%, respectively).
Around half of white evangelical Protestants and white Catholics (51% and 49%, respectively) say they talk about politics with most or all of those in their social networks. More than four in ten white mainline Protestants (41%) and religiously unaffiliated Americans (41%) and three in ten Black Protestants and Hispanic Catholics (32% and 30%, respectively) discuss politics with at least most of their connections.
White Americans (46%) are more likely to talk about politics with most or all their social networks than Hispanic (31%), Black (28%), or multiracial Americans (28%).[3] Around half of Hispanic and Black Americans discuss politics with hardly any or a few of the individuals in their networks (52% and 49%, respectively).
Men are more likely to have discussions about politics with most or all the members of their social networks compared to women (46% vs. 36%). Around one-quarter of men (26%) say they discuss politics with all of those in their network, whereas only 18% of women say that about their social networks.
Discussing Religion
Americans are generally less likely to discuss religion than politics with their social networks. Only 15% say they discuss religion with all of their network contacts and an additional 12% discuss religion with most of their listed contacts. One in four (25%) discuss religion with a few of their contacts, 22% with hardly any, and 25% say they do not discuss religion with any of their contacts. Republicans (39%) are more likely than Democrats (23%) and independents (24%) to discuss religion with most or all of their networks.
Around half of white evangelical Protestants (51%) discuss religion with most or all of their social networks, which is significantly higher than other major religious affiliations. One-third of Black Protestants (35%) and one-quarter of Hispanic Catholics (26%) have conversations on religion with most or all their social networks. Less than one in five white Catholics (18%) and white mainline Protestants (15%) say the same. Interestingly, one in five religiously unaffiliated Americans (19%) still have religious conversations with most or all of their social networks.
One-third of Hispanic and Black Americans (33% and 32%, respectively) say they discuss religion with most or all of their social networks, compared to one in four white Americans (25%).
Satisfaction With Friendship Networks
Satisfaction With Maintaining Connections Throughout the Pandemic
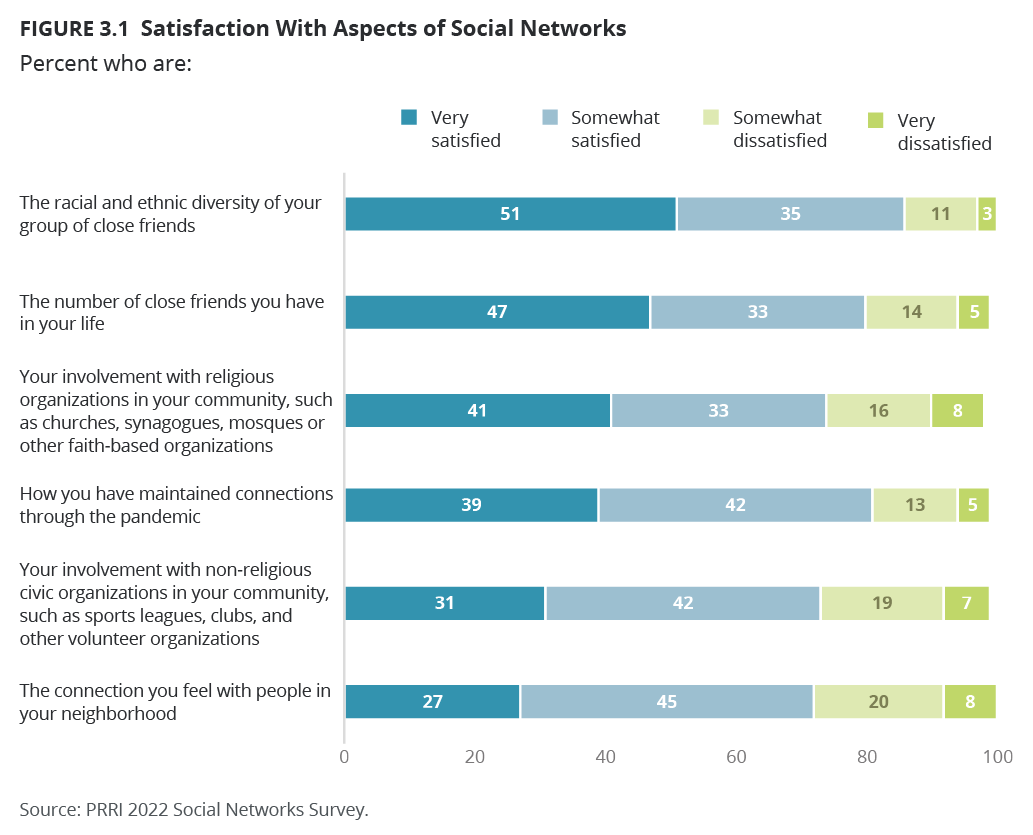
Despite the inherent disruptions to social activity due to the COVID-19 pandemic that began in the U.S. in March 2020, most Americans (81%) report they are satisfied with how they have maintained connections throughout the pandemic, with 39% very satisfied and 42% somewhat satisfied. Thirteen percent say they are somewhat dissatisfied, and five percent are very dissatisfied with how they have kept up with their social connections.
Those who listed more connections in their friendship networks are slightly more likely to be satisfied with how they have maintained social connections through the pandemic, ranging from 37% very satisfied among those who listed no connections at all to 41% among those who listed the maximum number of close contacts.
Religion also has a modest impact on assessments of maintaining connections throughout the pandemic. White evangelical Protestants (47%) and other Christians (47%) are most likely to say they are very satisfied with how they maintained connections, closely followed by Black Protestants (44%) and Latter-day Saints (43%). About four in ten white mainline Protestants (40%), Hispanic Catholics (39%), and white Catholics (38%) are very satisfied with this aspect of their friendship networks, while around one-third of other Protestants of color (36%), religiously unaffiliated Americans (36%), Hispanic Protestants (33%), Jewish Americans (32%), and other non-Christian religious Americans (32%) say the same.
Attendance at religious services, even sparsely, has a modest positive impact on social connection satisfaction. Among those who attend religious services more than once a week, a majority (54%) are very satisfied with how they have maintained connections. More than four in ten of those who attend once a week (43%) or once or twice a month (42%) are very satisfied with their connections, compared to 37% of those who attend a few times a year, 38% of those who seldom attend, and 37% of those who never attend religious services.
There are only small differences by race on satisfaction with keeping connections throughout the pandemic. Black Americans (46%) are most likely to say they are very satisfied, while about four in ten white Americans (40%) and Hispanic Americans (38%) say the same. However, multiracial Americans (34%) and AAPI Americans (25%) are significantly less likely to say they are very satisfied with their connections throughout the pandemic. There are no significant differences by education or gender.
Satisfaction With Number of Close Friends
Most Americans are satisfied with the number of close friends they have: 47% are very satisfied, and an additional 33% are somewhat satisfied. Only one in five are somewhat dissatisfied (14%) or very dissatisfied (5%) with the number of close friends they have in their lives. Even among those who list no close connections in the survey, 40% indicate they are very satisfied with the number of close friends they have. That increases steadily to 54% among those who list the maximum number of close connections.
More Black Americans (59%) say they are very satisfied with the number of close friends they have in their lives than Hispanic Americans (49%), white Americans (46%), AAPI Americans (38%), and multiracial Americans (37%). There are no topline gender differences, but interestingly, men with college degrees are significantly less likely to be very satisfied than men without college degrees on this dimension (40% vs. 47%), and the discrepancy is wider among white men with and without college degrees (38% vs. 47%).
Satisfaction With Racial and Ethnic Diversity of Social Network
A slim majority of Americans (51%) are very satisfied with the racial and ethnic diversity of their group of close friends, and another 35% are somewhat satisfied. About one in ten (11%) are somewhat dissatisfied, and only three percent are very dissatisfied with the diversity of their close friends. There are no significant differences in satisfaction with racial and ethnic diversity based on the number of close contacts listed in the survey.
Republicans (62%) are more likely than independents (47%) and Democrats (45%) to say they are very satisfied with the racial and ethnic diversity of their close friend groups. White Democrats (32%) are less likely than either white Republicans (61%) or Democrats of color (56%) to say they are very satisfied with the diversity of their networks.
There are not significant differences by racial diversity of networks, although there is more of a gap in being very satisfied between white Democrats with completely white social networks (30%) and white Democrats who have at least one nonwhite person in their friendship network (37%). Among white Republicans with completely white social networks, 61% say they are very satisfied with the racial and ethnic diversity of their friendship networks, and that only slightly increases, to 63%, among white Republicans who have at least one nonwhite person in their friendship networks.
Black Americans (59%) and Hispanic Americans (59%) are most likely to say they are very satisfied with the racial and ethnic diversity of their close friend groups, and nearly half of white Americans (48%) and multiracial Americans (47%) also record high levels of satisfaction. Slightly fewer AAPI Americans (38%) report being very satisfied with the diversity of their social networks. White Americans who have four-year college degrees or higher (38%) are less likely than those without four-year degrees (54%) to say they are very satisfied with the diversity of their networks.
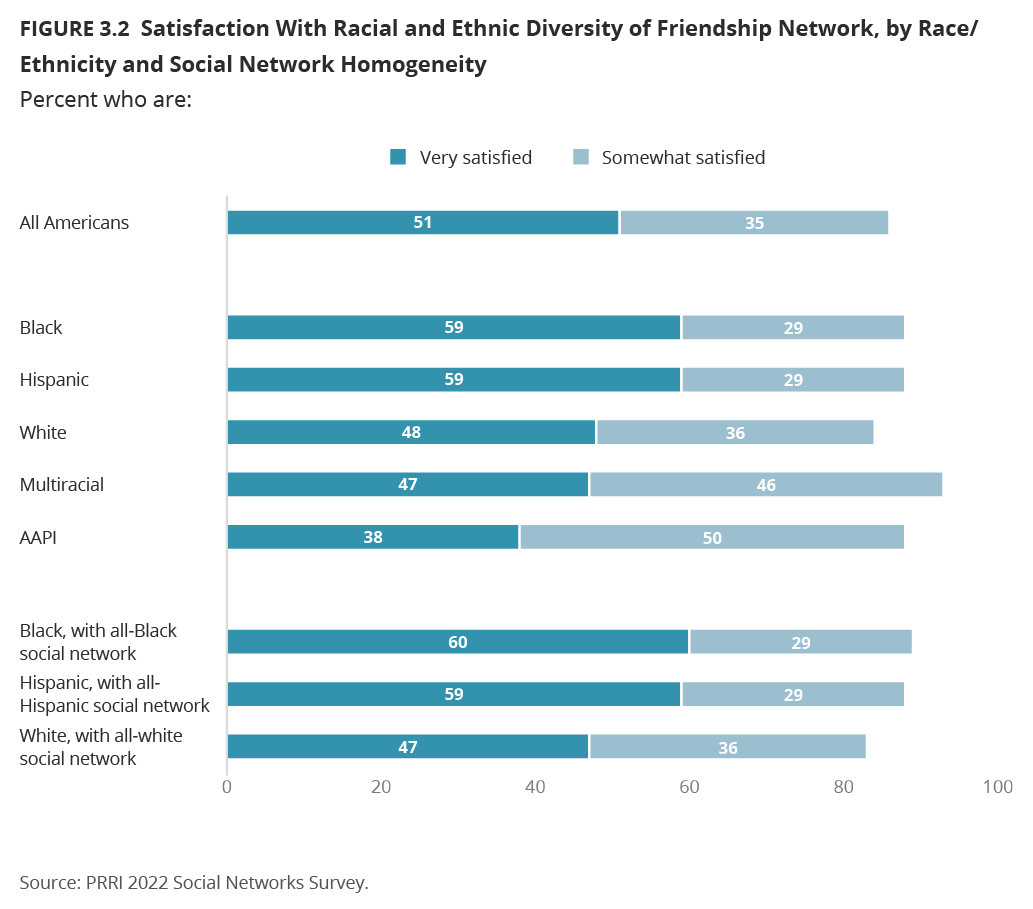
Among white Americans who have all-white networks, 47% are very satisfied with the racial and ethnic diversity of their networks, compared to 49% of those who do not have all-white networks. Six in ten Black Americans who have all-Black networks (60%) are very satisfied with the diversity of their networks, compared to 59% of those with multiracial networks. Similarly, 59% of Hispanic Americans with all-Hispanic networks and 59% with multiracial networks are satisfied with the racial and ethnic diversity of their networks.
Religious groups mostly align with their corresponding race groups. Six in ten or more Hispanic Protestants (67%), other Protestants of color (63%), other Christians (62%), and Black Protestants (60%) are very satisfied with the racial and ethnic diversity of their friend groups. Half or more of white evangelical Protestants (57%), Hispanic Catholics (56%), Jewish Americans (50%), white mainline Protestants (50%), and white Catholics (50%) say the same. Less than half of Latter-day Saints (46%), religiously unaffiliated Americans (43%), and other non-Christian religious Americans (43%) indicate they are very happy with the racial and ethnic diversity of their friend networks.
Satisfaction With Neighborhood and Community Connections
Neighborhood Connections
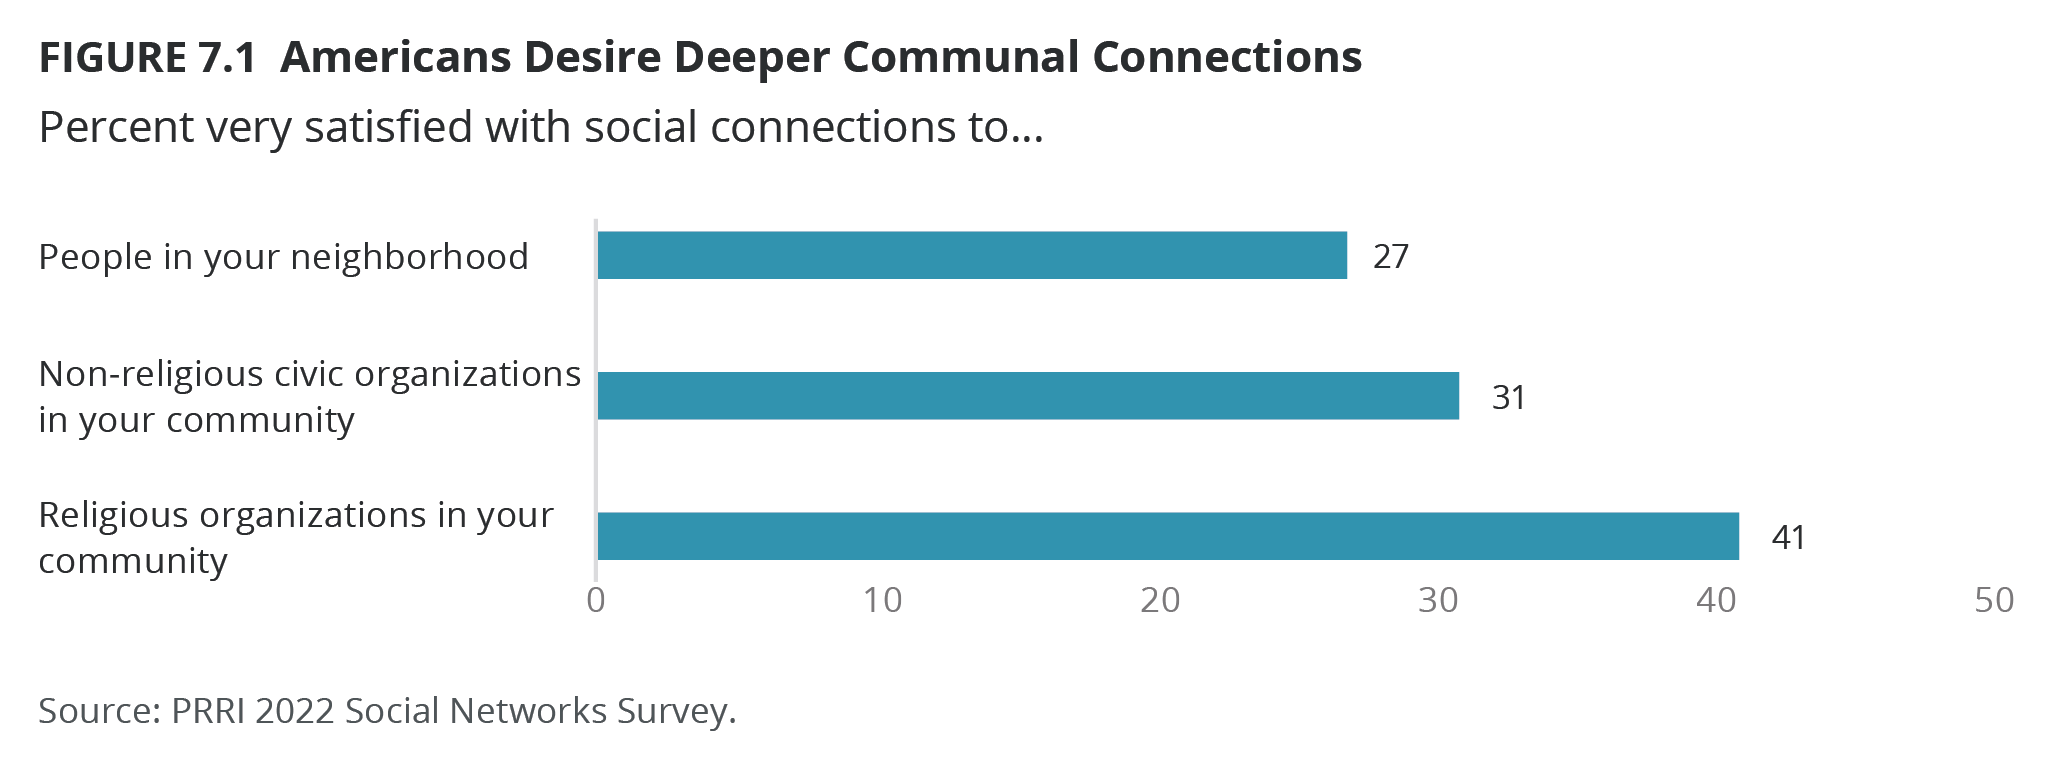
Most Americans are satisfied with the connections they feel with people in their neighborhoods, but fewer are very satisfied (27%) and more are somewhat satisfied (45%) than with other aspects of their social network. One in five (20%) are somewhat dissatisfied and eight percent are very dissatisfied with the connections they feel with people in their neighborhoods. One in four (26%) of those who listed no close connections on the survey report feeling very satisfied with their connections in their neighborhood, which increases slightly, to 30%, among those who listed the maximum number.
Republicans (33%) are more likely than independents (25%) and Democrats (24%) to say they are very satisfied with connections to people in their neighborhood.
By race, Black Americans are most likely to say they are very satisfied with their neighborhood connections (33%), while about one in four white Americans (27%) and Hispanic Americans (26%) say the same. Multiracial Americans (18%) and AAPI Americans (15%) are least likely to say they are very satisfied with connections in their neighborhoods. Americans with four-year college degrees (22%) are less likely than those without four-year college degrees (29%) to be satisfied with their neighborhood connections, and the gap is slightly larger among white Americans (22% with four-year degrees vs. 30% without).
Religious Organizations
Four in ten Americans (41%) are very satisfied and one-third (33%) are somewhat satisfied with their involvement with religious organizations in their communities, such as churches, synagogues, mosques, or other faith-based organizations. Less than one in five (16%) are somewhat dissatisfied, and eight percent are very dissatisfied.
Among those who claim a religious affiliation, 37% are very satisfied with their involvement with religious organizations in their communities. Satisfaction increases among those who attend religious services more frequently: 78% of those who attend more than once a week are very satisfied with their religious involvement. The proportion of very satisfied drops to 49% among those who attend once a week and 28% among those who attend religious services once or twice a month, 27% among those who attend a few times per year, and 24% among those who seldom attend. Interestingly, nearly half of those who never attend religious services (49%) are very satisfied with their involvement in religious organizations.
By specific religious affiliation, religiously unaffiliated Americans (56%) have the highest proportion very satisfied with their religious involvement. Four in ten or more white evangelical Protestants (43%) are very satisfied, as are 37% of other non-Christian religious Americans and 37% of Black Protestants. One-third or fewer white mainline Protestants (33%), white Catholics (30%), and Hispanic Catholics (27%) are very satisfied with their involvement in religious organizations in their community.
Civic Organizations
When it comes to involvement with non-religious civic organizations in their communities, such as sports leagues, clubs, and other volunteer organizations, 31% of Americans are very satisfied and 42% are somewhat satisfied. About one in five (19%) are somewhat dissatisfied and seven percent are very dissatisfied with their involvement with civic organizations.
While there are no partisan differences for satisfaction with involvement in religious organizations, when it comes to civic organizations, Republicans (36%) are more likely than independents (30%) and Democrats (27%) to be somewhat or very satisfied with their involvement in their communities.
White Catholics (36%) are the most likely religious group to say they are very satisfied with their involvement with civic organizations. About one-third of white evangelical Protestants (34%), religiously unaffiliated Americans (32%), and white mainline Protestants (31%) report the same. One in four or more Black Protestants (29%) and other non-Christian religious Americans (25%) report being very satisfied in this regard. Hispanic Catholics (21%) are least likely to say they are very satisfied with this aspect of their social and civic lives.
Overall Satisfaction With Social Connections
Overall, most Americans are satisfied with their social connections. When responses to all of the satisfaction items are combined, 39% are highly satisfied—meaning they answered all of the questions with somewhat or very satisfied responses—nearly half (48%) were less satisfied but still answered the question as more satisfied than dissatisfied, and only 14% provided more dissatisfied than satisfied responses.[4] Interestingly, there are no large differences in satisfaction by number of friends listed. Those who did not list any close contacts are similarly distributed: About four in ten are highly satisfied (39%), with slightly fewer generally satisfied (43%) and slightly more generally dissatisfied (19%).
Republicans report higher levels of overall satisfaction with their social connections than independents and Democrats. Nearly half of Republicans (47%) are in the highest satisfaction category, compared to 37% of independents and 34% of Democrats. A similar proportion of Republicans (44%) are generally satisfied with their networks, compared to 48% of independents and 51% of Democrats. Fewer Republicans (9%) than independents (15%) and Democrats (15%) are generally dissatisfied with their networks.
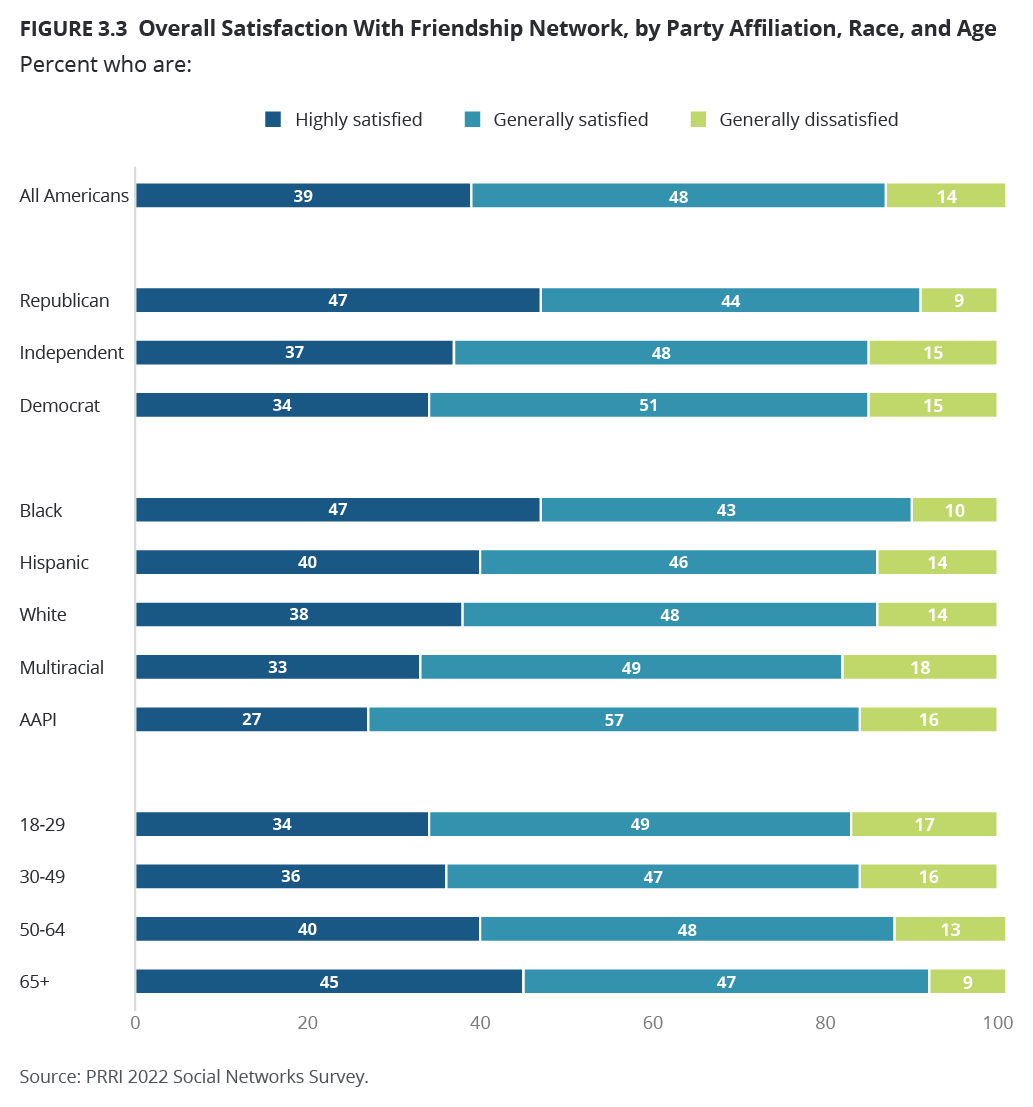
By race, Black Americans are most likely to be highly satisfied with their social connections (47%) and least likely to be generally dissatisfied (10%). Around four in ten Hispanic Americans (40%) and white Americans (38%) are highly satisfied, with 14% of each generally dissatisfied. Multiracial Americans and AAPI Americans are least likely to be highly satisfied (33% and 27%, respectively) and most likely to be generally dissatisfied with their social networks (18% and 16%, respectively).
Among religious groups, other Christians and Black Protestants have the largest contingents in the highly satisfied category (47% and 46%, respectively), as do four in ten or more white evangelical Protestants (43%), white Catholics (41%), Hispanic Protestants (41%), Latter-day Saints (41%), and white mainline Protestants (40%). One-third or more Hispanic Catholics (38%), Jewish Americans (38%), other Protestants of color (35%), and religiously unaffiliated Americans (33%) are in the highest satisfaction category, while only 30% of other non-Christian religious Americans report high satisfaction. Other non-Christian religious Americans (22%), religiously unaffiliated Americans (17%), and Hispanic Protestants (17%) have the largest contingents in the generally dissatisfied category.
Americans ages 65 and over are more likely to be highly satisfied with their social connections than younger cohorts, with 45% in this category, compared to 40% among those ages 50–64, 36% among those ages 30–49, and 34% among those ages 18–29. Conversely, those ages 65 and over are least likely to be generally dissatisfied (9%) compared to those ages 50–64 (13%), 30–49 (16%), and 18–29 (17%).
Friendship Networks and Perceptions of Pluralism and the State of America
The composition of Americans’ friendship networks, especially the presence of homogeneous networks, strongly impacts the views of respondents on questions about American identity, pluralism, Christian nationalism, and the changing demographics of the country. Generally speaking, among those who are the least supportive of racial and religious pluralism, the presence of just one person who does not share their attributes in terms of party, race, or religion has a significant impact on their views.
Nostalgia for the America of the 1950s
Americans are divided over how American culture and way of life have changed since the 1950s. Half (49%) say things have mostly changed for the better, while half (50%) say they have mostly changed for the worse. Democrats (65%) are about twice as likely as Republicans (33%) to say that American culture and way of life have improved since the 1950s, while independents are evenly divided (48% say it has changed for the better, 50% say it has changed for the worse).
Americans whose social networks only include Democrats (66%) are much more likely than those whose networks only contain Republicans (33%) or independents (44%) to say that American culture and way of life have changed for the better since the 1950s. Americans with politically diverse social networks are evenly divided (49% say things have improved, 50% say things have worsened).
White Americans are least likely to say American culture has changed for the better since the 1950s (45%), compared to half of multiracial Americans (50%) and majorities of Hispanic Americans (54%), Black Americans (59%), and AAPI Americans (64%).
Americans whose friendship networks consist of only white people (43%) are less likely than Americans whose networks consist of only Black people (54%) or Hispanic people (51%) to say American culture and way of life has changed for the better since the 1950s. Americans with racially diverse social networks (55%) are also more likely than Americans whose networks include only white people to say American culture and way of life has changed for the better since the 1950s.
Among white Americans, those whose friendship networks include only white people are less likely than those whose friendship networks include at least one nonwhite person to say that American culture and way of life has changed for the better since the 1950s (43% vs. 51%).
White Christian groups are the least likely religious groups to say that American culture and way of life have changed for the better since the 1950s. This includes 30% of white evangelical Protestants, 43% of white Catholics, 44% of white mainline (non-evangelical) Protestants, and 44% of Latter-day Saints. Hispanic Protestants (37%) and other Christians (43%) are the only groups that are not predominantly white among whom less than half say that American culture and life have changed for the better since the 1950s. Half of Jewish Americans (50%) and around six in ten Black Protestants (59%), Hispanic Catholics (59%), other non-Christian religious Americans (60%), and religiously unaffiliated Americans (61%) say American culture and way of life have changed for the better since the 1950s.
Americans whose social networks include only Protestants (41%) are much less likely than those whose networks include only Catholics (52%) or religiously unaffiliated people (54%) to say that American culture and way of life have improved since the 1950s. Americans who have social networks of multiple religions are evenly divided over changes to American culture and way of life (50% say it has changed for the better).
Christian Nationalism: Belief That God Has a Special Role for America
Most Americans reject the idea that God has granted America a special role in human history (43% agree, 55% disagree).
Nearly seven in ten white evangelical Protestants (68%) and Hispanic Protestants (68%), along with 58% of African American Protestants and 56% of other nonwhite Protestants, agree that God has a special role for America. Less than half of every other major religious group agrees with this statement, including 46% of white mainline Protestants, 46% of white Catholics, 44% of Hispanic Catholics, 34% of Jewish Americans, 35% of those identifying with other non-Christian religions, and only 16% of religiously unaffiliated Americans.
Americans whose social networks include only Protestants (65%) are much more likely than those whose networks include only Catholics (48%) or religiously unaffiliated people (25%) to believe that God has granted America a special role in history. Americans who have social networks of multiple religions are more divided (40% agree, 59% disagree).
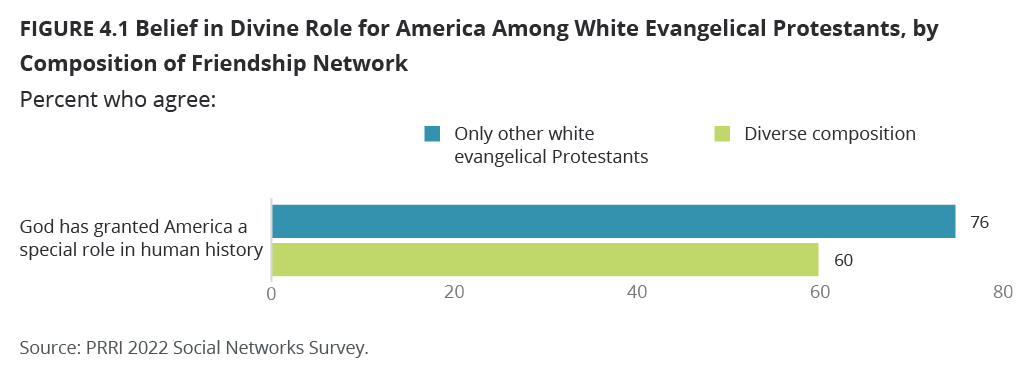
Among white evangelical Protestants—the religious group most likely to believe in a divinely ordained role for America—those who have friendship networks consisting of only other evangelical Protestants are significantly more likely than those who have at least one non-evangelical in their friendship networks to believe God has a special role for America (75% vs. 60%).
Republicans (64%) are much more likely than independents (37%) and Democrats (33%) to agree that God has granted America a special role in human history. Around two-thirds of Americans whose social networks consist of only Republicans (65%), compared to about one-third of Democrats (36%) and four in ten independents (43%) and those with politically diverse networks (41%), believe in a divinely ordained role for America.
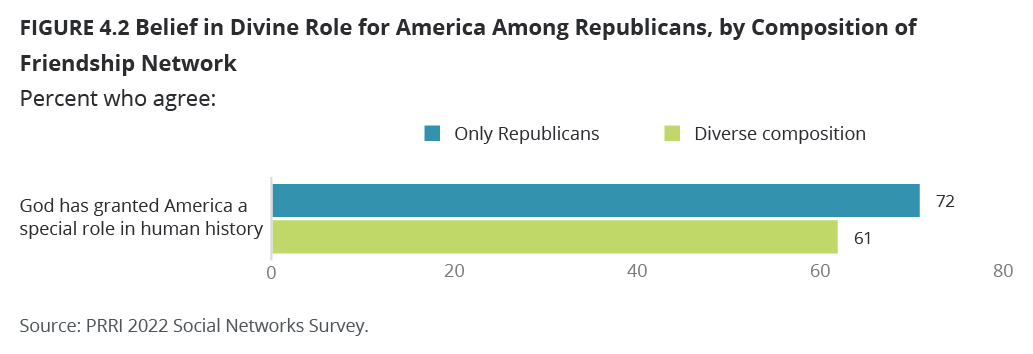
Among Republicans—the partisan group most likely to believe in a divinely ordained role for America—those who have friendship networks consisting of only other Republicans are significantly more likely than those who have at least one non-Republican in their friendship networks to believe God has a special role for America (72% vs. 61%).
Important Traits for Being “Truly American”
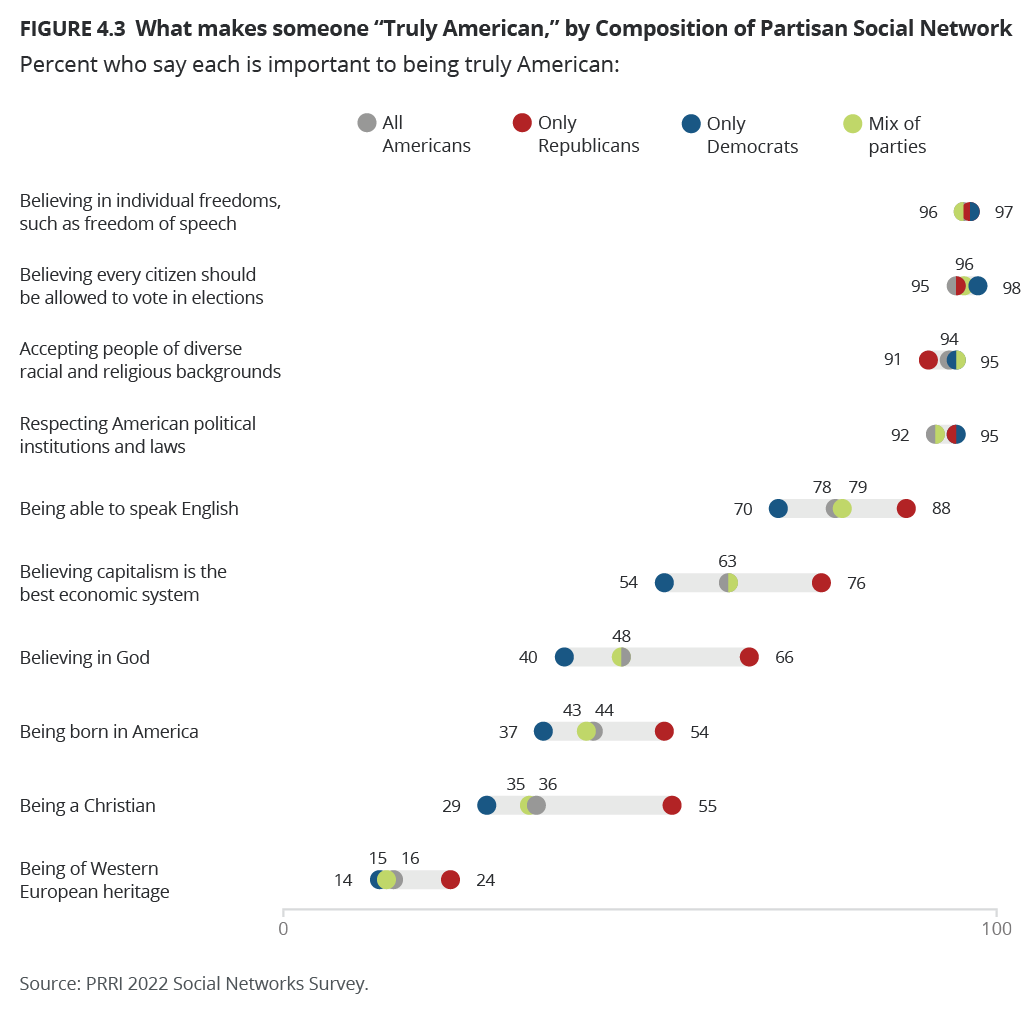
There is broad agreement among the public about what counts as essential American traits. More than nine out of ten Americans agree that the following attributes are important for being “truly American”: believing in individual freedoms such as freedom of speech (96%), believing that every citizen should be able to vote in elections (95%), accepting people of diverse racial and religious backgrounds (94%), and respecting American political institutions and laws (92%). These shares of around nine in ten Americans hold true across nearly every demographic group and type of social network.
Majorities of Americans also say speaking English (78%) or believing that capitalism is the best economic system (63%) are at least somewhat important to being truly American.
Americans are more divided over other aspects of what makes someone truly American. Less than half of Americans say that believing in God (48%), being born in America (44%), being a Christian (36%), or being of Western European heritage (16%) are important for being truly American. Notably, this is the first time in PRRI trend data that less than half of Americans think that a belief in God is important to being truly American. The share who say it is important has declined, from a high of 69% in 2015 to 52% in 2018 and 56% in 2021.
Differences by Partisanship and Party Composition of Friendship Networks
There are large gaps between Republicans and Democrats on whether believing in God (69% vs. 41%, respectively), being able to speak English (91% vs. 66%), being a Christian (54% vs. 29%), believing that capitalism is the best economic system (78% vs. 54%), being born in America (56% vs. 37%), or being of Western European heritage (26% vs. 12%) are important to being truly American.
There are large gaps between Americans whose social networks consist only of Democrats or Republicans over whether believing in God (40% vs. 66%, respectively), being able to speak English (70% vs. 88%), being a Christian (29% vs. 55%), believing capitalism is the best economic system (54% vs. 76%), being born in America (37% vs. 54%), or being of Western European heritage (14% vs. 24%) makes someone truly American.
Americans who have politically diverse networks generally lean closer to the views of people whose networks consist solely of Democrats. Less than half of Americans whose networks include a mix of partisans say believing in God (48%), being born in America (43%), being a Christian (35%), or being of Western European heritage (15%) is important to being truly American.
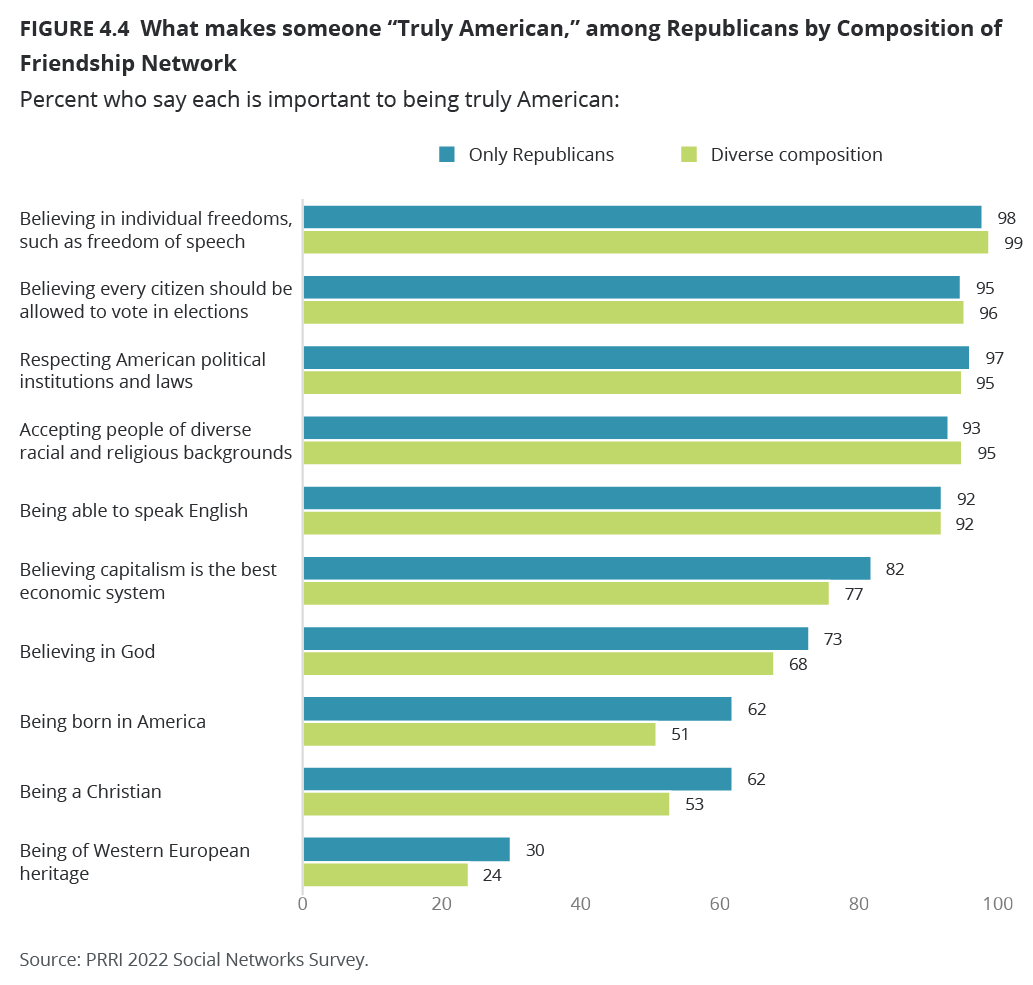
Among Republicans—the partisan group most likely to affirm the importance of Christian identity, native birth, or European heritage for being truly American—those whose friendship networks include only Republicans are slightly more likely than those whose friendship networks include at least one non-Republican person to say that believing in God (73% vs. 68%), being Christian (62% vs. 53%), being born in America (62% vs. 51%), or being of Western European heritage (30% vs. 24%) are important for being truly American.
Differences by Religion and Religious Composition of Friendship Networks
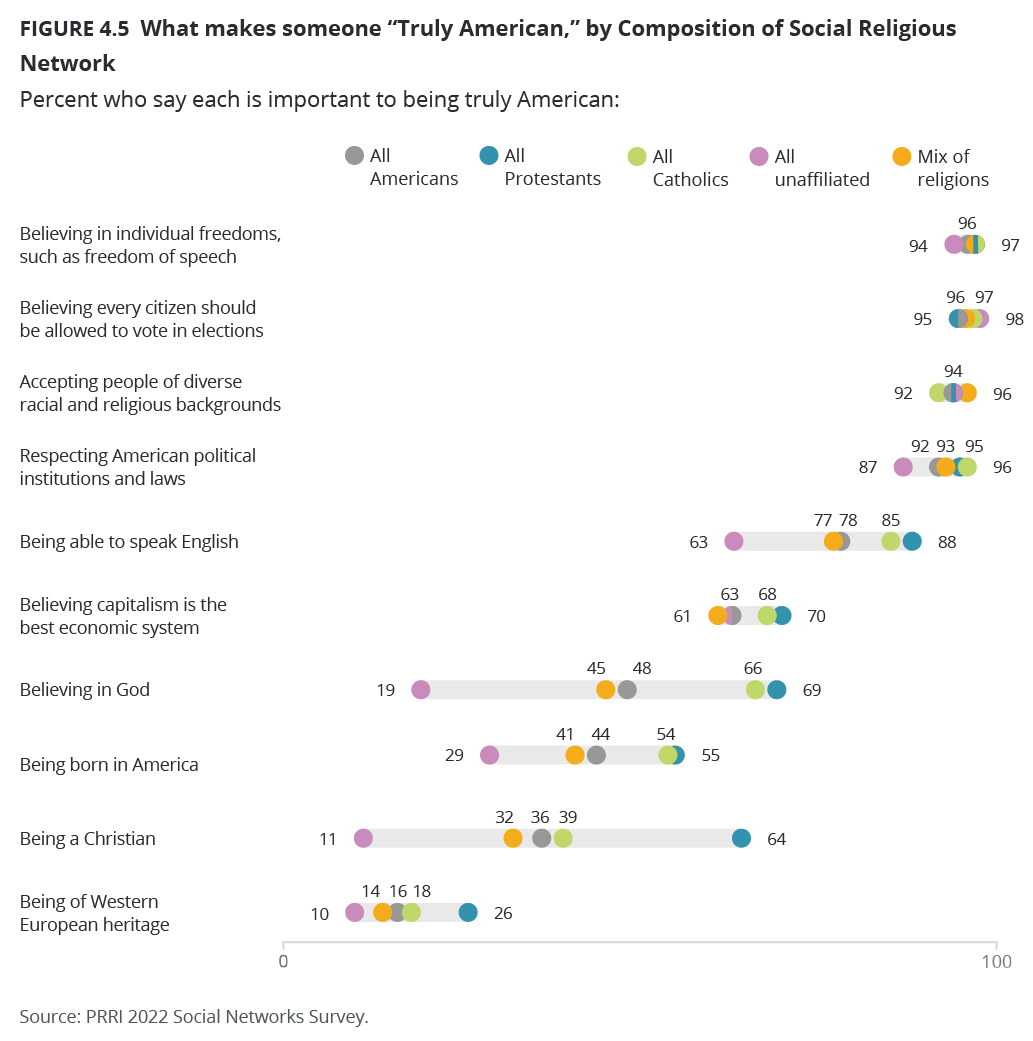
White Christian groups stand out in their assessments of what makes someone truly American, especially on attributes where there is less consensus. Around three-quarters of white evangelical Protestants say it is at least somewhat important to believe in God to be truly American (77%), compared to a slim majority of white Catholics (53%) and almost half of white mainline Protestants (49%). Seven in ten Black Protestants (71%) and Hispanic Catholics (70%) say belief in God is at least somewhat important to being truly American, while just 37% of other non-Christian religious Americans and 14% of religiously unaffiliated Americans say the same.
Nearly seven in ten white evangelical Protestants (68%) say that being a Christian is at least somewhat important to being truly American. Black Protestants are the only other major religious group among whom a majority say being Christian is important to being truly American (62%), compared to less than half of Hispanic Catholics (40%), white mainline Protestants (37%), white Catholics (37%), 20% of non-Christian religious Americans, and just six percent of religiously unaffiliated Americans.
Interestingly, Black Protestants (64%) are more likely than other religious groups to say that being born in America is at least somewhat important to being truly American, along with majorities of white evangelical Protestants (55%) and Hispanic Catholics (52%). Less than half of white Catholics (45%), white mainline Protestants (43%), other non-Christians (42%), and religiously unaffiliated Americans (33%) say the same.
Around one in five or less white evangelical Protestants (22%), Black Protestants (22%), white mainline Protestants (21%), white Catholics (20%), and other non-Christians (18%), and around one in ten Hispanic Catholics (11%) or religiously unaffiliated Americans (9%), say that being of Western European heritage is important to being truly American.
Americans whose social networks consist solely of religiously unaffiliated people are less likely than those whose networks are made up of only Protestants or Catholics or are religiously diverse are less likely to say that any of the more contentious beliefs or practices make someone truly American. Less than three in ten say that being born in America (29%), believing in God (19%), being a Christian (11%), or being of Western European heritage (10%) is important to being truly American.
Majorities of Americans whose social networks consist of only Protestants say believing in God (69%), being a Christian (64%), or being born in America (55%) are important to being truly American. One-quarter (26%) of this group says the same of being of Western European heritage.
Americans whose networks consist entirely of Catholics are similar to Protestant-only networks. The following proportions say these attributes are important to being truly American: believing in God (66%), being born in America (54%), being a Christian (39%), or being of Western European heritage (18%).
Americans who have religiously diverse networks fall in between those who have religiously homogeneous networks and only unaffiliated networks in what they consider important to being truly American: 45% say believing in God, 41% say being born in America, 32% say being a Christian, and 14% say being of Western European heritage is important to being truly American.
Among white evangelical Protestants—the religious group most likely to affirm the importance of Christian identity, native birth, or European heritage for being truly American—those whose friendship networks include only other white evangelical Protestants are about as likely or more likely than those whose friendship networks include at least one non-evangelical Protestant person to say that believing in God (81% vs. 74%), being Christian (78% vs. 61%), being born in America (55% vs. 51%), or being of Western European heritage (31% vs. 14%) are important for being truly American.
Preference for Religious Pluralism Versus a Christian Nation
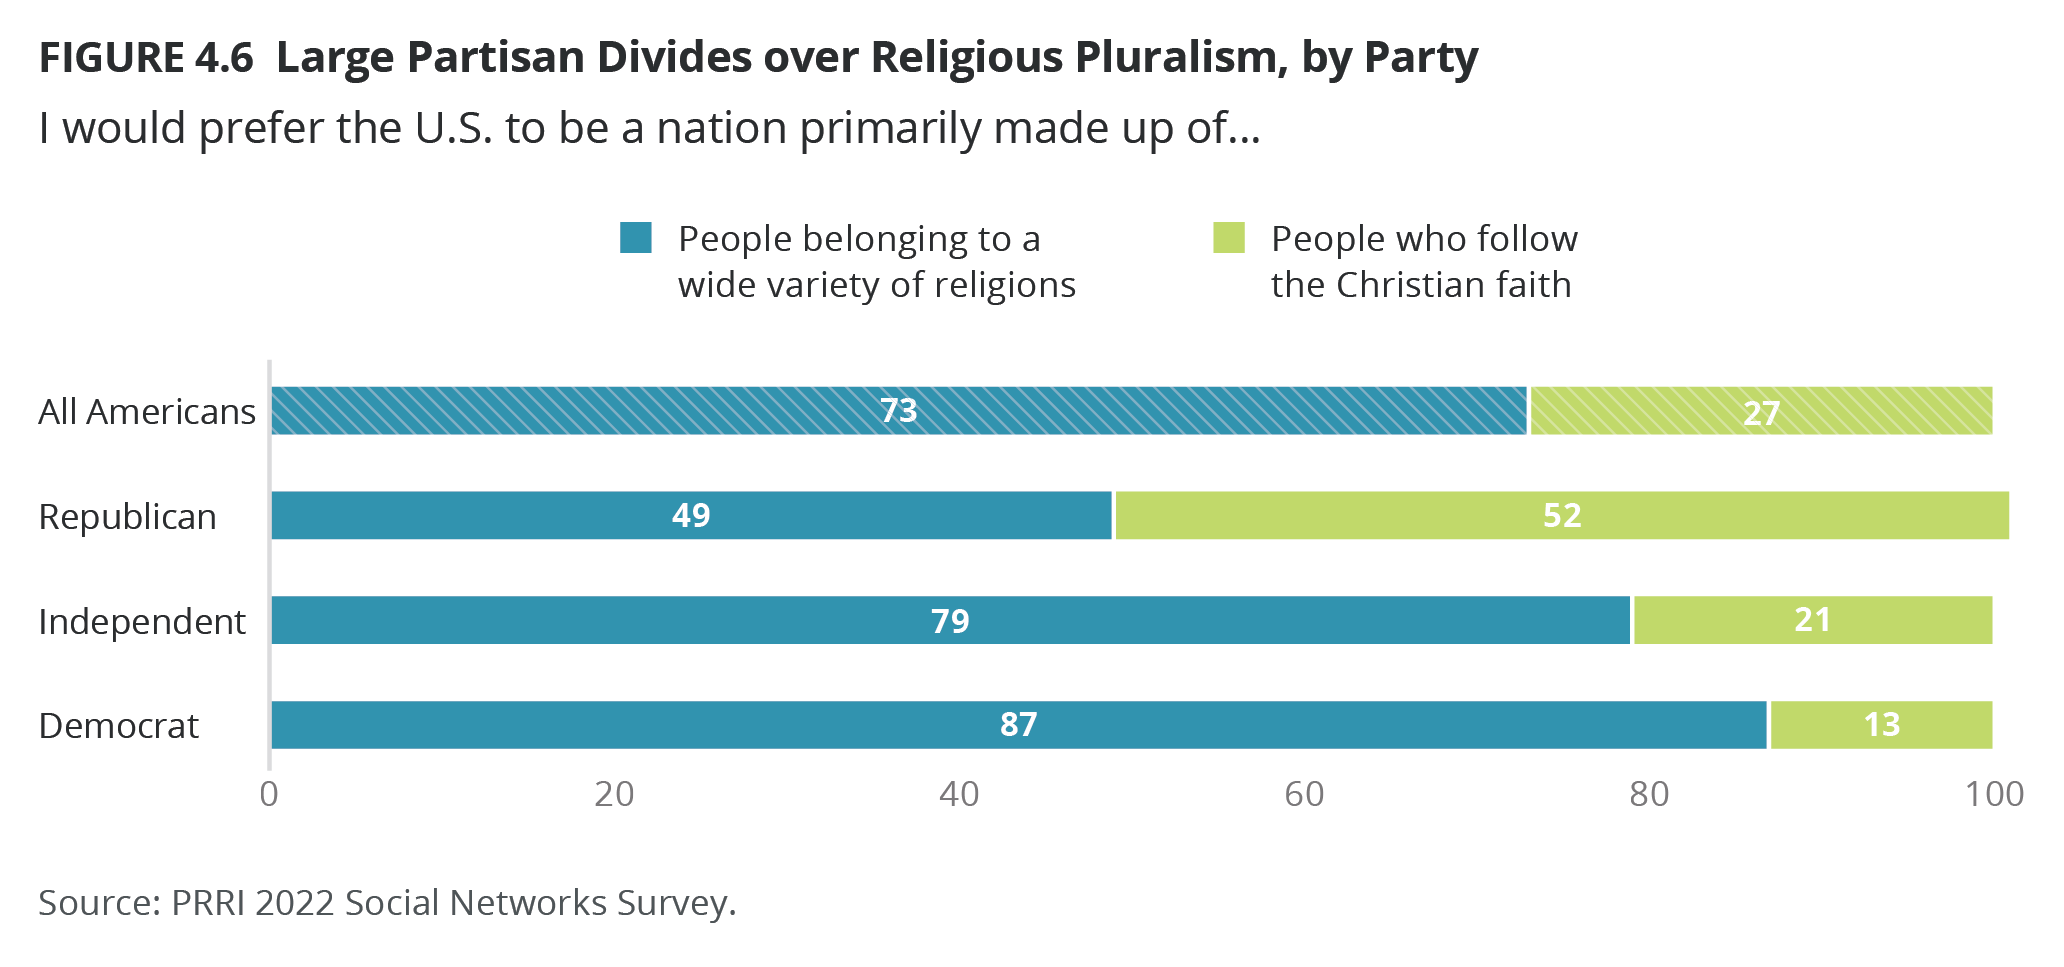
When asked to put themselves on a scale where one end is the statement “I would prefer the U.S. to be a nation made up of people belonging to a wide variety of religions” and the other end is the statement “I would prefer the U.S. to be a nation primarily made up of people who follow the Christian faith,” around half of Americans (50%) mostly agree that the U.S. should be a diverse country made up of people of a variety of faiths. Three in ten (31%) place themselves in the middle of the scale, while 18% say they would prefer the U.S. to be comprised primarily of Christians.
Less than three in ten Republicans (29%), compared to a slim majority of independents (51%) and two-thirds of Democrats (65%), express a preference for a religiously diverse country. Around four in ten Republicans (39%) place themselves toward the middle of the scale, while 32% say they would prefer the U.S. be primarily made up of Christians. Around one-third of independents (34%) and one-quarter of Democrats (23%) place themselves in the middle of the scale, and less than two in ten independents (14%) and Democrats (11%) place themselves at the far end of the scale saying they would prefer the country to be primarily Christian.
Support for a religiously pluralistic country among Republicans—the partisan group least likely to express a preference for religious pluralism—is relatively similar among Republicans whose social networks include only Republicans (26%) compared to those whose networks include at least one non-Republican (30%).
Only one in five white evangelical Protestants (20%) express a preference for a religiously diverse nation (20%), as do one-third of Hispanic Protestants (33%). Between four in ten and half of Latter-day Saints (39%), Black Protestants (40%), Hispanic Catholics (43%), white mainline Protestants (46%), white Catholics (49%), and other Christians (51%) express a preference for a religiously diverse nation. At the other end of the spectrum, more than seven in ten religiously unaffiliated Americans (71%), Jewish Americans (76%), and other non-Christian religious Americans (77%) prefer a religiously diverse nation.
Americans whose networks only include Protestants (28%) are less likely than those whose networks only include Catholics (45%) to say they prefer a religiously diverse country. Majorities of Americans who have religiously diverse networks (54%) or have networks of only religiously unaffiliated people (67%) are more likely to prefer a diverse country.
Among white evangelical Protestants—the religious group least likely to express a preference for a religiously diverse country—those whose friendship networks include only other evangelical Protestants (16%) are less likely than those whose friendship networks include at least one non-evangelical Protestant person (23%) to say that they prefer to live in a religiously diverse country.
Preferences for Racial Diversity Versus a Nation of Mostly Western European Heritage
When asked to put themselves on a scale where one end is the statement “I would prefer the U.S. to be made up of people from all over the world” and the other end is the statement “I would prefer the U.S. to be a nation primarily made up of people of Western European heritage,” almost six in ten Americans (59%) mostly agree that the U.S. should be a diverse country made up of people from all over the world. One-third (33%) place themselves in the middle of the scale, while just seven percent say they would mostly prefer the U.S. to be made up of people of Western European heritage.
White Americans (54%) are less likely than Black Americans (70%), multiracial Americans (65%), Hispanic Americans (65%),and AAPI Americans (73%) to express a preference for racial diversity in America.
Americans whose social networks only include white people are much less likely to express preferences for racial diversity (52%), compared to around two-thirds of those whose networks only include Hispanic people (66%), only Black people (66%), or have diverse networks (67%).
Among white Americans, those whose friendship networks include only white people are less likely to express a preference for a racially diverse nation than those who have at least one nonwhite person in their social networks (51% vs. 63%).
Race and Systemic Racism
The survey also included a range of questions about race and systemic racism, summarized in the chart below. While answers on individual items show some variation, these questions are highly correlated with one another.
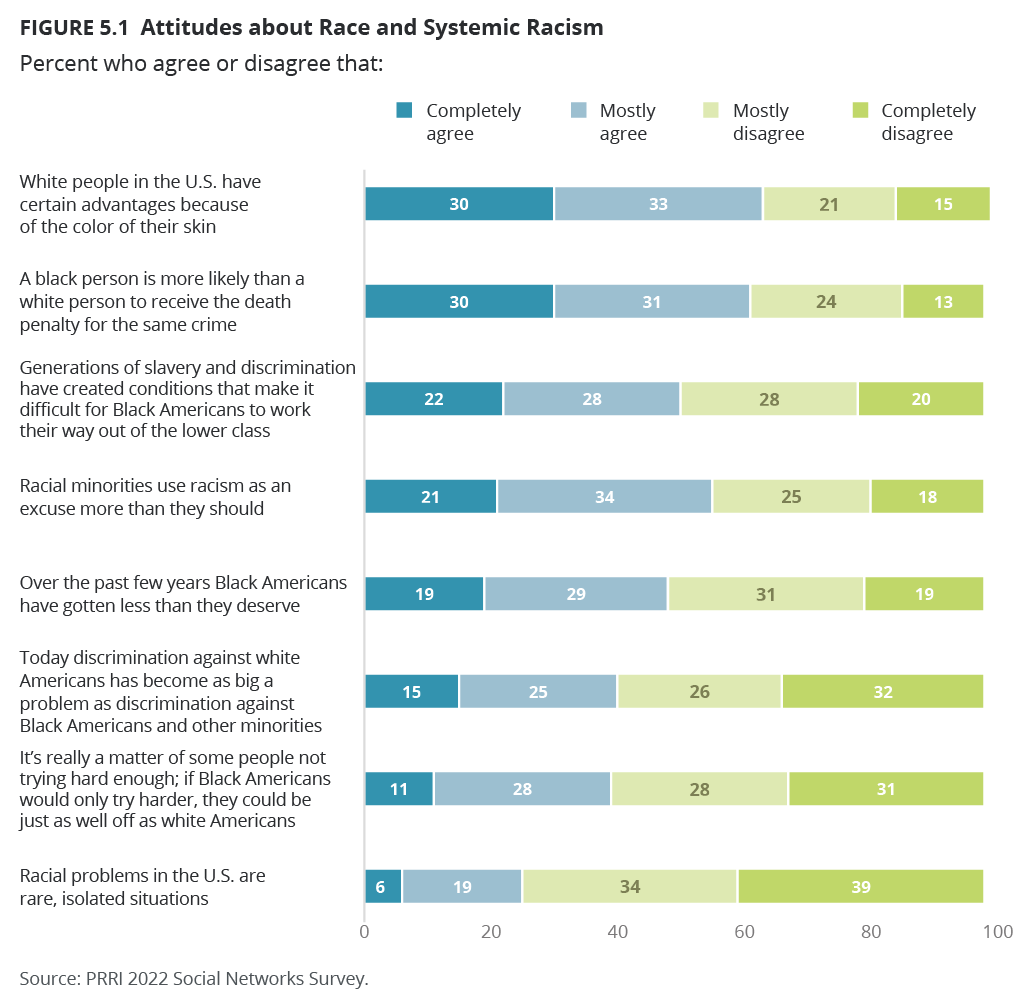
Attitudes on these questions are also highly stratified by race, party, and religion of the respondent, along with the racial, partisan, and religious composition of their social networks. For example, this stratification can be seen in the following question about structural racism: “Generations of slavery and discrimination have created conditions that make it difficult for Black Americans to work their way out of the lower class” (50% agree, 48% disagree).
Unsurprisingly, white Americans (43%) are less likely than Black Americans (77%), multiracial Americans (67%), AAPI Americans (63%), or Hispanic Americans (52%) to agree that the legacy of slavery and discrimination still has a negative impact on the economic situation of Black Americans.
White Americans whose social networks only include other white people (42%) are less likely than those whose social networks include at least one nonwhite person (58%) to say that the legacy of slavery and discrimination still have an impact on the lives of Black Americans.
There are deep partisan gaps on how the legacy of slavery and discrimination have held back Black Americans. Two in ten Republicans (20%), compared to half of independents (49%) and three-quarters of Democrats (75%), agree with the statement that “Generations of slavery and discrimination have created conditions that make it difficult for Black Americans to work their way out of the lower class.” Republicans whose networks only include other Republicans (13%) are less likely than those whose networks include at least one non-Republican (23%) to agree with the statement.
White Christians, particularly white evangelical Protestants, are less likely than members of other religious groups to acknowledge the lasting repercussions that slavery and discrimination have had on Black Americans: 28% of white evangelical Protestants, 35% of white Catholics, 38% of Latter-day Saints, 38% of white mainline Protestants, 46% of other Protestants of color, 47% of Hispanic Protestants, 49% of Hispanic Catholics, 50% of other Christians, 55% of Jewish Americans, 66% of religiously unaffiliated Americans, 68% of other non-Christian religious Americans, and 77% of Black Protestants agree that the legacy of slavery and discrimination make it hard for Black Americans to work their way out of the lower class.
White evangelical Protestants whose networks only include other evangelical Protestants (23%) are less likely than those whose social networks include at least one non-evangelical Protestant (33%) to agree that slavery and discrimination still have an impact on Black Americans.
Perceptions of Impact of Immigrants
Americans are about twice as likely to say that the growing number of newcomers from other countries strengthens American society (65%) than to say newcomers threaten traditional American customs and values (33%). This is the largest share of Americans who have said that immigrants strengthen America since PRRI began tracking the question in 2011 and represents a nine-point increase since 2021 (56%).
Asian Americans and Pacific Islanders (83%) are most likely to say immigrants strengthen American society, along with 75% of Hispanic Americans, 71% of multiracial Americans, and 70% of Black Americans. White Americans (59%) are least likely to say immigrants strengthen American society.
Americans whose social networks are exclusively white (59%) are less likely than those whose networks consist of only Black people (69%), only Hispanic people (76%), or a mix of races (71%) to say that immigrants strengthen American society.
Among white Americans, those whose friendship networks include only white people are less likely than those who have at least one nonwhite person in their social networks to say that immigrants strengthen the country (58% vs. 65%).
One in five Americans (26%) report that they have at least one immigrant in their friendship networks, compared to 73% who say none of their close friends are immigrants. Americans whose social networks include at least one immigrant (76%) are more likely than those whose networks have no immigrants (62%) to say that immigrants strengthen the country.
Democrats (85%) are more likely than independents (67%) and about twice as likely as Republicans (39%) to say that immigrants strengthen American society. Republicans whose social networks only include other Republicans (33%) are less likely than those whose networks include at least one non-Republican to agree (41%).
White evangelical Protestants stand out as the only religious group among whom less than half (42%) say that immigrants strengthen America, compared to majorities of white mainline Protestants (57%), white Catholics (57%), other Protestants of color (62%), Hispanic Protestants (66%), other Christians (69%), Latter-day Saints (70%), Hispanic Catholics (76%), religiously unaffiliated Americans (76%), Jewish Americans (79%), and other non-Christians (79%).
White evangelical Protestants whose social networks only include other evangelicals (35%) are less likely to hold this opinion than those whose networks are more religiously diverse (47%).
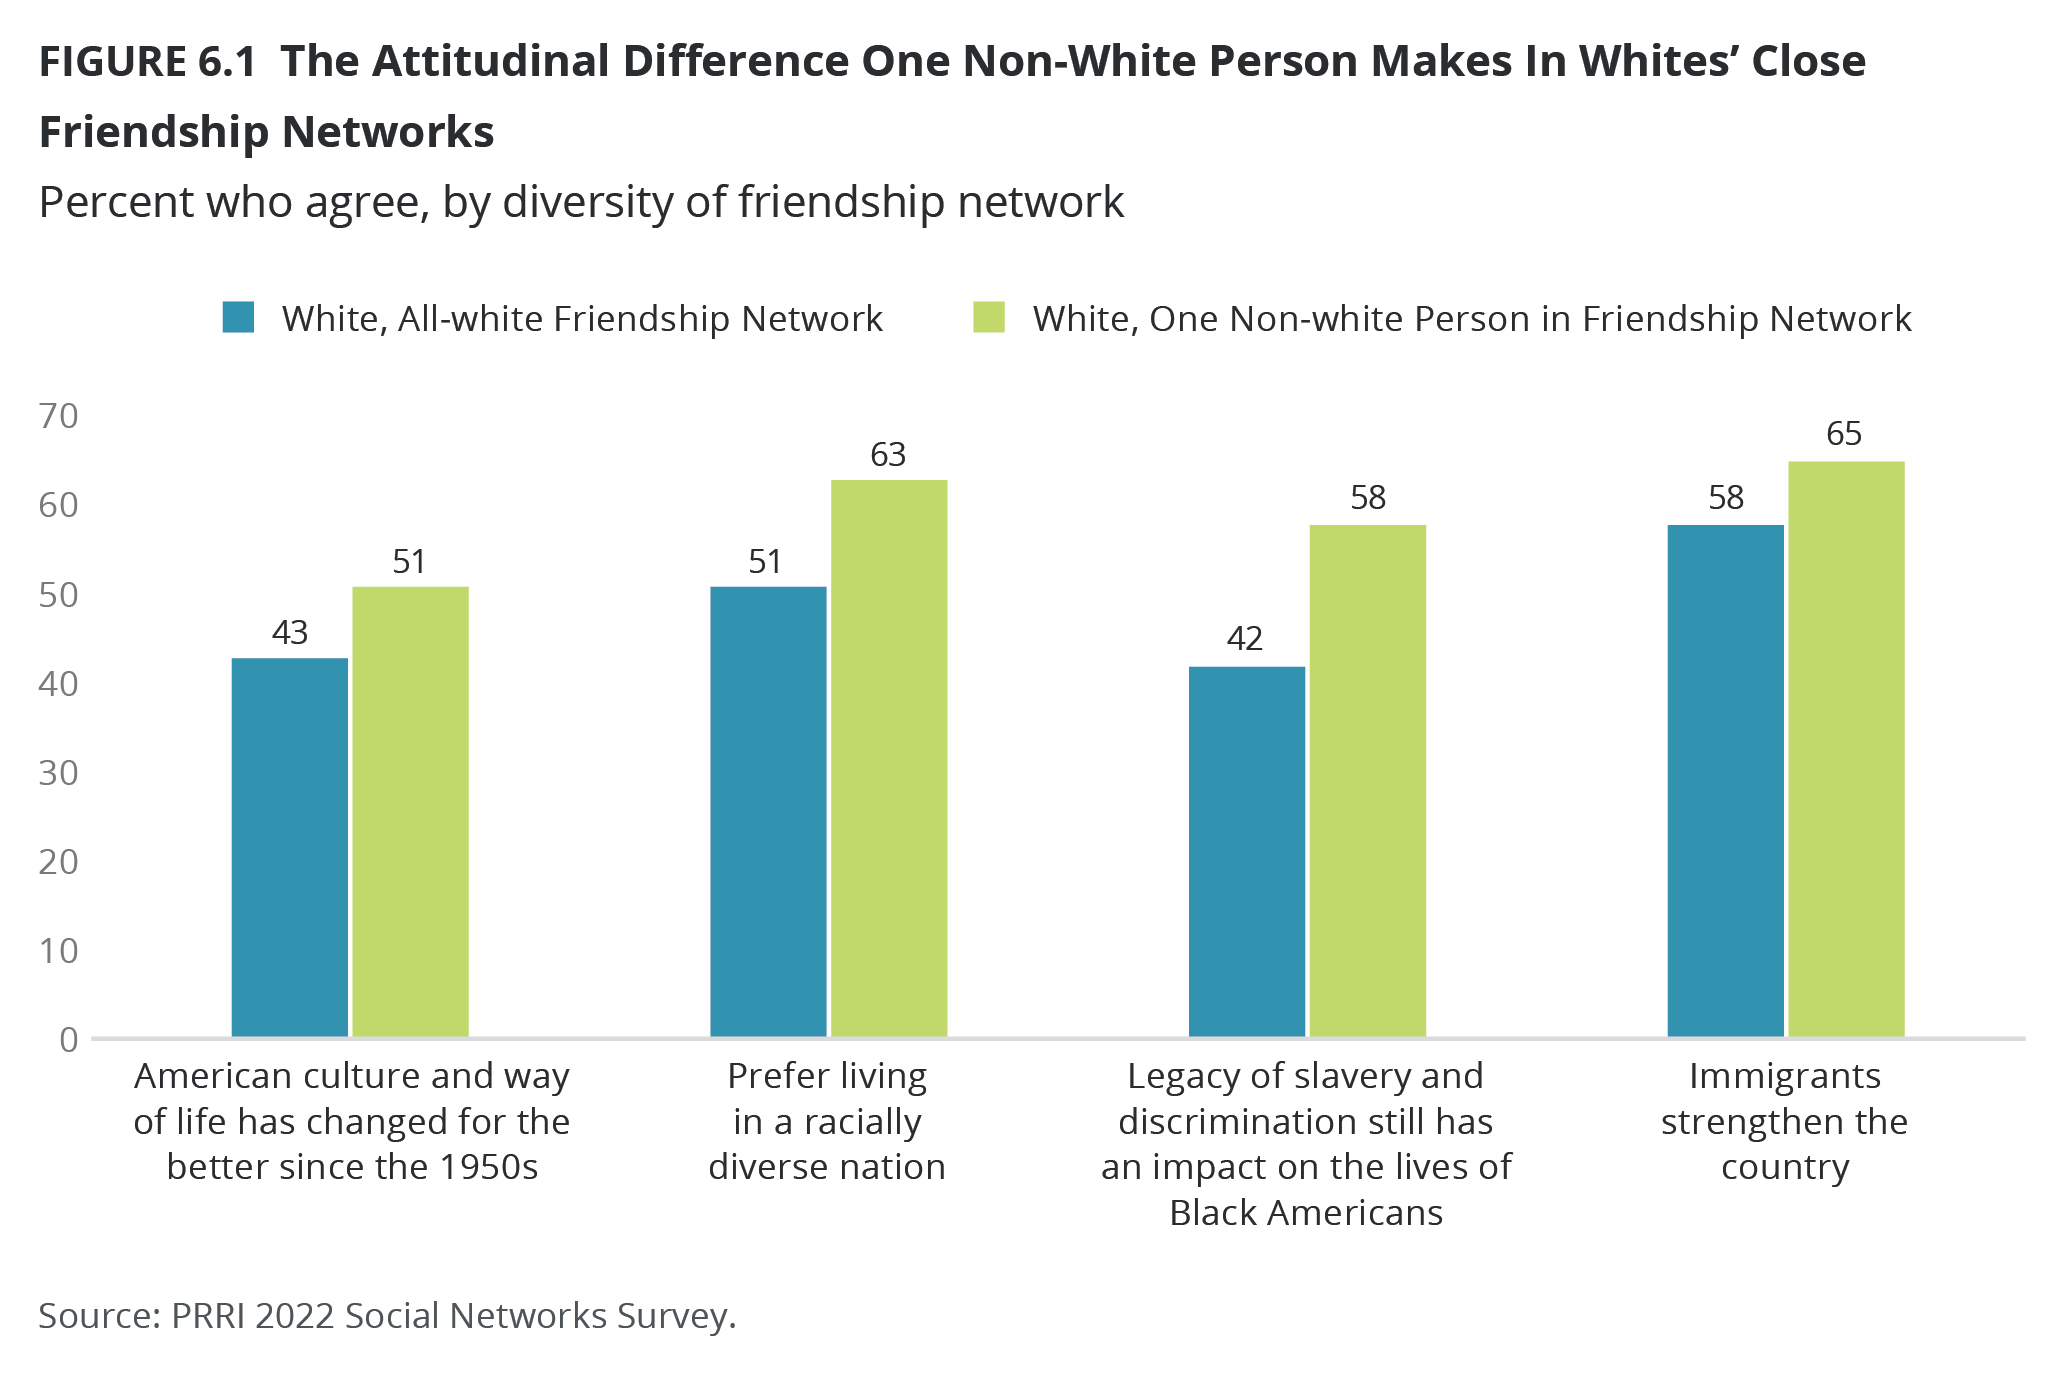
In Summary: The Difference Diverse Friendship Networks Make
On a range of issues concerning cultural change, racial justice and immigration, white Americans whose friendship networks include at least one non-white person express more support for pluralism and diversity than white Americans whose friendship networks are all-white. White Americans with more diverse friendship networks are more likely to think American culture and way of life have changed for the better since the 1950s, prefer living in a racially diverse nation, and believe that the legacy of slavery and discrimination still have an impact on the lives of Black Americans. White Americans whose social networks include at least one non-white person are also more likely to believe that immigrants strengthen the country.
Efforts to Build Bridges Across Divides
Differences in Beliefs
A majority of Americans (56%) say that they try to build relationships with people who hold religious or non-religious views that they disagree with.
Majorities of all partisan groups say that they try to build relationships with people of different religious beliefs, including 51% of Republicans, 57% of independents, and 58% of Democrats.
There are only small partisan differences based on the partisan makeup of partisan networks. Republicans whose social networks only include other Republicans (48%) are about as likely as Republicans whose networks include at least one non-Republican (50%). The same pattern holds true among Democrats, including 57% of Democrats whose networks consist solely of other Democrats, and 60% among Democrats who list at least one non-Democrat in their network.
White Catholics (48%) and Black Protestants (50%) are the only religious group where less than a majority say they try to build relationships across lines of disagreement, compared to majorities of other groups, including 62% of white mainline Protestants, 58% of white evangelical Protestants, 58% of other non-Christian religious Americans, 56% of religiously unaffiliated Americans, and 52% of Hispanic Catholics.
Majorities of Americans of all types of religious social networks agree that they try to seek out relationships with people whose religious beliefs they disagree with, including 53% of people whose networks only include Protestants, 55% of those whose networks only include Catholics, and 57% of those whose networks only include religiously unaffiliated people. Those who have religiously diverse networks are similarly likely to say the same (57%). Those who did not list anyone in their social networks are less likely to say they seek out relationships across lines of disagreement (45%).
Racial Divides
Around eight in ten Americans (81%) agree with the statement, “I try to build relationships with people who are different races or ethnicities than I am.” Around eight in ten Americans of all races and ethnicities agree, including 79% of Black Americans, 81% of white Americans, 81% of Hispanic Americans, 83% of AAPI Americans, and 85% of multiracial Americans.
Americans whose social networks only include white people (81%) are slightly more likely than those whose networks only include Black people (74%) or Hispanic people (76%) to say they try to build relationships with people who are different races or ethnicities. Americans who have racially diverse networks (87%) are somewhat more likely than those with homogeneous networks to agree. Those who list no one in their social networks are less likely to say they try to build relationships across racial lines (67%).
Among white Americans, those whose friendship networks include only white people are slightly less likely than those who have at least one nonwhite person in their social networks to say that they try to build relationships with people who are different races or ethnicities (81% vs. 87%).
Republicans (79%), independents (81%), and Democrats (84%) are similarly likely to say that they try to build relationships with people of other races or ethnicities. However, Republicans whose social networks consist only of other Republicans (76%) are somewhat less likely than those whose networks include at least one non-Republican (82%) to say they seek out relationships with people of other races or ethnicities.
Survey Methodology
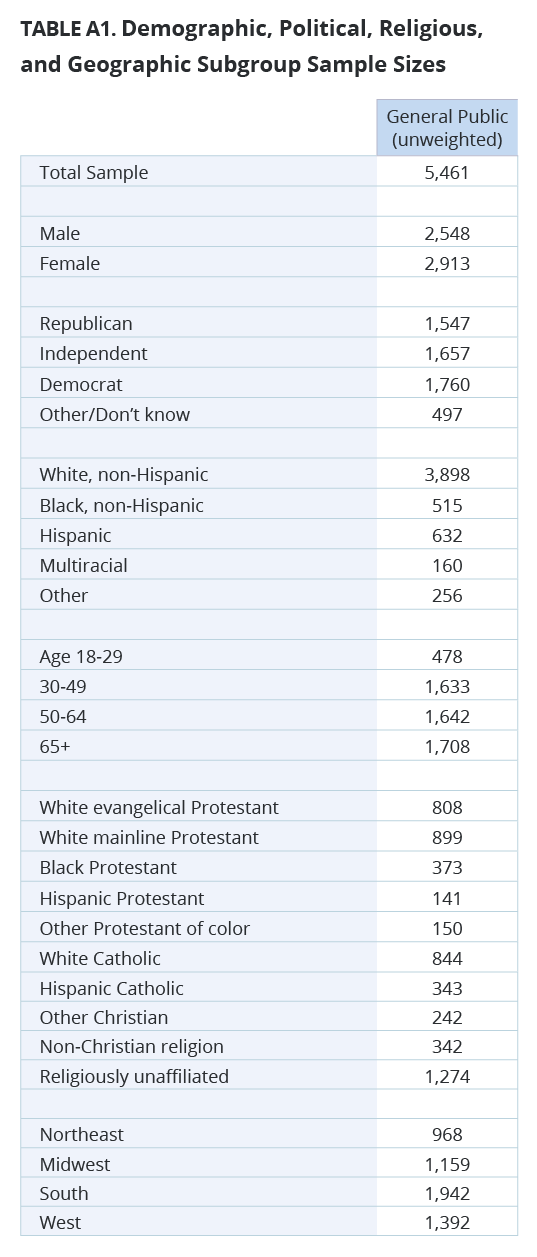 The survey was designed and conducted by PRRI. The survey was made possible through the generous support of the Fetzer Institute. Additionally, this work was made possible through the support of New Pluralists Collaborative, a sponsored project of Rockefeller Philanthropy Advisors. The survey was conducted among a representative sample of 5,042 adults (age 18 and up) living in all 50 states in the United States, who are part of Ipsos’s Knowledge Panel and an additional 419 who were recruited by Ipsos using opt-in survey panels to increase the sample sizes in smaller states. Interviews were conducted online between March 11 and 30, 2022.
Respondents are recruited to the KnowledgePanel using an addressed-based sampling methodology from the Delivery Sequence File of the USPS – a database with full coverage of all delivery addresses in the U.S. As such, it covers all households regardless of their phone status, providing a representative online sample. Unlike opt-in panels, households are not permitted to “self-select” into the panel; and are generally limited to how many surveys they can take within a given time period.
The initial sample drawn from the KnowledgePanel was adjusted using pre-stratification weights so that it approximates the adult U.S. population defined by the latest March supplement of the Current Population Survey. Next, a probability proportional to size (PPS) sampling scheme was used to select a representative sample.
To reduce the effects of any non-response bias, a post-stratification adjustment was applied based on demographic distributions from the most recent American Community Survey (ACS). The post-stratification weight rebalanced the sample based on the following benchmarks: age, race and ethnicity, gender, Census division, metro area, education, and income. The sample weighting was accomplished using an iterative proportional fitting (IFP) process that simultaneously balances the distributions of all variables. Weights were trimmed to prevent individual interviews from having too much influence on the final results. In addition to an overall national weight, separate weights were computed for each state to ensure that the demographic characteristics of the sample closely approximate the demographic characteristics of the target populations. The state-level post-stratification weights rebalanced the sample based on the following benchmarks: age, race and ethnicity, gender, education, and income.
The margin of error for the national survey is +/- 1.6 percentage points at the 95% level of confidence, including the design effect for the survey of 1.4. In addition to sampling error, surveys may also be subject to error or bias due to question wording, context, and order effects. Additional details about the KnowledgePanel can be found on the Ipsos website: https://www.ipsos.com/en-us/solution/knowledgepanel.
Endnotes
[1] The method of measuring Americans’ core social networks was modeled after a methodology first developed by the General Social Survey. Respondents were asked to name people with whom they “discussed important matters” in the previous six months, regardless of the nature of the relationship or the frequency of interaction. The first step in this approach, often referred to as “the name generator,” is to have respondents record the names of all the people in their network. Next, respondents are asked to provide relevant social and demographic information for each member of their network they previously identified. The current study design differs from the GSS social network battery in two important ways. First, the survey was self-administered online, providing a more efficient and cost-effective way to collect data. Second, the PRRI study allowed respondents to identify up to seven possible social connections, instead of the maximum of five that was allowed in the GSS.
[2] In 2022, those who listed one or more close contacts were prompted to list additional people. Sixteen percent added additional contacts. However, this had little impact on the total results: The average number of contacts listed before those additions is 4.1, compared to the final average of 4.2.
[3] This question and the following item about discussing religion were only asked of half the sample each, resulting in too few AAPI Americans in each question to report.
[4] The satisfaction scale was created by summing answers to the satisfaction items, recoded so that very dissatisfied = -2, somewhat dissatisfied = -1, somewhat satisfied = 1, and very satisfied = 2. Those who are more dissatisfied than satisfied had scale scores from -10 to -1; those who are more satisfied than dissatisfied have scale scores from 0 to 6, and those who answer all of the questions with somewhat or very satisfied responses have scale scores from 7 to 10.
Recommended Citation
“American Bubbles: Politics, Race, and Religion in Americans’ Core Friendship Networks” PRRI (May 24, 2022). https://www.prri.org/research/american-bubbles-politics-race-and-religion-in-americans-core-friendship-networks/


