LGBT Nondiscrimination Laws
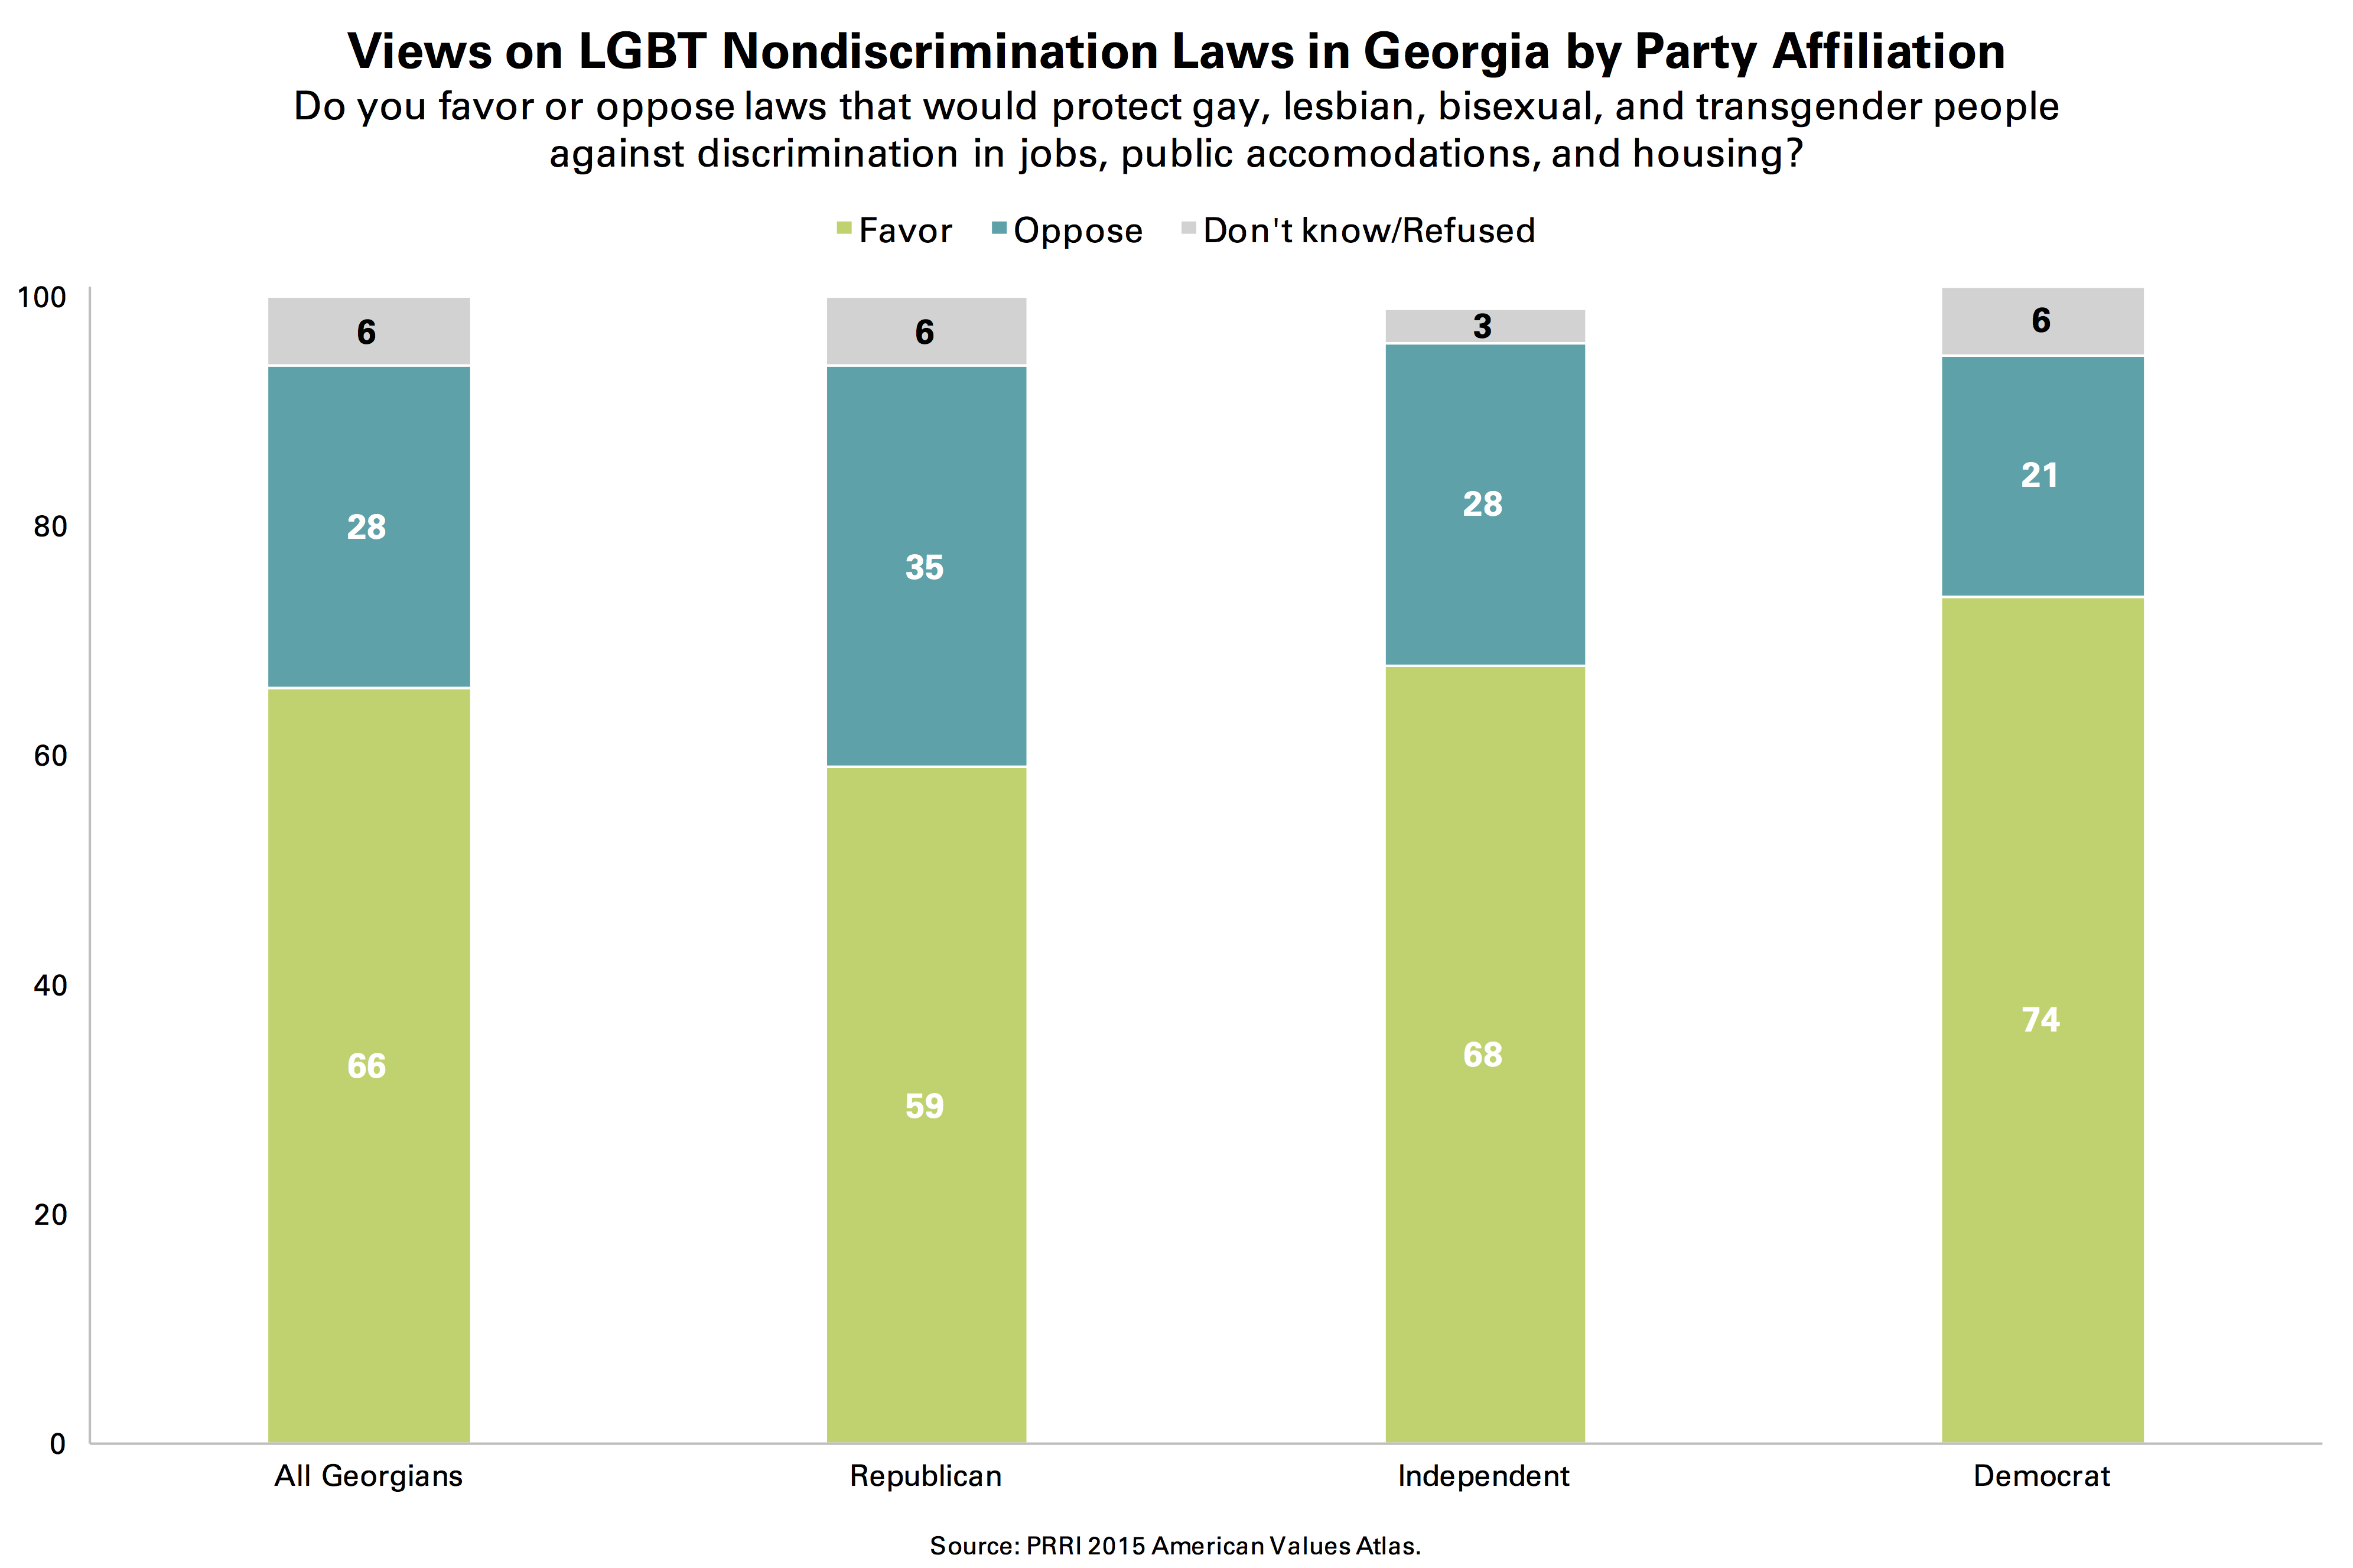
Roughly two-thirds (66%) of Georgia residents favor laws that would protect gay, lesbian, bisexual, and transgender people from discrimination in jobs, public accommodations, and housing, compared to fewer than three in ten (28%) who are opposed. Notably, majorities of all major demographic, religious, and political groups in Georgia favor nondiscrimination laws for LGBT people, though there are some differences in the intensity of support.
Not surprisingly, there are large generational divisions. Nearly eight in ten (78%) Georgians under the age of 30 support nondiscrimination laws, compared to a slim majority (51%) of Georgia seniors (age 65 and older). Nearly four in ten (37%) seniors in the state oppose nondiscrimination laws for LGBT people.
Notably, there are no significant differences in opinion by race. More than six in ten white and black Georgians favor LGBT nondiscrimination laws (63% and 67%, respectively).
Nondiscrimination laws that protect LGBT individuals enjoys bipartisan agreement in Georgia. Roughly three-quarters of Democrats (74%), about two-thirds (68%) of independents, and nearly six in ten (59%) Republicans favor nondiscrimination laws for LGBT people.
There is also solid support for LGBT nondiscrimination laws across Georgia’s major religious groups. Roughly three-quarters of religiously unaffiliated (76%) and Catholic Georgians (73%) favor nondiscrimination laws for LGBT people, as do approximately two-thirds of white mainline Protestants (67%) and black Protestants (65%). A majority (54%) of white evangelical Protestants favor this policy, although nearly four in ten (39%) of this more socially conservative group oppose it.
While there are significant attitude differences between the Atlanta metro area and the rest of the state, both metro and non-metro Georgians support LGBT nondiscrimination laws. Residents of the sprawling Atlanta metropolitan area support these laws at a rate that mirrors the national average (72% and 71%, respectively). Fewer, but still a sold majority (59%), of residents outside of the Atlanta area agree.
Religious Exemptions
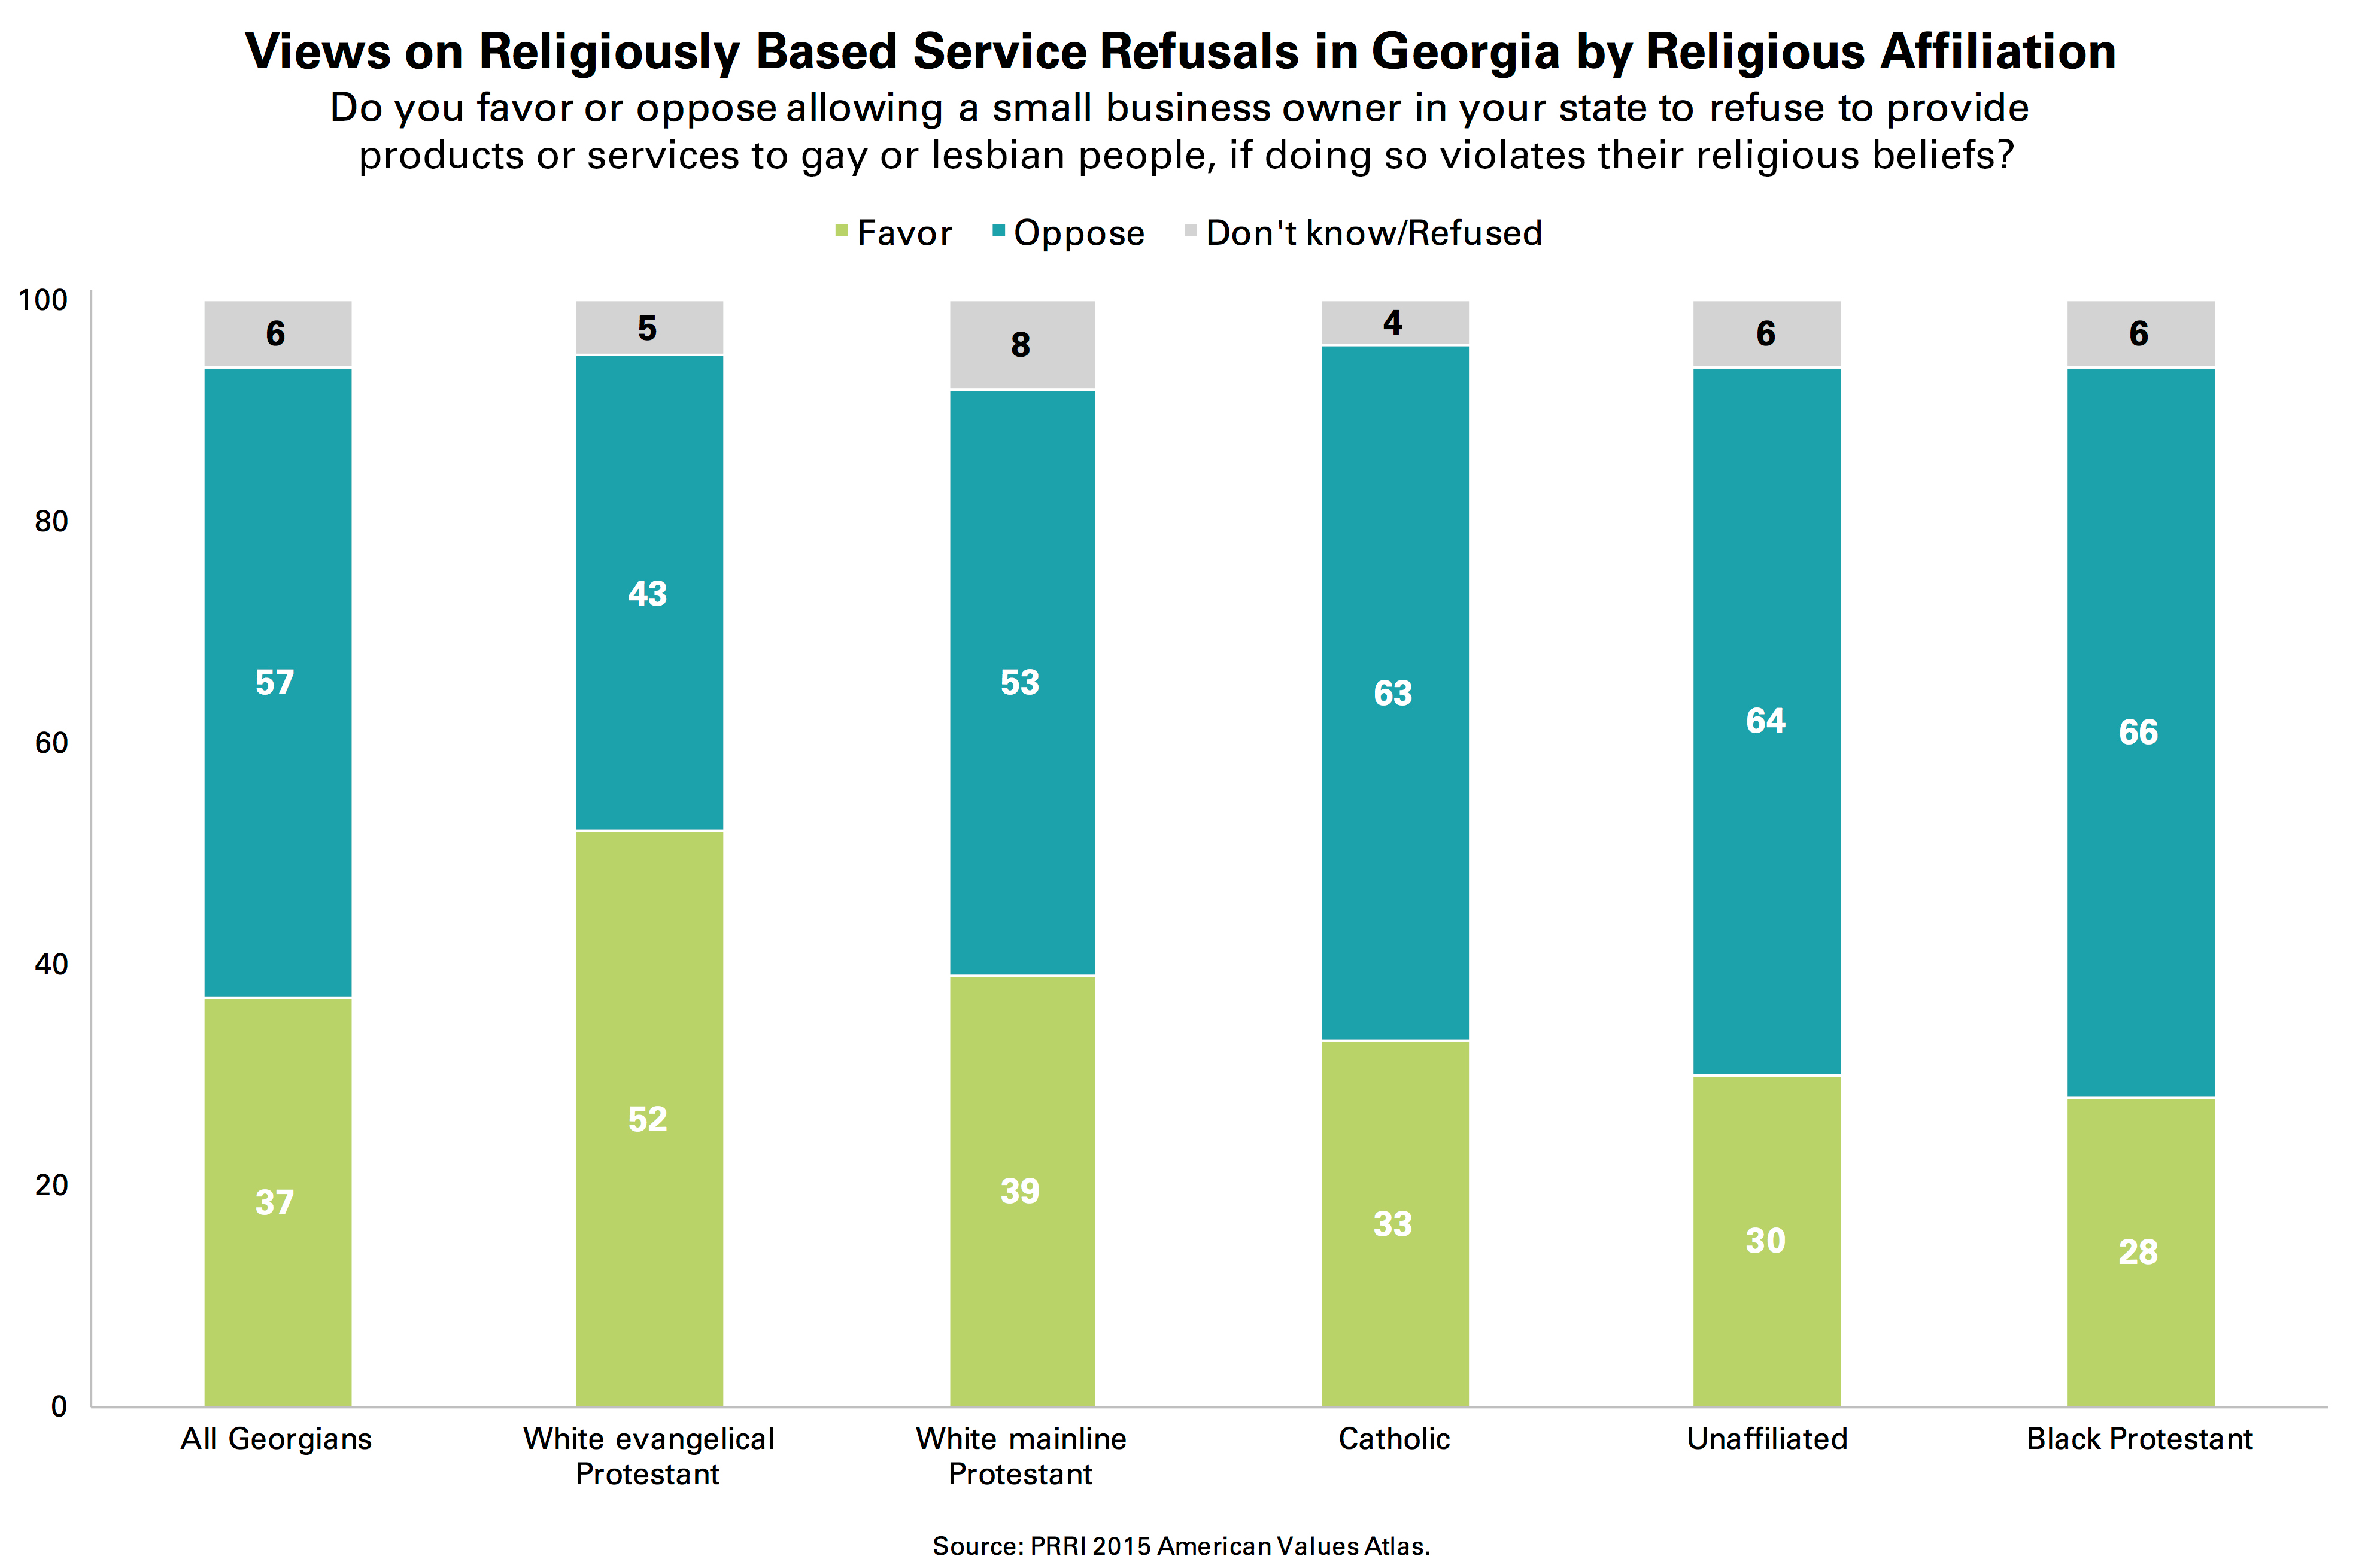
Nearly six in ten (57%) Georgia residents oppose allowing a small business owner to refuse to provide products or services to gay or lesbian people, even if doing so violates their religious beliefs, while nearly four in ten (37%) Georgians favor such a policy. Support for allowing religiously based service refusals for LGBT people among Georgia residents is nearly identical to levels among Americans overall (59% oppose, 35% favor).
Attitudes on whether small business owners should be allowed to deny service to gay or lesbian people on religious grounds differ significantly by age within the state. More than six in ten (64%) young Georgians (age 18 to 29) oppose allowing small business owners to refuse products or services to gay or lesbian individuals if doing so violates their religious beliefs. Georgia seniors (age 65 and older) are much more divided: half (50%) oppose allowing religiously based service refusals of gay or lesbian people, while 40% favor allowing these refusals.
There are substantial racial divides in views on religiously based refusals to serve gay and lesbian people, with black Georgians expressing higher opposition than their white counterparts. Two-thirds (66%) of black Georgians, compared to 53% of white Georgians, oppose allowing a small business owner to deny service to a gay or lesbian customer, even if doing so violates their religious beliefs. Approximately four in ten (41%) white Georgians favor allowing small business owners to refuse goods or services to LGBT people if doing so violates their religious beliefs.
Georgia’s religious communities differ in their views on the issue. Approximately two-thirds of black Protestants (66%), the religiously unaffiliated (64%), and Catholics (63%) oppose allowing religiously based service refusals of gay or lesbian individuals, as do a majority of white mainline Protestants (53%). In contrast, only 43% of white evangelical Protestants in Georgia oppose allowing small business owners to refuse to provide products or services to gay or lesbian people if doing so violates their religious beliefs; a majority (52%) favor such a policy.
Partisan divides on religiously based service refusals of LGBT people are vast in Georgia. More than seven in ten (72%) Democrats oppose allowing small business owners to refuse service to gay or lesbian individuals on religious grounds, a view shared by fewer than four in ten (38%) Republicans. Nearly six in ten (58%) Republicans favor allowing these religiously based service refusals. The views of independents are identical to the views of Georgians overall.
Notably, there is virtually no geographic divide within Georgia on the issue of service refusals on religious grounds. A majority (58%) of residents of the Atlanta metropolitan area oppose allowing small business owners to refuse to provide products or services to gay or lesbian customers based on their religious beliefs, as do a majority (55%) of Georgians living outside the Atlanta metro area.
Same-sex Marriage
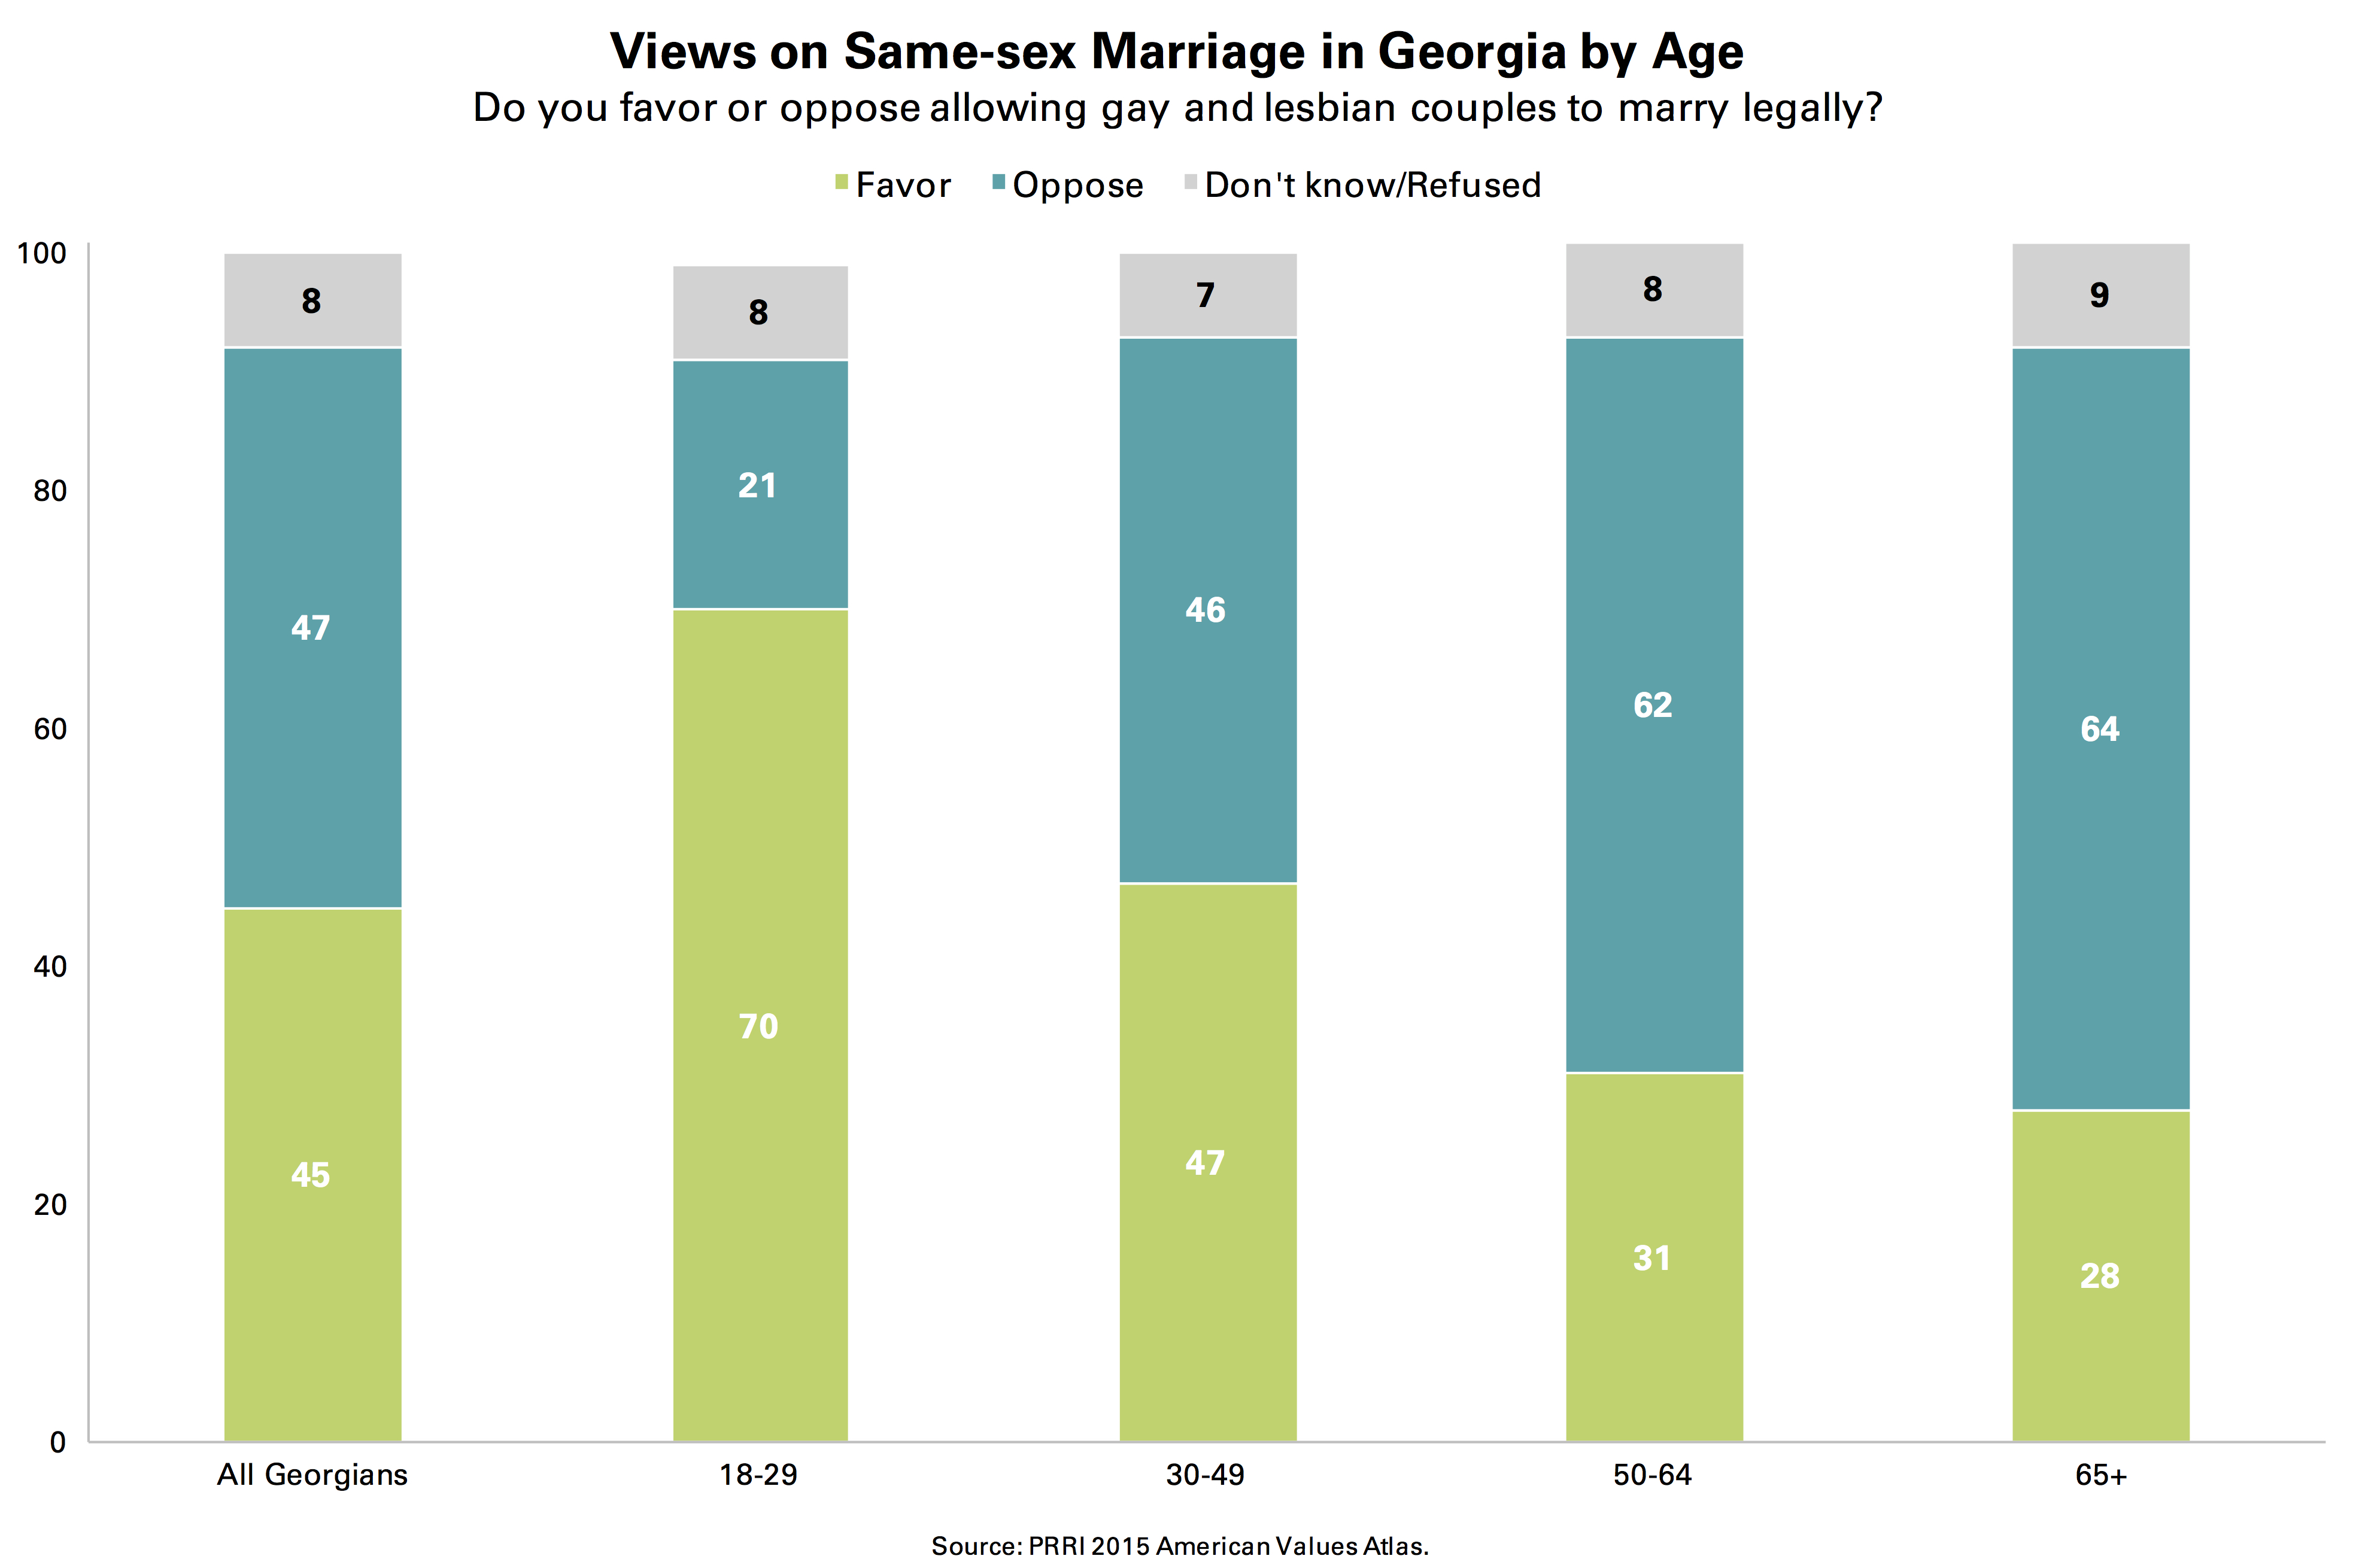
Georgia residents are almost evenly divided on the issue of same-sex marriage: 45% favor, 47% oppose. Support in Georgia is significantly lower than in the United States overall: 53% favor, 37% oppose.
There is a yawning 42 percentage-point generational chasm on same-sex marriage in Georgia. Seven in ten (70%) young adults (age 18 to 29) in Georgia favor same-sex marriage, while fewer than three in ten (28%) Georgia seniors (age 65 and older) say the same. Nearly two-thirds (64%) of Georgia seniors oppose same-sex marriage.
Consistent with national patterns, white Georgians express higher support for same-sex marriage than black Georgians. White Georgians are almost evenly split on the issue: 45% favor same-sex marriage, while 48% are opposed. In comparison, only 39% of black Georgians favor same-sex marriage, compared to a majority (53%) who are opposed.
Georgia’s largest religious groups hold significantly different opinions on same-sex marriage, with the religiously unaffiliated voicing the strongest support. Approximately three-quarters (74%) of religiously unaffiliated Georgians favor same-sex marriage, as do majorities of white mainline Protestants (54%) and Catholics (51%). In contrast, a majority (56%) of black Protestants and seven in ten (70%) white evangelical Protestants in the state are opposed to same-sex marriage.
Democrats in Georgia are significantly more likely than Republicans to favor same-sex marriage, but support among Georgia Democrats lags behind their national counterparts. A slim majority (51%) of Georgia Democrats favor same-sex marriage, compared to 66% of Democrats nationwide. Among Georgia Republicans, just 28% support same-sex marriage; nearly two-thirds (64%) of Republicans in Georgia oppose same-sex marriage. Notably, independents (53%) in Georgia are about as likely as Democrats to support same-sex marriage.
Metropolitan Georgians are more supportive of same-sex marriage than their rural counterparts. A majority (53%) of residents of the Atlanta metropolitan area favor same-sex marriage, compared to fewer than four in ten (36%) Georgians living outside the Atlanta metropolitan area. Nearly six in ten (57%) Georgians who live outside the Atlanta metropolitan area oppose same-sex marriage.
The Complex Relationship Between Support for LGBT Nondiscrimination Laws and Same-sex Marriage
As the above analysis makes clear, there is no one-to-one correlation between attitudes on same-sex marriage and attitudes on LGBT nondiscrimination laws. For example, Georgia religious groups are divided on same-sex marriage but broadly supportive of LGBT nondiscrimination laws.
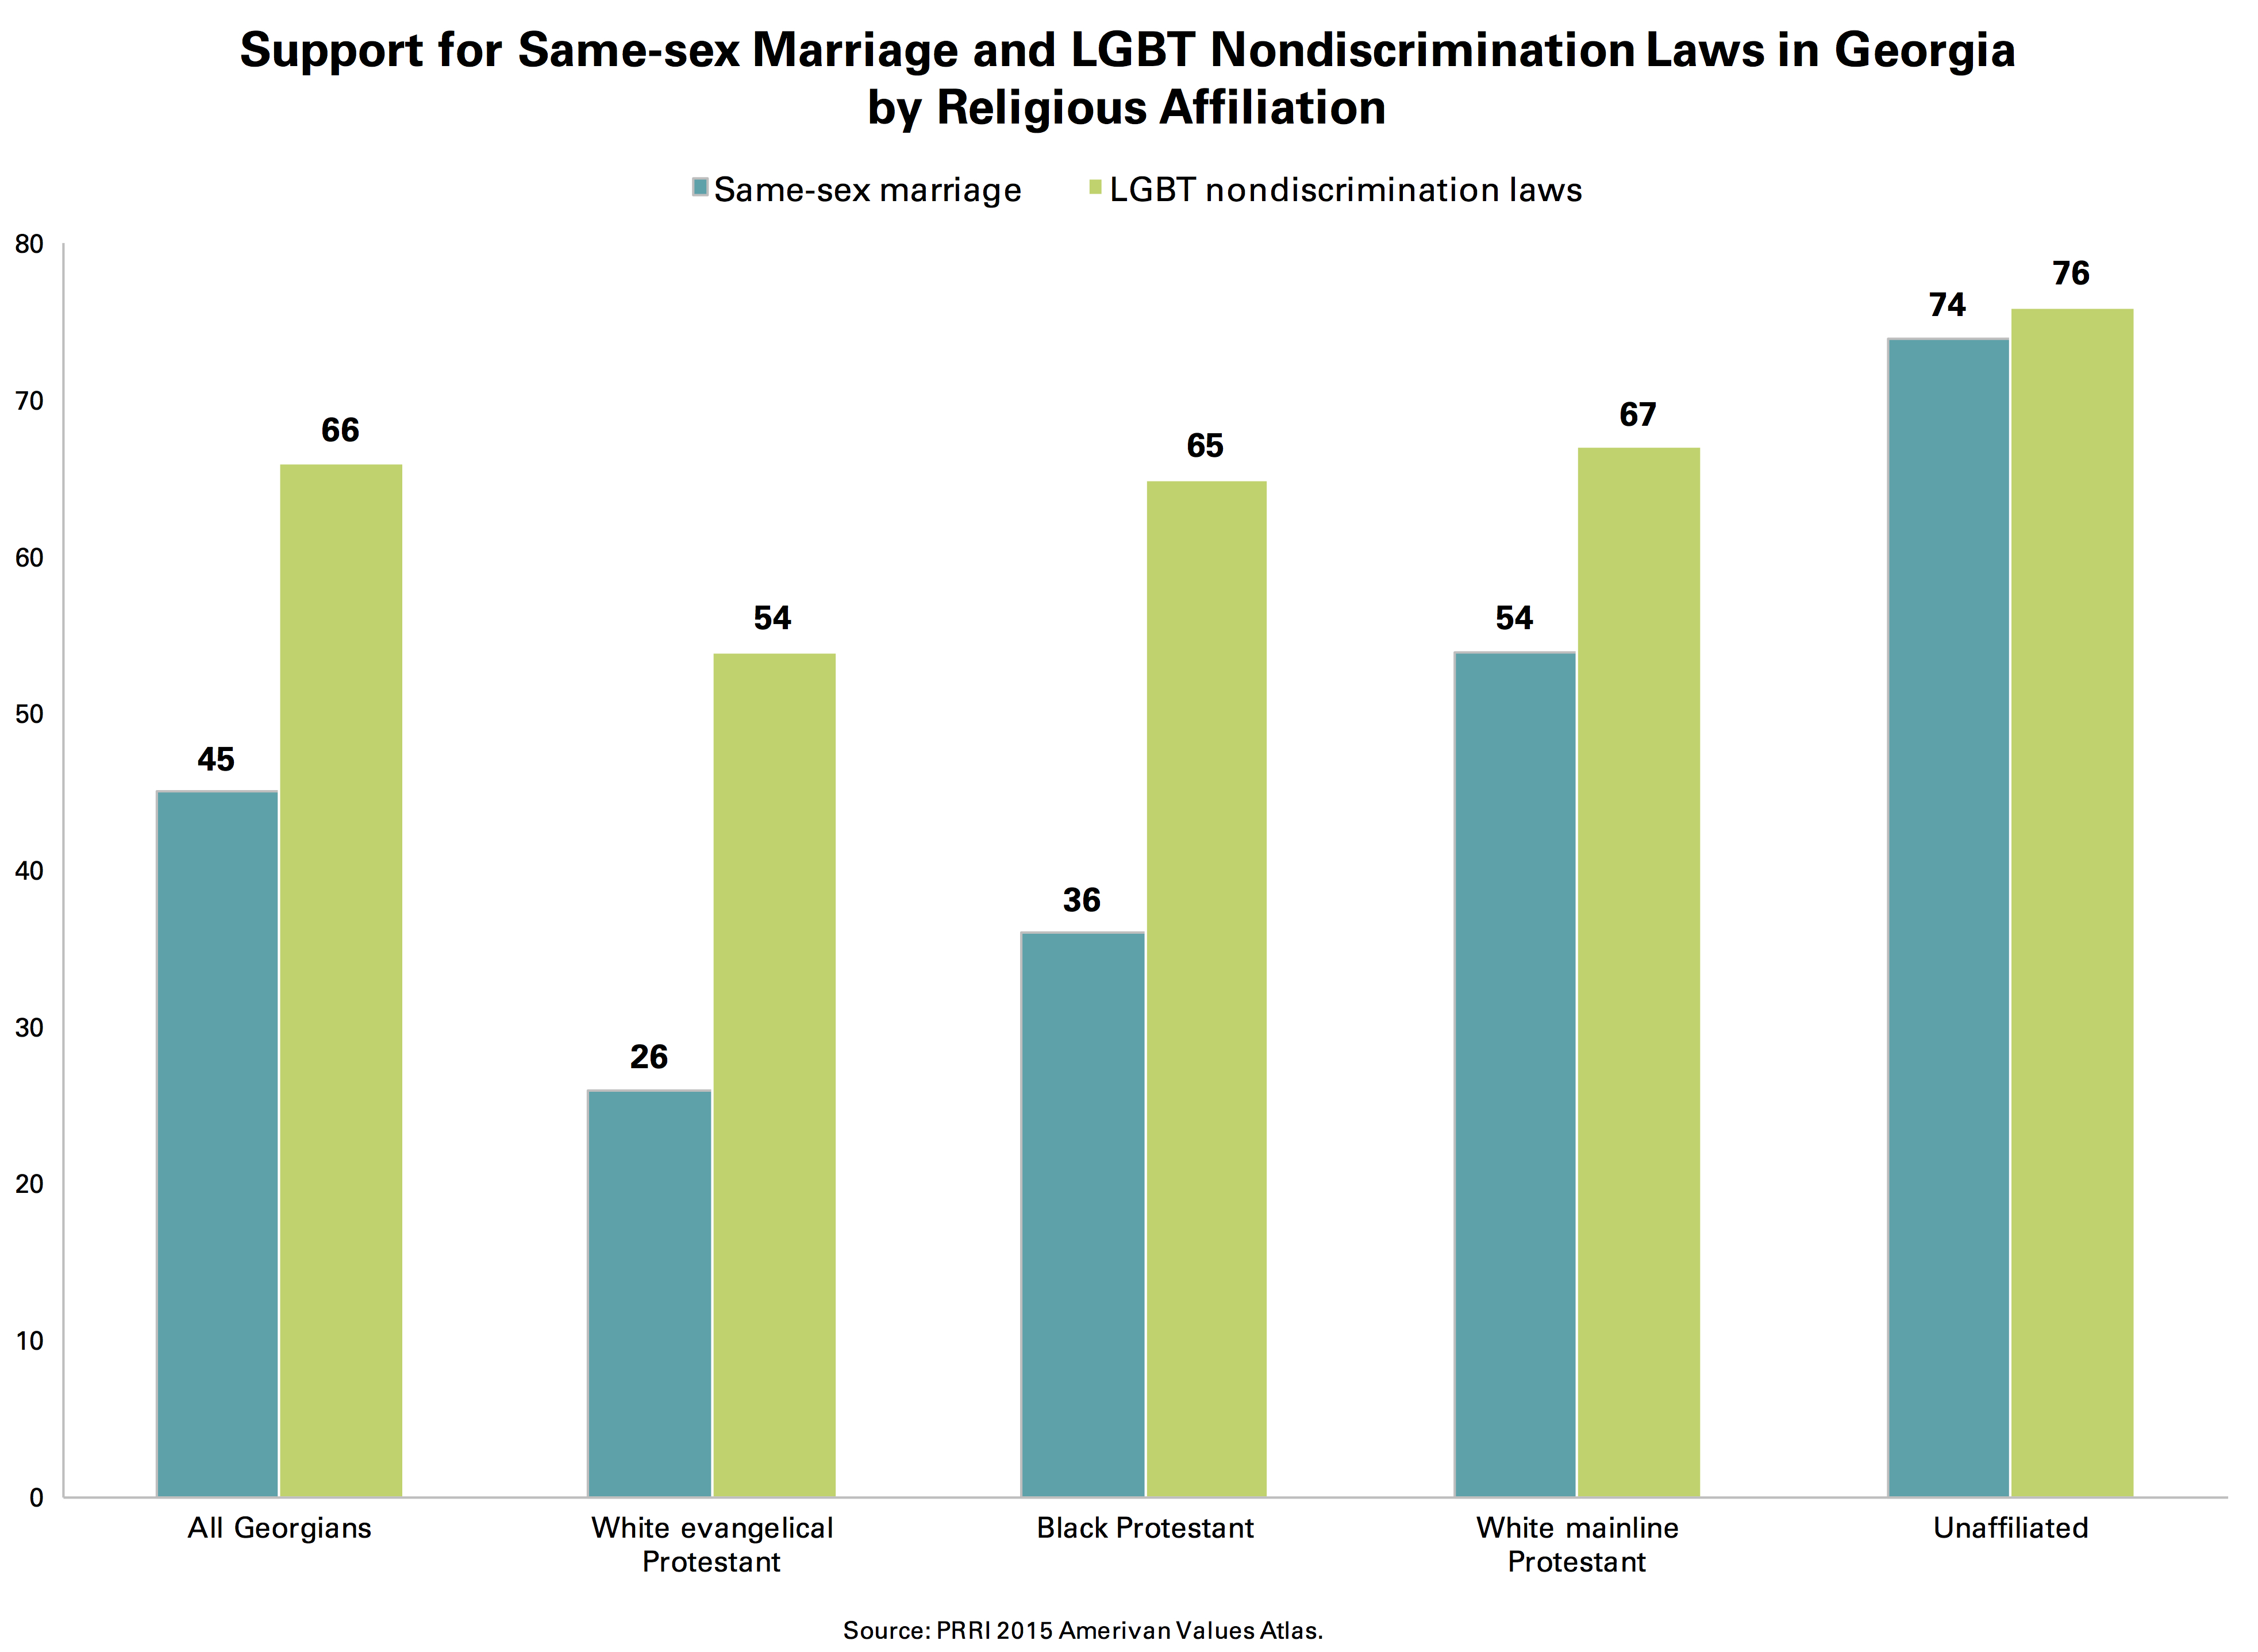
Not surprisingly, nearly nine in ten (88%) Georgians who support same-sex marriage also support nondiscrimination laws that would protect LGBT people. However, same-sex marriage opponents are not uniformly opposed to nondiscrimination laws. Georgians who oppose same-sex marriage are divided over nondiscrimination laws for LGBT people, with roughly half (48%) in favor, while 46% are opposed.
The complex interaction between attitudes on same-sex marriage and LGBT nondiscrimination laws is especially vivid among black Americans in the state. Even among the majority of black Americans in Georgia who oppose same-sex marriage, 53% nonetheless support LGBT nondiscrimination laws.
For a complete look at where Americans’ stand on these issues, read “Beyond Same-sex Marriage: Attitudes on LGBT Nondiscrimination Laws and Religious Exemptions from the 2015 American Values Atlas.”
To explore where residents in your state stand, explore the interactive American Values Atlas.