

Executive Summary
 Most Americans have a decidedly negative self-evaluation of their financial situation. Roughly 4-in-10 Americans say they are currently in excellent (7%) or good (34%) shape financially, while a majority of the public report being in only fair (37%) or poor financial shape (20%). This assessment represents a notable drop from 2010, when half of Americans indicated they were in excellent (9%) or good (41%) shape financially.
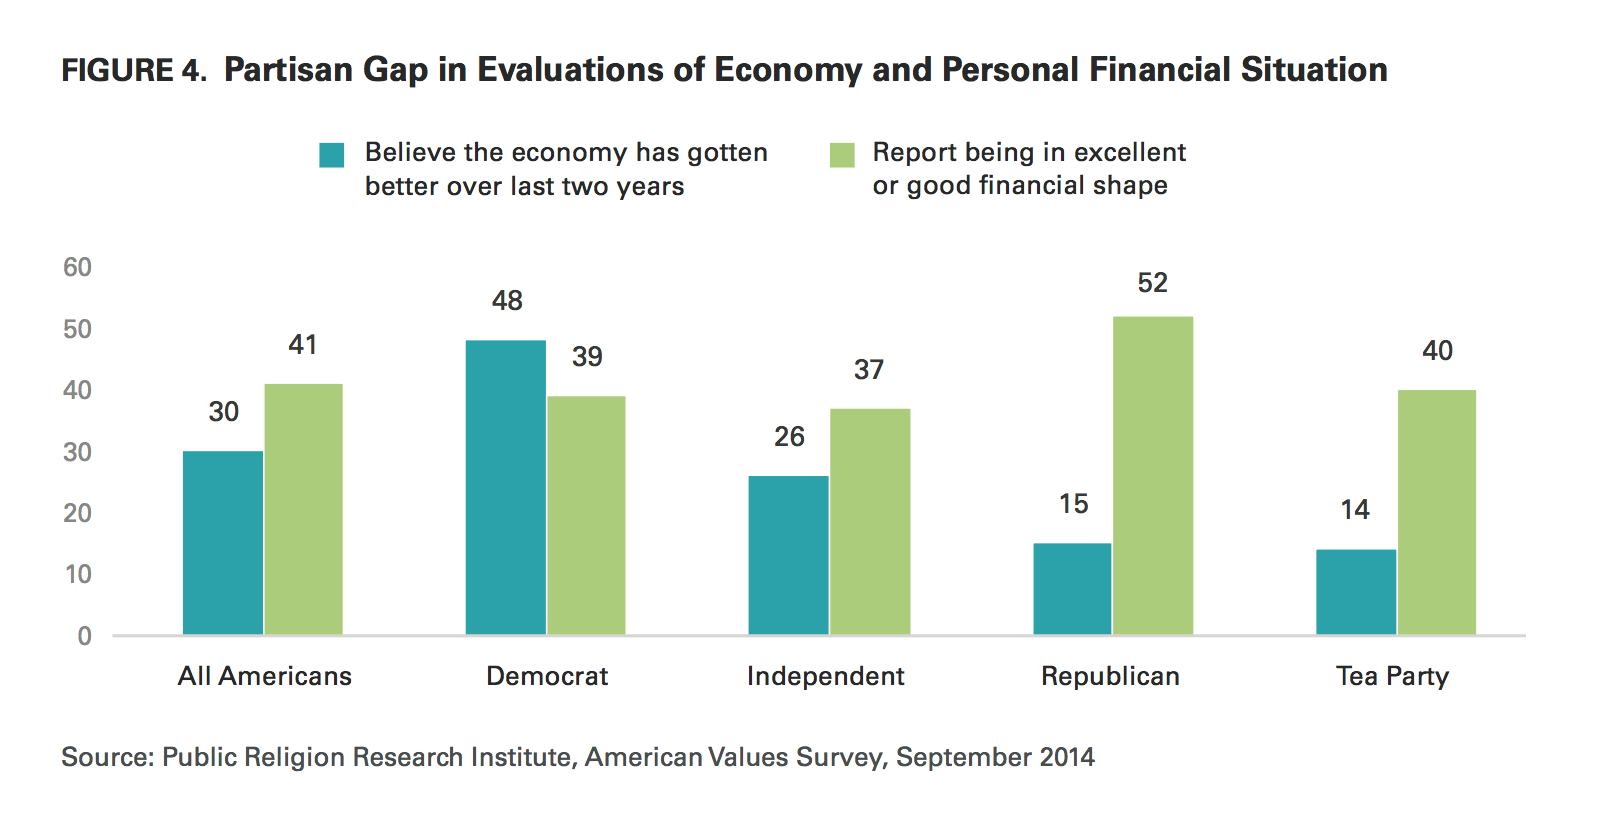
Today, only 30% of Americans believe the economy has gotten better over the last two years, while 35% say it has gotten worse, and 33% say it has stayed about the same.
- Nearly half of Democrats (48%) say the economy has gotten better over the last two years, while about 1-in-5 (17%) say it has gotten worse. One-third of Democrats (33%) say the economy has stayed about the same.
- Despite the fact that Republicans are more likely than Democrats to report being in good or excellent financial shape, only 15% of Republicans (and 14% of Tea Party members) say the economy has gotten better over the last two years. Majorities of Republicans (54%) and Americans who identify with the Tea Party movement (62%) say the economy has gotten worse over the last couple years.
Only about 1-in-5 (21%) Americans believe the economic recession is over, while 72% believe the economy is still in a recession today.
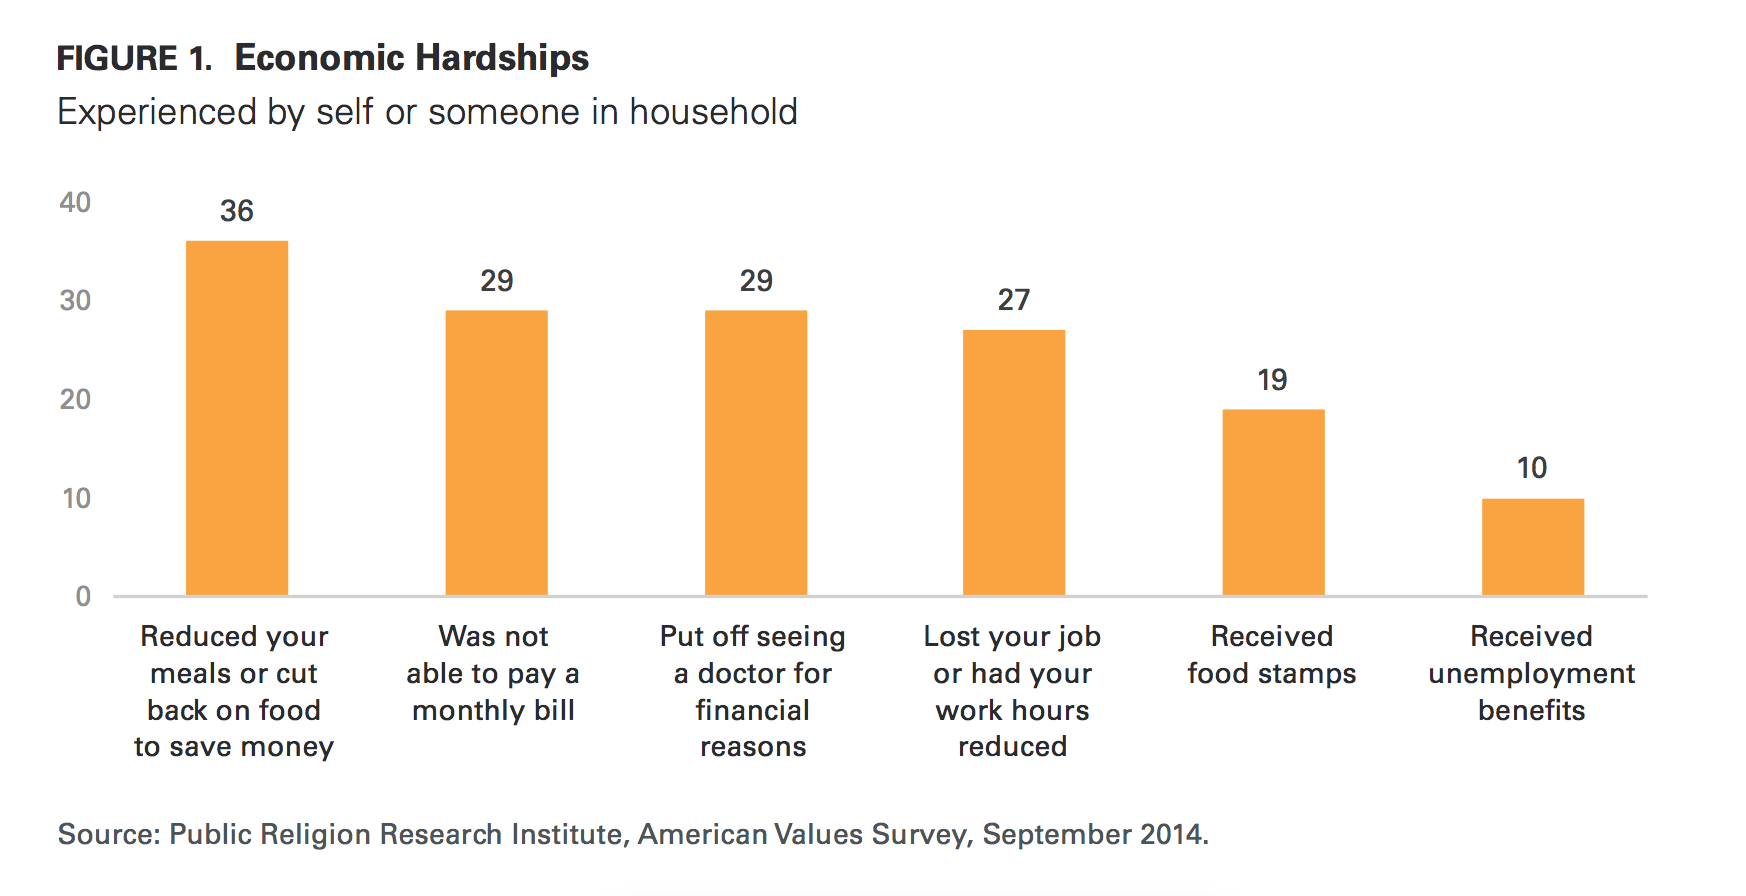
Many Americans continue to experience significant economic hardships in their daily lives. The most commonly reported economic hardship is food insecurity; more than one-third (36%) of Americans report that they or someone in their household had to reduce meals or cut back on food to save money over the course of the past year.
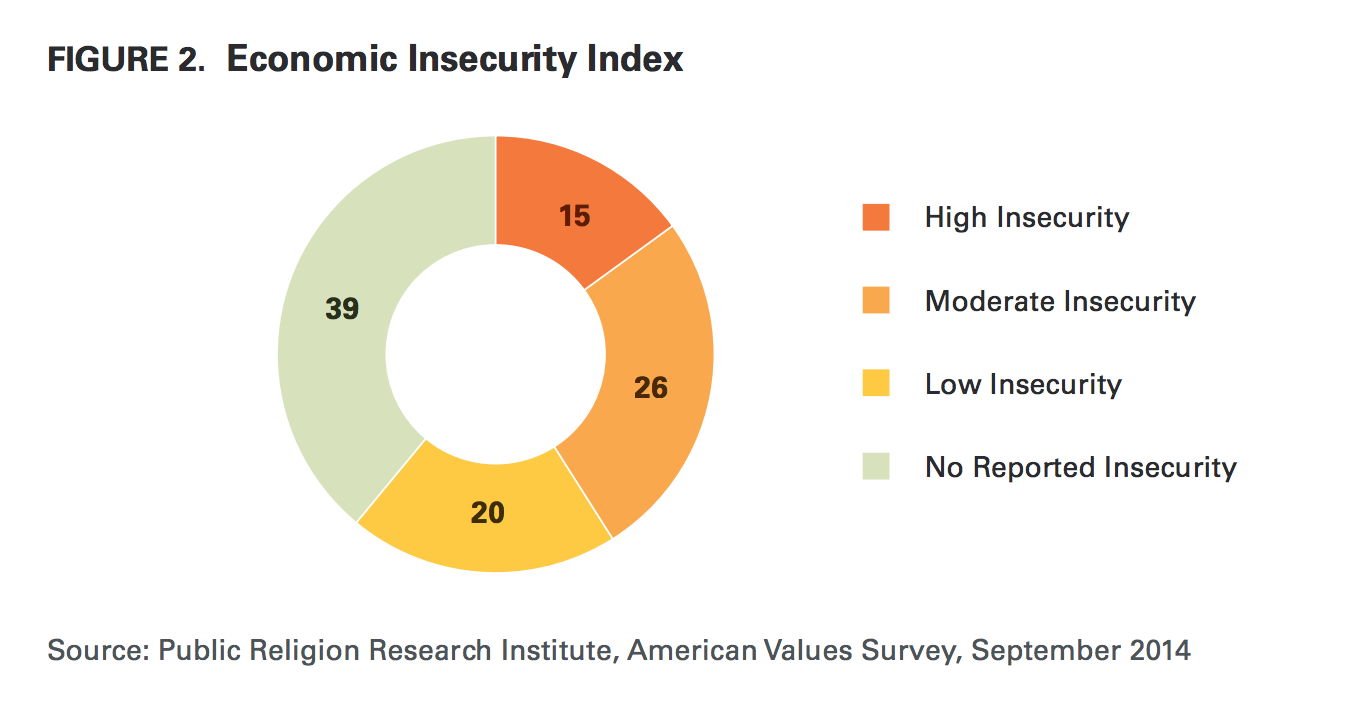
An Economic Insecurity Index (EII) was developed from six specific measures of economic hardship. The EII finds that approximately 4-in-10 Americans live in high (15%) or moderate (26%) economic insecurity households, while 6-in-10 Americans live in households with low (20%) or no (39%) reported economic insecurity.

- Nearly 6-in-10 black Americans live in households with moderate (33%) or high (25%) levels of economic insecurity.
- Nearly half of Hispanics live in households with moderate (29%) or high (18%) levels of economic insecurity.
- By contrast, fewer than 4-in-10 white Americans reside in households with moderate (24%) or high levels (12%) of economic insecurity.
Overall, Americans express significant concerns about the economic future for themselves and their children.
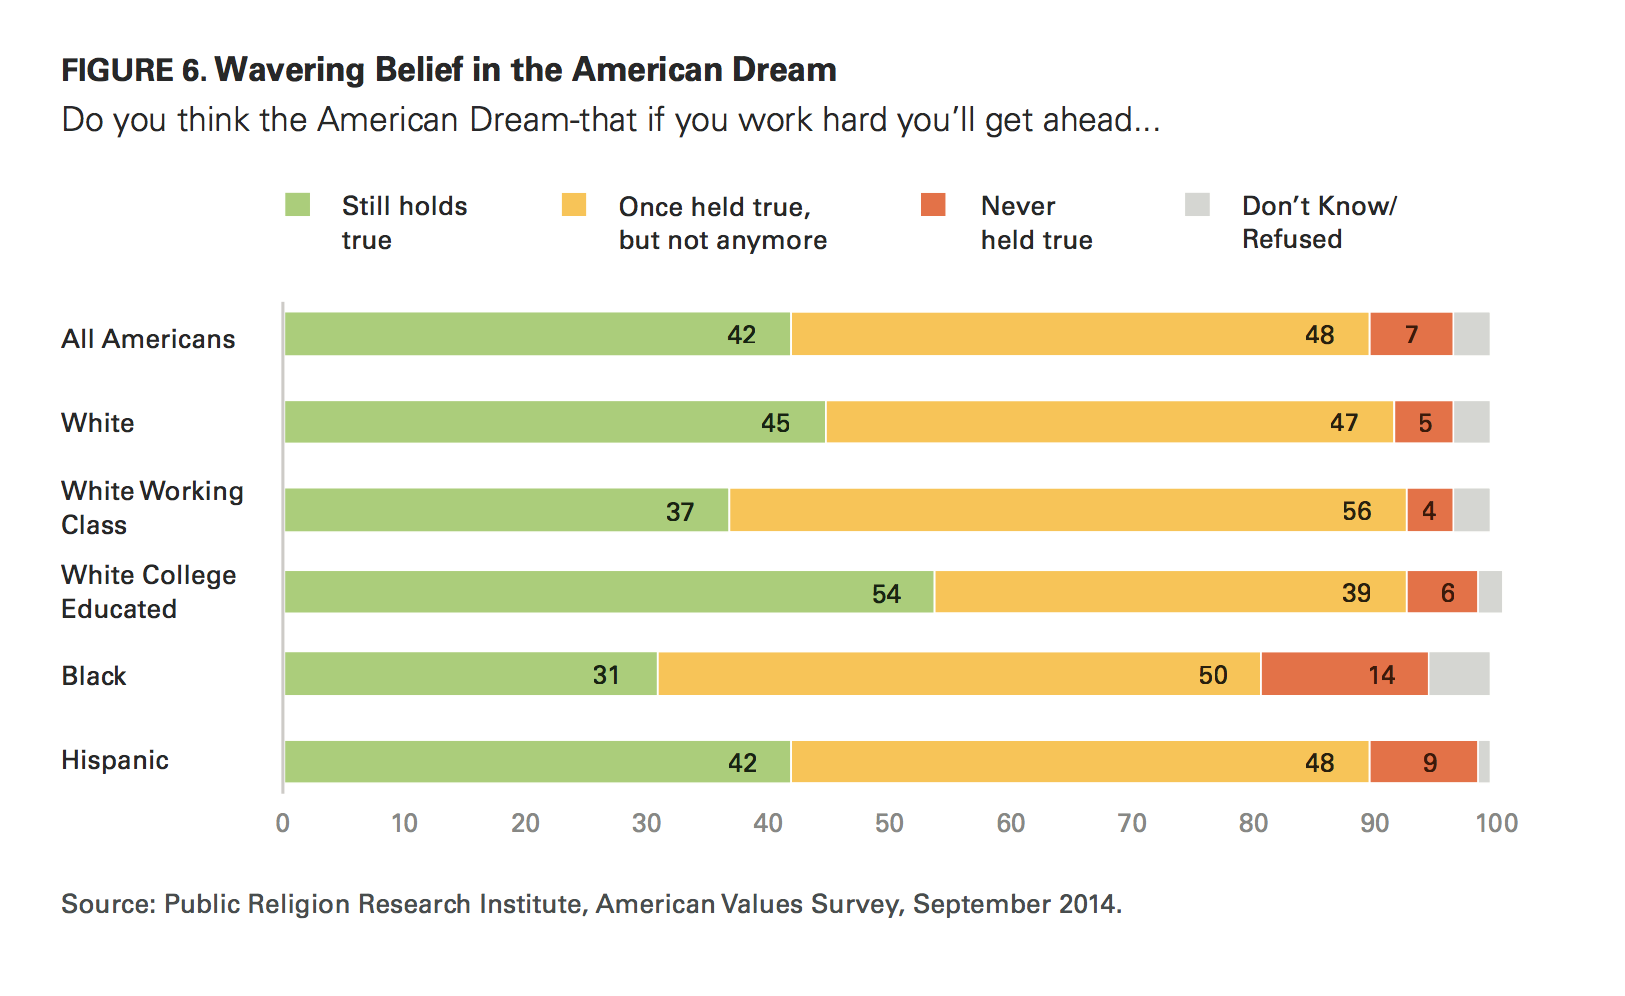
- Only roughly 4-in-10 (42%) Americans say that the American Dream—that if you work hard, you’ll get ahead—still holds true today. Nearly half of Americans (48%) believe that the American Dream once held true but does not anymore, and 7% say the American Dream never held true.
- White Americans (45%) and Hispanics (42%) are more likely than black Americans (31%) to believe that the American Dream still holds true today, although pluralities of each group say it was true in the past, but not anymore. Notably, black Americans are more likely than any other racial or ethnic group to say that the American Dream never held true (14%).
- Nearly half (49%) of Americans believe that their own generation is better off financially than their children’s generation will be, and about 1-in-5 (18%) say the two generations will be equally well off financially. Only 3-in-10 (29%) say their own generation is worse off financially than their children’s generation will be.
At the time of the survey in mid-August, registered voters were roughly split in their vote preferences for the 2014 congressional midterm elections.
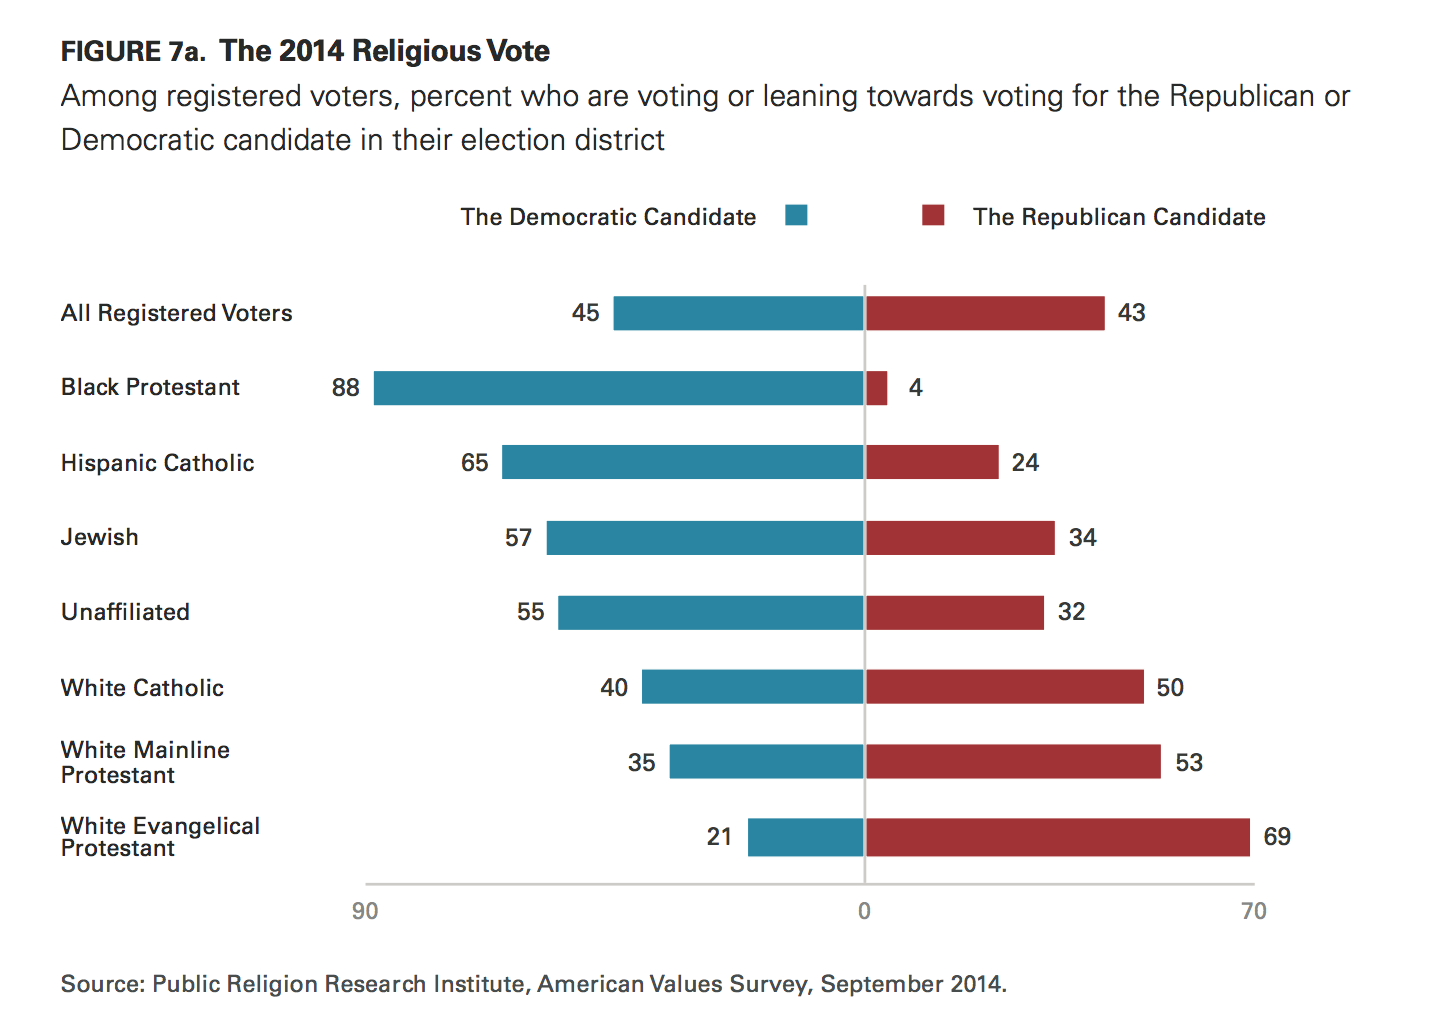
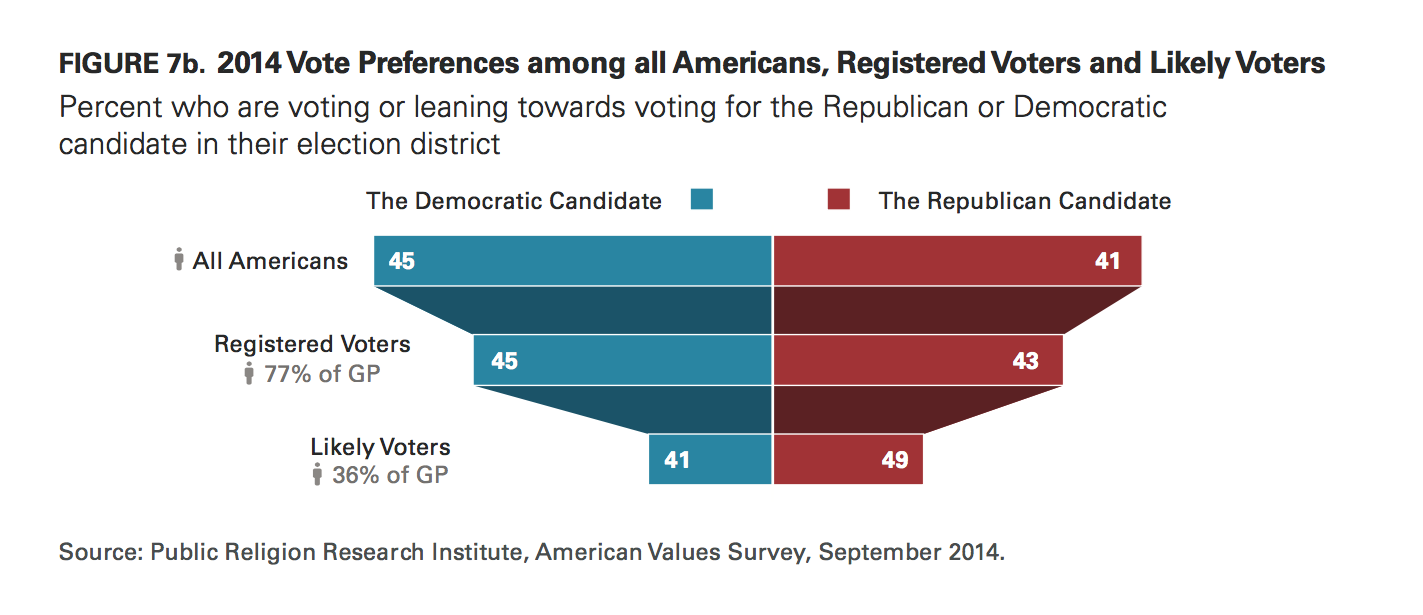
- Forty-five percent of registered voters say that if the election were held today, they would vote for or lean toward the Democratic candidate in their electoral district, while roughly as many (43%) say they would vote for, or are leaning toward, the Republican candidate.
- Among likely voters, however, Republican candidates hold a substantial advantage over Democratic candidates (49% vs. 41%).
- The voting preferences of religious communities largely mirror the 2012 presidential election patterns. Nearly 7-in-10 (69%) white evangelical Protestant registered voters and a majority (53%) of white mainline Protestant registered voters favor the Republican candidate in their district. Half (50%) of white Catholic registered voters also say they prefer the Republican candidate, while 40% say they would support the Democratic candidate.
- By contrast, nearly two-thirds (65%) of Hispanic Catholic registered voters prefer the Democratic candidate in their district. Nearly 9-in-10 (88%) black Protestant registered voters say they would support the Democratic candidate in their district. Majorities of Jewish (57%) and religiously unaffiliated (55%) registered voters also say they would support a Democratic candidate.
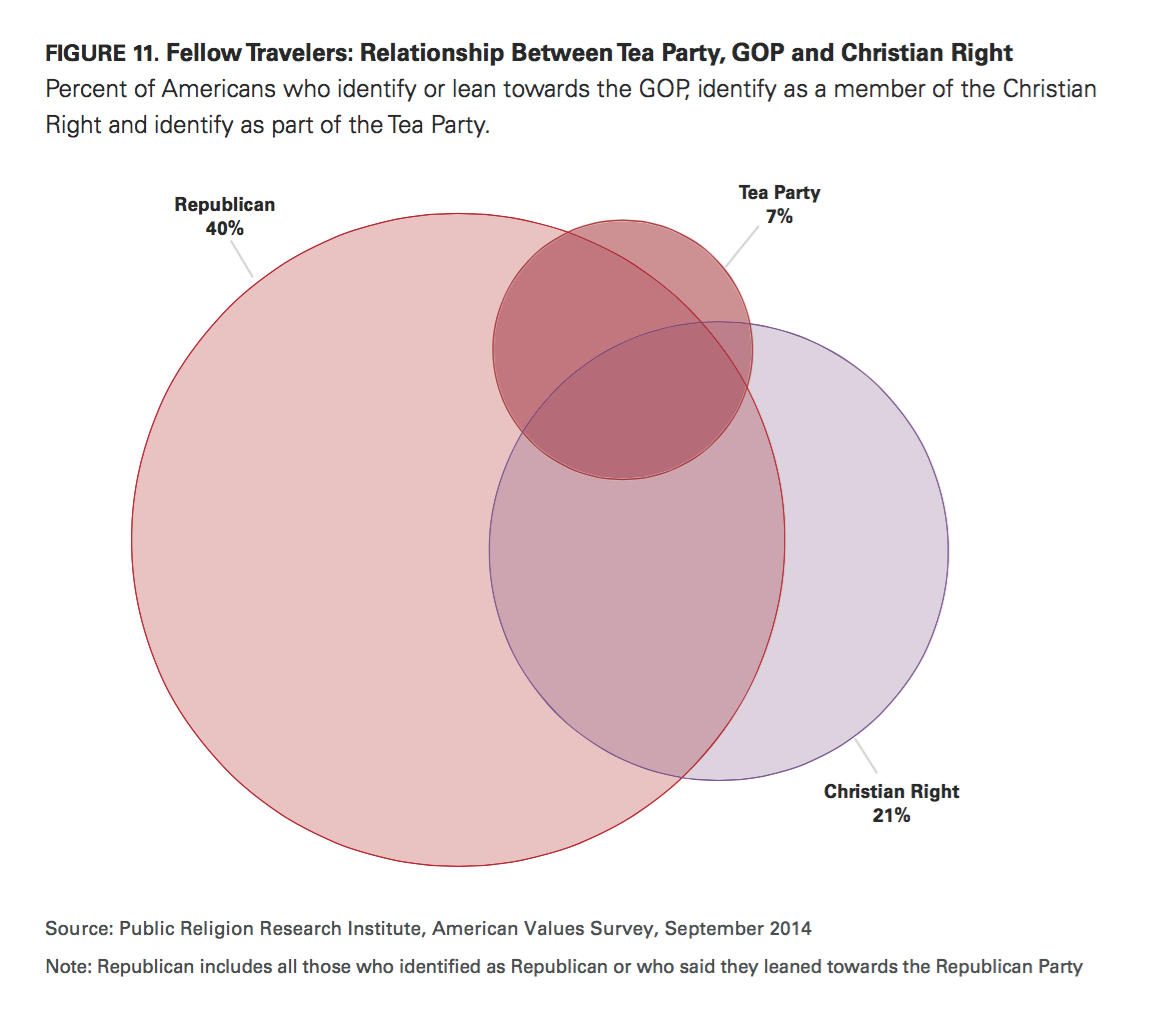
Although the Tea Party remains a potent force in American politics, there are signs that the movement may be shedding members. Currently, 7% of Americans identify as part of the Tea Party movement, down from 11% in 2010. The demographic attributes of those who identify with the movement remain largely unchanged since 2010.
- Currently, 35% of Americans say they have a favorable view of the Tea Party, while close to half (46%) have an unfavorable view. Roughly 1-in-5 Americans report having never heard of the Tea Party (5%) or have no opinion of the group (14%).
- Despite initial suggestions that the Tea Party represented a new, independent political movement, the survey finds that the Tea Party draws heavily from existing social movements, particularly the Christian Right and the Republican Party. Nearly half (47%) of Americans who identify with the Tea Party also say they are part of the Religious Right or the Christian conservative movement. Nearly 8-in-10 (77%) identify as Republican or lean toward the Republican Party. These findings have remained consistent since 2010.
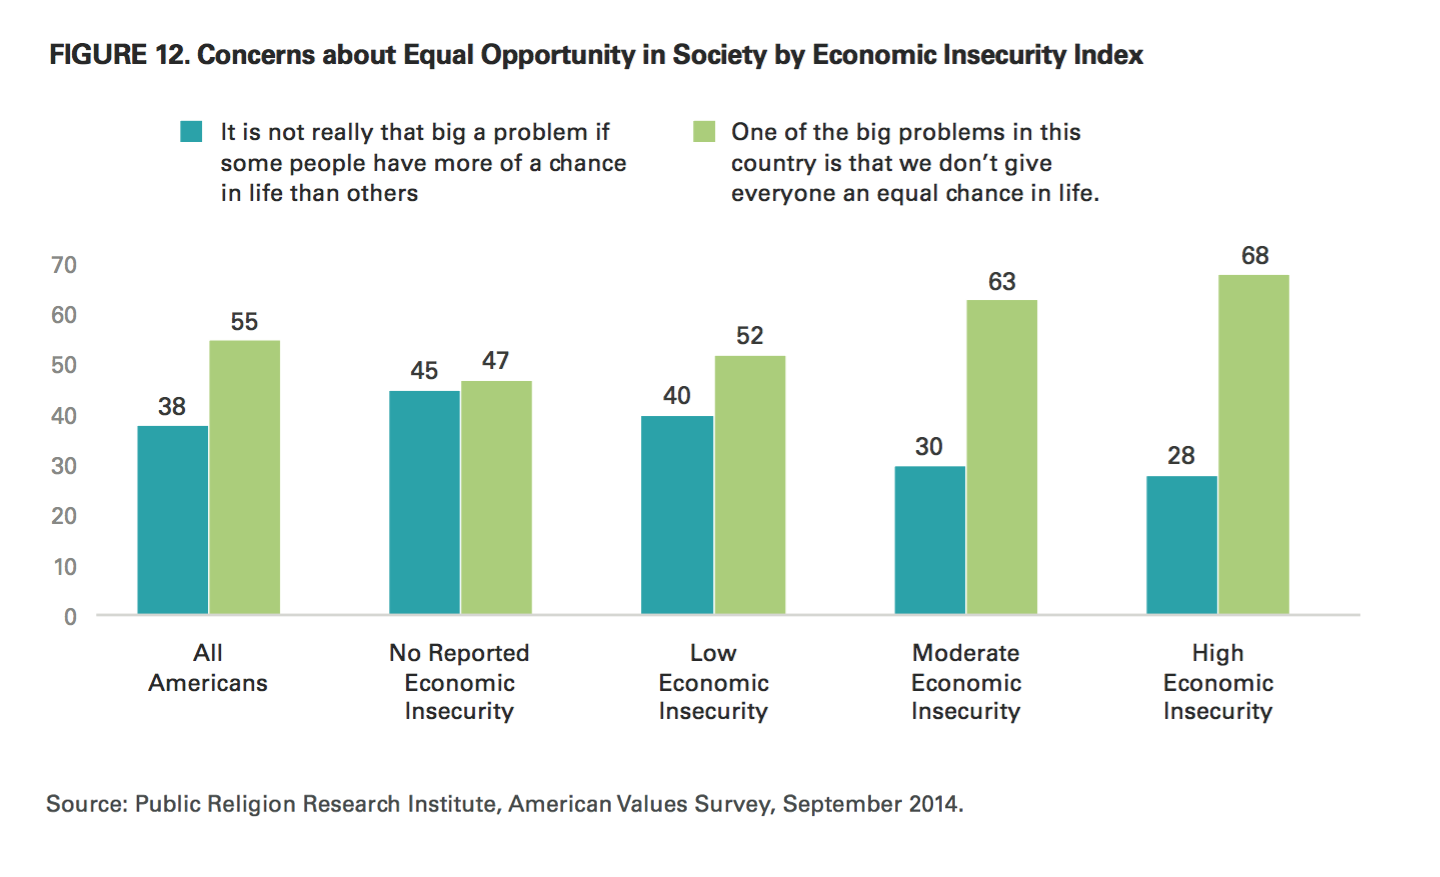
Most Americans (55%) believe that one of the biggest problems in the country is that not everyone is given an equal chance to succeed in life. Roughly 4-in-10 (38%) disagree with this statement, saying that it is not really that big a problem if some people have more of a chance in life than others.
- While more than three-quarters (76%) of black Americans, and roughly 6-in-10 Hispanics (62%) and Asian Americans (58%), say that one of the big problems facing the country is that not everyone is given an equal chance in life, only half (50%) of white Americans agree. More than 4-in-10 (42%) white Americans believe that it is not really that big of a problem if some people have more of a chance in life than others.
Americans are largely in agreement on a range of economic policies:
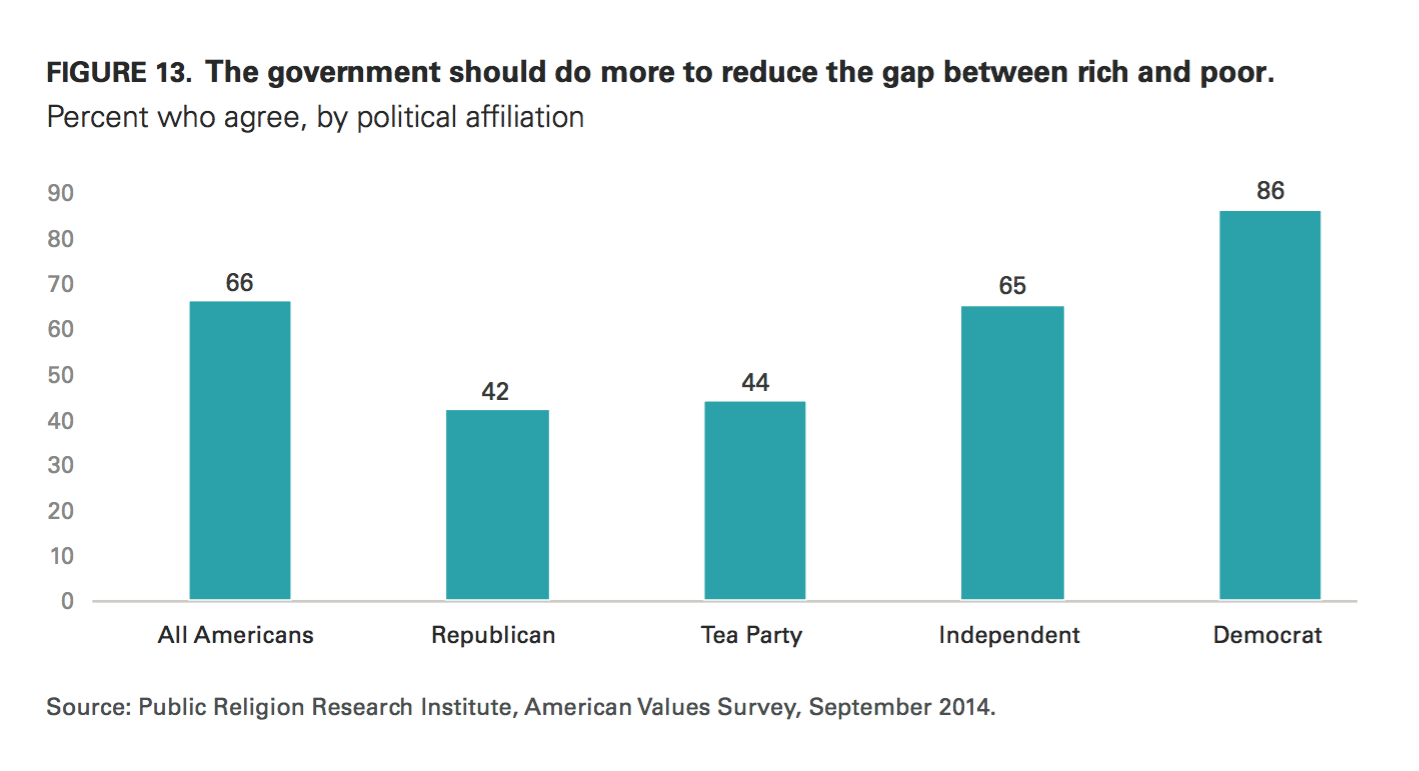
- Approximately two-thirds (66%) of Americans agree that the government should do more to reduce the gap between the rich and poor, while roughly one-third (32%) disagree.
- Roughly 6-in-10 (57%) Americans favor increasing the tax rate on Americans earning more than $250,000 per year, while 37% are opposed.
- About 7-in-10 (69%) Americans favor increasing the minimum wage from $7.25 per hour to $10.10 per hour.
- Approximately 8-in-10 (78%) Americans favor requiring companies to provide all full-time employees with paid leave for the birth or adoption of a child.
- Approximately 8-in-10 (81%) Americans favor requiring companies to provide all full-time employees with paid sick days if they or an immediate family member gets sick.
However, most Americans say they do not believe that major institutions—such as the overall economic system, business corporations, and government—are working for their benefit.
- Nearly two-thirds (64%) of Americans believe the economic system in the country unfairly favors the wealthy, compared to 34% who disagree.
- Most Americans (53%) do not believe that business corporations generally strike a fair balance between making profits and serving the public interest, while 41% believe that they do.
- Only one-third (33%) of Americans agree that the government is run for the benefit of all the people, while nearly two-thirds (64%) of Americans disagree.
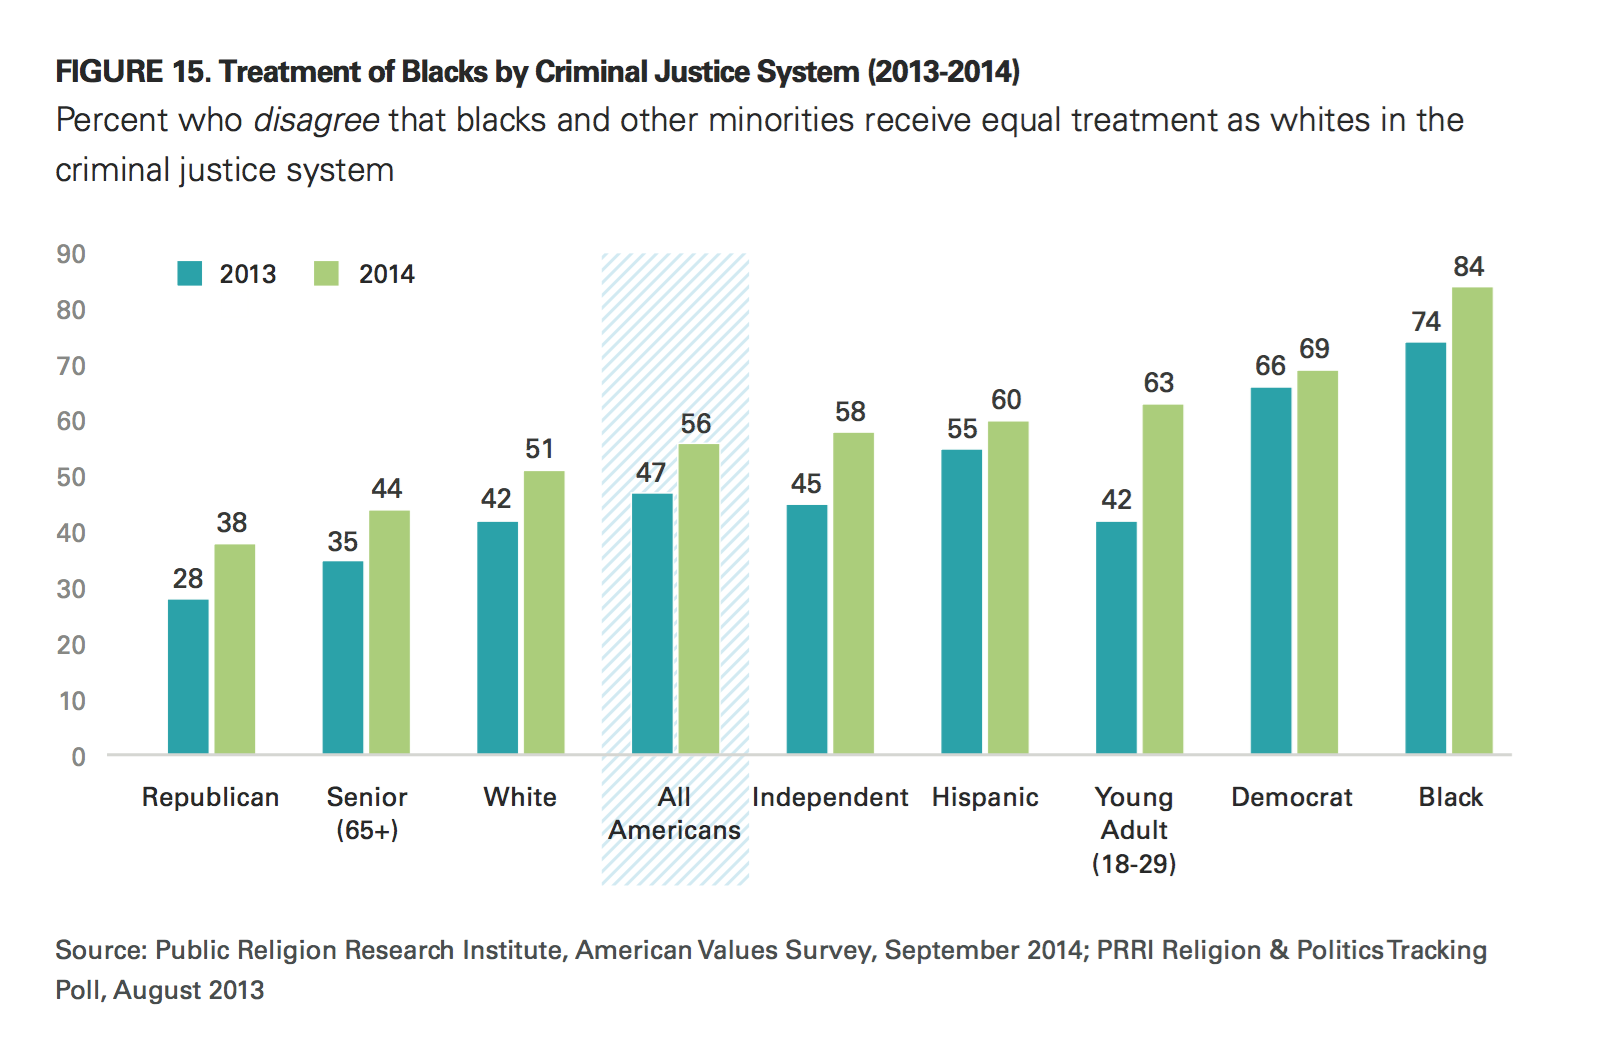
Over the last year, Americans’ confidence in the criminal justice system’s equal treatment of racial and ethnic minorities has dropped significantly. Today, fewer than 4-in-10 (38%) Americans believe that black Americans and other minorities receive the same treatment as white Americans in the criminal justice system, while a majority (56%) of Americans disagree. Just one year ago, the public was evenly divided, with nearly half (47%) the public agreeing that all Americans in the criminal justice system receive equal treatment regardless of race; 47% disagree.

- More than 8-in-10 (84%) black Americans say that black Americans and other minorities do not receive the same treatment as white Americans in the criminal justice system, compared to 6-in-10 (60%) Hispanics and a slim majority (51%) of white Americans.
- More than 6-in-10 (62%) white college-educated Americans do not believe that black Americans and other minorities receive the same treatment as white Americans in the criminal justice system, compared to 45% of white working-class Americans.
- More than 8-in-10 (84%) black Protestants, roughly two-thirds (66%) of religiously unaffiliated Americans, and a slim majority (53%) of Catholics disagree that all Americans in the criminal justice system receive equal treatment regardless of race. White mainline Protestants are divided (48% agree, 46% disagree) on the issue of equal treatment. Only 43% of white evangelical Protestants disagree that all Americans in the criminal justice system receive equal treatment regardless of race; 52% agree.
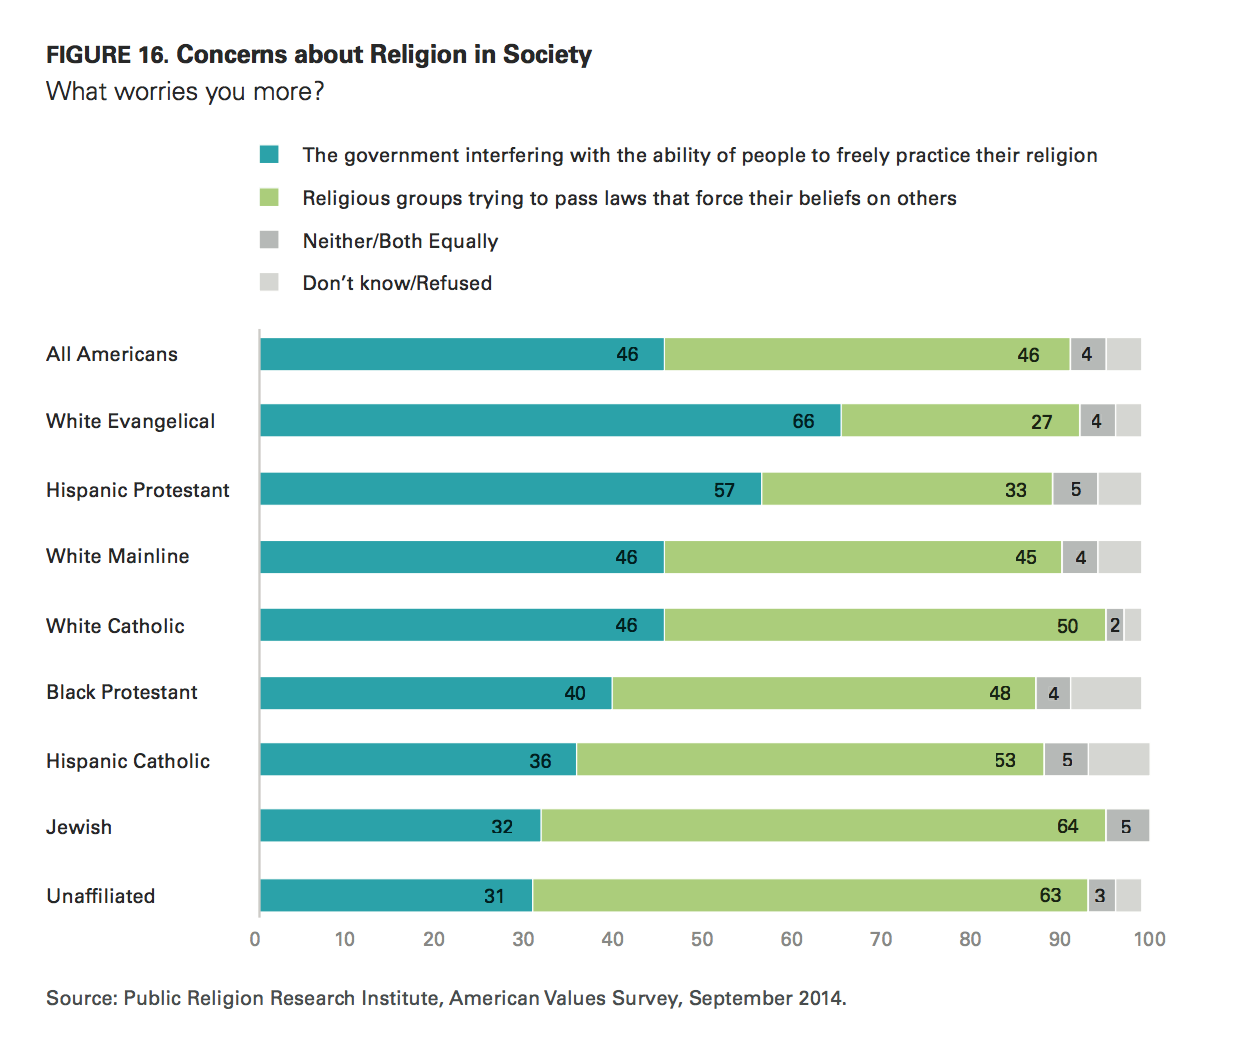
Nearly half (46%) of Americans say they are more concerned about the government interfering with the ability of people to freely practice their religion, while an equal number (46%) say they are more concerned about religious groups trying to pass laws that force their beliefs on others.
- White evangelical Protestants (66%) and Hispanic Protestants (57%) are more concerned about the government interfering with the ability of people to freely practice their religion.
- By contrast, religiously unaffiliated Americans (63%) and Jewish Americans (64%) report more concern about religious groups trying to pass laws that force their beliefs on others.
- There is less of a consensus among other religious groups. A slim majority (51%) of Catholics say they are more concerned about religious groups trying to force their beliefs on others, although 42% say they are more concerned about the government interfering with people’s ability to freely practice their religion. Although black Protestants are also divided, they are more concerned about religious groups trying to force their beliefs on others (48%) than they are about the government interfering with people’s ability to freely practice their religion (40%). White mainline Protestants are nearly evenly divided: 46% report more concern about the government interfering with people’s ability to freely practice their religion, while 45% say they are more concerned about religious groups trying to pass laws that force their beliefs on others.
I. The Current Economic Climate
Evaluations of Personal Financial Situation
Most Americans have a decidedly negative self-evaluation of their financial situation. These perspectives are also significantly more pessimistic than they were in 2010. Today roughly 4-in- 10 Americans say they are currently in excellent (7%) or good (34%) shape financially, while a majority of the public report being in only fair shape (37%) or poor (20%) financial shape. This assessment represents a notable drop from 2010 when half of Americans indicated they were in excellent (9%) or good (41%) shape financially.
There are significant generational, racial, and political differences in Americans’ assessments of their financial situation. Fewer than 4-in-10 young adults (age 18-29) report being in excellent (6%) or good (30%) shape financially, compared to more than 6-in-10 who say they are in fair (39%) or poor (24%) financial shape. In contrast, a slim majority of seniors (age 65 and older) say financially they are in excellent (9%) or good (42%) condition. Fewer than half say they are in fair (32%) or poor (12%) financial shape.
Black Americans and Hispanics’ assessments of their own financial situations are substantially more negative than white Americans’ financial reports.(1) Only 3-in-10 black Americans report that they are in excellent (5%) or good (25%) shape financially, while nearly 7-in-10 say they are in fair (38%) or poor (31%) shape financially. Likewise, only 3-in-10 Hispanics say they are in excellent (6%) or good (24%) shape, while nearly two-thirds report being in only fair (44%) or poor (24%) financial shape. Close to half of white Americans say that their personal financial circumstance is either excellent (8%) or good (38%), while a slim majority say their financial situation is fair (35%) or poor (17%).
Although white Americans report that they are better off financially than black Americans and Hispanics, their financial situation differs substantially according to social class. Only one-third of white working-class Americans say they are in excellent (4%) or good (29%) financial shape. Nearly two-thirds of white working-class Americans report that they are in fair (39%) or poor (25%) shape.(2) In contrast, more than 6-in-10 white college-educated Americans say they are in excellent (15%) or good (48%) shape financially, while about one-third indicate they are in fair (27%) or poor (7%) shape.
Republicans stand out as the only political group among whom a majority say they are in excellent (10%) or good (42%) financial shape. By contrast, only about 4-in-10 independents (37%), Democrats (39%), and those identifying with the Tea Party (40%) say they are either in excellent or good financial shape.
Slippage in Middle Class Self-Identification
Another marker of Americans’ financial distress is a recent shift in self-reported social class. Overall, 2% of Americans say they are upper class, 10% identify as upper-middle class, 37% describe themselves as middle class, 38% identify as working class, and 11% say they are lower class. The proportion of Americans who identify as upper class or lower class has not changed since this question was last asked in 2012.(3) However, over the same time period, the percentage of Americans who consider themselves to be middle class decreased by four percentage points, from 41% in 2012 to 37% in 2014. Meanwhile, the percentage of Americans who self-identify as working class increased by four points, from 34% in 2012 to 38% in 2014.
Personal Experiences of Economic Insecurity
The survey also finds that many Americans continue to experience significant economic hardships in their daily lives.
Specific Experiences of Economic Insecurity
In an effort to provide a concrete picture of the ways in which Americans are struggling economically, the American Values Survey included a series of questions to identify specific economic challenges American families have faced over the past year. These questions included self-reported information about losing a job, putting off seeing a doctor for financial reasons, being unable to pay a monthly bill, receiving food stamps or unemployment benefits, and cutting back on food to save money.
The most common economic hardship reported by Americans is cutting back on food to save money. More than one-third (36%) of Americans say that they or someone else in their household had to reduce meals or cut back on food to save money over the course of the past year. Nearly 3-in-10 Americans say that at some point in the past year, they or someone in their household were forced to put off seeing a doctor for financial reasons (29%), were unable to pay a monthly bill (29%), or lost a job or had their work hours reduced (27%). Nearly 1-in-5 Americans (19%) report that in the past year, they or someone in their household received food stamps, and 1-in-10 (10%) say that they or someone in their household received unemployment benefits. And while 31% of Americans indicate that that they or someone in their household received a promotion or raise at some point in the past year, nearly 7-in-10 (68%) report that no one in their household received a raise or promotion.
Americans’ economic experiences over the past year vary markedly by race and ethnicity. More than 4-in-10 black Americans (43%) and Hispanic Americans (41%) report that their household reduced meals or cut back on food to save money. One-third (33%) of white Americans also say that someone in their household cut back on food for financial reasons. However, there are notable class differences among white Americans: white working-class Americans are much more likely to report having to cut back on food for financial reasons than white college-educated Americans (40% vs. 24%).
More than one-third of black Americans (34%) say that someone in their household put off visiting a doctor for financial reasons over the last year. About one-quarter of white Americans (26%) and Hispanics (26%) say that they or someone in their household put off seeing a doctor for financial reasons.
Nearly half (47%) of black Americans report that they were unable to pay a monthly bill, an experience that was much less common in Hispanic (30%) and white households (26%). Again, white Americans’ experiences also vary by class: nearly one-third (32%) of white working-class Americans say that their household was unable to pay a monthly bill, compared to fewer than 1-in-5 (18%) college-educated white Americans.
Black Americans (36%) and Hispanics (37%) are much more likely than white Americans (23%) to report that someone in their household lost a job or had their hours reduced at work. Here, class divisions among white Americans are more modest. More than one-quarter (27%) of white working-class Americans say that they or someone in their household had their hours reduced at work or lost a job, compared to 1-in-5 (20%) white college-educated Americans who say the same.
Roughly 4-in-10 (39%) black Americans report that they or someone in their household received food stamps in the last 12 months. Significantly smaller percentages of Hispanic (24%) and white (15%) Americans report that they or someone in their household received food stamps. The differences among white Americans by social class are, however, dramatic. Nearly one-quarter (23%) of white working-class Americans report that they or someone in their household received food stamps, compared to only five percent of white college-educated Americans. There are few racial and ethnic differences in the percentage of households receiving unemployment benefits.
The Economic Insecurity Index
In an effort to provide a composite picture of economic insecurity, PRRI combined six separate questions into a single additive scale.(4) The Economic Insecurity Index identifies four basic household types: high economic insecurity household (at least four experiences), moderate economic insecurity households (two to three experiences), low economic insecurity households (one experience), and households with no reported economic insecurities (zero experiences).(5)
Overall, the Economic Insecurity Index (EII) finds that approximately 4-in-10 Americans live in high or moderate economic insecurity households, while 6-in-10 Americans live in households with low or no reported economic insecurity. Specifically, 15% of Americans live in high economic insecurity households, and 26% live in moderate economic insecurity households. On the other hand, 1-in-5 (20%) of Americans live in households with low economic insecurity and 39% live in households with no reported economic insecurity.
Not surprisingly, there are, considerable variations in Americans’ level of economic insecurity at different household income levels, but significant levels of economic insecurity persist even into middle class income ranges. Nearly 6-in-10 Americans who have household incomes of less than $30,000 live in either high (24%) or moderate (33%) economic insecurity households. Notably, nearly half of Americans who have household incomes between $30,000 and $49,000 also live in either high (16%) or moderate (30%) economic insecurity households. Even one-third of Americans who have household incomes between $50,000 and $99,000 live in high (9%) or moderate (24%) economic insecurity households. By contrast, only 1-in-5 Americans who have household incomes of $100,000 or more live in high (5%) or moderate (15%) economic insecurity households.
There are pronounced racial disparities in Americans’ experiences of economic insecurity. Nearly 6-in-10 black Americans live in households with moderate (33%) or high (25%) levels of economic insecurity. Nearly half of Hispanics live in moderate (29%) or high (18%) economic insecurity households. By contrast, fewer than 4-in-10 white Americans reside in households characterized by moderate (24%) or high levels (12%) of economic insecurity. However, the class differences among white Americans are yawning. More than 4-in-10 white working-class Americans live in households characterized by moderate (28%) or high (16%) levels of economic insecurity. Fewer than 3-in-10 white college-educated Americans live in moderate (20%) or high (7%) economic insecurity households; a majority (54%) live in households with no reported economic insecurity.
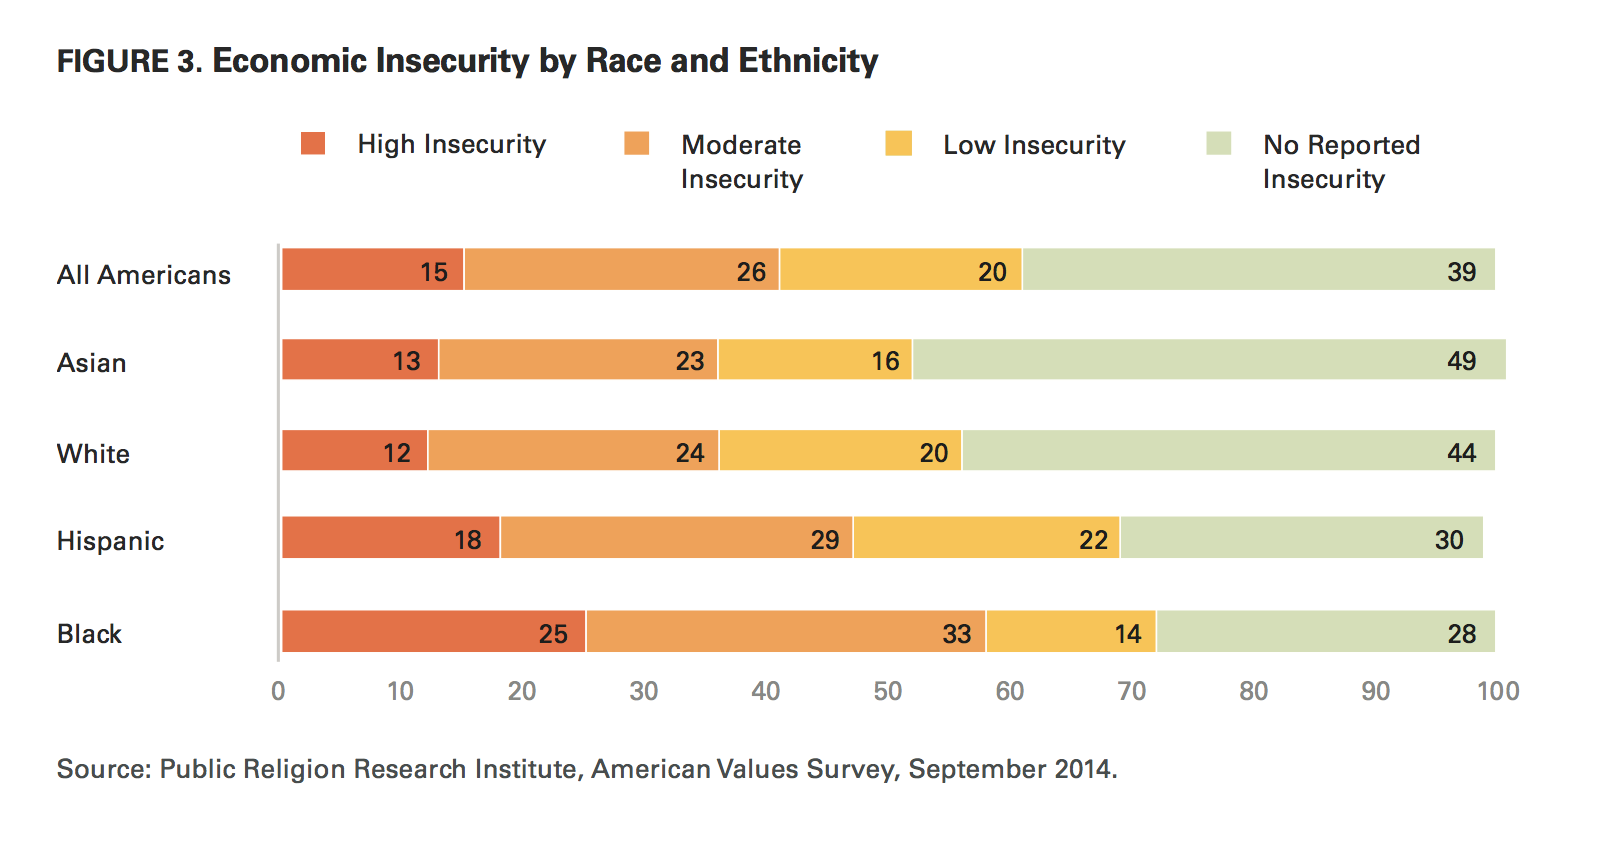
The economic experiences of Asian Americans are similar to that of white Americans, with only about one-third residing in moderate (23%) or high (13%) economic insecurity households.
There are also significant disparities in the Economic Insecurity Index by party affiliation. Republicans stand apart from other Americans, with fewer numbers of those within their ranks reporting that they live in high or moderate economic insecurity households. Less than one-third of Republicans live in moderate (22%) or high (10%) economic insecurity households, while more than two-thirds live in households with low (22%) or no (46%) economic insecurity. By contrast, more than 4-in-10 Democrats reside in moderate (26%) or high (16%) economic insecurity households, and about six-in-ten reside in households characterized by low (20%) or no (38%) economic insecurity. A significant number of political independents report facing substantial economic challenges. Nearly half of independents live in moderate (30%) or high (17%) economic insecurity households, compared to a slim majority who live in households with low (18%) or no (35%) reported economic insecurity.
Perceptions of the U.S. Economy
While the American economy has improved over the last several years—unemployment now stands at 6.1% as of August 2014, down from a high of 10% in October 2009 (6) —Americans remain pessimistic about their own economic situation and express significant concern about the future.
Compared to one year ago, Americans today are less likely to say the economy has improved over the previous two years. Today, only 30% of Americans believe the economy has gotten better over the last two years, while 35% say it has gotten worse, and 33% say it has stayed about the same. In 2013, 35% of Americans said the economy had improved over the previous two years.(7)
However, Americans’ perspectives on the state of the economy have improved markedly since 2010, when nearly half (48%) of Americans said that the economy had gotten worse over the previous two years.(8)
Perceptions of the economy’s relative strength vary according to political affiliation. Nearly half (48%) of Democrats say the economy has gotten better over the last two years, while about 1-in-5 (17%) say it has gotten worse. One-third (33%) of Democrats say the economy has stayed about the same over the last two years. Despite the fact that Republicans are more likely than Democrats to report being in good or excellent financial shape, only 15% of Republicans (and 14% of Tea Party members) say the economy has gotten better over the last two years. Majorities of Republicans (54%) and Americans who identify with the Tea Party movement (62%) say the economy has gotten worse over the last couple years. Independents’ assessments of the economy’s relative strength closely mirror the general public.
Americans also have different outlooks on the state of the economy depending on their race and social class. Among racial and ethnic groups, black Americans have the most positive evaluations of the state of the economy. Close to half (46%) of black Americans say the economy has gotten better over the past two years, nearly 4-in-10 (37%) say it has stayed about the same, and only 15% say the economy has gotten worse. Asian Americans are also relatively optimistic about the state of the economy. Four-in-ten (40%) Asian Americans say the economy has gotten better over the past two years, 38% say it has stayed about the same, and 20% say the economy has gotten worse. Hispanics are more divided. Three-in-ten (30%) Hispanics say the economy has gotten better over the past two years, 42% say the economy has stayed about the same, and more than one-quarter (26%) say it has gotten worse.
White Americans have more negative opinions about the state of the economy than other racial and ethnic groups. However, there are also substantial class divisions among white Americans. Overall, roughly one-quarter of white Americans (26%) say the economy has gotten better over the past two years, 30% say it has stayed about the same, and more than 4-in-10 (41%) say it has gotten worse. However, white college-educated Americans are more than twice as likely as white working-class Americans to say the economy has gotten better (39% vs. 19%). Nearly half (49%) of white working-class Americans say the economy has gotten worse, compared to 3-in-10 (30%) white college-educated Americans.
Americans who rely on different television news sources for information about news and politics also have substantially different perspectives on the state of the economy. A majority (56%) of Americans who say they most trust Fox News to give them accurate information about politics and current events say that the economy has gotten worse over the past two years, 30% say it has stayed the same, and only 13% say it has gotten better. By contrast, nearly half of Americans who most trust The Daily Show with Jon Stewart or The Colbert Report (49%), MSNBC (46%), and public television (45%) say the economy has gotten better. The views of Americans who most trust CNN and the broadcast networks align with Americans overall.
Is the U.S. Still in a Recession?
According to a general consensus among economists, the recession began in 2007 and officially ended by 2009.(9) However, only about 1-in-5 (21%) Americans believe the recession is over, while 72% believe the economy is still in a recession today. The percentage of Americans who believe the U.S. is still in the midst of a recession has remained unchanged over the past two years. In 2012, only 21% of Americans reported that they believed the recession was over.(10)
Americans’ perceptions of whether the U.S. is still in a recession do not differ substantially by gender or age, and there are only minor divides according to race. Roughly three-quarters (74%) of white Americans and 71% of Hispanics believe the country is still in a recession. Approximately two-thirds of Asian Americans (67%) and black Americans (64%) say the same.
Majorities of Americans from across the political spectrum also believe the country is still in a recession. However, Republicans (82%) and independents (75%) are somewhat more likely than Democrats (61%) to say the country is still in a recession.
American Optimism Dimming
Bleak Outlook for Future Generations
Americans are decidedly negative about their prospects for the future. Nearly half (49%) of Americans believe that their generation is better off financially than their children’s generation will be. About 1-in-5 (18%) say the two generations will be equally well-off financially, while 29% say their generation is worse off financially than their children’s generation will be.
There are notable generational differences on this question. A majority (52%) of seniors (age 65 and older) say that their generation is better off financially than future generations will be, a view shared by only 40% of young adults (age 18-29). More than one-third (34%) of young adults say their generation is worse off than their children’s generation will be.
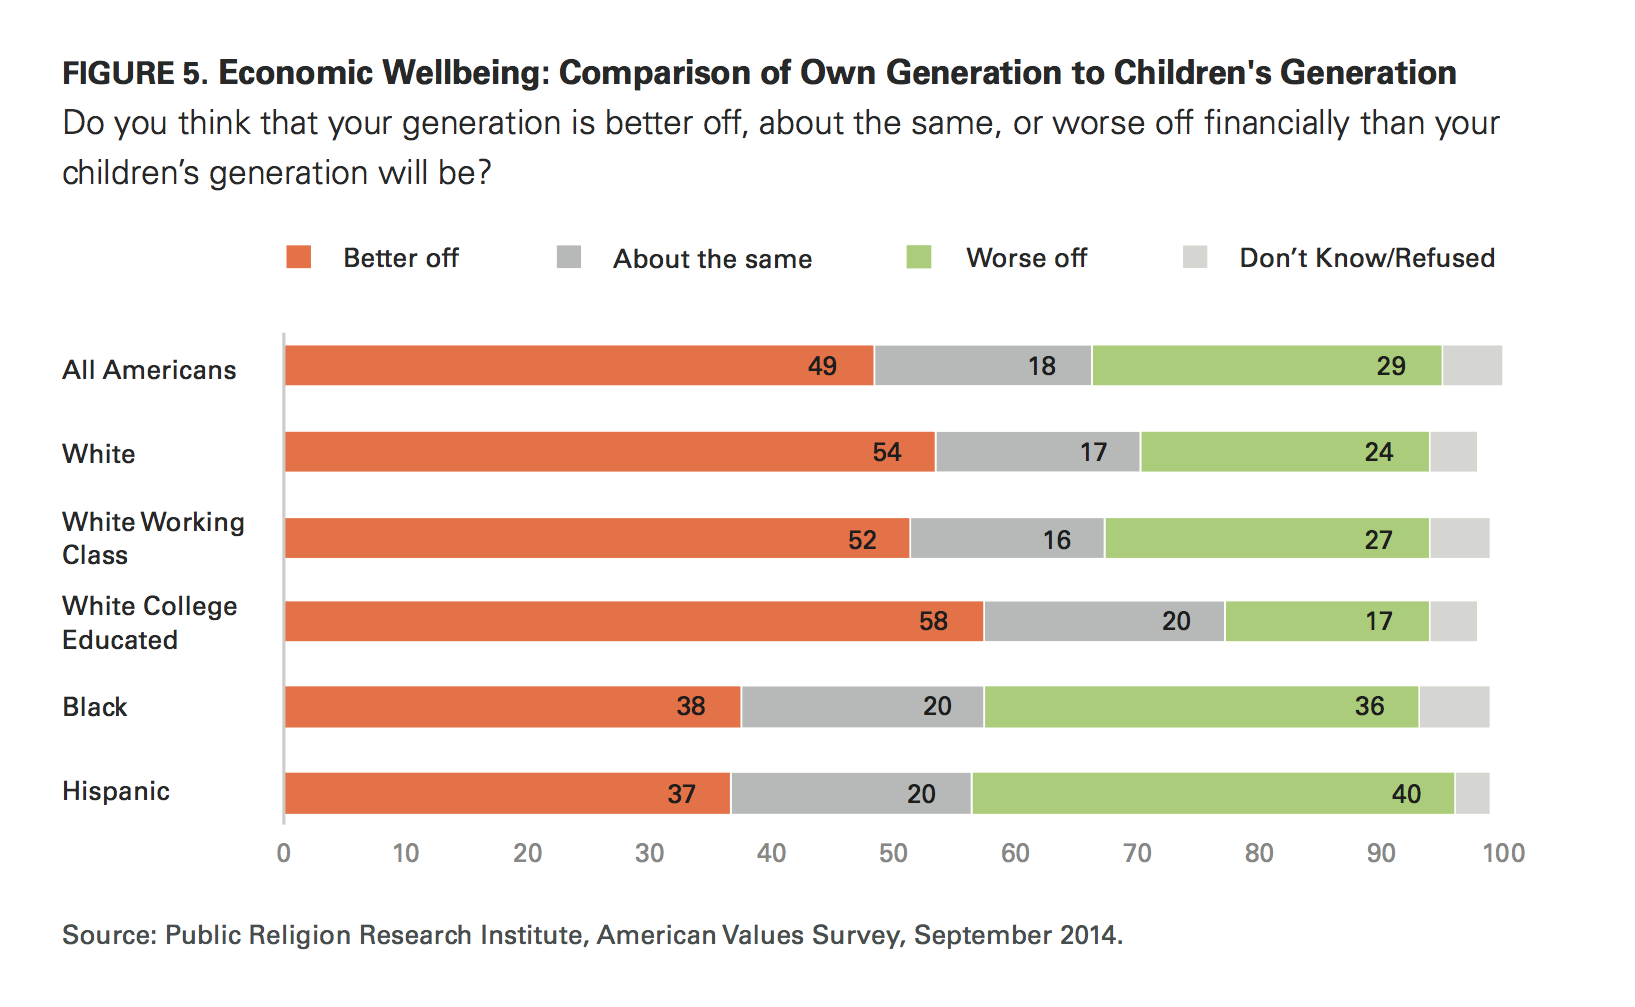
Views of the future differ sharply by race and ethnicity, with white Americans expressing much greater pessimism about their children’s financial prospects than black Americans and Hispanics. A majority (54%) of white Americans say that their generation is better off financially than their children’s generation will be, a view shared by only 38% of black Americans and 37% of Hispanic Americans. Thirty-six percent of black Americans and 40% of Hispanic Americans say their generation is worse off financially than their children’s generation will be.
Politically conservative groups report greater concerns about the future than moderate or liberal groups. A majority (56%) of Republicans and 6-in-10 (60%) members of the Tea Party movement say their generation is better off than their children’s generation will be. Fewer than half of independents (47%) and Democrats (44%) say that their generation is better off than their children’s generation will be.
Similarly, anxiety about future generations’ financial well-being differs according to most trusted media source. Americans who most trust Fox News for information about current events (57%) are more likely than Americans who most trust CNN (45%), MSNBC (45%), broadcast news networks like ABC, NBC, and CBS (44%), and The Daily Show with Jon Stewart or The Colbert Report (42%) to say that their generation will be better off financially than their children’s generation.
Wavering Belief in the American Dream
Only roughly 4-in-10 (42%) Americans say that the American Dream—that if you work hard, you’ll get ahead—still holds true today. Nearly half of Americans (48%) believe that the American Dream once held true but does not anymore, and 7% say the American Dream never held true. This level of support for belief in the American Dream is significantly lower than levels reported in 2012 (53%) and 2010 (50%), although similarly low levels were reported in 2011 (44%).
White Americans (45%) and Hispanics (42%) are more likely than black Americans (31%) to believe that the American Dream still holds true today, although pluralities of each group say it was true in the past, but not anymore. Notably, black Americans are more likely than any other group to say that the American Dream never held true (14%).
There are broad divisions among white Americans according to class. A majority (54%) of white college-educated Americans say the American Dream remains true today, but only 37% of white working-class Americans agree. A majority (56%) of white working-class Americans believe that the American Dream was once true but is not anymore.
Men are more likely than women to believe in the American Dream. Nearly half (48%) of men say the American Dream still holds true today, compared to only 37% of women. A majority (53%) of women say the American Dream once held true, but not anymore. There are few differences by generation on this question.
Republicans are more likely than Democrats and independents to believe in the American Dream. A majority of Republicans (55%) and Americans who identify with the Tea Party (51%) say the American Dream still holds true today, a view shared by only 42% of independents and one-third (33%) of Democrats.
Self-Comparisons to Other Americans’ Situations
Despite the evident concerns about their own financial situations, Americans tend to believe they are in somewhat better shape than their neighbors. Nearly 6-in-10 Americans (58%) say that they are doing better than most other Americans. About 15% say they are doing about the same as other Americans, and fewer than 1-in-5 (19%) say they are doing worse.
There are no significant differences by race or ethnicity with this question, despite the gaps in Americans’ self-reported financial circumstances. Nearly 6-in-10 white (59%) and black (59%) Americans and a majority (55%) of Hispanics say they are doing better than most other Americans. There are, however, striking class divisions among white Americans. While nearly three-quarters (73%) of white college-educated Americans say they are doing better than other Americans, only half (50%) of white working-class Americans believe they are doing better than their neighbors.
Most Important Issues in the Country
For many Americans, the economy is the most decisive issue for their vote in November’s midterm election. Nearly 4-in-10 (38%) Americans say the economy is the most important issue to their vote this year. The next three most frequently cited issues are health care (22%), immigration (15%), and national security (13%). Fewer than 1-in-20 Americans name culture war issues like same-sex marriage (4%) or abortion (4%) as the issue that is most important to their vote.
There are few differences between political groups on this question, with a few notable exceptions. Pluralities of Republicans (36%), independents (38%) and Democrats (40%) say the economy is the most important issue to their vote. Republicans are more likely to prioritize national security as a voting issue compared to Democrats (17% vs. 10%), while Democrats are more likely to stress the importance of health care (26% vs. 18%). Americans who identify with the Tea Party (24%) are twice as likely as Democrats (12%) to say that immigration is the most important issue for their vote this year. In fact, members of the Tea Party are almost as likely to say immigration (24%) is a top voting issue as the economy (29%).
When asked about the most pressing economic issues in the U.S. today, roughly one-quarter (25%) of Americans point to the lack of jobs. About 1-in-5 mention the increasing gap between rich and poor (21%), the budget deficit (17%), or the rising cost of health care (16%). Roughly 1-in-10 say that Social Security (9%) or the rising cost of education (8%) is the most important economic issue facing the country.
There are also notable partisan differences in economic priorities. Republicans are more likely to cite the budget deficit than the lack of jobs as the most important economic issue facing the U.S. (30% vs. 23%); this pattern is also evident among Tea Party members (31% vs. 26%). Democrats, on the other hand, are about as likely to identify the increasing gap between the rich and the poor (29%) as they are lack of jobs (27%) as their most important economic priority.
II. The 2014 Midterm Elections
Midterm Voting Preferences
At this stage of the campaign season,(11) voters are roughly split in their vote preferences. Forty-five percent of registered voters say that if the election were being held today, they would vote for—or are leaning toward—the Democratic candidate in their electoral district, while roughly as many (43%) say they would vote for—or are leaning toward—the Republican candidate. There are notable differences among the public in their voting preferences.
Gender, Class, and Race Divides
There is a substantial gender gap in Americans’ voting preferences. Nearly half (49%) of male voters express a preference for the Republican candidate in their district, while fewer than 4-in-10 (39%) say they would support the Democratic candidate. Among female voters, these voting preferences are reversed. Half (50%) of women voters say they would support the Democratic candidate if the election were held today, while 38% express support for the Republican candidate.
The gender divide is also strong among white Americans, although white women voters still prefer Republican candidates over Democratic candidates. Nearly 6-in-10 (58%) white male voters say they currently support the Republican candidate in their district, while 31% are supporting the Democratic candidate. Nearly half (49%) of white women voters prefer the Republican candidate, while four-in-ten (40%) prefer the Democratic candidate.
The class divide in voter preference among white Americans is relatively modest. A majority (52%) of white working-class voters say they are supporting, or leaning toward, the Republican candidate in their district, while only one-third (33%) say they support the Democratic candidate. White college-educated voters are slightly more likely to say they support the Democratic candidate (41%), although a slim majority (51%) also express support for the Republican candidate.
There are wide differences in voting preference by race and ethnicity. Currently, a majority (53%) of white voters say they are supporting Republican candidates in their election district. By contrast, more than 8-in-10 (85%) black voters and nearly 6-in-10 (58%) Hispanic voters report that they are voting for, or leaning toward, the Democratic candidate.
Vote by Economic Insecurity Level
Voting preferences of Americans at various levels of economic insecurity are pronounced, rivaling differences found among other demographic groups. Voters living in households with no reported economic insecurity experiences and voters in low insecurity households slightly prefer Republican candidates to Democratic candidates (47% vs. 43% and 46% vs. 42% respectively). However, voters experiencing moderate insecurity or high insecurity express a strong preference for Democratic candidates over Republican candidates (48% vs. 39% and 52% vs. 35% respectively).
The Religion Vote
The voting preferences of religious communities largely mirror the 2012 presidential vote patterns. White Protestants remain the GOP’s strongest supporters. Nearly 7-in-10 (69%) white evangelical Protestant voters and a majority (53%) of white mainline Protestant voters favor the Republican candidate in their district. Half (50%) of white Catholic voters also say they would vote for, or lean toward, the Republican candidate, while 40% say they would support the Democratic candidate.
By contrast, nearly two-thirds (65%) of Hispanic Catholic voters prefer the Democratic candidate in their district. Nearly 9-in-10 (88%) black Protestants say they are supporting the Democratic candidate in their district. Majorities of Jewish voters (57%) and unaffiliated voters (55%) also say they would support a Democratic candidate.
Registered Voters vs. Likely Voters
The voting preferences of American adults as a whole, registered voters, and likely voters differ in important ways. PRRI combined three self-reported measures—participation in the 2012 election, general turnout frequency, and probability of voting this year—to identify likely voters. By this definition, likely voters account for 36% of all American adults and close to half (46%) of all registered voters.
Among all American adults, 45% say they are currently inclined to support the Democratic candidate in their election district, while 41% say they would support the Republican candidate. Similarly, registered voters are slightly more likely to support the Democratic candidate (45%) over the Republican candidate (43%). However, among likely voters, Republican candidates hold a substantial advantage over Democratic candidates (49% vs. 41%).
Popularity of the Democratic Party, the Republican Party, and Barack Obama
At this point in the campaign season, Americans’ attitudes toward the Democratic Party are slightly more positive than negative. Half (50%) of Americans report that they have a favorable view of the Democratic Party, while 44% have an unfavorable view. Views of the GOP are inverted, with slightly more Americans expressing an unfavorable view (48%) of the Republican Party than a favorable view (44%).
Gender and Generation Divides
Among men, neither political party retains much of an advantage in terms of its reputation. Close to half (46%) of men have a favorable view of the Republican Party, while a nearly identical number (45%) say they have a positive opinion of the Democratic Party. In contrast, the Democratic Party is substantially more popular among women than the Republican Party. A majority (55%) of women say they have a favorable impression of the Democratic Party, while roughly 4-in-10 (42%) express a positive view of the GOP. Interestingly, the current advantage the Democratic Party has over the GOP among women does not stem from overwhelmingly negative views of the GOP; rather, it is driven by the generally positive views that women have of the Democratic Party.
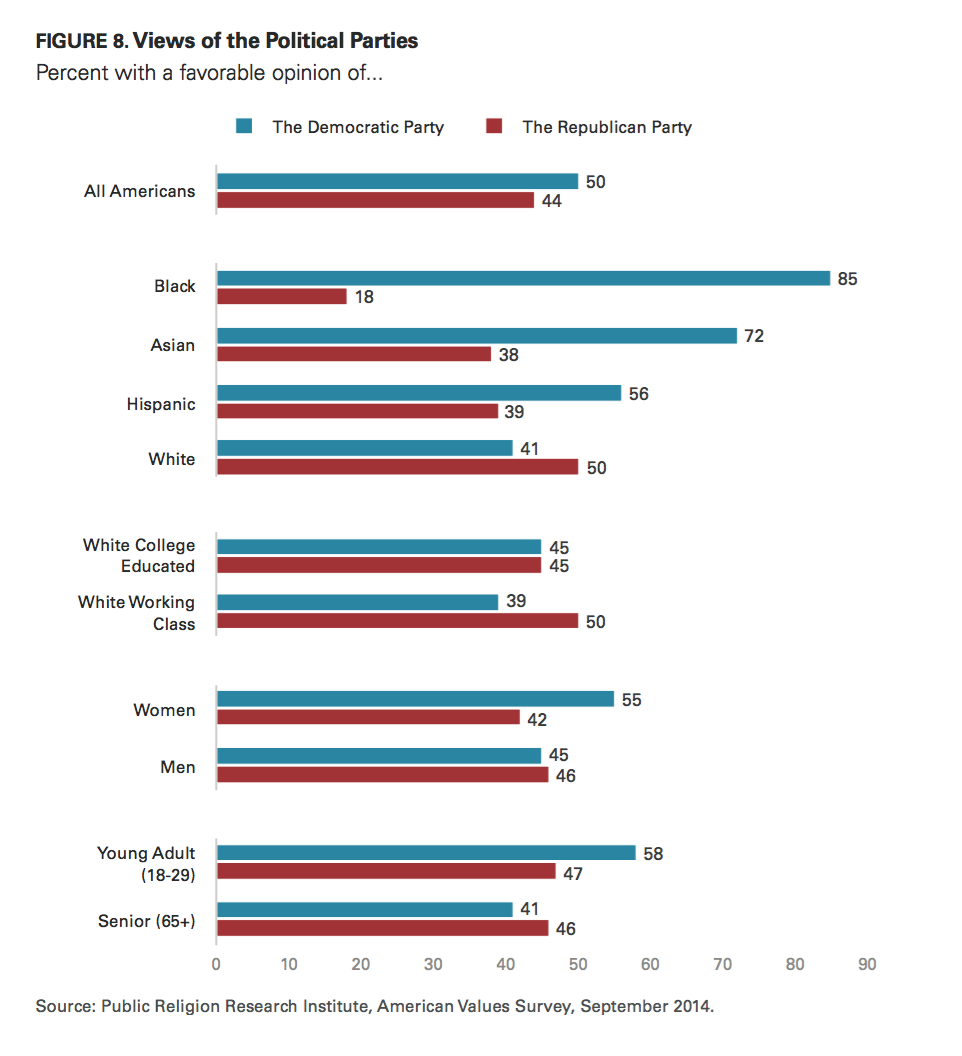
There is an even larger generation gap in Americans’ perspectives on the two political parties. However, like the gender divide, the generation gap is driven largely by differing views of the Democratic Party. Similar numbers of young adults (age 18 to 29) and seniors (age 65 and older) have a favorable view of the Republican Party (47% vs. 46%). By contrast, the Democratic Party is much more popular among young adults than among seniors. Nearly 6-in-10 (58%) young adults have a favorable view of the Democratic Party, compared to more than 4-in-10 (41%) seniors.
The Enduring Racial Divide
There are substantial racial divisions in Americans’ views of the political parties. Eighty-five percent of black Americans and more than 7-in-10 (72%) Asian Americans have a favorable of view the Democratic Party. A majority (56%) of Hispanic Americans also say they have a positive view of the Democratic Party. By contrast, only about 4-in-10 (41%) white Americans view the Democratic Party favorably. The Republican Party fares much worse among non-white groups, but substantially better among white Americans. Only 18% of black Americans, and fewer than 4-in-10 Asian Americans (38%) and Hispanics (39%), report having a favorable impression of the Republican Party. In contrast, half (50%) of white Americans say they have a favorable view of the GOP.
Barack Obama: The Likability-Performance Gap
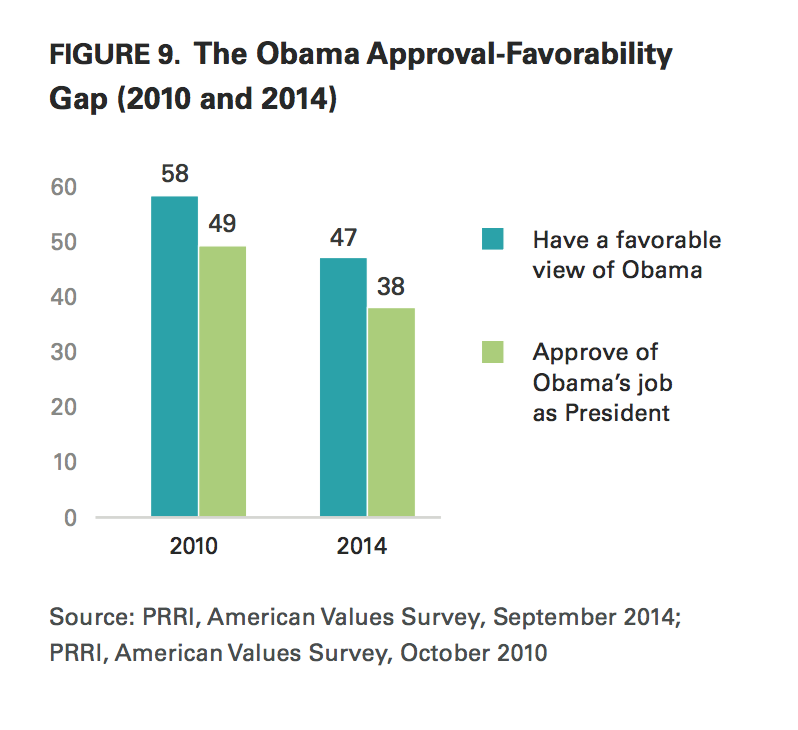 Throughout his presidency, views of Barack Obama’s job performance have consistently lagged behind Americans’ views of him personally. Currently, fewer than 4-in-10 (38%) Americans report that they approve of the job Obama is doing as President. Despite his lackluster performance reviews, nearly half (47%) of Americans say they have a favorable view of him personally. The gap between assessments of Obama’s job performance and how he is viewed personally has remained, even as both evaluations have experienced a significant decline. In 2010, roughly half (49%) the public approved of Obama’s job performance as President, but his personal favorability among Americans was even higher; nearly 6-in-10 (58%) said they had a positive view of the President that year.(12)
The Tea Party and the 2014 Election
Public Perceptions of the Tea Party: Heroes or Villains?
From its earliest days, the Tea Party has evoked more negative than positive feelings, a pattern that remains true today. Currently, 35% of Americans say they have a favorable view of the Tea Party, while close to half (46%) say they have an unfavorable view. Roughly 1-in-5 Americans report having never heard of the Tea Party (5%) or have no opinion of the group (14%). The balance of opinion has become slightly more negative over the last four years. In 2010, 40% of Americans reported having a negative view of the Tea Party, while 36% said they had a positive view.(13)
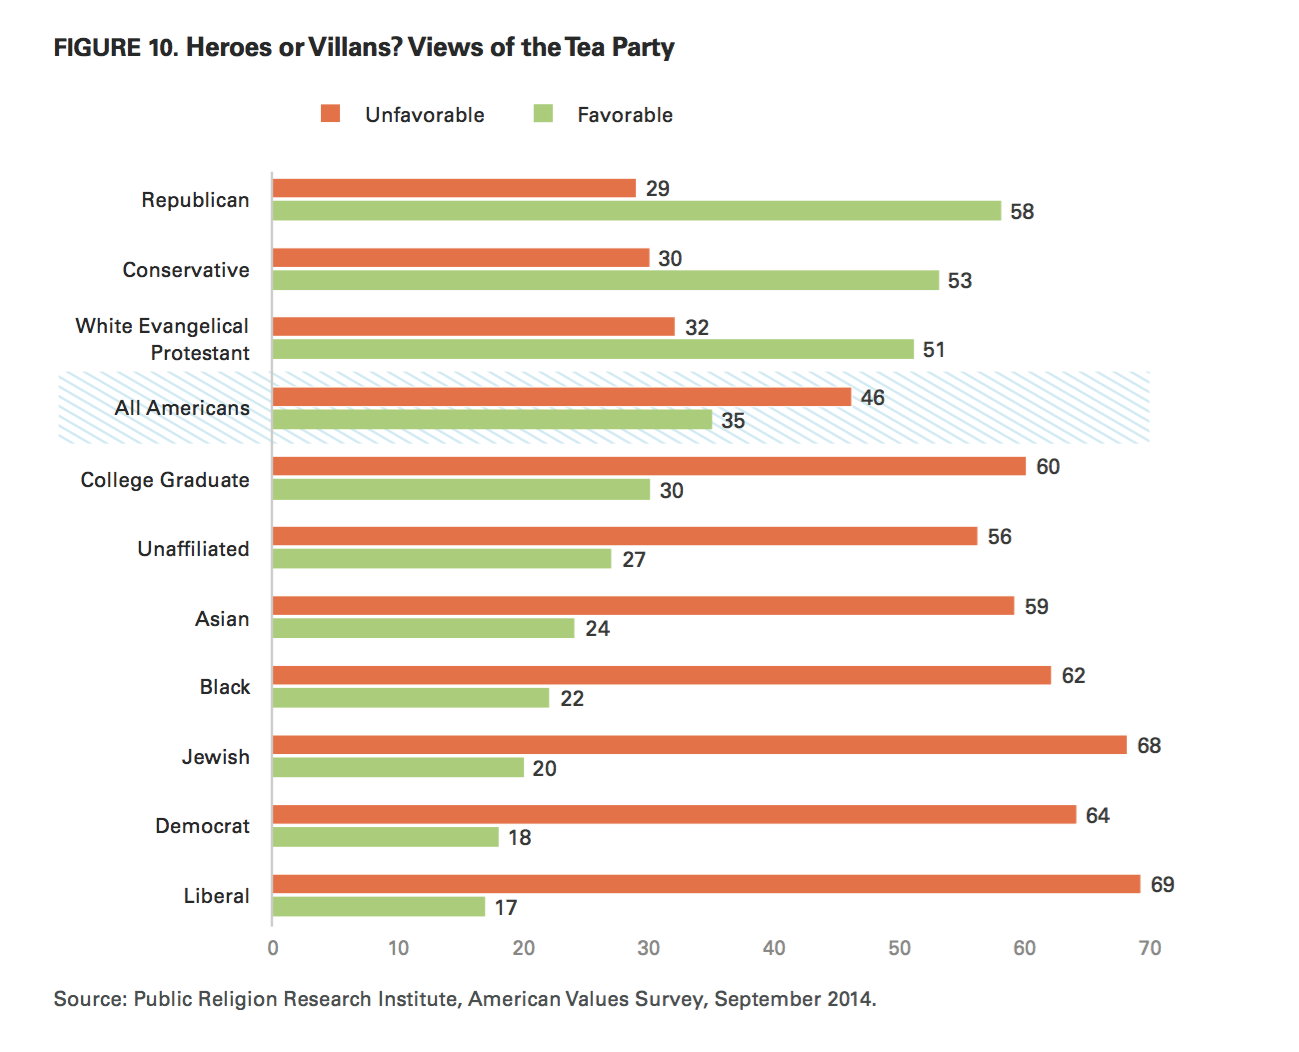
Views of the Tea Party are highly polarized. Jewish Americans and political liberals express the most negative feelings about the Tea Party, with nearly 7-in-10 (68% and 69% respectively) registering unfavorable views of the group. More than 6-in-10 Democrats (64%), and black Americans (62%) also have an unfavorable view of the Tea Party. A majority of college graduates (60%), Asian Americans (59%), and religiously unaffiliated Americans (56%) also report unfavorable views of the Tea Party. Conversely, majorities of white evangelical Protestants (51%), political conservatives (53%), and Republicans (58%) have a favorable opinion of the Tea Party.
Americans who most trust Fox News for information about current events are more likely than Americans who rely on any other media source to have a positive view of the Tea Party. Nearly two-thirds (65%) of Americans who most trust Fox News have a favorable view of the Tea Party, compared to 28% of Americans who most trust broadcast networks like ABC, NBC, and CBS, 27% of CNN viewers, 21% of MSNBC viewers, 20% of public television viewers, and 18% of Americans who most trust The Daily Show with Jon Stewart or The Colbert Report. Majorities of all of these groups have unfavorable views of the Tea Party.
The Tea Party in 2014
Although the Tea Party remains a potent force in American politics, there are signs that the movement may be shedding members. Currently, seven percent of Americans identify as part of the Tea Party movement, down from 11% in 2010.
Although the Tea Party is somewhat smaller today than it was in 2010, the demographic attributes of those who identify with the movement remain largely unchanged.(14) Tea Party members tend to have somewhat lower levels of education than Republicans overall; a majority (53%) have a high school education or less, compared to 42% among Republicans overall. While a majority (52%) of Republicans report being in excellent or good financial shape, only 40% of those identifying with the Tea Party say the same. Nearly 6-in-10 (58%) members of the Tea Party are men and roughly three-quarters (74%) are white, non-Hispanic. Americans who identify with the Tea Party are also much more avid supporters of Fox News. A majority (54%) of Americans who belong to the Tea Party say Fox News is their most trusted source for news about politics and current events, compared to only 23% of the general public.
The politics of the Tea Party also make its members quite distinct. Seven-in-ten (70%) Tea Party members identify as conservative. Their issue priorities are also somewhat different from other politically-affiliated Americans. For example, Americans who identify with the Tea Party movement care more about the issue of immigration (24%) than Republicans (17%), independents (17%) or Democrats (12%).
Despite initial suggestions that the Tea Party represented a new, independent political movement, research conducted in 2010 found that the Tea Party drew heavily from existing social movements, particularly the Christian Right and the Republican Party.(15) This remains true today. Nearly half (47%) of Americans who identify with the Tea Party also say they are part of the Religious Right or the Christian conservative movement, and nearly 8-in-10 (77%) identify as, or lean toward, the Republican Party.
III. Concerns about Fairness, Equal Opportunity, and Inequality in Society
Fairness of the Economic System
Nearly two-thirds (64%) of Americans believe the economic system in the U.S. unfairly favors the wealthy. Roughly one-third (34%) disagree that the economic system is skewed towards wealthy Americans. There are few disagreements among Americans about the nature of the economic system by age, race, class, gender or education level.
Yet, wide political differences persist in views of the current economic system. Only about one-third (34%) of Americans who identify with the Tea Party and less than half (46%) of Republicans believe the economic system tilts toward wealthy Americans. In contrast, nearly 7-in-10 (69%) independents and more than three-quarters (76%) of Democrats say the economic system unfairly favors the wealthy.
Equal Opportunity
Most Americans (55%) believe that one of the big problems in the country is that not everyone is given an equal chance in life. Roughly 4-in-10 (38%) disagree with this statement, saying that it is not that big of a problem if some people have more of a chance in life than others. Public opinion has remained stable on this question over the last four years; in 2010, 53% of Americans said that the lack of equal opportunity was a big problem in the country.(16) However, views about the importance of equal opportunity differ substantially across subgroups.
Women are more likely than men to believe that one of the big problems facing the country is the lack of equal opportunity for all. Six-in-ten (60%) women say that one of the big problems in the country is that not everyone is given an equal chance in life, a view shared by half (50%) of men.
Young adults (age 18-29) are substantially more likely to view the lack of opportunity as a significant problem in the country. Nearly two-thirds (66%) of young adults say that not providing everyone an equal chance is a big problem, compared to fewer than half (44%) of seniors (age 65 and older). Forty-six percent of seniors say that it is not really that big of a problem if some people have more of a chance in life than others.
There are considerable differences by race and ethnicity in views about equal opportunity. While more than three-quarters (76%) of black Americans, and roughly 6-in-10 Hispanics (62%) and Asian Americans (58%) say that one of the most significant issues facing the country is that not everyone is given an equal chance in life, only half (50%) of white Americans agree. More than 4-in-10 (42%) white Americans believe that it is not really that big of a problem if some people have more of a chance in life than others.
Strikingly, there are few differences among white Americans by social class on this question. White working-class Americans (52%) are only slightly more likely than white college-educated Americans (48%) to believe that lack of equal opportunity constitutes a major problem for the country.
The differences between America’s religious communities are also largely driven by race. White evangelical Protestants and white mainline Protestants are divided over the issue of equal opportunity, with close to half of each group (47% and 45%, respectively) saying that it is not that big of a problem if some people have more of a chance in life than others. White Catholics are also divided: half (50%) say that one of the big problems in this country is that not everyone is given an equal chance, while 42% disagree. Other religious groups are less divided. Roughly three-quarters (76%) of black Protestants say one of the big problems in the U.S. is that not everyone is given an equal chance. Similar numbers of Hispanic Protestants (60%) and Hispanic Catholics (64%) report that one of the country’s biggest problems is the lack of equal opportunity. About 6-in-10 Jewish Americans (61%) and religiously unaffiliated Americans (60%) believe that not giving everyone an equal chance is big problem in the U.S.
There are strong partisan differences on the issue of equal opportunity. More than 7-in-10 (72%) Democrats and a majority (56%) of independents say one of the big problems in this country is that not everyone is given an equal chance in life, compared to 34% of Republicans. A majority (56%) of Republicans and Americans who identify with the Tea Party (56%) say that it is not that big of a problem if some people have less of a chance in life than others.
More than two-thirds (68%) of Americans who live in households with high levels of economic insecurity believe that one of the big problems in the U.S. is the lack of equal opportunity. Americans who live in households with no reported economic insecurity are evenly divided over the issue of opportunity in society: Forty-five percent say it is not really that big of a problem if some people have more of a chance in life than others, while 47% say that it is a big problem if not everyone is given an equal chance in life.
Despite the concern about the lack of opportunity in society, Americans are closely divided over whether children from all income groups generally have adequate opportunities to be successful (47% agree, 49% disagree).
There are major divisions by race and ethnicity. The views of white Americans closely track those of the general public, with nearly as many in agreement (48%) as disagreement (51%). Only about 4-in-10 (43%) black Americans believe that children from all income groups have adequate opportunities to be successful, while a majority (56%) disagree. Notably, a majority of Hispanic Americans (57%) and Asian Americans (59%) agree that all children in the U.S. have adequate opportunities to be successful.
Partisans differ sharply on this issue. One-quarter (75%) of Americans who identify with the Tea Party and more than 6-in-10 (62%) Republicans say that children from all income levels have adequate opportunities to achieve success, while fewer than half of independents (48%) and Democrats (41%) agree.
Role of Government in Addressing Economic Inequality: Support and Skepticism
Nearly two-thirds (66%) of Americans agree that the government should do more to reduce the gap between the rich and poor, while roughly one-third (32%) disagree. With a few exceptions, most subgroups of Americans are in agreement about the role of government in addressing inequality. Differences in opinion vary mostly in intensity.
Notably, there are substantial divisions by political affiliation over whether government should play a role in reducing economic inequality. More than 8-in-10 (86%) Democrats and nearly two-thirds (65%) of independents say the government should do more to address the gap between the rich and poor, compared to 42% of Republicans and 44% of Americans who identify with the Tea Party. Majorities of Republicans (55%) and Tea Party members (52%) disagree.
With the exception of white evangelical Protestants, majorities of every religious group favor increased government action to reduce the gap between rich and poor. White evangelical Protestants are closely divided: Half (50%) agree, while 47% disagree.
Americans tend to believe that government should address economic inequality, but they are also skeptical about whether the government is run with the best interests of its citizens in mind. Only one-third (33%) of Americans believe that the government is really run for the benefit of all the people, while nearly two-thirds (64%) of Americans disagree.
Few issues engender such widespread agreement across the demographic, political and social spectrum. Views about whether government is serving the interest of all Americans do not differ substantially by age, gender, race, class, education, or by religious or political affiliation.
Business Corporations: Just Making Profits or Serving the Public Interest?
Most Americans (53%) do not believe that business corporations generally strike a fair balance between making profits and serving the public interest, while 41% believe that they do. Views on this question have been stable over the last few years. In 2011, 54% of Americans said that business corporations were not striking a balance between making profits and serving the public interest.
There is significant disagreement on this question according to party affiliation. A majority (53%) of Republicans and more than 6-in-10 (62%) Tea Party members agree that business corporations strike a fair balance between making profits and serving the public interest, compared to fewer than 4-in-10 independents (38%) and Democrats (38%). Nearly 6-in-10 Democrats (58%) and independents (58%) disagree, saying that business corporations do not balance these interests fairly. Attitudes about corporations’ efforts to balance profit and public service do not differ appreciably by age, gender, religious affiliation, class, or race.
There is even greater agreement among Americans that business corporations are not sharing enough of their success with their employees. Nearly 7-in-10 (69%) Americans say that businesses are not doing enough to share their success with workers, while 27% disagree.
These views cut across every major demographic, social, and political group, although there are some differences in intensity. Majorities of Democrats (82%), independents (69%), Republicans (56%) and members of the Tea Party (54%) agree that businesses are not sharing enough of their profits with their workers.
IV. Economic Policies
Best Approaches to Promoting Economic Growth
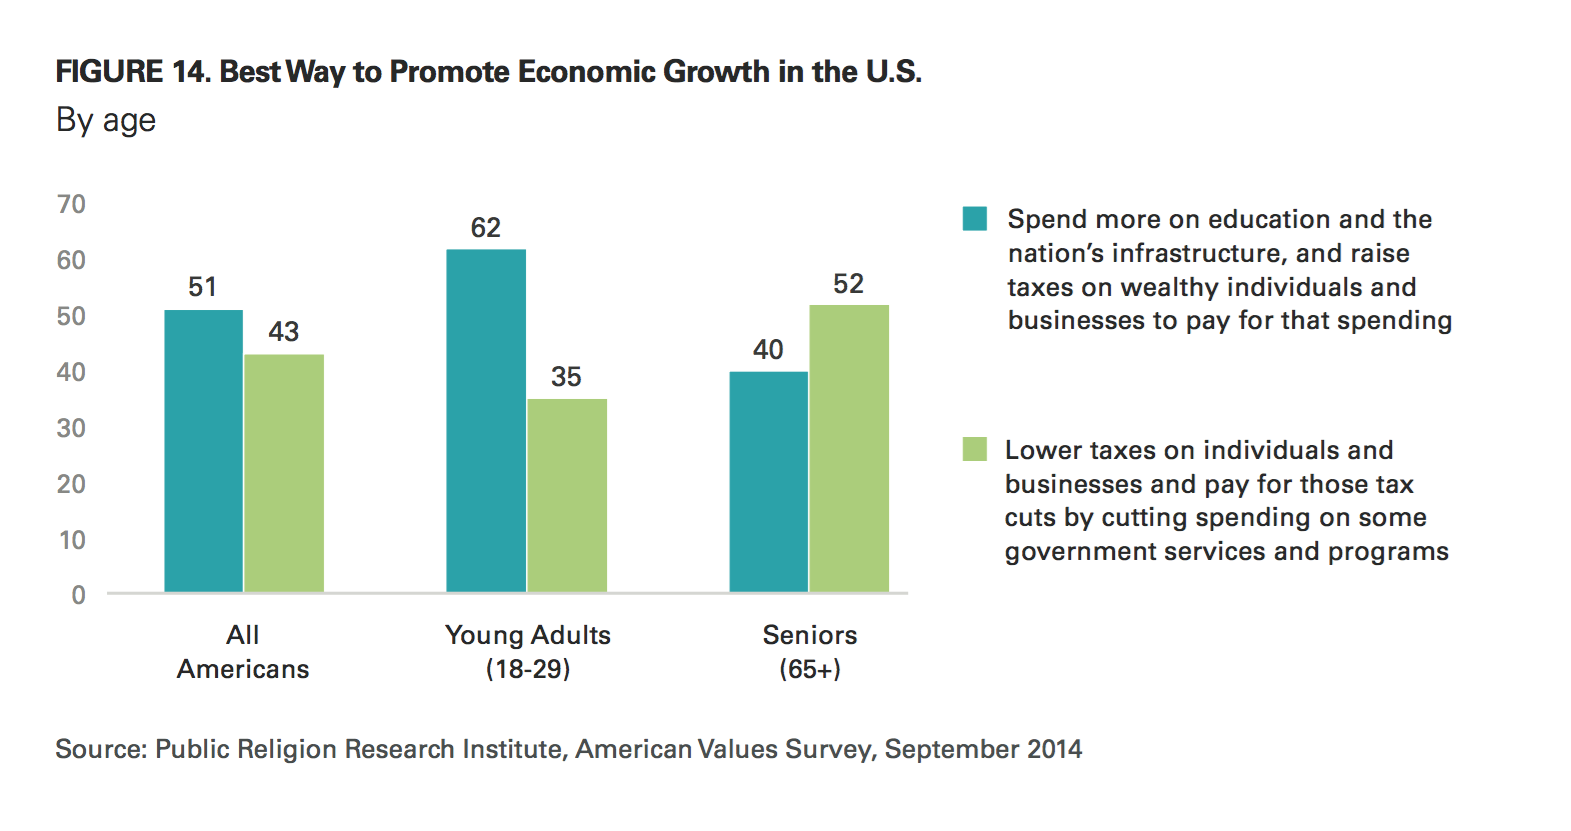
When asked about the best way to promote economic growth in the U.S., a slim majority (51%) of Americans favor a broad investment in infrastructure funded by higher taxes on high-income individuals and businesses over an approach that provides lower taxes coupled with cuts to government services and programs (43%).
Americans’ policy prescriptions for economic growth vary depending on their own level of economic security. More than 6-in-10 (63%) Americans who live in high insecurity households agree that the best way to promote economic growth is to spend more on education and the nation’s infrastructure, and raise taxes on wealthy individuals and businesses to pay for that spending. Meanwhile, Americans who live in households with no reported economic insecurity are evenly divided: 47% favor higher spending on education and the nation’s infrastructure, while 47% support lower taxes on individuals and businesses.
Perspectives on the best way to promote economic growth differ dramatically according to race. White Americans are almost equally divided on whether the best path to economic growth is spending more on education and the nation’s infrastructure (45%) or cutting programs while lowering taxes on individuals and businesses (49%). By contrast, nearly 7-in-10 (69%) black Americans agree that the best way to promote economic growth is to spend more on education and the nation’s infrastructure, while approximately one-quarter (27%) support lowering taxes on individuals and businesses. Similarly, roughly 6-in-10 Hispanic Americans (61%) and Asian Americans (57%) support greater investment in education and the nation’s infrastructure over cutting programs and lowering taxes.
Republicans (67%) and Americans who identify with the Tea Party (66%) are substantially more likely than independents (45%) and Democrats (23%) to favor lowering taxes on individuals and businesses and paying for those tax cuts by scaling back government services. Nearly three-quarters (72%) of Democrats and a slim majority (51%) of independents agree that the best way to promote economic growth is to spend more on education and the nation’s infrastructure and raise taxes on wealthy individuals and businesses to pay for that spending, compared to 29% of Americans who identify with the Tea Party and 27% of Republicans.
There is also a substantial generational divide on the best way to promote economic growth. More than 6-in-10 (62%) young adults agree that the best way to promote economic growth is to spend more on education and the nation’s infrastructure, compared to only 4-in-10 (40%) seniors. A majority (52%) of seniors disagree, saying that the best way to promote economic growth is to lower taxes on individuals and businesses.
Increasing Taxes on the Wealthy
Increasing taxes on wealthy Americans remains broadly popular among the public. A majority (57%) of Americans favor increasing the tax rate on Americans earning more than $250,000 a year, while 37% are opposed. In 2012, roughly 6-in-10 (61%) Americans expressed support for hiking the tax rate on Americans with incomes in excess of $250,000 a year.(17)
Americans are primarily divided on this question by party affiliation: Nearly 7-in-10 (69%) Democrats and 6-in-10 (60%) independents favor increasing the tax rate on Americans earning more than $250,000 a year, compared to approximately 4-in-10 Republicans (41%) and members of the Tea Party (40%). Majorities of Republicans (55%) and Americans who identify with the Tea Party (58%) oppose raising the tax rate on Americans earning more than $250,000 a year. There are few differences on this question by level of economic insecurity, race, class, generation, or gender.
Americans who say Fox News is their most trusted source of information about current events stand out as one of the few groups who oppose raising the tax rate on Americans earning more than $250,000 a year. Nearly 6-in-10 (57%) Fox News viewers oppose raising the tax rate on Americans earning more than $250,000 a year. Majorities of Americans who identify other networks as their most trusted media source support raising the tax rate on Americans earning more than $250,000 a year.
Workplace Policies: Paid Sick Leave, Maternity/Paternity Leave
Overall, Americans strongly support measures that would require companies to provide their employees with paid sick days and paid leave after the birth of a child. More than 8-in-10 (81%) Americans favor requiring companies to provide all full-time employees with paid sick days if they or an immediate family member gets sick. A similar number (78%) favor requiring companies to provide all full-time employees with paid leave for the birth or adoption of a child.
There are notable generational divisions on the issue of both paid sick days and paid parental leave. Nearly 9-in-10 young adults (age 18-29) support requiring companies to provide all full-time employees with paid sick days (86%) and paid leave for the birth or adoption of a child (87%). Majorities of seniors (age 65 and older) also favor requiring companies to provide full-time employees with paid sick days (68%) and paid parental leave (63%), but support is more muted.
There are, notably, few differences between men and women on the issue of paid parental leave. Men (74%) are only slightly less likely than women (82%) to agree that companies should be required to provide full-time employees with paid leave for the birth and adoption of a child.
There is a modest intensity gap between Democrats (90%), independents (82%), and Republicans (70%) on whether companies should be required to provide employees with paid sick days, although strong majorities of all three groups support such a requirement.
Majorities of all religious groups—including 90% of black Protestants, 85% of religiously unaffiliated Americans, 79% of white evangelical Protestants, 78% of Catholics, and 75% of white mainline Protestants—support requiring companies to provide employees with paid sick days.
Increasing the Minimum Wage
Increasing the minimum wage continues to experience broad support among the public. More than two-thirds (69%) of Americans favor increasing the minimum wage from $7.25 an hour to $10.10 an hour. Nearly 9-in-10 (87%) Democrats and two-thirds (67%) of independents favor an increase in the minimum wage, while Republicans are evenly divided (48% favor, 48% oppose). Americans who identify with the Tea Party are especially resistant to a minimum wage increase: Fewer than 4-in-10 (38%) Tea Party members support an increase in the minimum wage, while 6-in-10 (60%) are opposed. There is also an intensity gap by race, although majorities of black Americans (90%), Hispanics (83%), and white Americans (62%) favor raising the minimum wage from $7.25 an hour to $10.10 an hour.
There are only modest differences in intensity between Americans who live in households with high economic insecurity and Americans who live in households with no reported economic insecurity. Americans who live in high economic insecurity households are more likely than those who live in households with no reported economic insecurity to support raising the minimum wage (77% vs. 65%).
Majorities of all religious groups—including 89% of black Protestants, 77% of Catholics, 70% of religiously unaffiliated Americans, 58% of white mainline Protestants, and 56% of white evangelical Protestants—support raising the minimum wage from $7.25 an hour to $10.10 an hour.
Health Care: The Affordable Care Act
Americans are divided about what action they would like to see from Congress with regard to the Affordable Care Act. Given four alternatives, approximately one-quarter (24%) of Americans believe that Congress should expand the 2010 health care law; 16% say the law should be kept as is; 22% say the law should be repealed and replaced with a Republican alternative; and 25% say the law should be repealed and not replaced. Notably, more than 1-in-10 (13%) say they do not know what Congress should do about the law.
There are strong divisions on this question by political affiliation. Nearly 7-in-10 Democrats want to expand the law (41%) or keep it the way it is (28%). Fewer than 1-in-5 Democrats believe that the 2010 health care law should be repealed and replaced with a Republican alternative (6%) or repealed but not replaced (13%). By contrast, more than 8-in-10 Republicans say the 2010 health care law should be repealed and replaced with a Republican alternative (46%) or repealed but not replaced (38%). Fewer than 1-in-10 Republicans agree that the law should be kept as is (4%) or expanded (5%). A similar number of Americans who identify with the Tea Party believe the 2010 health care law should be repealed and replaced with a Republican alternative (37%) or repealed and not replaced (45%). The views of political independents closely track the general population.
Divisions on the future of the Affordable Care Act persist between racial and ethnic groups. Nearly two-thirds of black Americans agree that the 2010 law should either be expanded (40%) or kept as is (26%), while fewer than one-quarter say the law should be repealed and replaced with a Republican alternative (9%) or repealed and not replaced (15%). Similarly, nearly 6-in-10 Hispanics favor expanding the law (34%) or keeping it as is (23%), while fewer than 3-in-10 say the law should be repealed and replaced with a Republican alternative (17%) or repealed but not replaced (12%). By contrast, a majority of white Americans agree that the law should either be repealed and replaced with a Republican alternative (27%) or repealed and not replaced (29%). Less than one-third of white Americans say the law should either be expanded (19%) or kept as is (12%).
When asked about the fate of the 2010 health care law, religious groups are largely divided by race. Nearly two-thirds of black Protestants agree that the health care law should either be expanded (41%) or kept as is (25%). Catholics and religiously unaffiliated Americans are, like the general population, divided. A majority of white mainline Protestants say the law should be repealed and replaced with a Republican alternative (27%) or repealed and not replaced (28%).
More than 7-in-10 white evangelical Protestants favor either repealing and replacing the law with a Republican alternative (37%) or repealing it without replacing it (35%). There are few differences on this question according to Americans’ level of economic insecurity. Americans who live in households with very high economic insecurity and very low economic insecurity mirror the general population.
There are few differences by generation or gender on this question. However, Millennial women (age 18-34) are substantially more likely than Millennial men to favor expanding the health care law or keeping it as is. Nearly half of Millennial women say the law should either be expanded (26%) or kept as is (23%), compared to approximately one-third of Millennial men (20% and 15%, respectively).
V. Racial Inequality
Government Attention to Racial Minorities
Less than 4-in-10 (38%) Americans believe that the government has paid too much attention to the problems of black Americans and other minorities over the past couple of decades, while a majority (56%) disagree. Views have not shifted significantly on this question over the past few years. In 2010, 37% of the public said that the government had been paying too much attention to the problems of black Americans and other minorities over the past couple decades.(18)
There are strong divisions on this question according to political affiliation. A majority (52%) of Republicans and 6-in-10 (60%) Americans who identify with the Tea Party agree that over the past couple decades the government has paid too much attention to the problems of black Americans and other minorities, compared to 40% of independents and 27% of Democrats. More than two-thirds (68%) of Democrats and a majority (57%) of independents do not believe that the government has paid too much attention to the problems of black Americans and other minorities.
Racial differences are more modest. Black Americans (68%) are somewhat more likely than Hispanic Americans (60%) and white Americans (54%) to disagree that the government has paid too much attention to the problems of black Americans and other minorities over the past couple of decades.
There are notable divisions among white Americans about whether the government has paid too much attention to the problems of black Americans and other minorities. Fewer than one-third (30%) of white college-educated Americans believe that the government has paid too much attention to the problems of black Americans and other minorities over the past couple of decades. By contrast, white working-class Americans are nearly evenly divided: almost half (48%) say the government has paid too much attention to the problems of black Americans and other minorities, while 46% disagree. There are also further divisions among white working-class Americans by generation. A majority (56%) of white working-class Americans who are part of the Silent Generation (age 69 and older) say that the government has paid too much attention to the problems of black Americans and other minorities over the past couple of decades, compared to 43% of white working-class Millennials (age 18-34).
Treatment of Racial Minorities in the Justice System
Over the last year, Americans’ confidence that racial and ethnic minorities receive equal treatment in the criminal justice system has dropped significantly. Today, fewer than 4-in-10 (38%) Americans believe that black Americans receive equal treatment in the criminal justice system compared to white Americans, while a majority (56%) of Americans disagree. Just one year ago, the public was evenly divided, with nearly half (47%) the public agreeing that black Americans and other minorities generally receive treatment equal to white Americans in the criminal justice system, and 47% disagreeing.(19)
There are substantial divisions among political groups about the fairness of the criminal justice system. Majorities of Republicans (57%) and Americans who identify with the Tea Party (58%) believe that black Americans and other minorities are as likely as whites to receive equal treatment in the criminal justice system. Fewer than 4-in-10 (36%) of independents and only one-quarter (25%) of Democrats agree. Nearly 7-in-10 (69%) Democrats and a majority (58%) of independents disagree, saying that black Americans and other minorities do not receive treatment equal to white Americans in the criminal justice system.
There are also noteworthy differences between racial and ethnic groups. More than 8-in-10 (84%) black Americans say that black Americans and other minorities do not receive equal treatment in the criminal justice system compared to white Americans, while 6-in-10 (60%) Hispanics and a slim majority (51%) of white Americans.
White Americans are divided by social class and age on this question. More than 6-in-10 (62%) white college-educated Americans do not believe that black Americans and other minorities receive treatment equal to white Americans in the criminal justice system, compared to 45% of white working-class Americans; half (50%) of white working-class Americans believe that black Americans and other minorities receive equal treatment in the criminal justice system. White members of the Silent Generation (age 69 and older) are also more likely than white Millennials (age 18-34) to agree that black Americans and other minorities receive treatment equal to white Americans in the criminal justice system (57% vs. 38%). Nearly 6-in-10 (59%) white Millennials disagree that black Americans and other minorities receive equal treatment in the criminal justice system.
More than 8-in-10 (84%) black Protestants, two-thirds (66%) of religiously unaffiliated Americans, and a slim majority (53%) of Catholics disagree that black Americans and other minorities receive equal treatment in the criminal justice system compared to white Americans. White mainline Protestants are divided (48% agree, 46% disagree) about whether black Americans and other minorities are treated equitably in the criminal justice system, while a slim majority (52%) of white evangelical Protestants believe that black Americans and other minorities receive treatment equal to white Americans in the criminal justice system, while 43% disagree.
Perceptions of “Reverse Discrimination,” Discrimination Against White Americans
Americans are divided on the question of so-called “reverse discrimination.” Forty-five percent of Americans believe that, today, discrimination against white Americans has become as big a problem as discrimination against black Americans and other minorities, compared to 51% who disagree. Belief about discrimination against white Americans has remained roughly constant over the past four years. In 2010, 44% agreed that discrimination against white Americans had become as big a problem as discrimination against black Americans and other minorities.(20)
More than 6-in-10 (61%) Republicans and nearly three-quarters (73%) of Tea Party members agree that discrimination against white Americans has become as big a problem today as discrimination against black Americans and other minorities. By contrast, only about one-third (32%) of Democrats and less than half (47%) independents agree that discrimination against white Americans has become as big a problem today as discrimination against black Americans and other minorities. Nearly two-thirds (64%) of Democrats disagree.
A majority (52%) of white Americans agree that discrimination against white Americans has come as big a problem as discrimination against black Americans and other minorities, compared to 35% of Hispanics and 29% of black Americans. By contrast, 7-in-10 (70%) black Americans and nearly 6-in-10 (59%) Hispanics disagree that discrimination against white Americans has become a big a problem as discrimination against black Americans and other minorities.
There are however, notable generational divisions among white Americans. Fewer than half (45%) of white Millennials (age 18-34) believe that discrimination against white Americans now rivals the problem of discrimination against other racial minority groups. Among older white Americans who are members of the Silent Generation (age 69 and older), nearly 6-in-10 (59%) say discrimination against white Americans is as big a problem as discrimination against other minority groups.
There are striking divisions on this question among white Americans from different class backgrounds. Nearly 6-in-10 (58%) of white working-class Americans agree that discrimination against white Americans has become as big a problem today as discrimination against black Americans and other minorities, compared to 37% of white college-educated Americans. More than 6-in-10 (61%) white college-educated Americans disagree.
Americans from different religious backgrounds vary in the extent to which they believe white Americans are being affected by reverse discrimination. More than 6-in-10 (63%) white evangelical Protestants, a majority (56%) of white Catholics and nearly half (49%) of white mainline Protestants agree that discrimination against white Americans has become as big a problem as discrimination against black Americans and other minorities. In contrast, only 25% of black Protestants and 37% of religiously unaffiliated Americans believe that discrimination against white Americans has become as big a problem as discrimination against other groups. Nearly three-quarters (74%) of black Protestants, and 6-in-10 (60%) religiously unaffiliated Americans disagree.
VI. Worries about Religion in Public Life
The last few years have seen a number of legal and cultural skirmishes over the twin First Amendment principles of religious liberty and separation of church and state. Today, Americans are evenly divided about whether they are more worried about government intrusion into religious life or religious intrusion into the public square. Nearly half (46%) of Americans say they are more concerned about the government interfering with the ability of people to freely practice their religion, while an equal number (46%) say they are more concerned about religious groups trying to pass laws that force their beliefs on others.
However, there are strong partisan divides. Approximately two-thirds of Americans who identify with the Tea Party (66%) and Republicans (64%) say they are more concerned about government interference with the ability of people to freely practice their religion. Nearly 6-in-10 (59%) Democrats, meanwhile, say they are more concerned about religious groups trying to pass laws that force their beliefs on others. Independents, like the general population, are divided: 44% say they’re more concerned about government infringement on people’s religious practices and 48% say they’re more concerned about religious groups trying to pass laws that force their beliefs on others.
There is also a notable generation gap with this question. Young adults (age 18-29) are somewhat more concerned about religious groups trying to pass laws that force their beliefs on others (52%) than they are about the government interfering with the ability of people to freely practice their religion (43%). By contrast, seniors (age 65 and older) are more concerned about the government interfering with people’s ability to practice their religion (52%) than they are about religious groups trying to pass laws that force their beliefs on others (38%). There are few divisions on this question by race or class.
Religious groups vary in their level of concern about each of these issues. White evangelical Protestants (66%) and Hispanic Protestants (57%) are more concerned about the government interfering with the ability of people to freely practice their religion. By contrast, religiously unaffiliated Americans (63%) and Jewish Americans (64%) report more concern about religious groups trying to pass laws that force their beliefs on others.
There is less consensus among other religious groups. White mainline Protestants are nearly evenly divided: 46% report more concern about the government interfering with people’s ability to freely practice their religion, while 45% say they are more concerned about religious groups trying to pass laws that force their beliefs on others. A slim majority (51%) of Catholics say they are more concerned about religious groups trying to force their beliefs on others, although 42% say they are more concerned about the government interfering with people’s ability to freely practice their religion. Although black Protestants are also divided, they are more concerned about religious groups trying to force their beliefs on others (48%) than they are about government interfering with people’s ability to freely practice their religion (40%).
There are also striking gaps between Catholic subgroups. Catholic Millennials (age 18-34) are more concerned about religious groups trying to pass laws that force their beliefs on others (58%) than they are about the government interfering with people’s ability to practice their religion (36%). Catholic members of the Silent Generation (age 69 and older), by contrast, are more concerned about the government interference with people’s religious practice (55%) than they are about religious groups attempting to pass laws that impose their beliefs on others (36%). Catholic women are also more worried about religious groups attempting to pass laws that impose their beliefs on others (55%) than they are about the government interfering with people’s ability to practice their religion (38%). Catholic men are nearly evenly divided, with 47% expressing more concern about government interfering with people’s ability to practice their religion and 46% expressing more concern about religious groups attempting to pass laws that impose their beliefs on others. There are also important differences among Catholics by ethnicity. White Catholics are divided over what is of greater concern—religious groups forcing their belief on others (50%) or government intrusion (46%). Hispanic Catholics, by contrast, express more concern about religious groups trying to impose their beliefs (53%) than about government interference in religion (36%).
Endnotes
1 Throughout this report, the term “white Americans” refers to white, non-Hispanic Americans.
2 For more information about the definition of the white working-class see PRRI’s report “Beyond Guns and God: Understanding the Complexities of the White Working Class in America.”
3 Public Religion Research Institute, American Values Survey, October 2012.
4 The question about receiving a promotion or raise at the job was not included in the scale.
5 The Cronbach’s Alpha for the scale is .705, indicating a good fit of items in the scale.
6 Bureau of Labor Statistics, http://data.bls.gov/timeseries/LNS14000000.
7 PRRI/Brookings, Economic Values Survey, July 2013.
8 Public Religion Research Institute, American Values Survey, October 2010.
9 Bureau of Labor Statistics. “The Recession of 2007-2009.” BLS Spotlight on Statistics. February 2012.
10 ABC News/Washington Post Poll, April 2012.
11 The field dates for the American Values Survey were July 21 – August 15, 2014.
12 Public Religion Research Institute, American Values Survey, October 2010.
13 CNN/Opinion Research Corporation Poll, September 2010.
14 For an in-depth look at the demographic makeup of the Tea Party, see PRRI’s 2010 American Values Survey: http://publicreligion.org/research/2010/10/religion-tea-party-2010/.
15 Public Religion Research Institute, American Values Survey, October 2010.
16 Public Religion Research Institute, American Values Survey, September 2010.
17 Public Religion Research Institute, American Values Survey, October 2012.
18 Public Religion Research Institute, American Values Survey, October 2010.
19 Public Religion Research Institute, Religion & Politics Tracking Survey, August 2013.
20 Public Religion Research Institute, Post-Election American Values Survey, November 2010.
21 Telephone usage refers to whether respondents have only a landline telephone, only a cell phone or both types.
Recommended citation:
Jones, Robert P., Daniel Cox, and Juhem Navarro-Rivera. “Economic Insecurity, Rising Inequality, and Doubts about the Future: Findings from the 2014 American Values Survey.” PRRI. 2014. http://www.prri.org/research/survey-economic-insecurity-rising-inequality-and-doubts-about-the-future-findings-from-the-2014-american-values-survey/.


