

Executive Summary
Health Care, Terrorism, and Jobs Most Critical Issues
When asked what issues are most important to them personally, Americans are more likely to cite health care (63%), terrorism (62%), and jobs and unemployment (60%) than any other issue. A majority (53%) of Americans report that crime is a critical issue to them personally. Slightly fewer say the cost of education (49%), economic inequality (48%), and immigration (46%) are critical issues. Fewer Americans say that race relations (39%), climate change (34%), abortion (34%), religious liberty (31%), and same-sex marriage (25%) are critical issues.
Strong majorities of both Democrats and Republicans name health care (71% and 61%, respectively) and jobs and unemployment (66% and 59%, respectively) as critical issues. However, Democrats are more likely than Republicans to name the cost of education (62% vs. 33% respectively) and the growing gap between the rich and the poor (62% vs. 29%, respectively) as critical issues. Republicans are more likely than Democrats to name terrorism (79% vs. 53%, respectively) and immigration (59% vs. 43%, respectively) as critical issues.
However, even among Republicans, the importance of immigration varies. On no issue do the supporters of Republican presidential hopeful Donald Trump differ more from those supporting other Republican candidates than on the issue of immigration. Nearly seven in ten (69%) Trump supporters say that immigration is a critical issue to them personally. In contrast, only half (50%) of those who support other Republican candidates say that the issue of immigration is critically important to them.
The Bush/Clinton Dynasty Dilemma
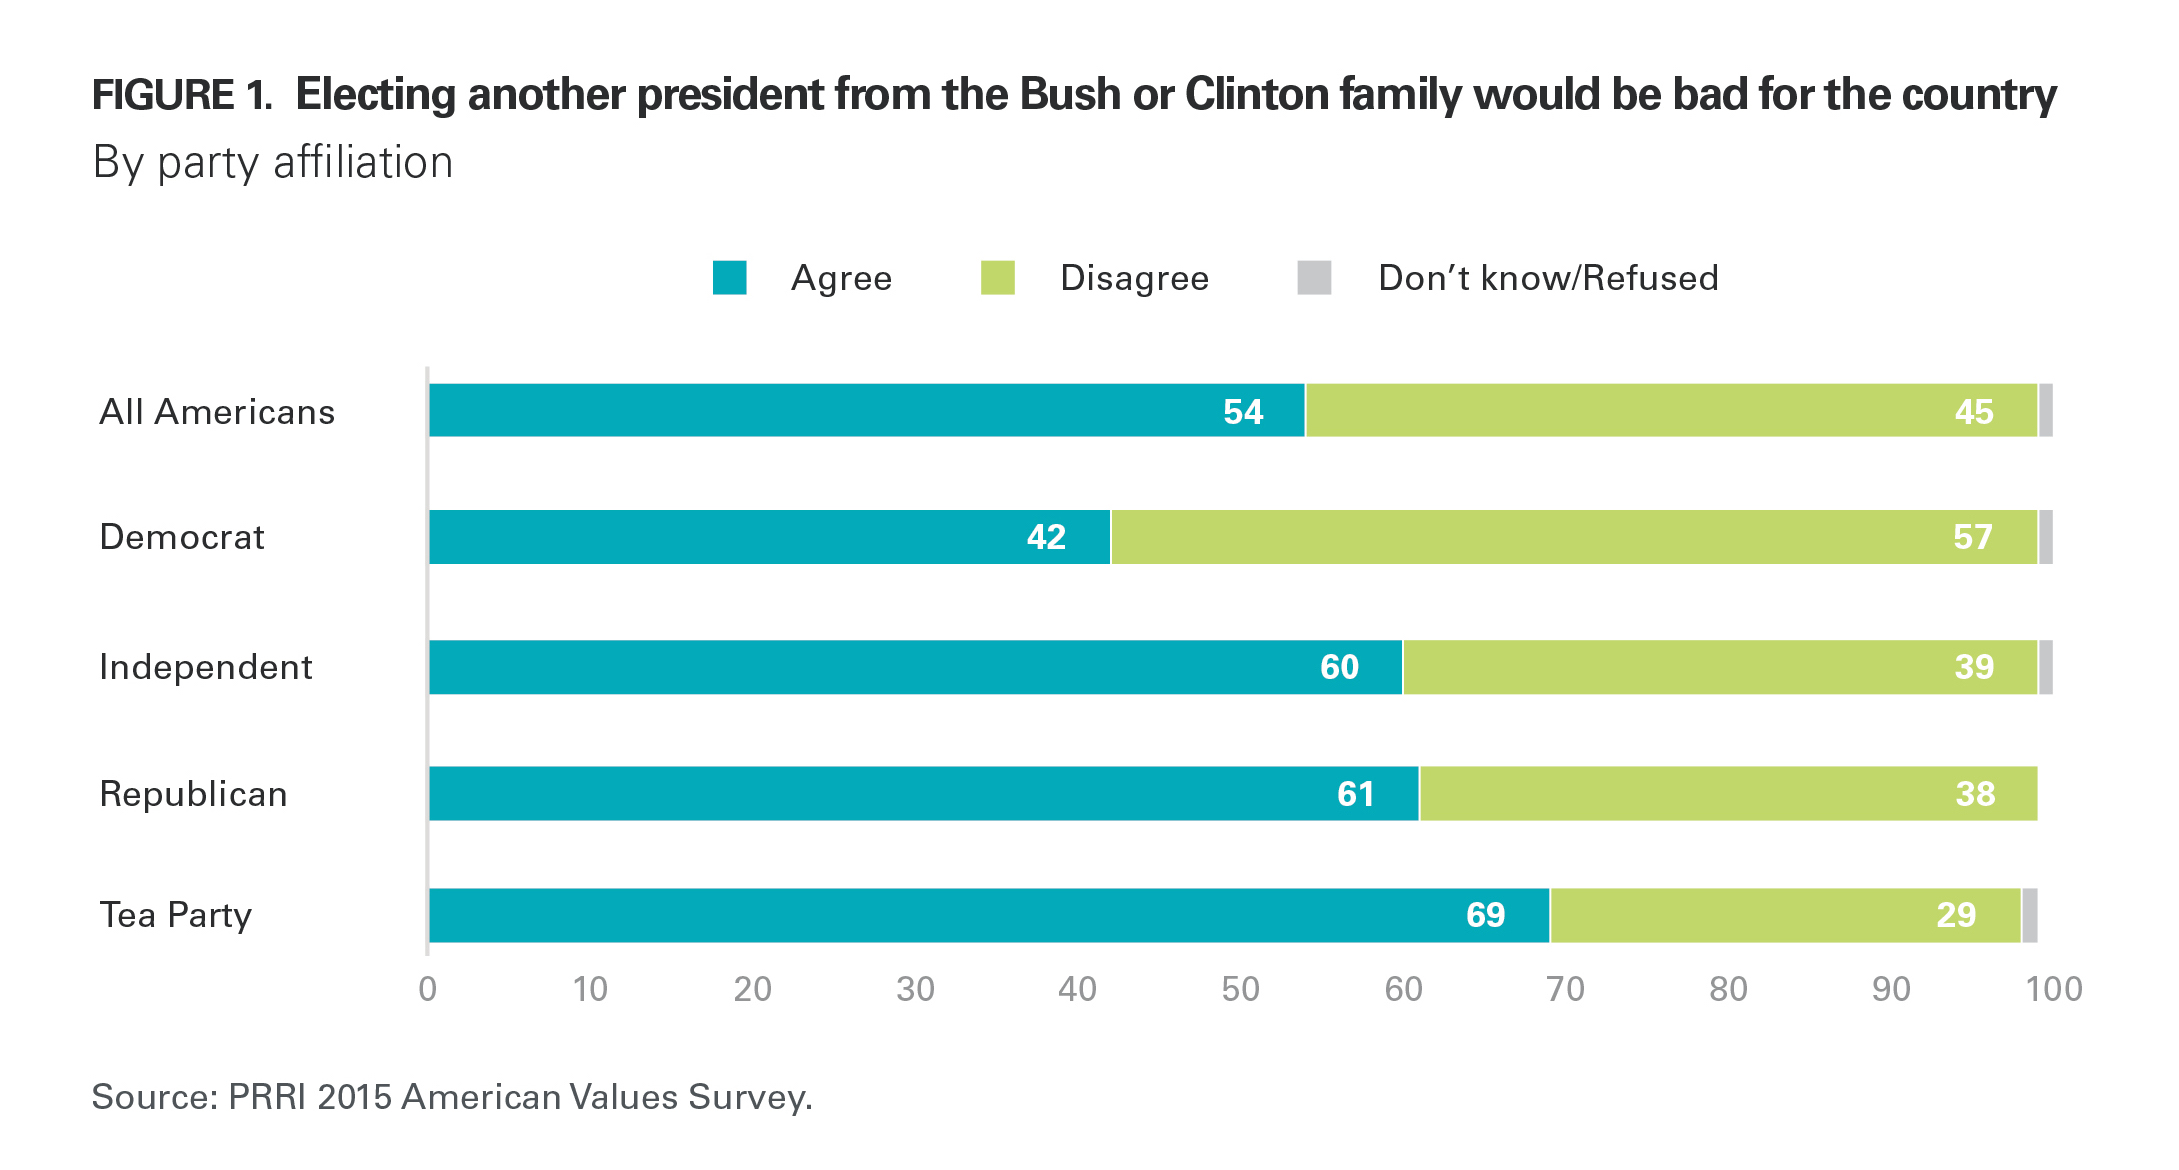
Although Jeb Bush and Hillary Clinton each entered the 2016 campaign with considerable assets, their famous last names may not be among them. Most (54%) Americans say that electing another president from the “Bush” or “Clinton” family would be bad for the country, while 45% disagree. The dynasty dilemma is a bigger problem for Bush than for Clinton. More than six in ten (61%) Republicans—including 64% of likely Republican primary voters—and nearly seven in ten (69%) Tea Party members say that electing another Bush or Clinton would be bad for the country, compared to 42% of Democrats overall and 39% of likely Democratic primary voters.
The Declining Tea Party Movement
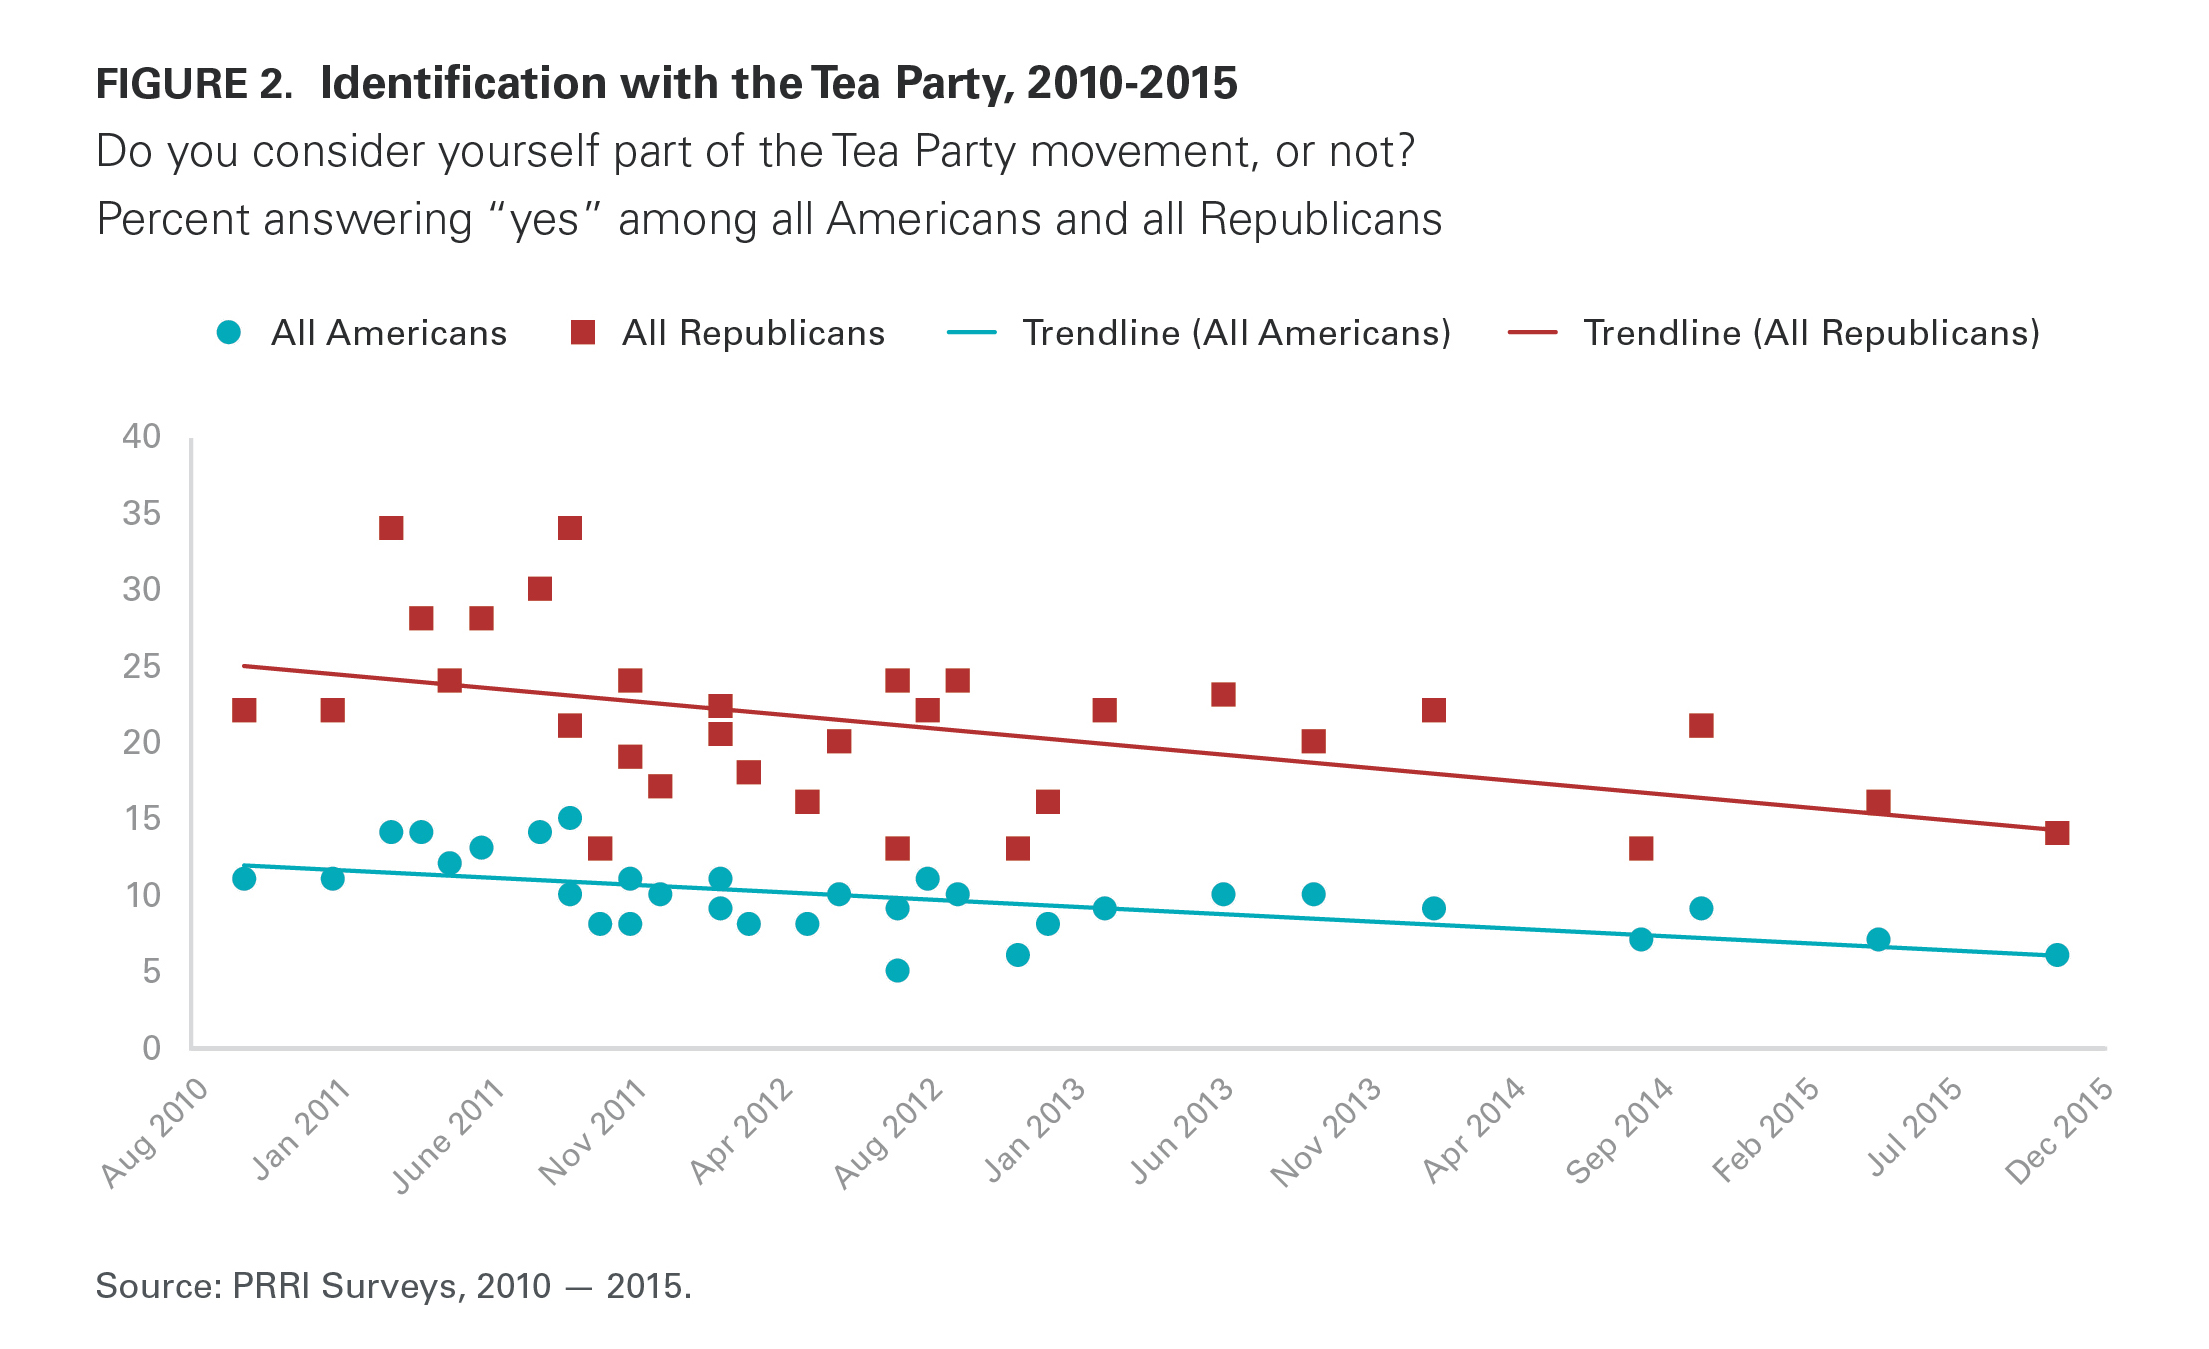
The proportion of Americans who identify with the Tea Party movement has declined by nearly half over the last five years, from 11% in 2010 to 6% today. Tea Party affiliation has also dropped among Republicans, from 22% in 2010 to 14% today. Favorable views of the Tea Party have dropped 10 percentage points over the last year, from 35% in 2014 to 25% today. A majority (57%) of Americans currently hold an unfavorable view of the group, up from 46% last year. The decline of Tea Party favorability is pronounced among Republicans (58% in 2014 vs. 45% today), independents (35% in 2014 vs. 27% today), and Democrats (18% in 2014 vs. 12% today).
Americans’ Gloomy Economic Outlook Persists
Americans continue to have a bleak outlook about the economy. More than seven in ten (72%) Americans believe that the country is still in a recession, while roughly one-quarter (27%) believe the economic recession is over. Americans’ views about the economic recession have remained steady over the last few years, with an identical percentage (72%) of Americans saying the country was still in a recession in 2014, and 76% saying the country was still in a recession in 2012.

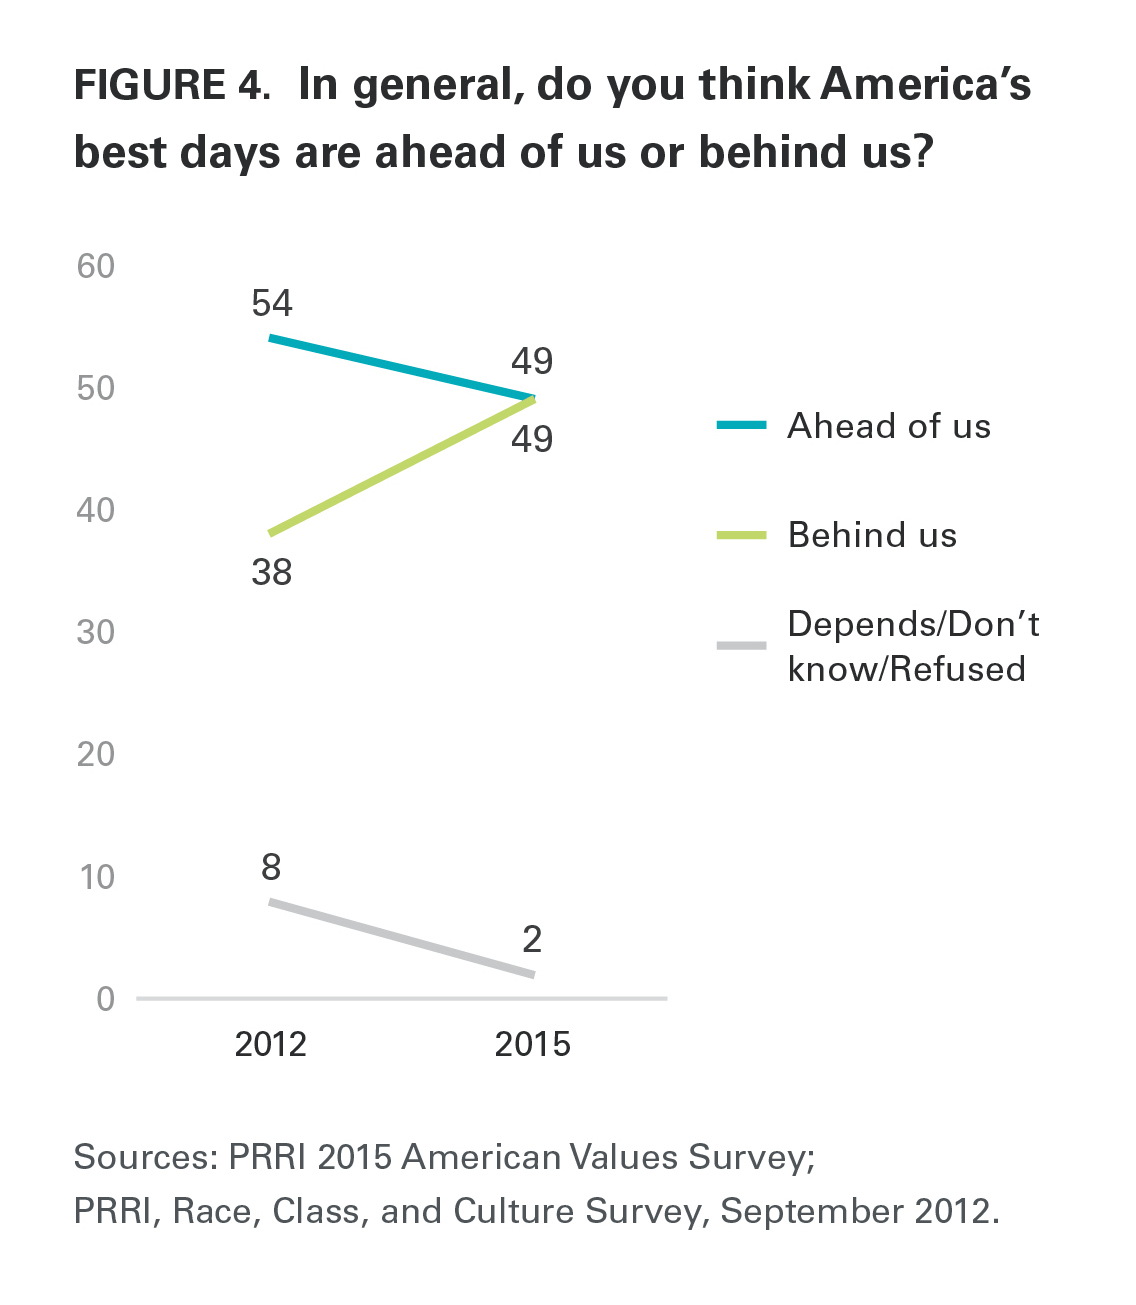
Americans have become more pessimistic about the country’s future than they were just a few years earlier. Today, Americans are evenly divided over whether America’s best days are ahead of us (49%) or behind us (49%). In 2012, a majority (54%) of the public said that America’s best days were ahead, while fewer than four in ten (38%) said that they were behind. No group expresses greater pessimism about America’s future than members of the Tea Party. Only one-third (33%) of Tea Party members say that the country’s best days lie ahead, while about two-thirds (65%) say they are in the past.
Perceptions about America’s future vary by religious affiliation. Among religious groups, white evangelical Protestants and white mainline Protestants are markedly more pessimistic than other groups, with majorities believing that America’s best days are behind us (60% and 55%, respectively). By contrast, majorities of Americans who are affiliated with non-Christian religions (55%), Catholics (56%), black Protestants (57%), and religiously unaffiliated Americans (58%) all believe America’s best days are ahead of us.
Americans’ increasing pessimism about the direction of the country is reflected in their views about prevalent problems within their local communities. The number of Americans citing crime, racial tensions, and illegal immigration as major problems increased substantially between 2012 and 2015.
The number of Americans saying crime is a major problem in their community jumped 15 percentage points (up from 33% to 48%), while the number of Americans saying racial tensions are a major concern jumped 18 percentage points (from 17% to 35%).
The number of Americans saying illegal immigration is a major problem ticked up 8 percentage points (from 28% to 36%).
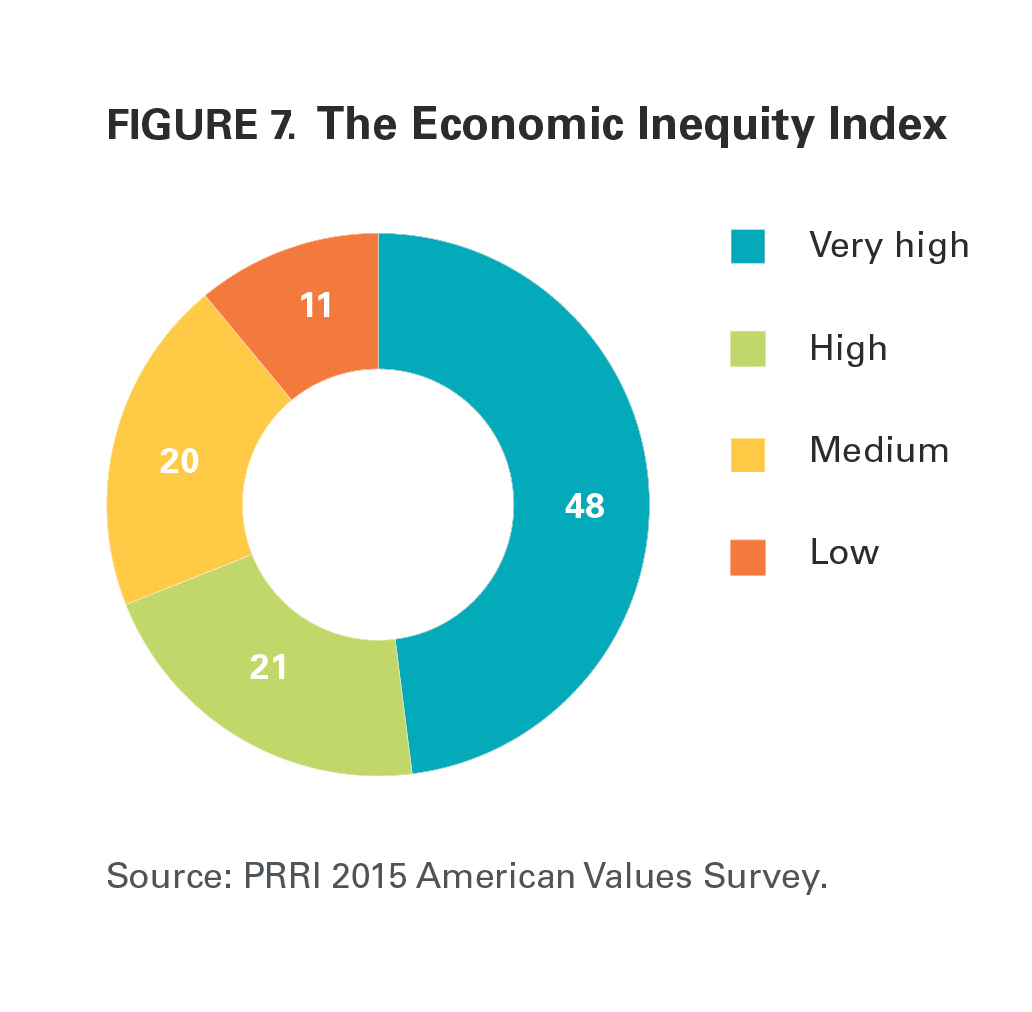
In order to provide an overall measure of Americans’ attitudes about the fairness of the economic system in the U.S., we created an Economic Inequity Index (EII). Americans are skewed toward the top end of the scale. Nearly half (48%) of Americans perceive a great amount of inequity in the economic system, scoring very high on the EII. About one in five (21%) see a high amount of economic inequity, 20% see a moderate amount of economic inequity, and 11% perceive the economic playing field to be basically level, scoring low on the EII.
Continued Strong Support for Minimum Wage and Workplace Policies
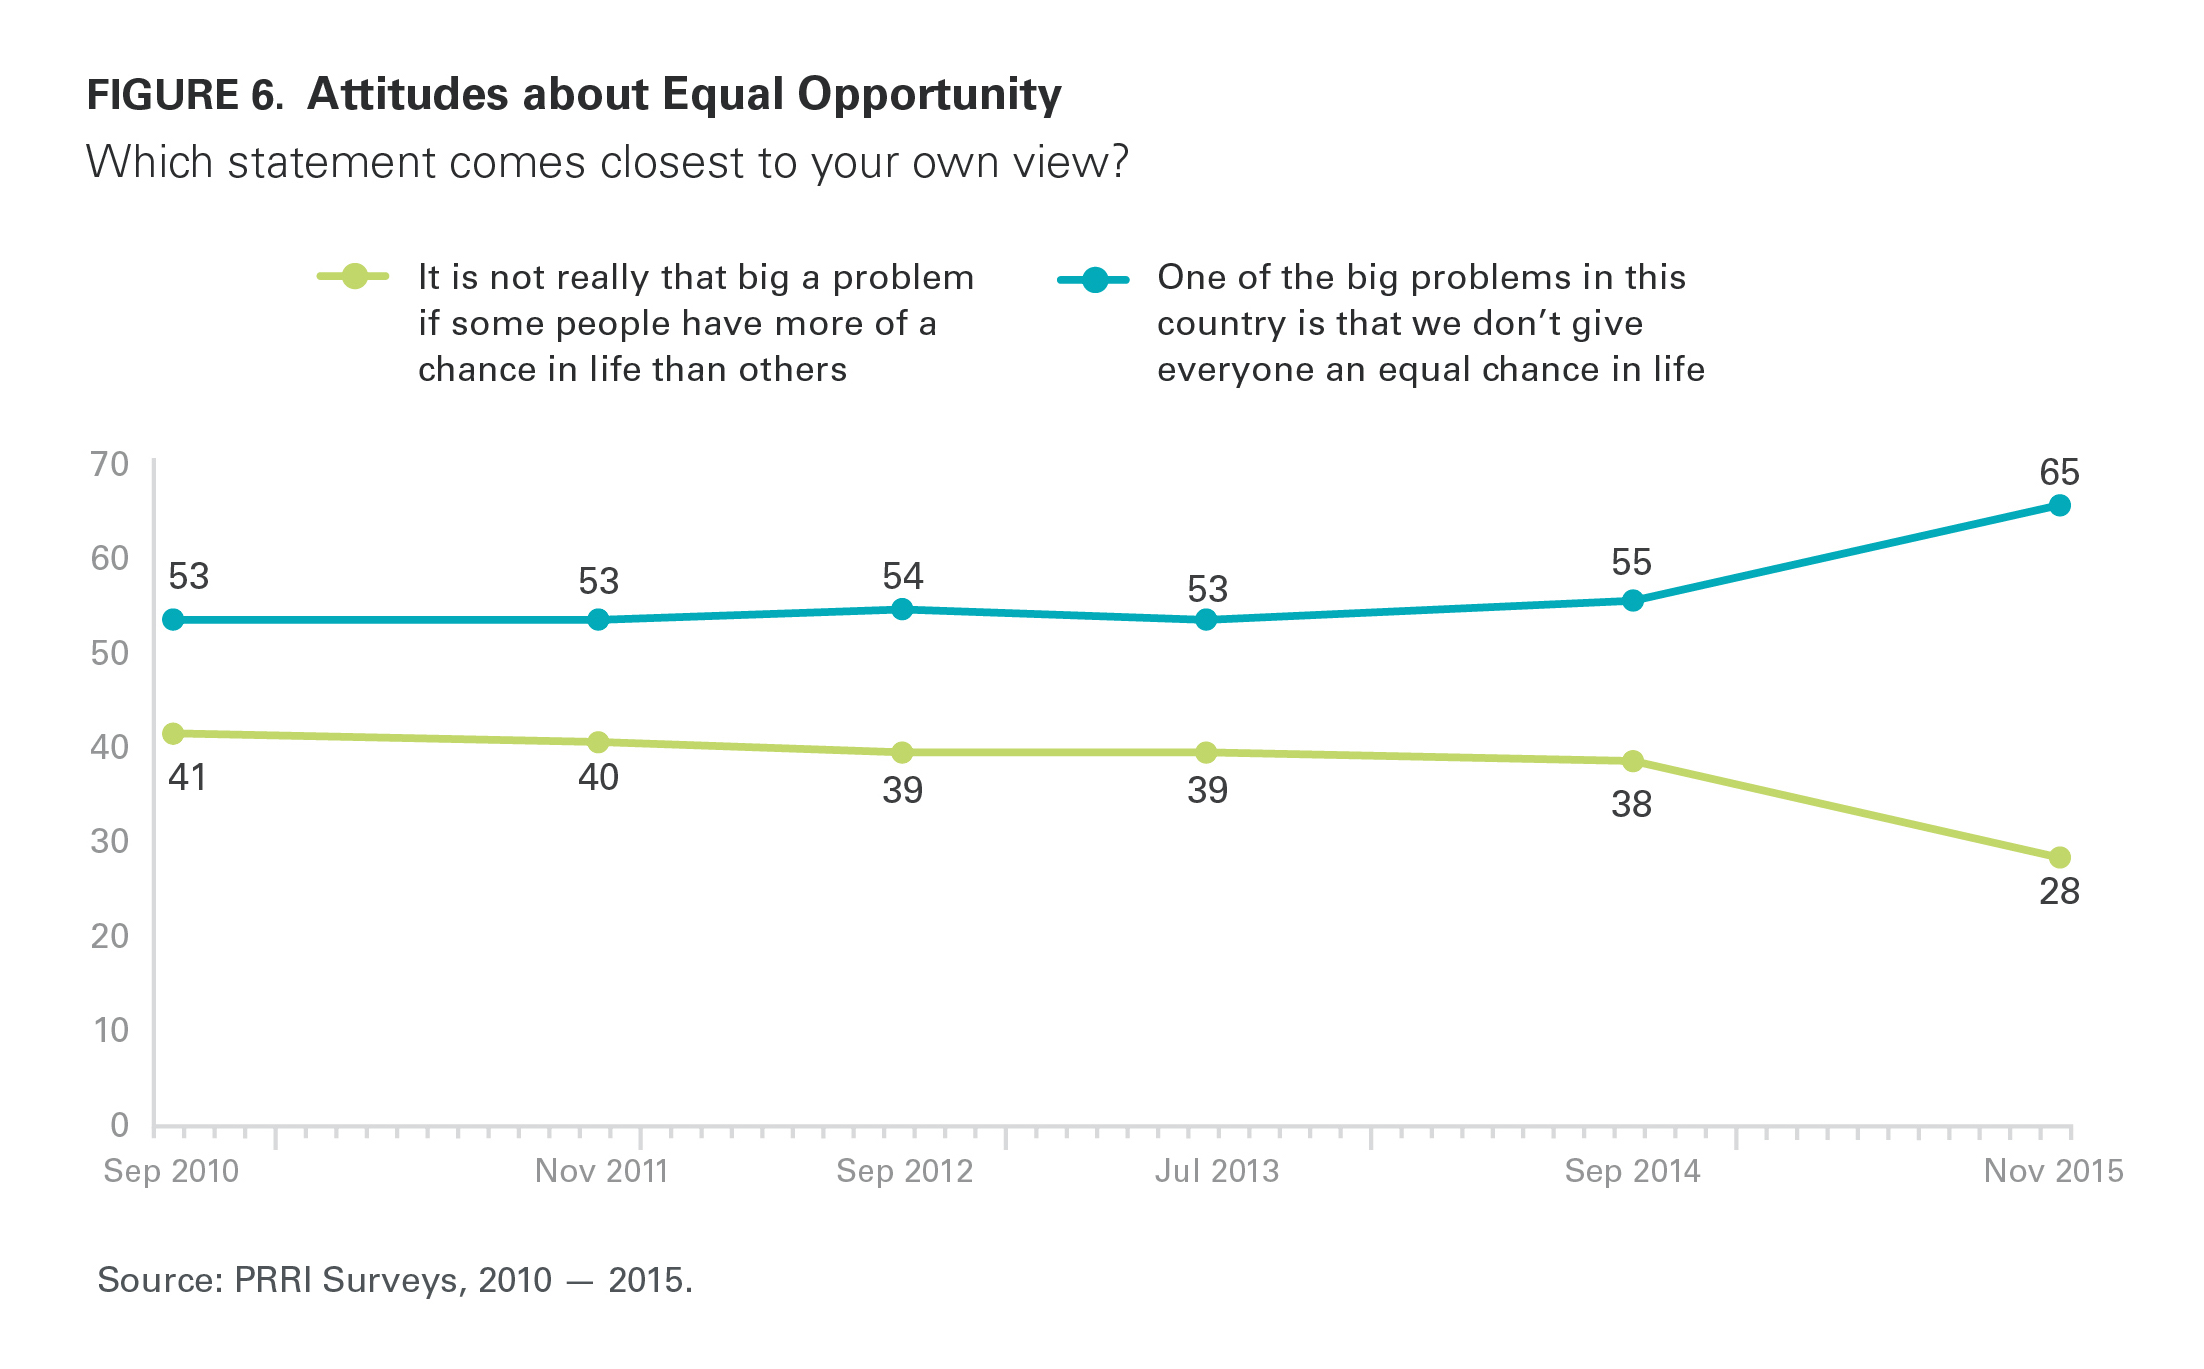
Nearly two-thirds (65%) of Americans believe that “one of the big problems in this country is that we don’t give everyone an equal chance in life,” while fewer than three in ten (28%) believe that “it is not really that big a problem if some people have more of a chance in life than others.” Concerns about the lack of equal opportunity have increased considerably since 2010, when 53% said that one of the big problems in the U.S. was the lack of equal opportunities for all.
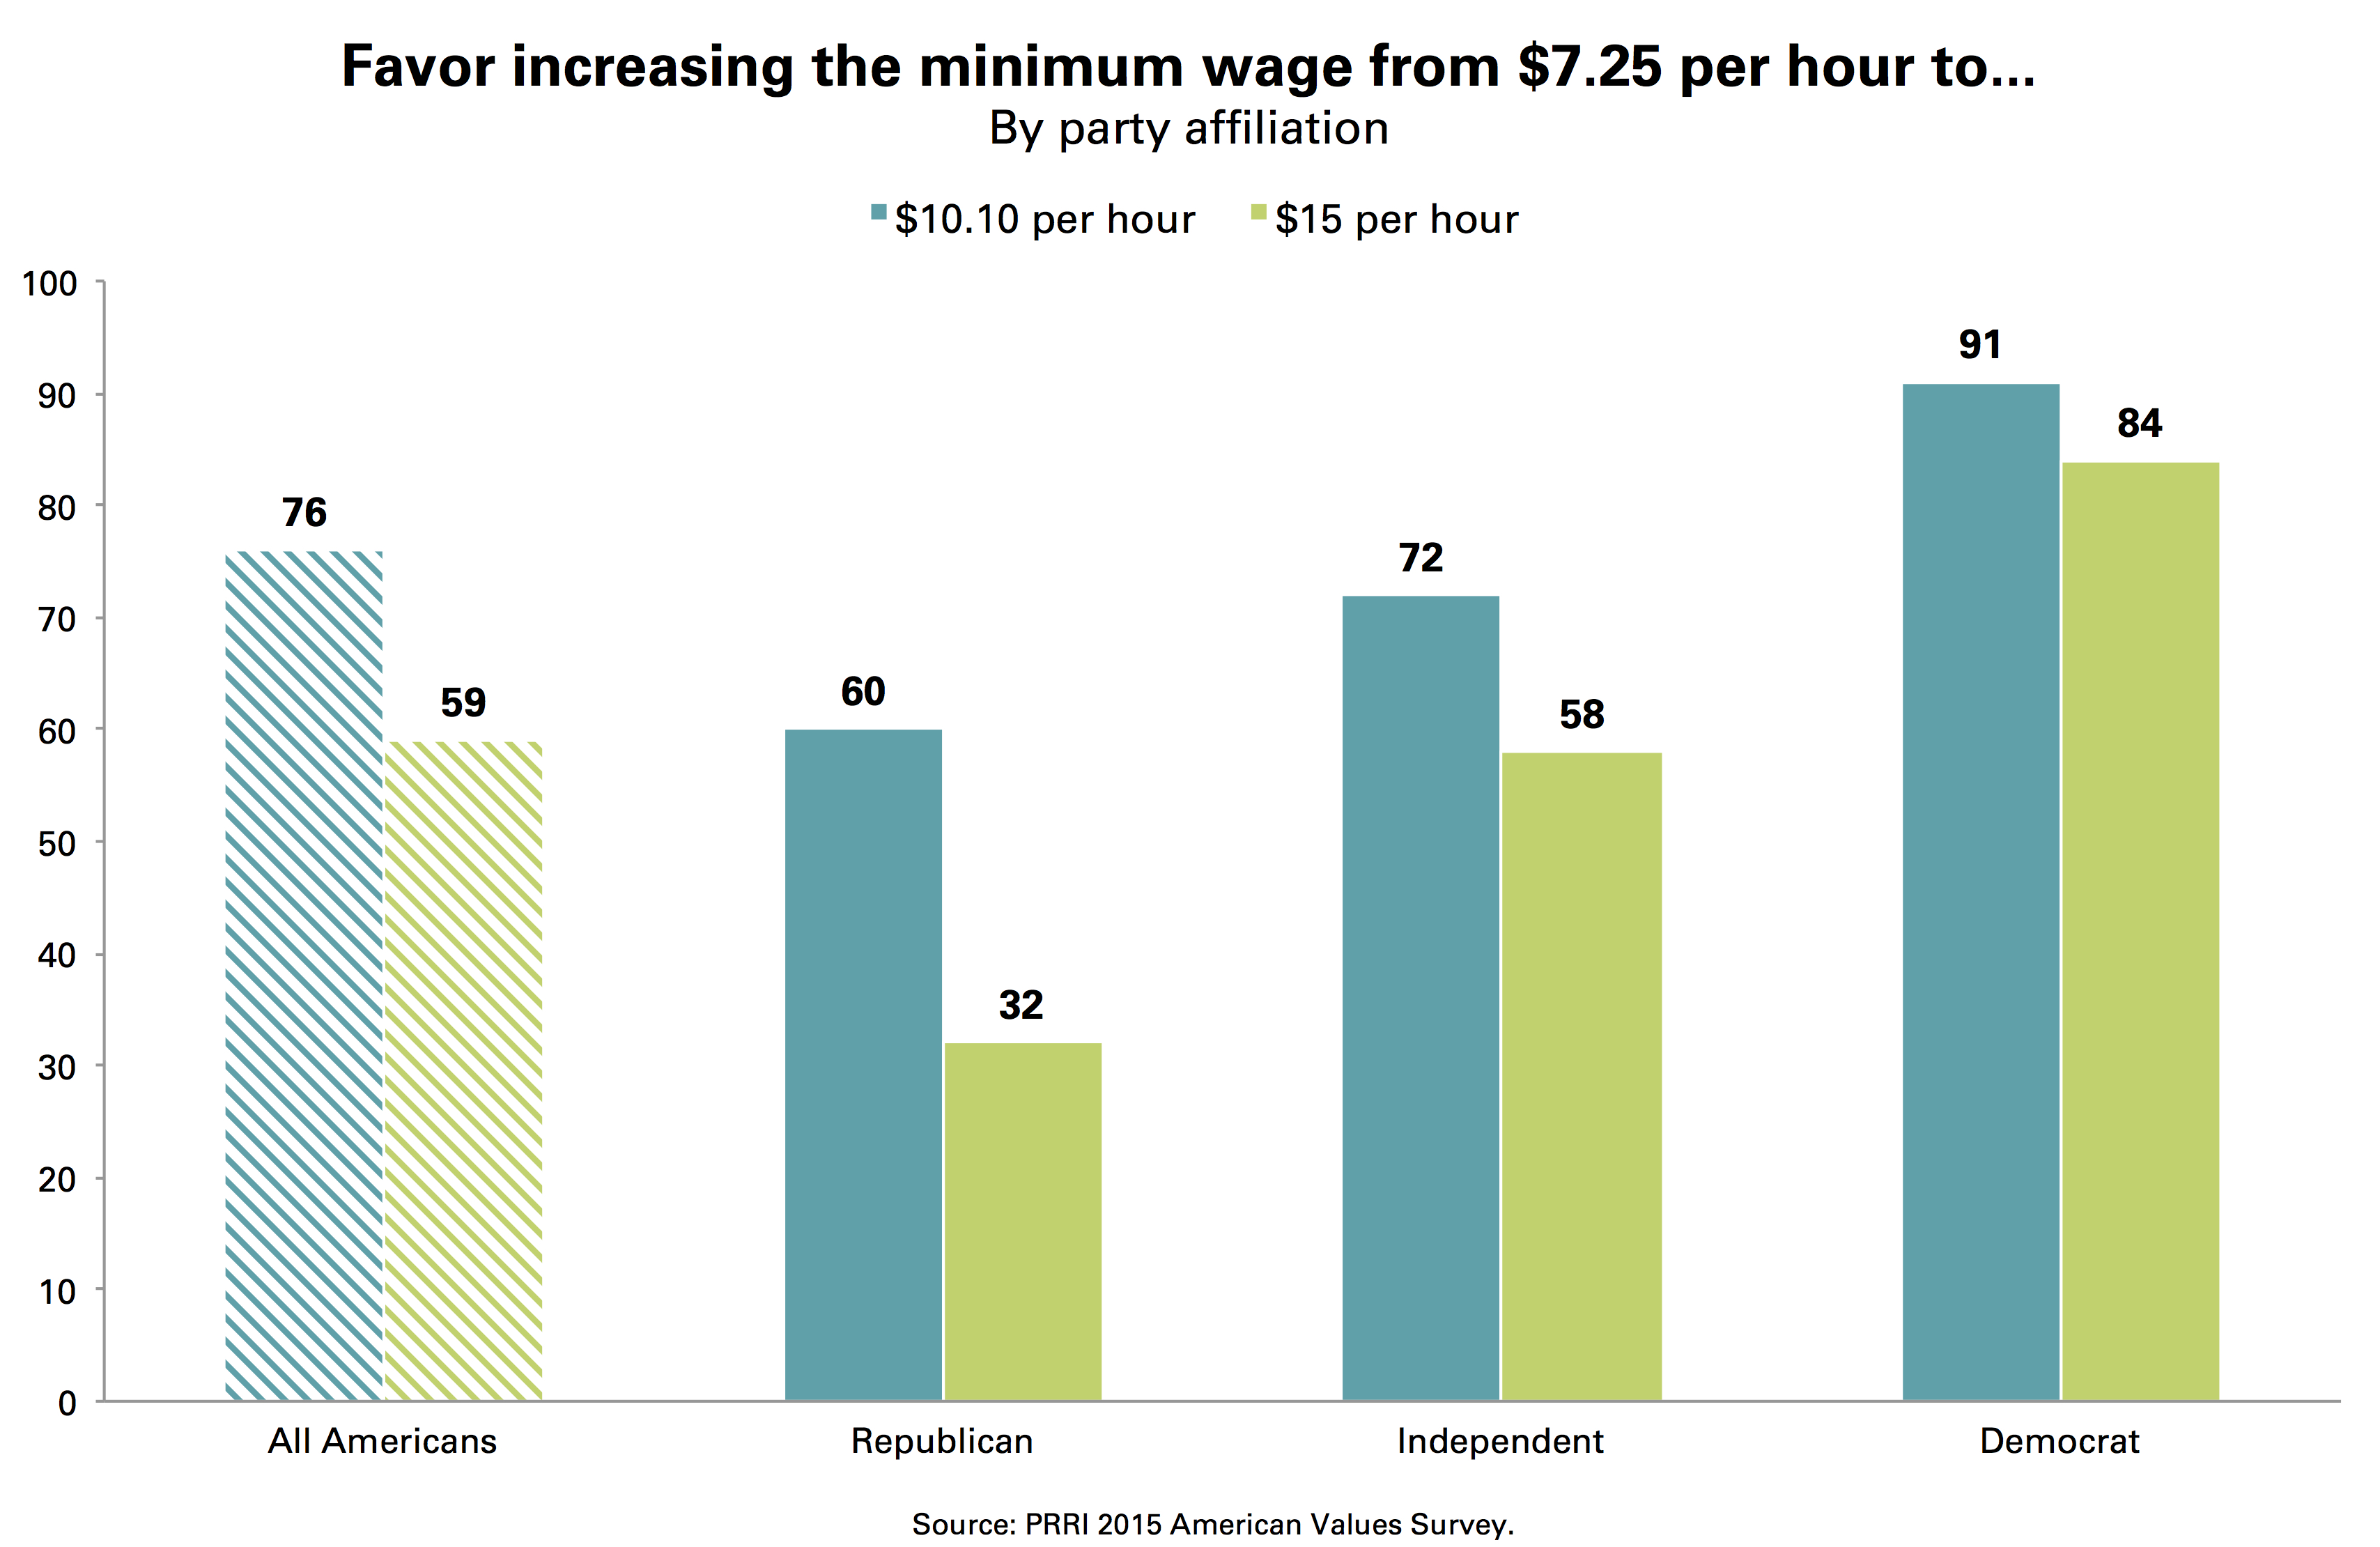
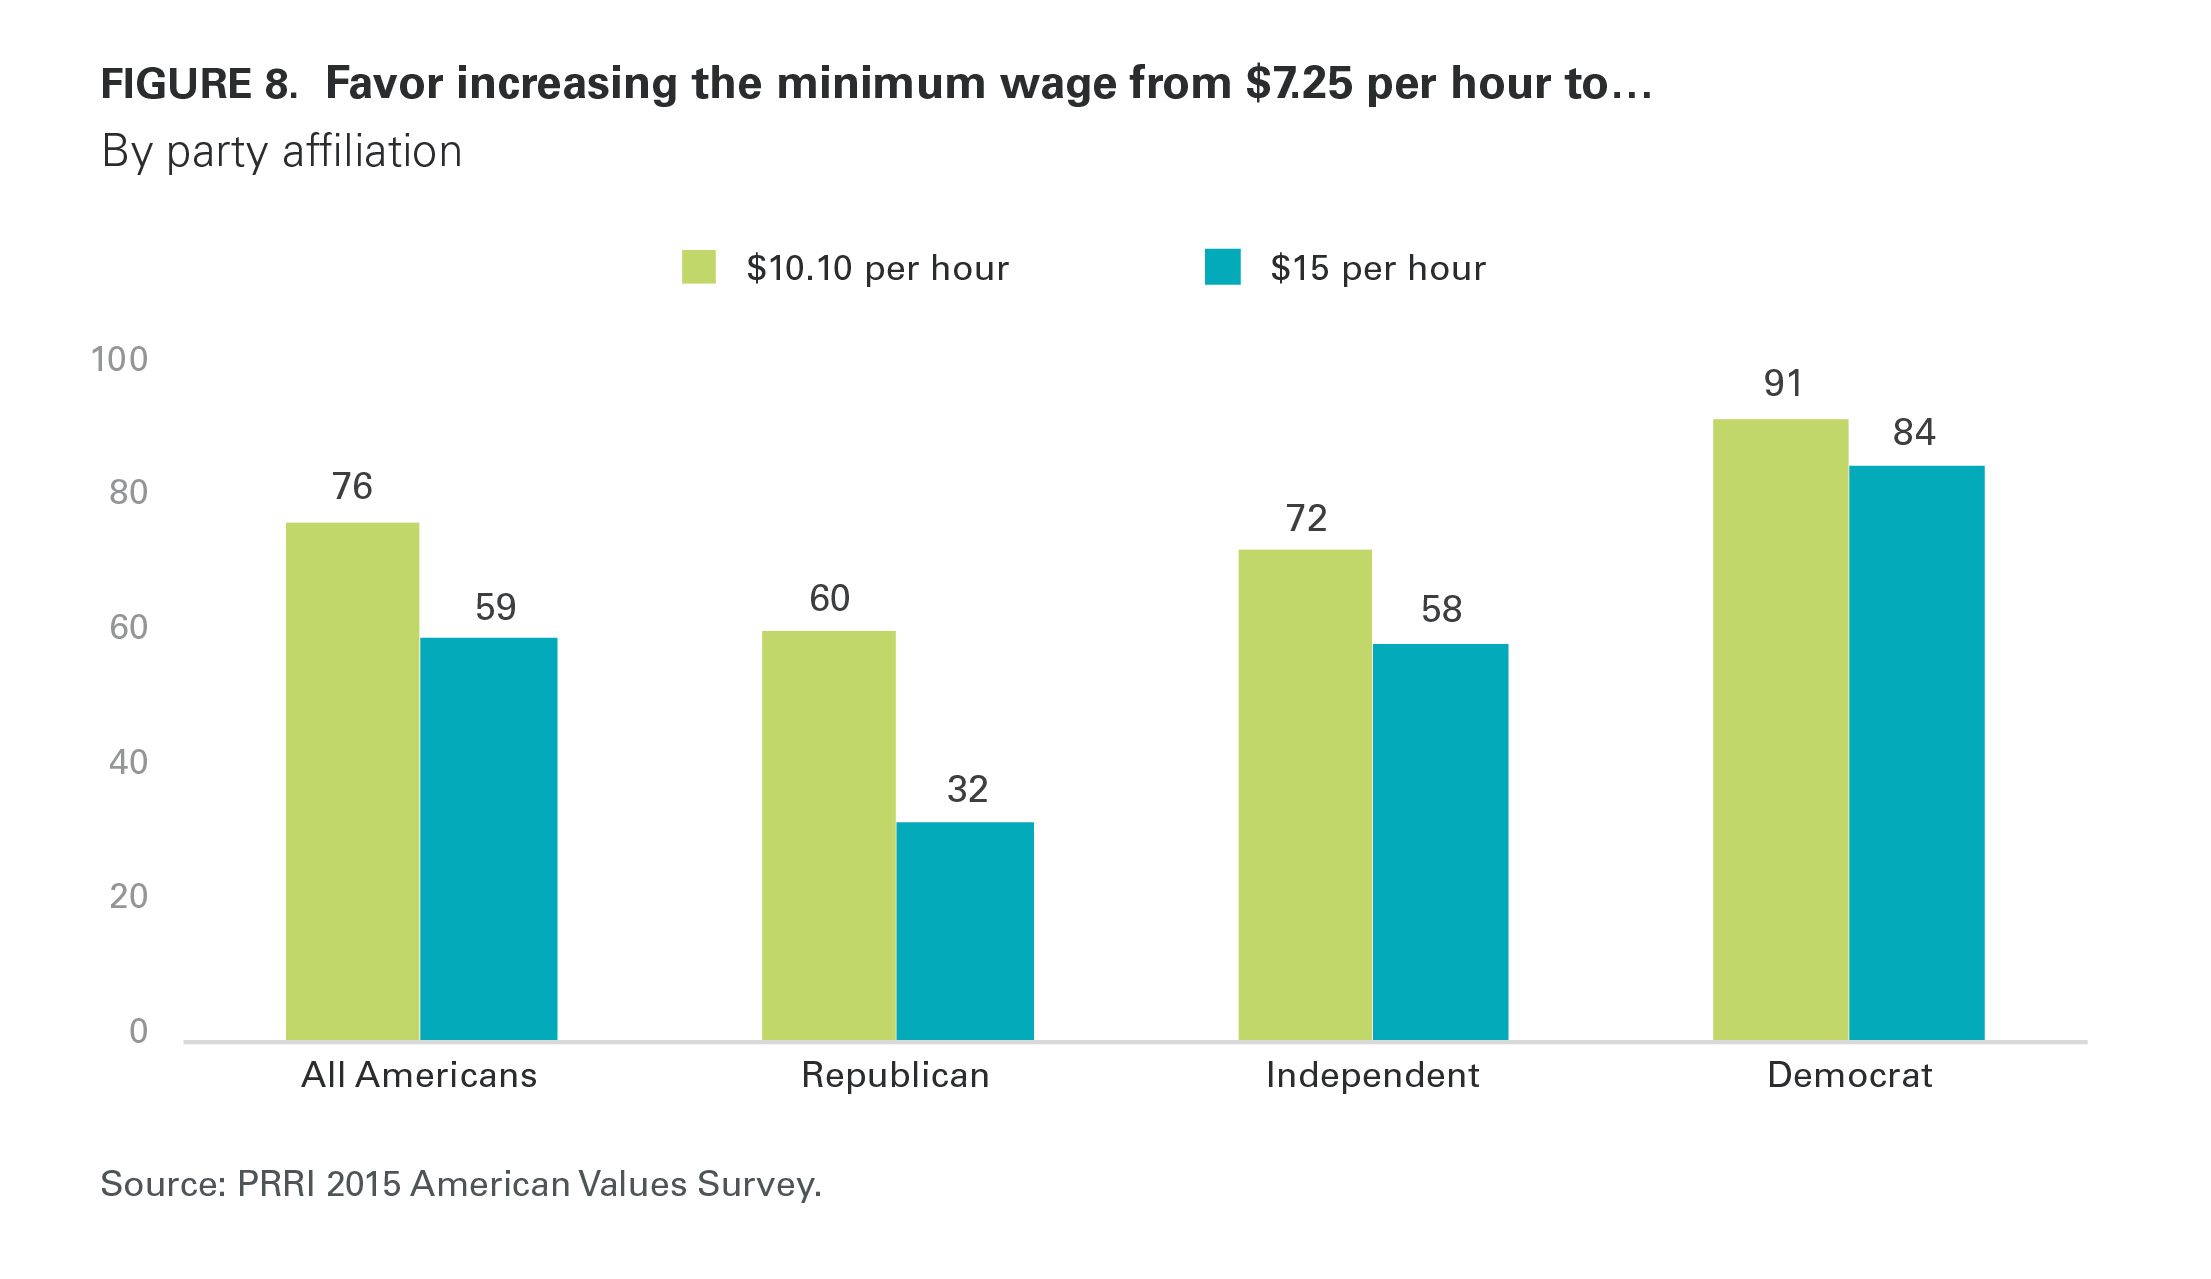
More than three-quarters (76%) of Americans support raising the minimum wage from $7.25 to $10.10 per hour. Support has ticked up significantly since 2014, when 69% of Americans expressed support for raising the minimum wage to $10.10 per hour. Nearly six in ten (59%) Americans express support for raising the minimum wage even higher—to $15 per hour—but there is less agreement across political party lines for the larger wage hike. Roughly equal numbers of Democrats favor raising the minimum wage to either $10.10 or $15 (91% vs. 84%, respectively). In contrast, while six in ten (60%) Republicans support raising the minimum wage to $10.10, fewer than one-third (32%) say they favor raising it to $15 per hour.
Americans overwhelmingly support requiring companies to provide all full-time employees with paid sick days if they or an immediate family member gets sick (85%), and requiring companies to provide all full-time employees with paid leave for the birth or adoption of a child (82%).
Anxieties about Cultural Change
A majority (53%) of Americans say that American culture and way of life has mostly changed for the worse since the 1950s, compared to 46% who say it has changed for the better.
Six in ten (60%) black Americans and a majority (54%) of Hispanic Americans believe that American culture has mostly changed for the better since the 1950s. In contrast, only 42% of white Americans agree, and 57% say that the American way of life has mostly changed for the worse over the last sixty years.
While a majority of independents (56%), Republicans (67%), and members of the Tea Party (72%) say American culture and way of life has gotten worse since the 1950s, only 40% of Democrats agree.
Today, Americans are evenly divided as to whether immigrants strengthen the country because of their hard work and talents (47%) or whether they are a burden on the U.S. because they take jobs, housing, and health care (46%).
By a margin of approximately two-to-one, Democrats are more likely to say that immigrants strengthen the country than to say that immigrants are a burden to the country (63% vs. 32%, respectively).
By a similar margin, Republicans are more likely to say the opposite—that immigrants burden the country as opposed to strengthen it (66% vs. 26%, respectively). Views of Tea Party members do not differ significantly from Republicans overall.
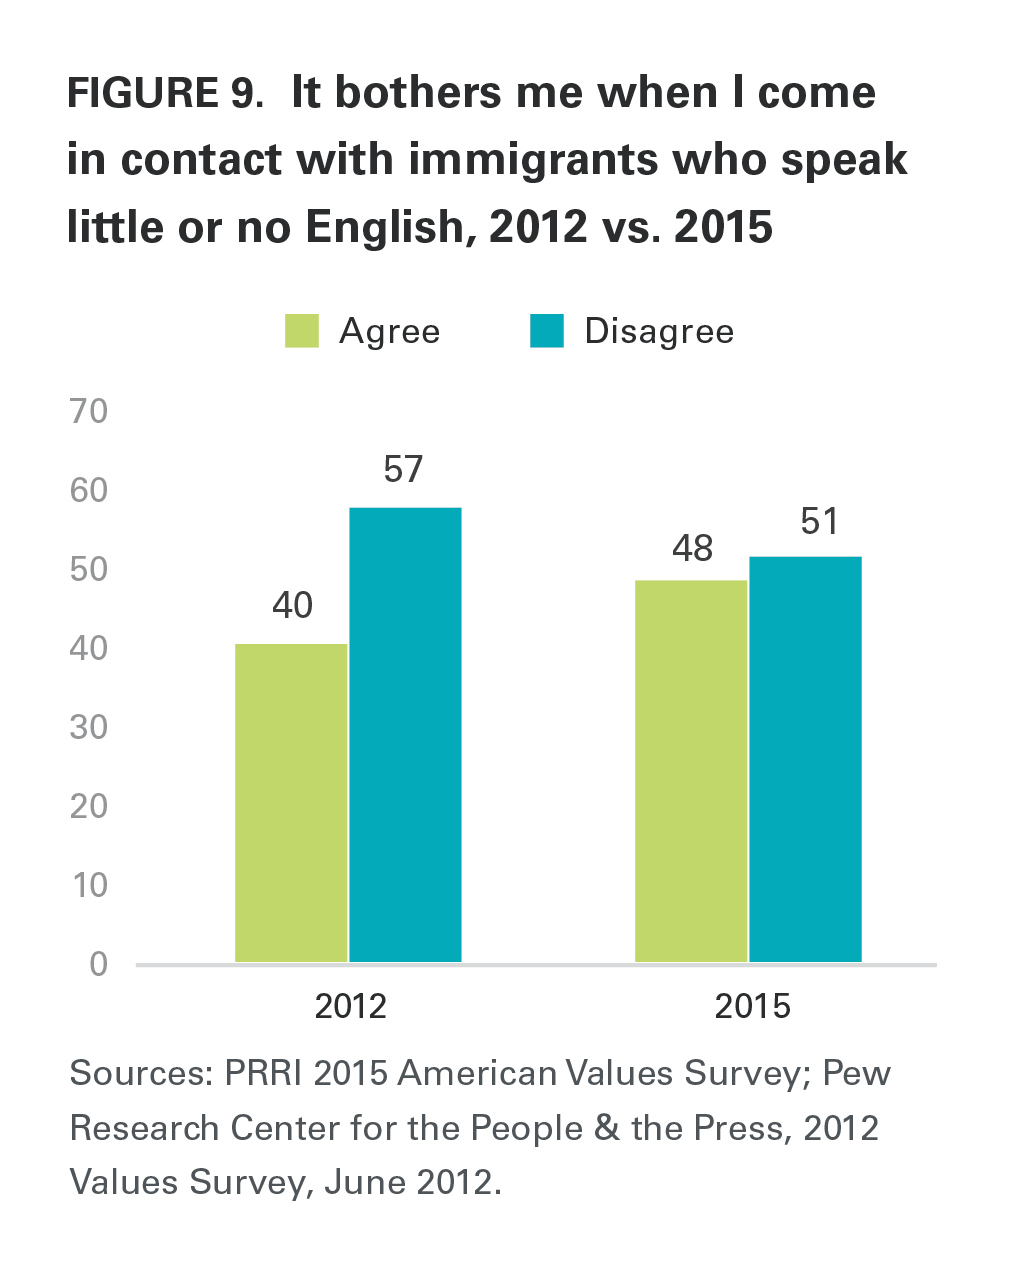
Compared to a few years earlier, Americans report less tolerance when encountering immigrants who do not speak English. Nearly half (48%) of Americans agree that they are bothered when they come into contact with immigrants who speak little or no English, compared to 40% in 2012. More than six in ten (63%) white working-class Americans say they feel bothered when they come into contact with immigrants who do not speak English, compared to 43% of white college-educated Americans.
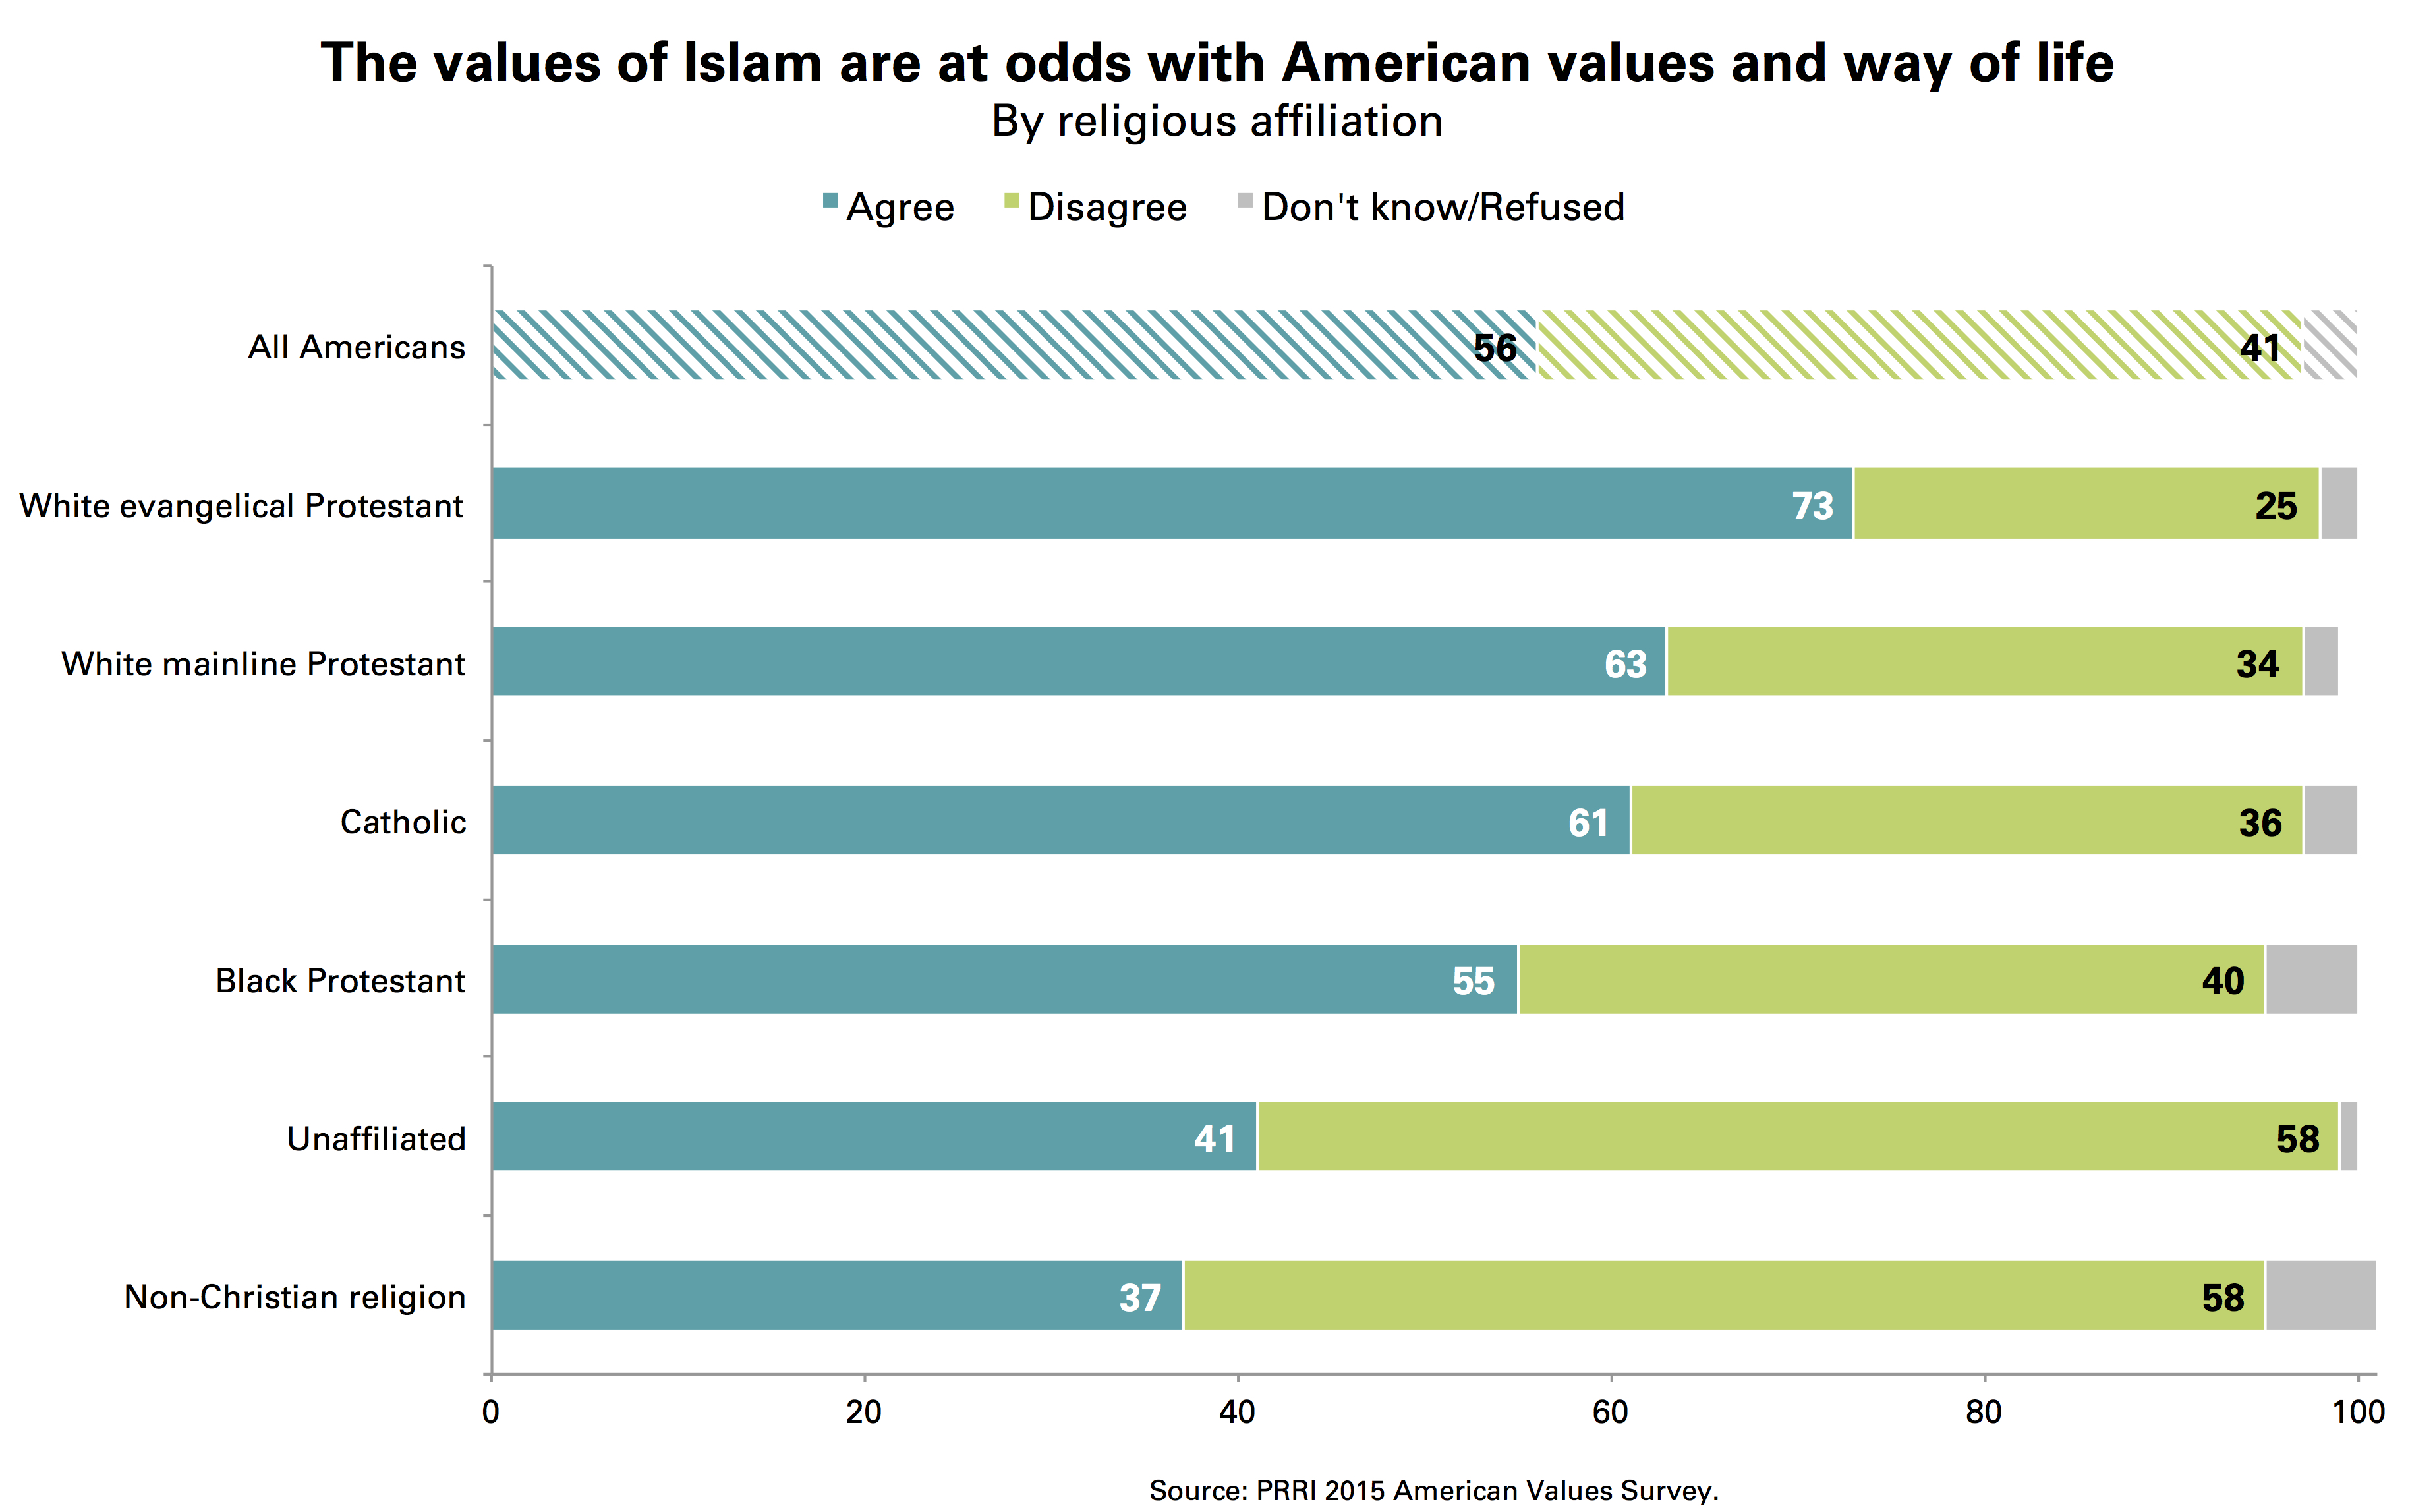
Americans’ perceptions of Islam have turned more negative over the past few years. Today, a majority (56%) of Americans agree that the values of Islam are at odds with American values and way of life, while roughly four in ten (41%) disagree. In 2011, Americans were divided in their views of Islam (47% agreed, 48% disagreed).
Little Confidence in Government, the Media, and Big Business
There is a wide disparity in public confidence in different major institutions in the country. While majorities of the public report having a great deal or some confidence in the police (75%), the criminal justice system (62%), and organized religion (55%), no more than half say they have a great deal or some confidence in the federal government (50%), news organizations (47%), and large business corporations (46%).
Few Americans say the government looks out for their interests. Only about four in ten (42%) Americans say the government looks out for the needs and interests of people like them either somewhat or very well. Notably, seniors (age 65 and older) are the only major demographic group in which a majority (55%) believe that the government looks out for their needs and interests at least somewhat well.
In order to provide an overall measure of Americans’ attitudes about confidence in major institutions in the U.S., we created an Institutional Mistrust Index (IMI). Americans are fairly evenly distributed across the scale. More than one-third of Americans express high levels of distrust of major institutions, scoring very high (12%) or high (23%) on the IMI. About three in ten (29%) fall into the moderate category, and more than one-third express significant trust in major institutions, scoring low (27%) or very low (9%) on the scale.
Disparate Perceptions of Discrimination and Racism
Muslims and gay and lesbian people top the list of groups who are perceived to be facing a lot of discrimination in the U.S. today, but many Americans also believe that racial and ethnic minorities face substantial discrimination.

Approximately seven in ten Americans say there is a lot of discrimination against Muslims (70%) and gay and lesbian people (68%) in the country today.
A majority of Americans say blacks (63%) and Hispanics (56%) face a lot of discrimination in the U.S.
Americans are more divided on how prevalent discrimination against women is in the United States—45% say there is a lot of discrimination against women in America today, while 53% say there is not.
Relatively few Americans believe that evangelical Christians (30%), Jews (30%), atheists (27%), whites (25%), or white men (22%) confront a great deal of discrimination in American society today.
More than four in ten (43%) Americans say that discrimination against whites has become as big a problem as discrimination against blacks and other minorities, while 55% disagree. Opinions about “reverse discrimination” have remained fairly constant over the past few years. Half (50%) of white Americans—including 60% of white working-class Americans—agree that discrimination against whites has become as big a problem today as discrimination against blacks and other minorities, while fewer than three in ten Hispanic (29%) and black Americans (25%) agree.
In order to provide an overall measure of Americans’ attitudes about race, we created a Racial Inequity Index (RII). Overall, more Americans score low than high on the scale. One-third of Americans score very high (10%), or high (23%) on the scale, indicating that they perceive systemic discrimination against racial minorities as having continued impact on inequality today. About one in five (21%) Americans fall into the moderate category, and nearly half of Americans score low (38%) or very low (8%) on the RII, believing that racial minorities today have equal opportunities as whites. Approximately three-quarters of Republicans (74%) and Tea Party members (75%) perceive few continued effects of racial discrimination today (low scores on the RII), compared to just 22% of Democrats.
Race and Fair Treatment by Police and the Criminal Justice System
A majority (53%) of the public say that recent killings of African American men by police are isolated incidents rather than part of a broader pattern of how police treat African Americans (44%). Views on police killings of African American men are highly stratified by race/ethnicity.
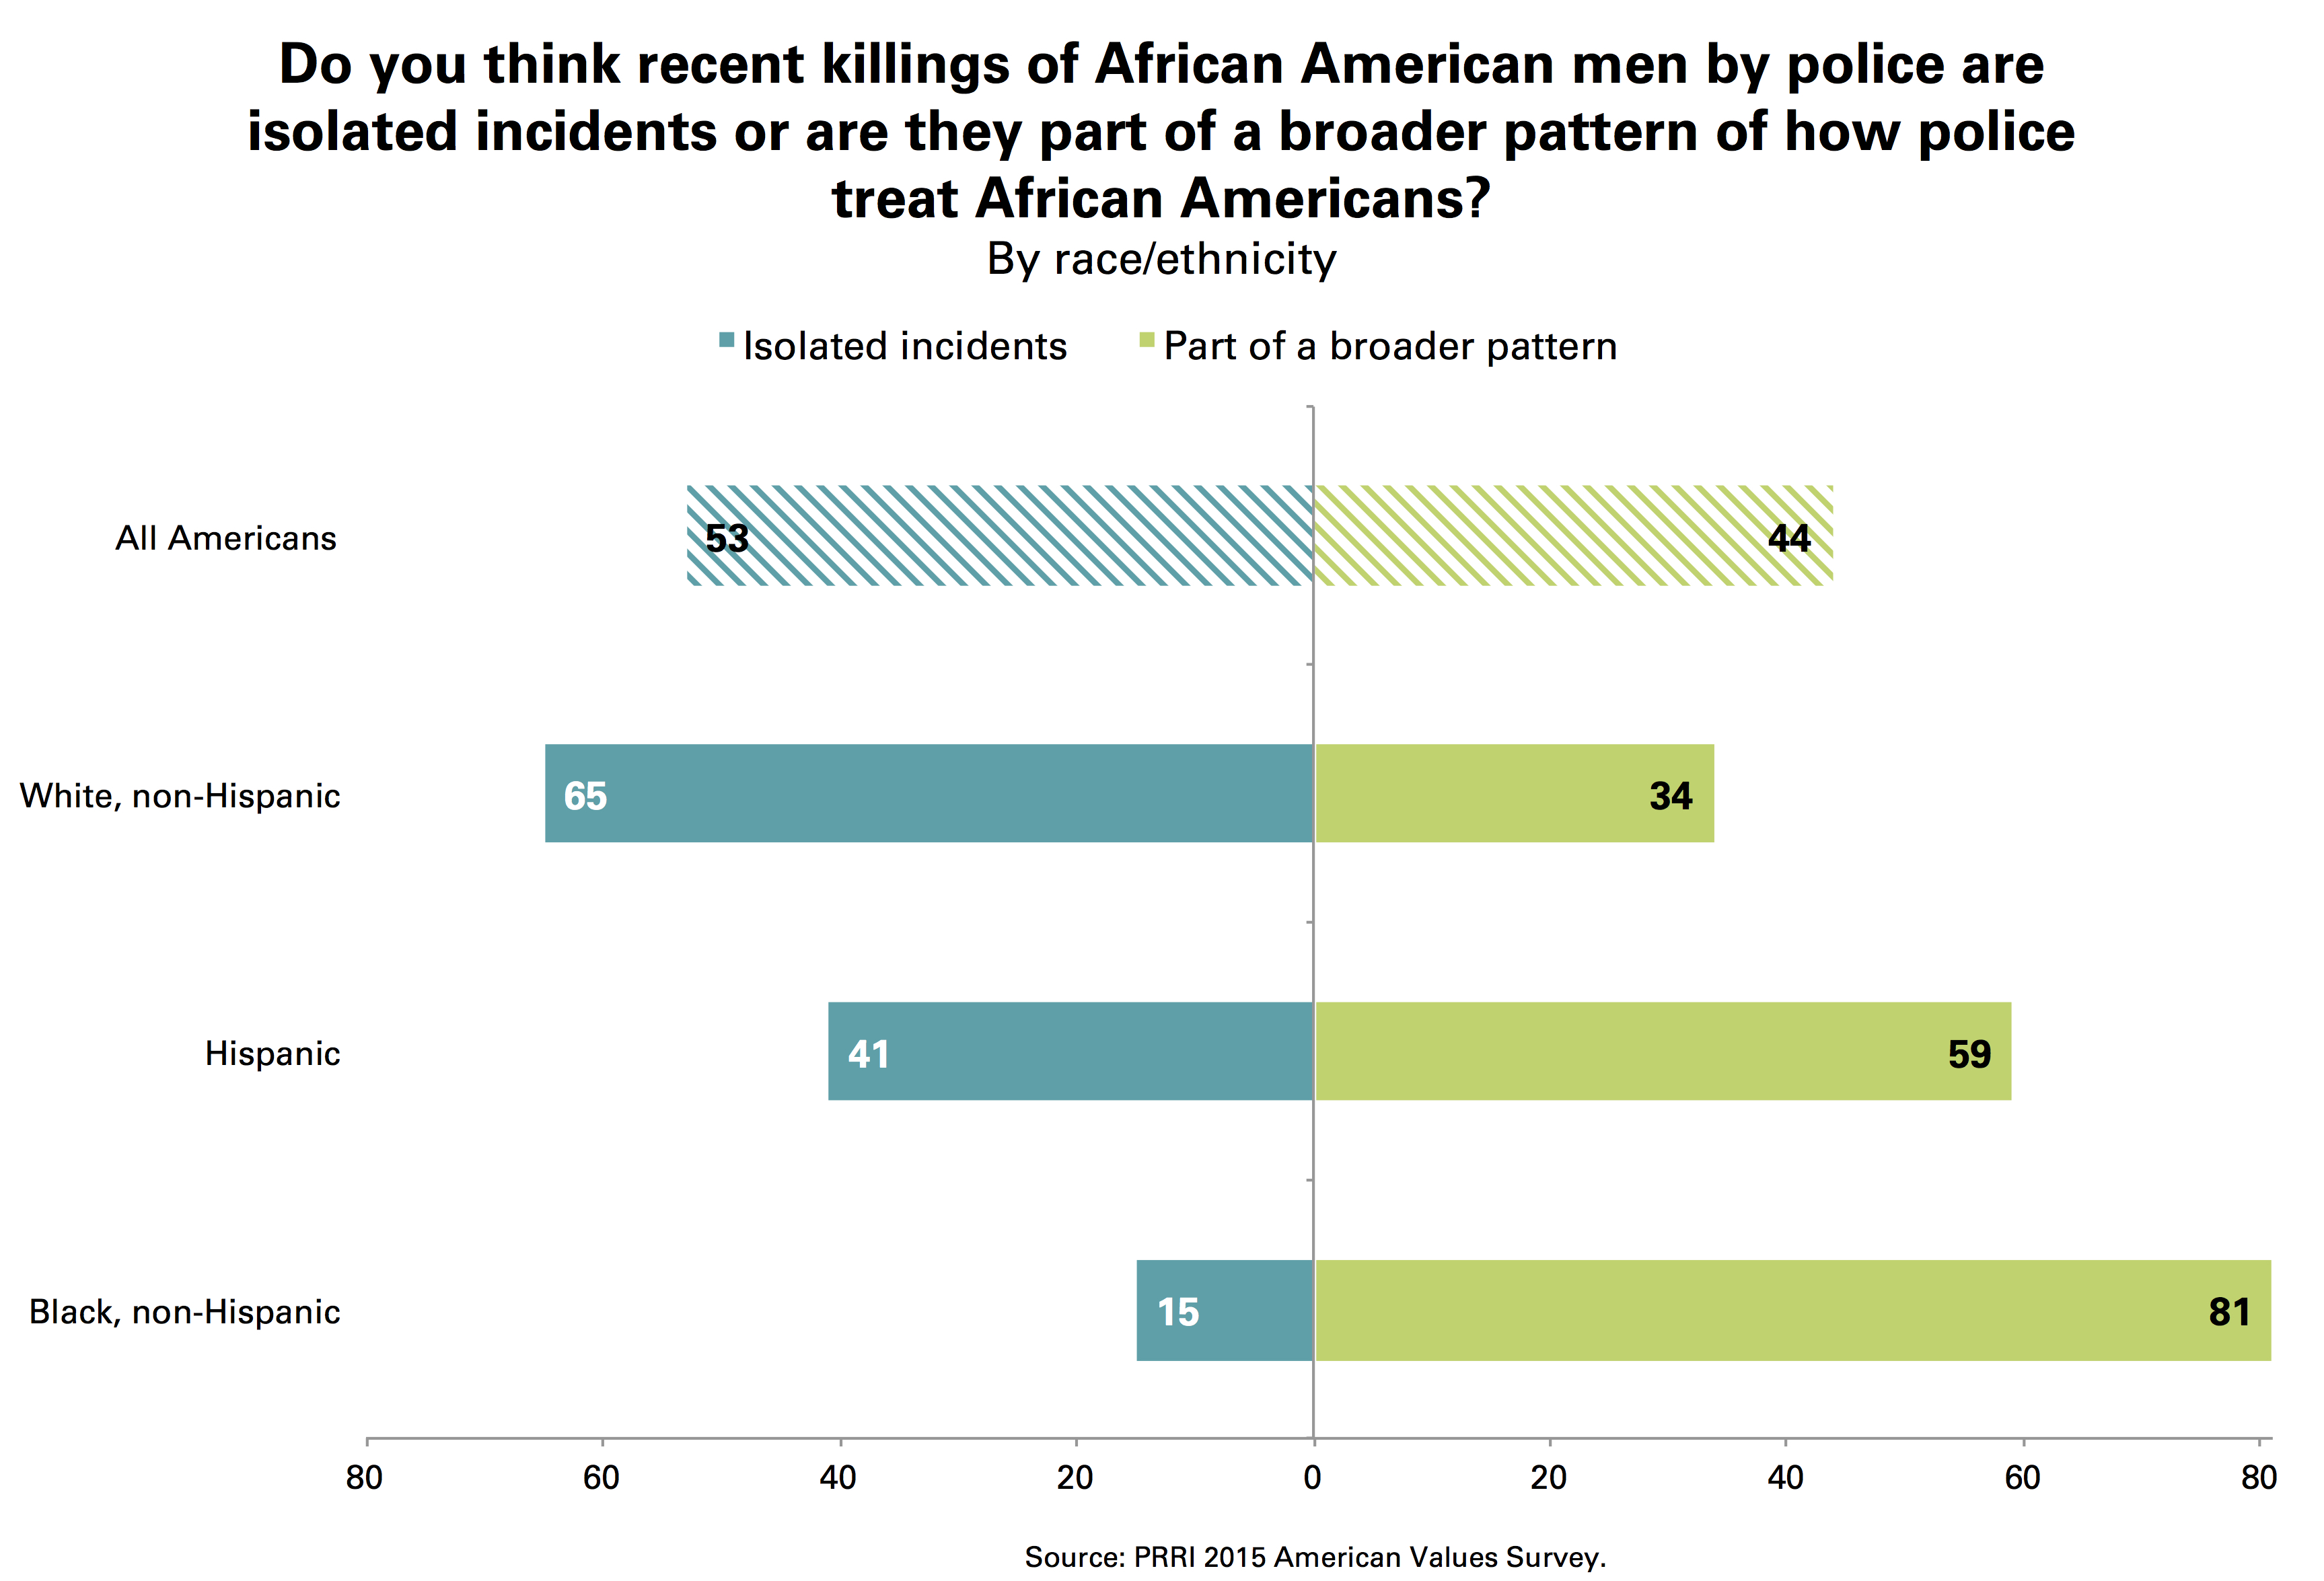
Approximately two-thirds (65%) of white Americans say recent killings of African American men by police are isolated incidents, while about four in ten (41%) Hispanic Americans and only 15% of black Americans say the same.
More than eight in ten (81%) black Americans say recent police killings of African American men are part of a broader pattern of how police treat African Americans.
Among religious groups, white Christians are more likely than other religious groups to say that recent killings of African American men by police are not connected.
More than seven in ten white evangelical Protestants (72%), white mainline Protestants (73%), and white Catholics (71%) believe that killings of African American men by police are isolated incidents.
By contrast, about six in ten Americans who are affiliated with non-Christian religions (62%) and religiously unaffiliated Americans (59%) believe that these killings are part of a broader pattern of how police treat minorities.
Among black Protestants, more than eight in ten (82%) believe they are part of a broader pattern.
Nearly six in ten (58%) Americans disagree that blacks and other minorities receive equal treatment as whites in the criminal justice system, up from 47% in 2013. More than eight in ten (85%) black Americans and two-thirds (67%) of Hispanic Americans disagree that non-whites receive equal treatment in the criminal justice system. White Americans overall are closely divided (52% disagree, 47% agree), but white college-educated Americans are significantly more likely than white working-class Americans to disagree that minorities receive equal treatment in the criminal justice system (64% vs. 47%, respectively).
Americans are also closely divided over whether there are racial disparities in death penalty sentencing. A majority (53%) of Americans agree that a black person is more likely than a white person to receive the death penalty for the same crime, while 45% of Americans disagree. American attitudes about the way that the death penalty is applied are virtually unchanged from 1999. More than eight in ten (82%) black Americans and roughly six in ten (59%) Hispanic Americans, compared to fewer than half (45%) of white Americans, believe that a black person is more likely than a white person to receive a death penalty sentence for the same crime.
I. The 2016 Campaign and Political Landscape
Interest in the 2016 Campaign
At this point in the 2016 presidential campaign, fewer than half (42%) of the public report being very interested in the upcoming election. About four in ten (37%) say they are somewhat interested in following the events surrounding the 2016 campaign, while about one in five say they are not too interested (14%) or not at all interested (7%).
Interest levels vary by partisan affiliation. Nearly six in ten (59%) Americans who identify with the Tea Party and a majority (52%) of Republicans report being very interested in the 2016 election. In contrast, 43% of Democrats and only about one-third (35%) of independents say they are very interested in following the 2016 campaign. However, there are notable ideological gaps within the Republican Party: more than six in ten (61%) conservative Republicans say they are very interested in the campaign, compared to 40% of moderate and liberal Republicans.
Candidate Preference and Favorability
The Democratic Field
As of October 2015, the Democratic primary is decidedly more settled than the GOP primary race. Hillary Clinton holds a commanding lead over her opponents with a majority (55%) of likely Democratic primary voters expressing support for her candidacy.(1) Although Joe Biden has officially removed himself from the presidential race, roughly one in four (23%) Democratic primary voters say they would like to see the sitting vice president become the party’s nominee in 2016. Seventeen percent of likely Democratic primary voters say they would want Bernie Sanders to be their party’s nominee.
Reflecting her position as the leading candidate, Clinton is viewed more positively than her leading opponent, Sanders. Eighty-four percent of likely Democratic primary voters view Clinton favorably, compared to only 16% who have an unfavorable view of her. A majority (56%) of likely Democratic primary voters have a favorable view of Sanders, but more than one-quarter (26%) view him negatively. Notably, nearly one in five (18%) likely Democratic primary voters say they are not familiar with Sanders.
The Republican Field
As of October 2015, Donald Trump leads his rivals by a notable margin. One in four (25%) likely Republican primary voters say they would like to see Trump as the GOP’s nominee in 2016. Sixteen percent of likely primary voters report that they would prefer Ben Carson to be the GOP’s nominee, while 13% say they would most like Carly Fiorina to be the party’s standard-bearer. Roughly one in ten likely primary voters would prefer Jeb Bush (11%) or Marco Rubio (9%) to emerge from the primary as the nominee. Ted Cruz (5%), Mike Huckabee (5%), John Kasich (4%), Chris Christie (3%), and former-candidate Scott Walker (3%) garner substantially less support from likely Republican primary voters.
Although Trump currently leads the crowded GOP field, his appeal may be limited due to the relatively high number of likely Republican primary voters who view him negatively. While more than six in ten (61%) likely primary voters have a favorable view of Trump, 38% hold unfavorable opinions of him. Bush faces a similar dilemma. Although six in ten (60%) likely Republican primary voters have a favorable view of Bush, 36% view him unfavorably. A majority (56%) of Republican primary voters have a favorable impression of Rubio, while less than one-third (31%) view him unfavorably. However, more than one in ten (13%) Republican primary voters report being unfamiliar with Rubio. Cruz is in a somewhat similar position, although he is not viewed as positively as Rubio. Half (50%) of Republican primary voters express a favorable view of Cruz, while roughly one-third (35%) have an unfavorable view, and 16% say they are not familiar with him or offer no opinion of him.
Concerns about a Bush/Clinton Dynasty
Although Jeb Bush and Hillary Clinton each entered the 2016 campaign with considerable assets, their famous names may not be among them. Most (54%) Americans say that electing another president from the “Bush” or “Clinton” family would be bad for the country, while 45% disagree.
In the primary campaign season, Bush may face greater obstacles than Clinton in overcoming his last name. More than six in ten (61%) Republicans—including 64% of likely Republican primary voters—and nearly seven in ten (69%) Tea Party members say that electing another Bush or Clinton would be bad for the country. Fewer than half (42%) of Democrats—including 39% of likely Democratic primary voters—say that electing another president from the Bush or Clinton family would be a bad thing for the country, while most Democrats (57%) disagree.
Who are Donald Trump’s Supporters?
Donald Trump’s emergence and endurance as the leading candidate in the Republican primary may be partly due to his ability to appeal to white working-class Americans.(2) A majority (55%) of Republicans and Republican-leaning independents who support Trump are white working class. In contrast, only about one-third (35%) of those supporting all other Republican candidates identify as white working class. Even other non-establishment candidates, like Ben Carson, do not seem to have the same appeal among white working-class Americans; less than one-third (32%) of Carson supporters are white working-class Americans.
On no issue do Trump supporters differ more from those supporting other Republican candidates than on the issue of immigration. Nearly seven in ten (69%) Trump supporters say that immigration is a critical issue to them personally. In contrast, only half (50%) of those who support other candidates say that the issue of immigration is critically important to them.
Trump supporters are much more likely to express negative views of immigrants than the supporters of other candidates. Eight in ten (80%) Trump supporters say that immigrants today are a burden to the U.S. because they take American jobs, housing, and health care. Nearly three-quarters (73%) of Trump supporters say that it bothers them when they come into contact with immigrants who speak little or no English. Supporters of other Republican candidates also view immigrants negatively, but somewhat less so—a majority (56%) say that immigrants are a burden on the U.S. due to their economic impact and a similar number (58%) report that coming into contact with immigrants who do not speak English bothers them.
Trump supporters also express greater concern about discrimination against white Americans and white men in particular.(3) Roughly three-quarters (74%) of Trump supporters—compared to 57% of supporters of all other Republican candidates—agree that, today, discrimination against whites has become as big a problem as discrimination against blacks and other minorities. More than four in ten (42%) Trump supporters—compared to 30% of supporters of all other Republican candidates—say that white men face a lot of discrimination in the U.S. today.
The Tea Party
Declining Size, Changing Composition of the Tea Party, 2010-2015
PRRI has tracked Tea Party affiliation in 32 national surveys between 2010 and 2015. These surveys reveal that the percentage of Americans who identify with the Tea Party movement has declined by nearly half over the last five years, from 11% in 2010 to 6% today. Tea Party affiliation has also dropped among Republicans, from 22% in 2010 down to 14% today.
Even as its numbers have shrunk, the Tea Party’s composition has remained fairly stable, with some notable exceptions. The Tea Party continues to be older, whiter, and more male than the general population. But compared to 2010, members of today’s Tea Party earn less money: in 2010, 22% lived in households with less than $30,000 in annual income, compared to 30% today. There has also been an uptick in the overlap between those who identify with the Tea Party and those who identify with the Christian Right or conservative Christian political movement. In 2010, PRRI found that 47% of the Tea Party also considered themselves part of the Christian Right, a number that has grown to 54% today.
Declining Favorability of the Tea Party
Favorable views of the Tea Party have dropped 10 percentage points over the last year. Only one-quarter (25%) of Americans currently hold a favorable view of the Tea Party, down from 35% last year. Most (57%) Americans currently hold an unfavorable view of the group, up from 46% last year. Notably, nearly one in five (17%) report being unfamiliar with the Tea Party or did not provide an opinion about the group.
The decline in favorable views of the Tea Party is pronounced among Republicans, independents, and Democrats. Fewer than half (45%) of Republicans have a favorable view of the Tea Party today, compared to 58% who held a positive view in 2014. Political independents’ positive view of the Tea Party has also dropped from 35% in 2014 to 27% today, as have those of Democrats: 18% in 2014 to 12% today.
Even among conservative Republicans, favorable views of the Tea Party have dropped substantially over the last year, from two-thirds (66%) in 2014 to 56% today. But the drop among moderate and liberal Republicans has been even steeper: in 2014, more than four in ten (42%) moderate and liberal Republicans expressed a positive view of the Tea Party, compared to only 27% today.
Political Priorities: Critical Issues in the Country
Three issues are mentioned most often by Americans as being critical to them personally: health care (63%), terrorism (62%), and jobs and unemployment (60%). A majority (53%) of the public also report that crime is a critical issue to them personally. Slightly fewer say the cost of education (49%), economic inequality (48%), and immigration (46%) are critical issues. Fewer Americans say that race relations (39%), climate change (34%), abortion (34%), religious liberty (31%), and same-sex marriage (25%) are critical issues.
The priorities of Democrats and Republicans are dramatically different. The issues most often identified by Democrats as critical include: health care (71%), jobs and unemployment (66%), cost of education (62%), and the growing gap between rich and poor (62%). For Republicans, the issue of terrorism is most often cited as a critical issue. Nearly eight in ten (79%) Republicans say that terrorism is a critical issue, while roughly six in ten Republicans believe that health care (61%), immigration (59%), and jobs and unemployment (59%) are critical issues.
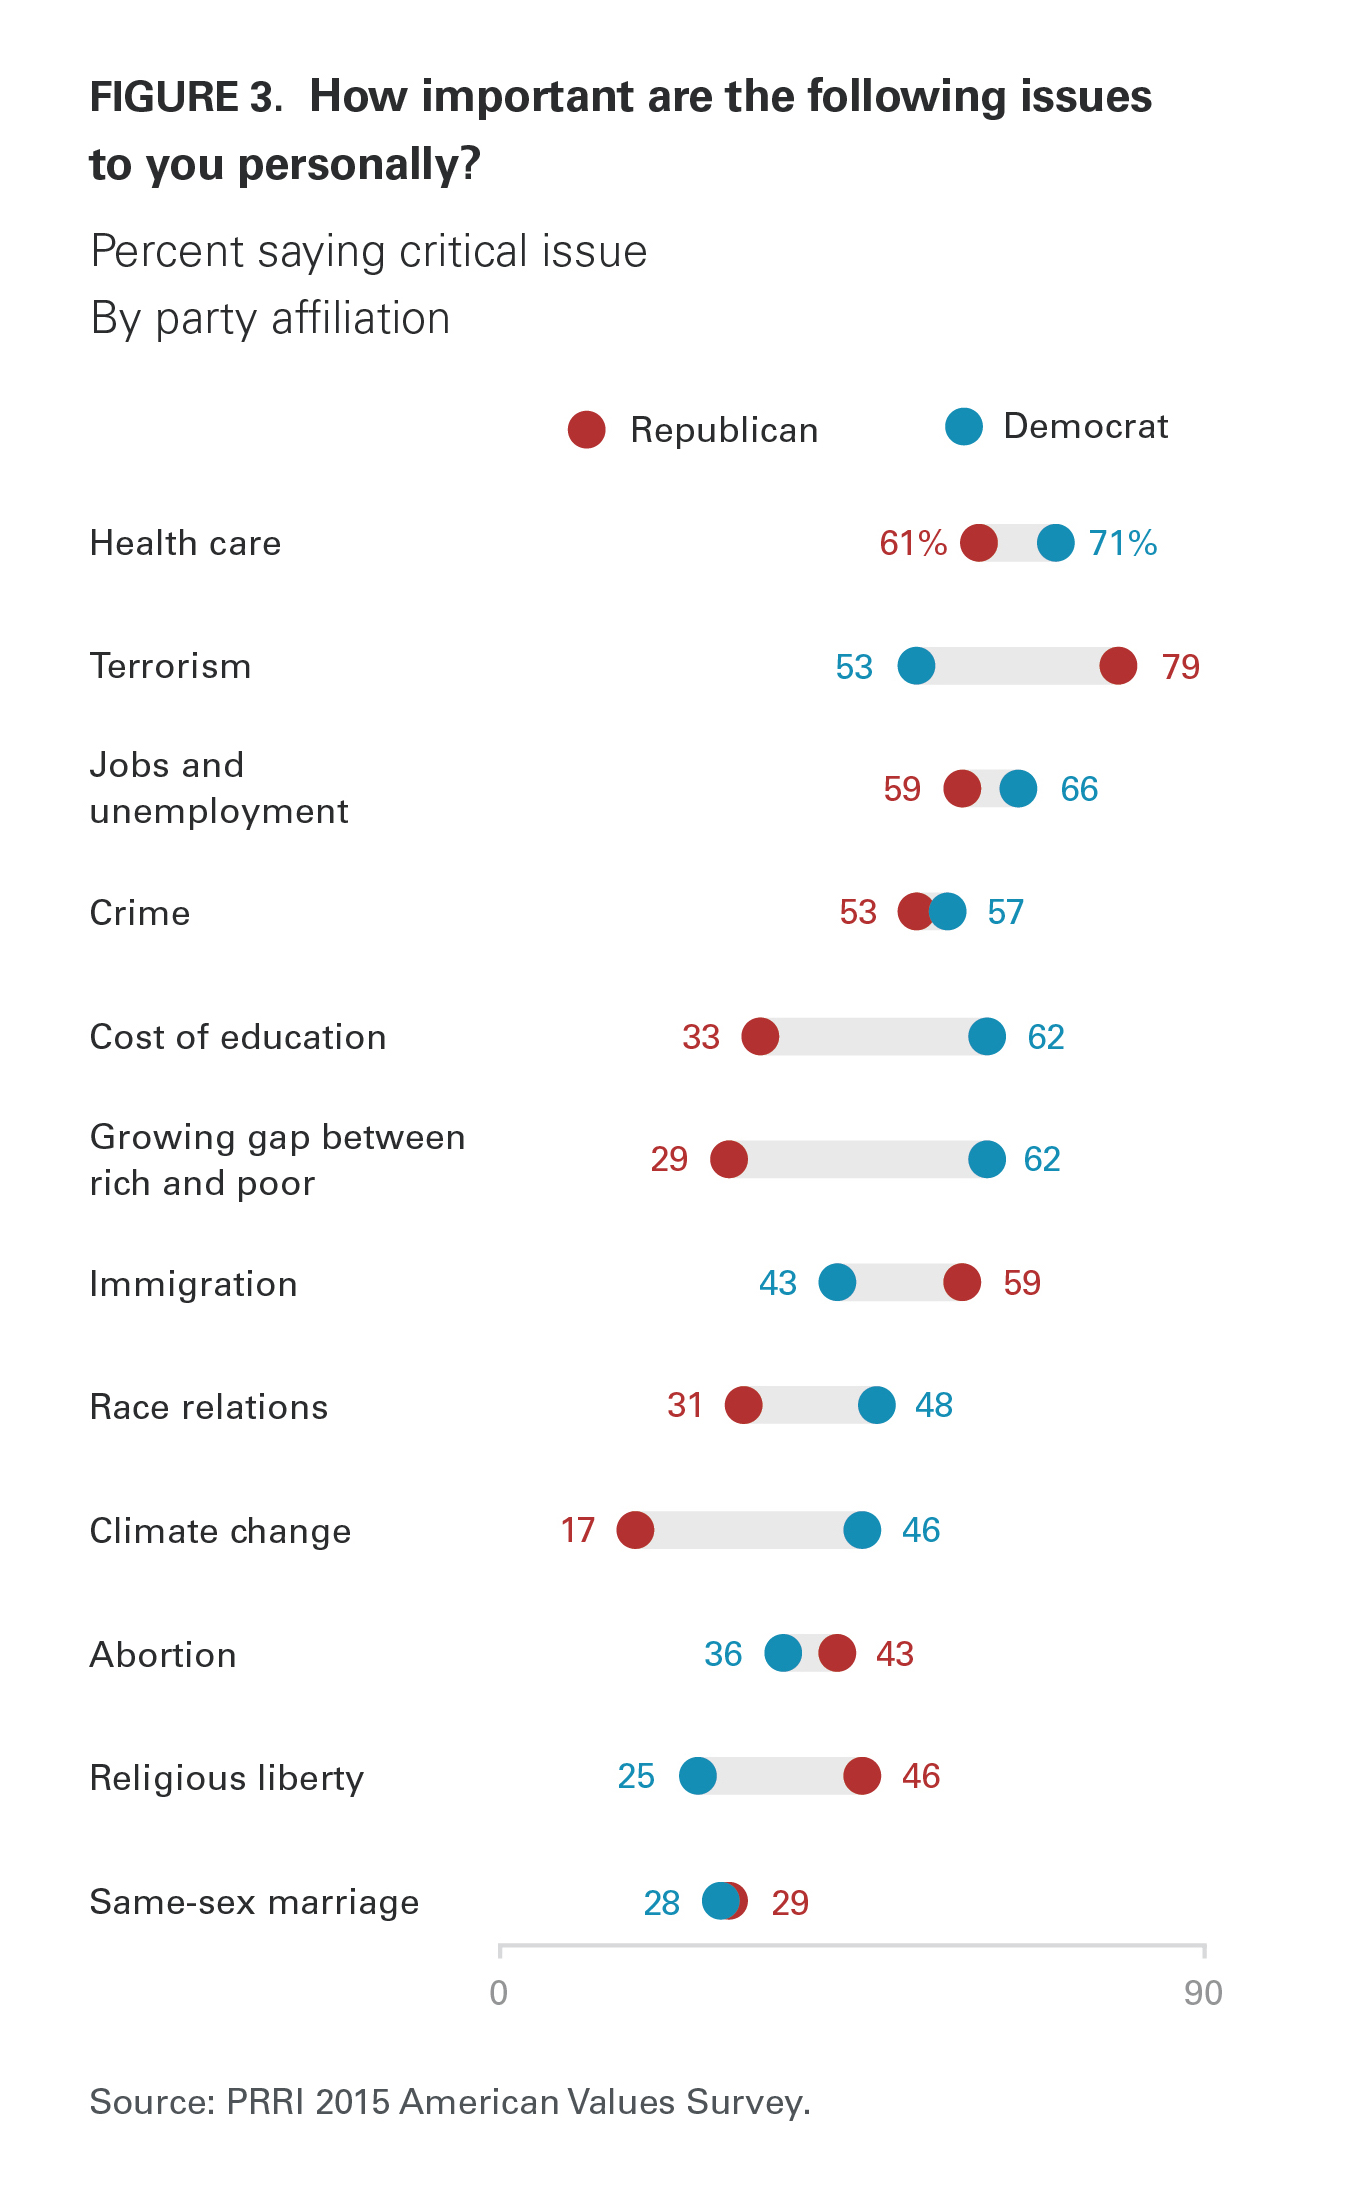 The largest differences between the priorities of Democrats and Republicans are on the issues of economic inequality (62% vs. 29%, respectively), the cost of education (62% vs. 33%, respectively), climate change (46% vs. 17%, respectively), and terrorism (53% vs. 79%, respectively). Notably, there is only a modest difference between Democrats and Republicans on the importance of abortion (36% vs. 43%, respectively), and there are no significant differences between Democrats and Republicans on the importance of same-sex marriage (28% vs. 29%, respectively).
On most issues, the views of Tea Party members closely align with Republicans overall. However, the two groups express somewhat different priorities on the issue of immigration; while nearly six in ten (59%) Republicans say that immigration is a critical issue to them personally, roughly seven in ten (69%) Tea Party members say the same.
The political priorities of Americans also vary starkly by race and ethnicity. White (33%) and Hispanic Americans (43%) are far less likely than black Americans (63%) to say race relations are a critical issue. White Americans also give a much lower priority to crime. Fewer than half (47%) of white Americans say crime is a critical issue, compared to roughly two-thirds of Hispanic (65%) and black Americans (68%). However, among whites, concern about crime varies substantially by social class. White working-class Americans are nearly twice as likely as white college-educated Americans to say that crime is a critical issue (58% vs. 32%, respectively). White Americans are much less likely than black and Hispanic Americans to identify the cost of education as a critical issue (43% vs. 60% and 66%, respectively).
Should Government Officials Compromise or Stand on Principle?
In the context of a government shutdown, Americans overwhelmingly prefer that government officials find common ground as opposed to standing on principle. Nearly eight in ten (78%) Americans say that it is more important for public officials to compromise to find solutions, while one in five (20%) say it is more important for officials to make principled stands even at the cost of a government shutdown.
There are only modest differences by political affiliation with one important exception. Nearly nine in ten Democrats (87%), roughly eight in ten independents (78%), and two-thirds of Republicans (67%) say that government officials should seek out compromise. However, Americans who identify with the Tea Party are divided; about half (49%) say public officials should stand on principle, while a similar number (46%) prefer compromise.
II. The Economic Climate
America heads into the 2016 election amid a climate of waning optimism about its economic health, the state of its communities, and the fairness of the economic system. Americans see the causes of this malaise as multi-faceted, and they continue to favor populist economic policies, such as an increase in the minimum wage and paid sick and parental leave in the workplace.
A Gloomy Economic Outlook Continues
Is America Still in a Recession?
More than seven in ten (72%) Americans believe that the country is still in a recession, while roughly one-quarter (27%) believe the economic recession is over. Americans’ views about the economic recession have remained steady over the last few years, with an identical percentage (72%) of Americans saying the country was still in a recession in 2014, and 76% saying the country was still in a recession in 2012.
There are important divisions among white Americans by social class. Nearly eight in ten (78%) white working-class Americans say America is still in a recession, while significantly fewer (62%) white college-educated Americans say the same.
Who’s to Blame? Causes of Current Economic Problems
While Americans blame many things for America’s current economic problems, they are most united in pointing the finger at business corporations. More than eight in ten (86%) Americans say that corporations moving American jobs overseas is somewhat or very responsible for the present economic troubles facing the U.S., up 12 percentage points from 74% in 2012. Nearly eight in ten (77%) Americans say that corporations refusing to pay workers a fair wage is at least somewhat responsible for the current economic problems, and nearly three-quarters (73%) of the public mention China’s unfair trade practices.
Roughly seven in ten (69%) Americans say burdensome government regulations are at least somewhat responsible for the country’s economic problems, up slightly from 65% in 2012. Substantially fewer (54%) Americans—although still a majority—say that illegal immigrants who are taking Americans jobs are at least somewhat responsible for our current economic problems; a modest increase from 49% in 2012.
There is bipartisan agreement that outsourcing jobs and China’s unfair trade practices are responsible for America’s economic problems, but that’s where partisan agreement ends. Democrats (88%) are more likely than independents (75%) and Republicans (67%) to say that the lack of fair wages paid by corporations is at least somewhat responsible for current economic problems. Conversely, Republicans (88%) are more likely than independents (68%) and Democrats (57%) to say that overregulation of business is a source of America’s economic problems. Republicans (70%) and Tea Party members (72%) are much more likely than independents (53%) and Democrats (45%) to say illegal immigrants are somewhat or very responsible for the country’s economic problems.
There are also stark divisions by race and social class on the issue of whether illegal immigrants who take American jobs are responsible for America’s current economic problems. Majorities of white (58%) and black Americans (52%) say illegal immigrants are at least somewhat responsible for America’s current economic woes, compared to 40% of Hispanic Americans. But there is a sizable class gap among white Americans. Roughly two-thirds (66%) of white working-class Americans say illegal immigrants are at least somewhat responsible for America’s current economic conditions, compared to fewer than half (44%) of white college-educated Americans.
Are America’s Best Days Ahead or Behind?
Americans have become more pessimistic about the country’s future than they were just a few years earlier. Today, Americans are evenly divided over whether America’s best days are ahead of us (49%) or behind us (49%). In 2012, a majority (54%) of the public said that America’s best days were ahead, while fewer than four in ten (38%) said that they were behind.
 The extent to which Americans express pessimism about the future varies widely by race, social class, religious affiliation, and political affiliation. Six in ten (60%) black Americans and a majority (56%) of Hispanic Americans say that America’s best days are still to come, while fewer than half (47%) of white Americans agree. A majority (52%) of white Americans say America’s best days are behind us. There are substantial differences of opinion among whites by social class. Only about four in ten (42%) white working-class Americans say that America’s best days are still to come, compared to 56% who say they are in the past. Conversely, a majority (53%) of white college-educated Americans see America’s best days ahead of us.
Perceptions about America’s future vary by religious affiliation. Among religious groups, white evangelical Protestants and white mainline Protestants are markedly more pessimistic than other groups, with majorities believing that America’s best days are behind us (60% and 55%, respectively). In contrast, majorities of Americans who are affiliated with non-Christian religions (55%), Catholics (56%), black Protestants (57%), and religiously unaffiliated Americans (58%) all believe America’s best days are ahead of us.
Views about America’s future are strongly impacted by political affiliation. Roughly six in ten (59%) Democrats—including 61% of white Democrats—say America’s best days are ahead of us. Fewer than half (47%) of independents and only about four in ten (41%) Republicans believe that America’s best days are still to come; nearly six in ten (58%) Republicans say that America’s best days are behind us. No group expresses greater pessimism about America’s future than members of the Tea Party. Only one-third (33%) of Tea Party members say that the country’s best days lie ahead, while about two-thirds (65%) say they are in the past. Among political subgroups, Tea Party members have experienced the largest swing in opinion over the last few years. In 2012, Tea Party members were more divided in their views: 42% believed America’s best days were ahead, while 47% said America’s best days were behind it.
Problems in Local Communities
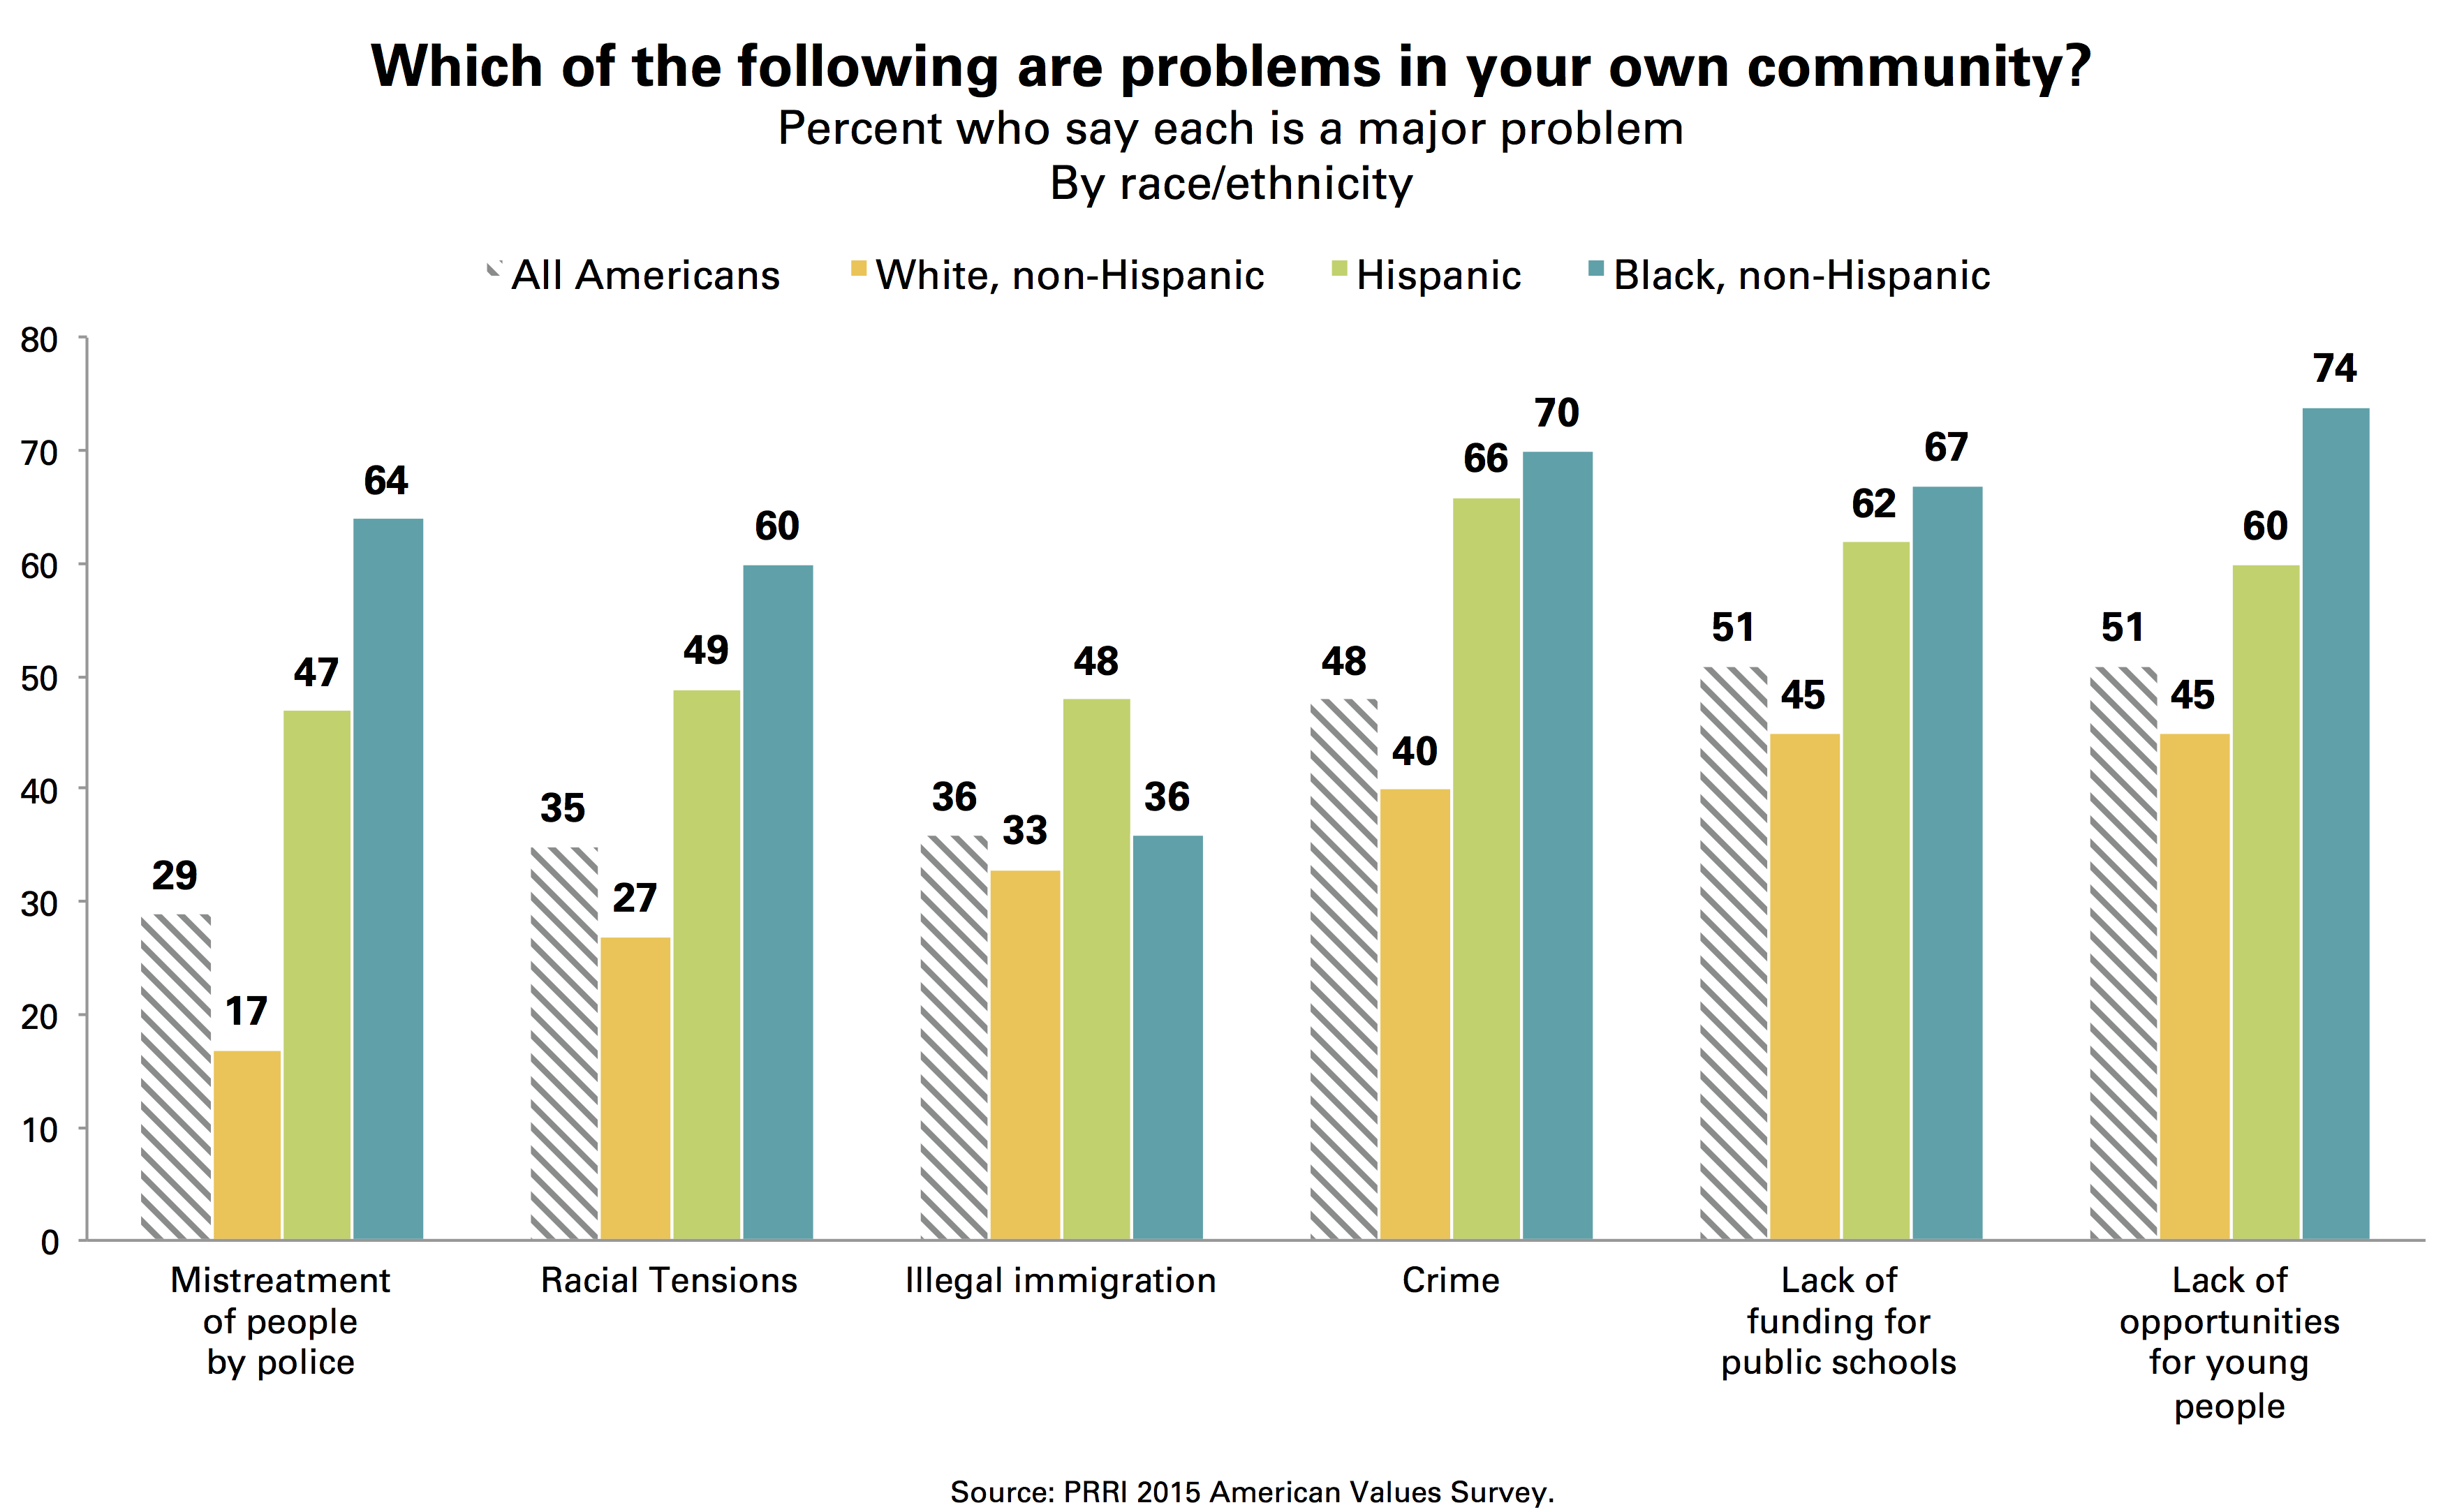
Americans’ increasing pessimism about the direction of the country is reflected in their views about prevalent problems within their local communities. Roughly half of Americans say that a lack of funding for public schools (51%), a lack of opportunities for young people (51%), and crime (48%) are major problems in their communities. More than one-third cite racial tensions (35%) and illegal immigration (36%) as major problems. Twenty-nine percent say that the mistreatment of people by the police is a major problem in their community.
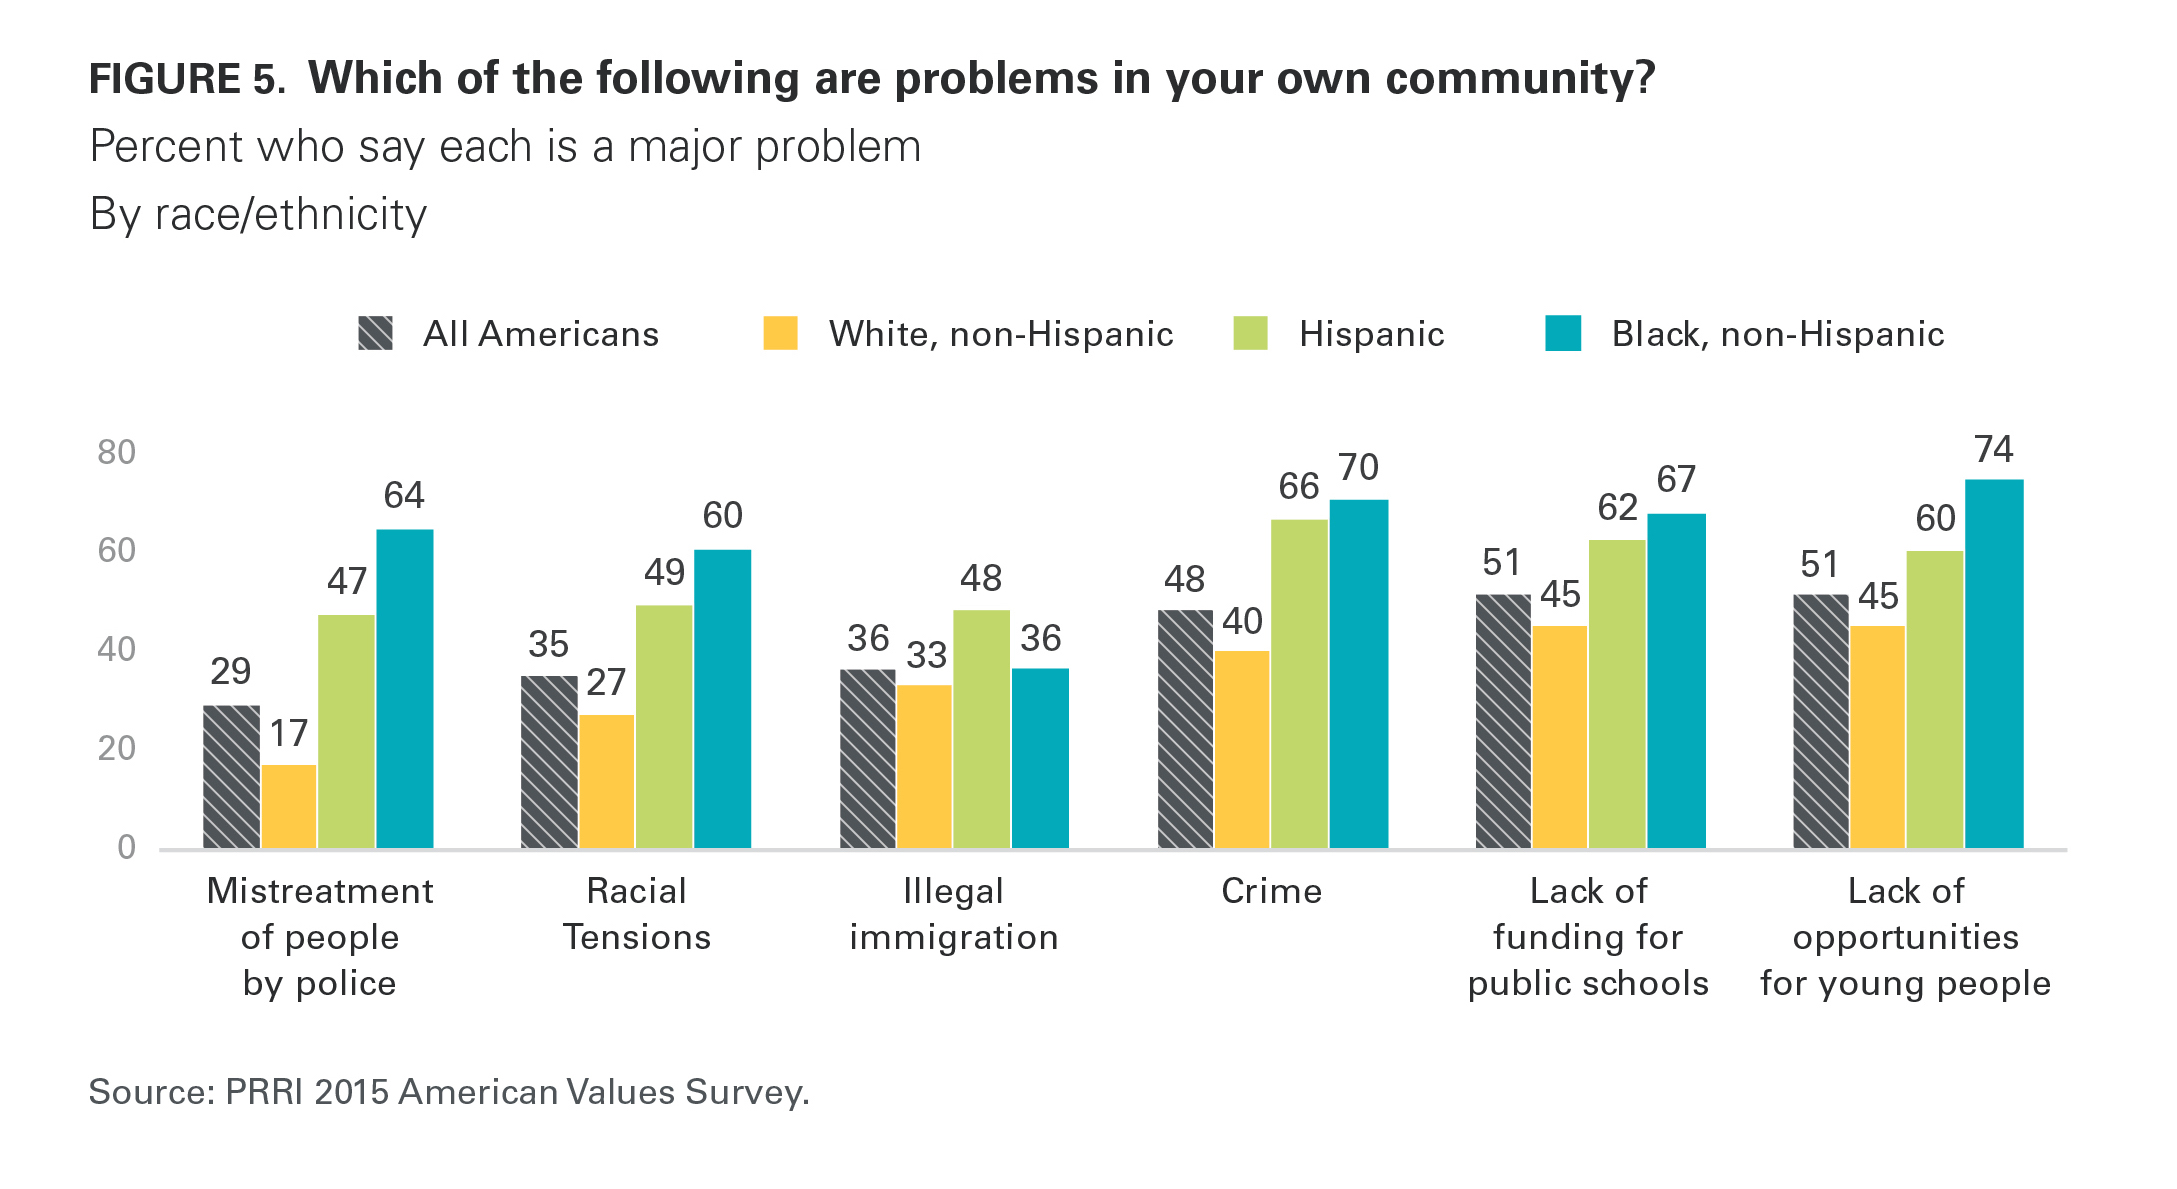
The number of Americans citing crime, racial tensions, and illegal immigration as major problems increased substantially between 2012 and 2015. The number of Americans saying crime is a major problem in their community jumped 15 percentage points (up from 33% to 48%), while the number of Americans saying racial tensions are a major concern jumped 18 percentage points (from 17% to 35%). The number of Americans saying illegal immigration is a major problem ticked up 8 percentage points (from 28% to 36%).
The experiences of Americans at the local level are notably different across lines of race, ethnicity, and social class. Nearly three-quarters (74%) of black Americans and six in ten (60%) Hispanic Americans say that a lack of opportunities for young people is a major problem in their community, compared to fewer than half (45%) of white Americans. At least six in ten black (67%) and Hispanic Americans (62%) say that a lack of funding for public schools is a major problem, compared to fewer than half (45%) of white Americans. Black Americans (60%) are also more likely than Hispanic (49%) and white Americans (27%) to cite racial tensions as a major problem in their community. Large majorities of black (70%) and Hispanic Americans (66%) say crime is a major problem in their community, compared to only four in ten (40%) white Americans. Among white Americans, however, there are notable differences by social class. Close to half (45%) of white working-class Americans say crime is a major problem in their community, compared to only one-third (33%) of white college-educated Americans.
Concerns about police mistreatment also vary starkly by race and ethnicity. Nearly two-thirds (64%) of black Americans say police mistreatment of people is a major problem in their community, a view shared by close to half (47%) of Hispanic Americans but only 17% of white Americans.
Rising Concerns about Fairness of Economic System, Equal Opportunity
Fairness of Economic System, Corporations
Americans across the political spectrum and from all walks of life are deeply concerned that the American economic system is not fair. What’s more, concerns about the fairness of the economic system have increased significantly over the past year.
There is widespread agreement that the current economic system is heavily tilted in favor of the wealthy. Nearly eight in ten (79%) Americans agree that the economic system unfairly favors the wealthy, compared to roughly one in five (21%) who disagree. Current views represent an increase of 13 percentage points from 2012, when 66% of Americans agreed.
Nine in ten (90%) Democrats, eight in ten (80%) independents, and more than six in ten (63%) Republicans agree that America’s economic system unfairly favors the wealthy. Americans who identify with the Tea Party are more divided (52% agree, 45% disagree).
Consistent with these views, negative feelings toward large business corporations in the U.S. have also increased in recent years. Eighty-four percent of Americans agree that business corporations do not share enough of their success with their employees, compared to 15% who disagree. These negative views are up 15 percentage points from the previous year, when 69% of the public agreed that American businesses were not sharing enough of their profits with their workers. There is broad agreement with this assessment across a range of demographic groups.
Equal Opportunity
Nearly two-thirds (65%) of Americans believe that “one of the big problems in this country is that we don’t give everyone an equal chance in life,” while fewer than three in ten (28%) believe that “it is not really that big a problem if some people have more of a chance in life than others.” Concerns about the lack of equal opportunity have increased considerably since 2010, when 53% said that one of the big problems in the U.S. was the lack of equal opportunities for all.
American attitudes about the importance of equal opportunity vary significantly by race, ethnicity, and social class. Nearly nine in ten (87%) black Americans and roughly three-quarters (73%) of Hispanic Americans say that a lack of equal opportunity is a major problem in the country. Six in ten (60%) white Americans also agree that this represents one of the big problems in the country. However, there are important class divisions among white Americans on views about economic opportunity. Nearly two-thirds (64%) of white working-class Americans say the fact that not everyone is given an equal chance in life is a big problem, a view shared by significantly fewer (55%) white college-educated Americans.
There is also considerable variation across political groups. More than eight in ten (81%) Democrats and roughly two-thirds (66%) of independents believe that unequal opportunities are a big problem in the U.S. Republicans and Tea Party members are evenly divided on this question: only about four in ten Republicans (43%) and Tea Party members (42%) say that the lack of equal opportunity presents a major problem, while about half of Republicans (49%) and Tea Party members (46%) say it is not really that big a problem.
Younger Americans (age 18-29) are much more likely than seniors (age 65 and older) to say that unequal opportunities are one of the big problems in the country (72% vs. 55%, respectively).
Hard Work and Success
The public today remains less confident that hard work is the key to economic success. Nearly two-thirds (64%) of Americans agree that hard work is no guarantee of success, while more than one-third (35%) disagree. Current sentiments represent a 10-point increase since 2013, when 54% of Americans agreed with this statement.
There are stark differences along party lines on this question. More than seven in ten (71%) Democrats and two-thirds (67%) of independents agree that hard work does not necessarily ensure success for most people. In contrast, roughly half of Republicans (52%) and Tea Party members (49%) agree that hard work does not always yield success.
Views about the efficacy of hard work also vary substantially by social class, but notably not by race or ethnicity. Nearly two-thirds of white (64%), black (64%), and Hispanic Americans (66%) agree that hard work does not guarantee success for most people. White working-class Americans are somewhat more likely than white college-educated Americans to agree that working hard does not necessarily lead to success (68% vs. 58%, respectively).
The Economic Inequity Index
In order to provide an overall measure of Americans’ attitudes about economic fairness, we created an Economic Inequity Index (EII), built as an additive scale using three questions:(4)
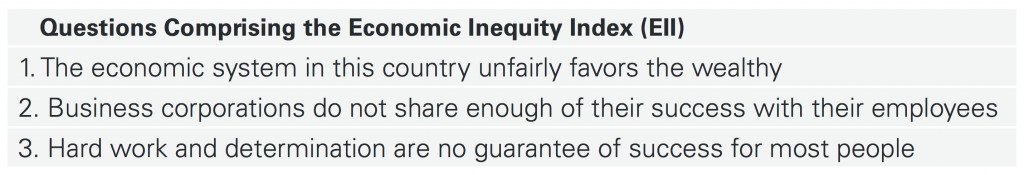
A higher score on the Economic Inequity Index (EII) indicates that a respondent generally believes that the economic system in the country is unfair, while a low score on the EII indicates that a respondent generally believes that the economic playing field is fairly even. Nearly half (48%) of Americans perceive a great amount of inequity in the economic system, scoring very high on the EII. About one in five (21%) score high, 20% register medium scores, and 11% score low on the EII.
 There are modest differences by race. Black Americans are more likely than white Americans to register very high scores on the EII, believing the economic system is unfair (57% vs. 46%, respectively). Notably, there are only modest class differences among whites on the EII. Women are also slightly more likely than men to score very high on the EII scale (51% vs. 45%, respectively).
The EII reveals a striking partisan divide. Democrats (61%) are about twice as likely as Republicans (33%) and members the Tea Party (29%) to perceive a great amount of unfairness in the economic system (very high scores on the EII). Independents closely mirror the general population on the scale.
Americans who believe the economic playing field is mostly level (low scores on the EII) are significantly more likely than those who score very high to hold favorable views of the Tea Party (51% vs. 18%, respectively) and to say that they most trust Fox News to give them accurate information about politics and current events (34% vs. 10%, respectively).
Americans who perceive a large degree of unfairness in the economic system have dramatically different issue priorities than those who do not. For example, among Americans who perceive a very high degree of economic unfairness, nearly two-thirds (64%) say that the growing gap between the rich and the poor is a critical issue and 60% say the cost of education is a critical issue. By contrast, among Americans who believe the economic playing field is level (low scores on the EII), only 21% say the gap between the rich and poor is a critical issue and only 32% say the cost of education is a critical issue.
More than eight in ten (82%) Americans who perceive very high levels of unfairness in the economic system say that one of the big problems in the country is that not everyone has an equal chance in life, compared to only 27% of those who see a level playing field (low scores on the EII). Those who fall in the middle category of the EII are more divided, with nearly half (49%) saying that a lack of equal opportunity is one of the country’s big problems, and 40% saying the opposite.
Economic Policies
In the current climate of economic pessimism, Americans express broad and increasing support for several populist economic policies, such as raising the minimum wage, paid sick leave, and paid parental leave in the workplace.
Raising the Minimum Wage: $10.10 vs. $15
More than three-quarters (76%) of the public supports raising the minimum wage from $7.25 to $10.10 per hour. Support has ticked up slightly since last year, when 69% of Americans expressed support for raising the minimum wage to $10.10 per hour.
Although much of the debate at the national level has focused on increasing the minimum wage to $10.10, in certain localities the debate has centered on raising the hourly rate to $15. Nearly six in ten (59%) Americans express support for raising the minimum wage to $15 per hour, but there is less agreement, especially across political party lines, about the larger wage hike.
Roughly equal numbers of Democrats favor raising the minimum wage to $10.10 as they do to $15 (91% vs. 84%, respectively). Independents are somewhat more likely to favor a $10.10 wage hike than one that goes to $15 (72% vs. 58%, respectively). Among Republicans, the gap in support grows even larger: while six in ten (60%) Republicans support raising the minimum wage to $10.10, fewer than one-third (32%) say they favor raising it to $15.
Americans who perceive the highest amount of unfairness in the economic system (high scores on the EII) are also more likely than those who believe the economic playing field is level to support raising the minimum wage to $15 per hour (73% vs. 28%, respectively).
Paid Sick and Parental Leave
Americans overwhelmingly support requiring companies to provide all full-time employees with paid sick days if they or an immediate family member gets sick, and requiring companies to provide all full-time employees with paid leave for the birth or adoption of a child. Eighty-five percent of Americans favor paid sick leave and 82% support paid parental leave.
While majorities of Americans across all categories of the Economic Inequity Index (EII) support populist workplace policies, the intensity of support varies. Those who perceive a very high amount of economic unfairness (high scores on the EII) are more likely than those who believe the economic playing field is level (low scores on the EII) to support mandatory paid sick days (93% vs. 64%, respectively) and paid parental leave for the birth or adoption of a child (89% vs. 62%, respectively).
III. Cultural Change
Changes in American Culture Since the 1950s
Americans are divided about the direction that American society and way of life have taken since the 1950s. A majority (53%) of Americans say that American culture and way of life has mostly changed for the worse since the 1950s, compared to 46% who say it has changed for the better.
Perceptions about cultural shifts since the 1950s divide Americans across a number of demographic groups. Six in ten (60%) black Americans and a majority (54%) of Hispanic Americans believe that American culture has mostly changed for the better since the 1950s. In contrast, only 42% of white Americans agree, and 57% say that the American way of life has mostly changed for the worse over the last sixty years. However, there are notable differences among whites by class. More than six in ten (62%) white working-class Americans say that American culture has gotten worse since the 1950s, while fewer than half (49%) of white college-educated Americans agree. Notably, the views of white men and white women are nearly identical.
There are substantial partisan differences in views about cultural change since the 1950s. While a majority of independents (56%), Republicans (67%), and members of the Tea Party (72%) say American culture and way of life has gotten worse since the 1950s, only 40% of Democrats believe things have gotten worse and 59% of Democrats believe American culture has changed for the better.
The Declining Influence of White Men
Americans are divided over whether white men are losing influence over American culture. A slim majority (51%) agree that white men’s influence has waned, while nearly half (47%) do not believe there has been any decline.
Not surprisingly, non-white and white Americans hold very different opinions on this question. While a majority of white Americans (55%) believe white men are facing a decline of cultural influence in American society, fewer than half of black (46%) and Hispanic Americans (42%) agree. Notably, there are only modest gender differences among whites, with white men more likely than white women to perceive a loss of influence (59% vs. 51%, respectively).
Concerns about cultural changes since the 1950s are significantly related to perceptions of the declining influence of white men. Nearly six in ten (58%) Americans who believe that the American culture has changed for the worse since the 1950s also agree that white men are losing influence.
Concerns about Immigrants and Muslims
Rising Concern about Immigrants
 Over the past couple of years, attitudes toward immigrants have become increasingly negative. Today, Americans are evenly divided as to whether immigrants strengthen the country because of their hard work and talents (47%) or whether they constitute a burden on the U.S. because they take jobs, housing, and health care (46%). This current split reflects a drop in positive sentiment since last year, when nearly six in ten (57%) Americans said immigrants strengthen our culture and only 35% said they burden it.
Democrats and Republicans hold mirror opposite views about the contributions of immigrants. By a margin of approximately two-to-one, Democrats are more likely to say that immigrants strengthen the country than to say that immigrants are a burden to the country (63% vs. 32%, respectively). By a similar margin, Republicans are more likely to say the opposite—that immigrants burden the country as opposed to strengthen it (66% vs. 26%, respectively). Notably, views of the Tea Party do not differ significantly from Republicans overall.
Compared to a few years earlier, Americans also currently report less tolerance when encountering immigrants who do not speak English. Nearly half (48%) of Americans agree that they are bothered when they come into contact with immigrants who speak little or no English, compared to 51% who disagree. Negative feelings about immigrants have increased since 2012, when only four in ten (40%) Americans reported that coming into contact with non-English speaking immigrants bothered them.
There are major differences in how Americans view immigrants by race, ethnicity, and class. A majority (55%) of white Americans report being bothered when they come into contact with immigrants who speak little or no English, while only 40% of black Americans and about three in ten (28%) Hispanic Americans agree. Roughly six in ten (59%) black Americans and more than seven in ten (71%) Hispanic Americans say they disagree with the statement.
A considerable gap exists among whites by social class. More than six in ten (63%) white working-class Americans say they feel bothered when they come into contact with immigrants who do not speak English, compared to 43% of white college-educated Americans. The views of white college-educated Americans much more closely resemble those of black Americans than those of the white working class.
Views of immigrants also tend to divide Americans by generation. Only about one-third (36%) of young adults (age 18–29), compared to a majority (55%) of seniors (age 65 and older), say that it bothers them when they come across immigrants who speak little or no English.
The Compatibility of American Culture and Islam
Americans’ perceptions of Islam have turned sharply more negative over the past few years. Today, a majority (56%) of Americans say the values of Islam are at odds with American values and way of life, while roughly four in ten (41%) disagree. In 2011, Americans were divided in their views of Islam (47% agreed, 48% disagreed).
Perceptions of Islam vary substantially by race, ethnicity, and class. Roughly six in ten (61%) white Americans agree that Islam is at odds with American values, while fewer than four in ten (37%) disagree. Black (48% agree, 47% disagree) and Hispanic Americans (46% agree, 49% disagree) are divided in their opinions of Islam. However, there are notable differences among whites by social class. Two-thirds (67%) of white working-class Americans agree that Islam is incompatible with American values and way of life, while white college-educated Americans are evenly divided (50% agree, 50% disagree).
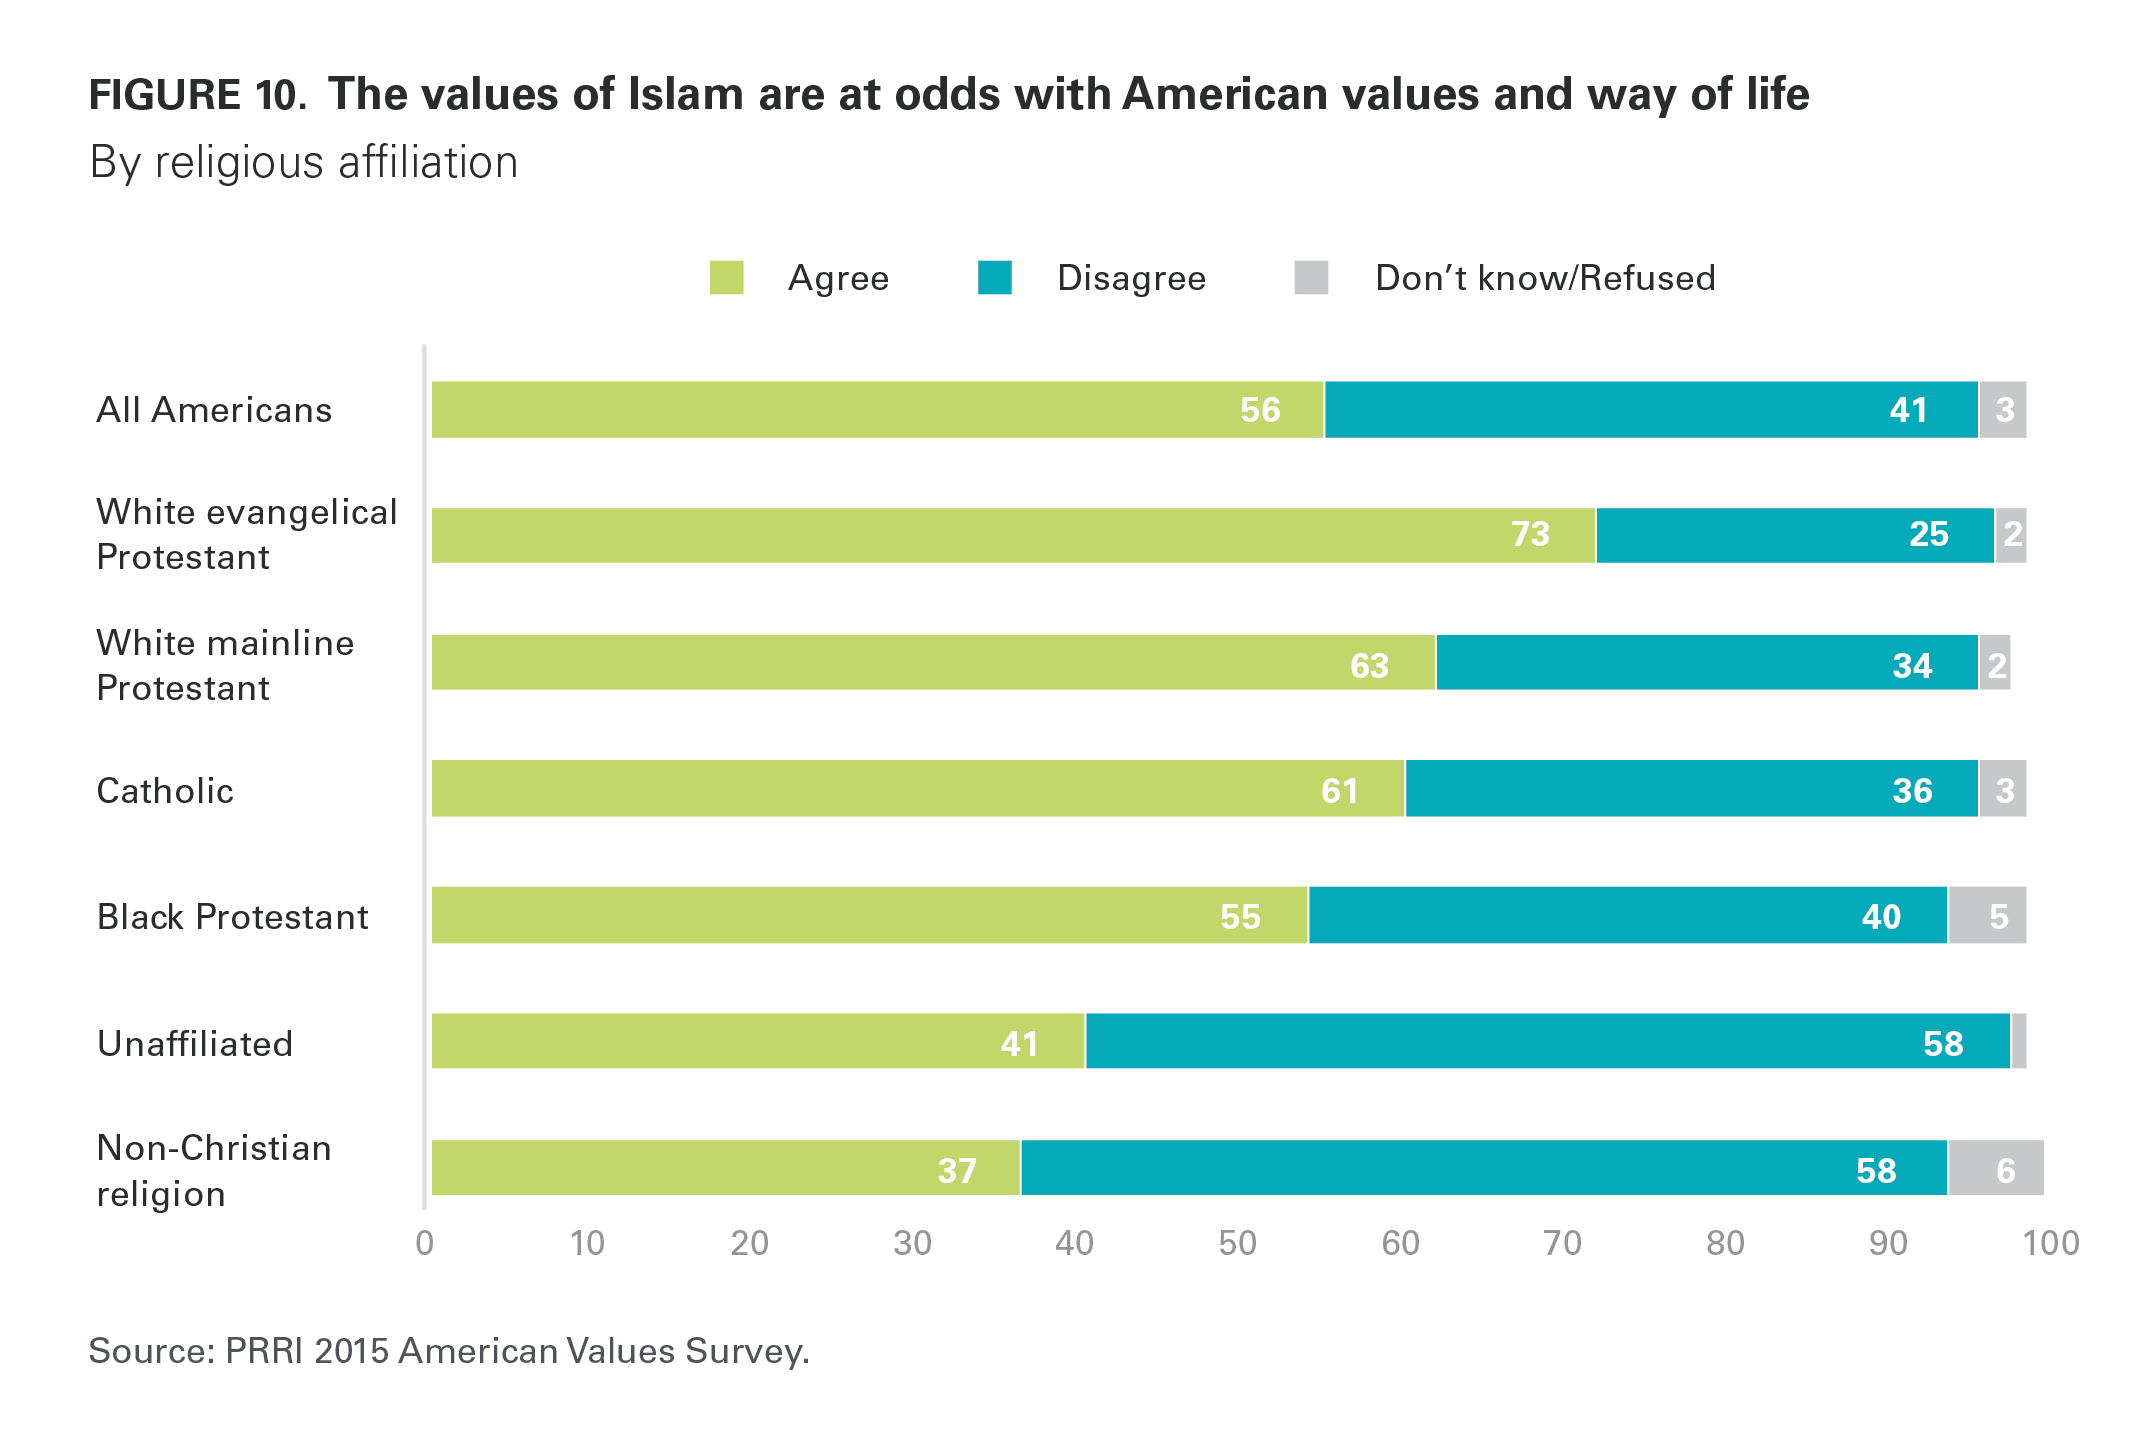
Majorities of every major Christian religious group say that Islam is incompatible with American values and way of life, including 73% of white evangelical Protestants, 63% of white mainline Protestants, 61% of Catholics, and 55% of black Protestants. By contrast, among Americans who identify with non-Christian religious groups (including Jews, Muslims, Hindus, Buddhists, and other world religions), only 37% agree, while 58% disagree. Religiously unaffiliated Americans are also far less likely to believe that Islam is incompatible with American values (41% agree, 58% disagree).
Americans’ perspectives on Islam are also strongly influenced by their political leanings. A majority of independents (57%), and more than three-quarters of Republicans (76%) and Tea Party members (77%), agree that Islam is at odds with American values and way of life. Nearly six in ten (57%) Tea Party members strongly agree with this statement. By contrast, only 43% of Democrats say that Islam is incompatible with American culture, compared to 52% who disagree.
IV. American Institutions and Government: Confidence and Representation
Confidence in Institutions
There is a wide disparity in the public’s confidence in major institutions in the country. While majorities of the public report having a great deal or some confidence in the police (75%), the criminal justice system (62%), and organized religion (55%), no more than half say they have a great deal or some confidence in the federal government (50%), news organizations (47%), and large business corporations (46%).
There are large racial disparities in attitudes toward the police and the criminal justice system. More than eight in ten (83%) white Americans say they have a great deal or some confidence in the police, compared to roughly seven in ten (69%) Hispanic Americans and fewer than half (48%) of black Americans. A slim majority (52%) of black Americans say they have little or no confidence in the police. Similar racial gaps appear in views of the criminal justice system. Two-thirds (67%) of white Americans and six in ten (60%) Hispanic Americans report having at least some confidence in the criminal justice system. Most (55%) black Americans say they have little or no confidence at all in the criminal justice system; only 44% have at least some confidence in the criminal justice system.
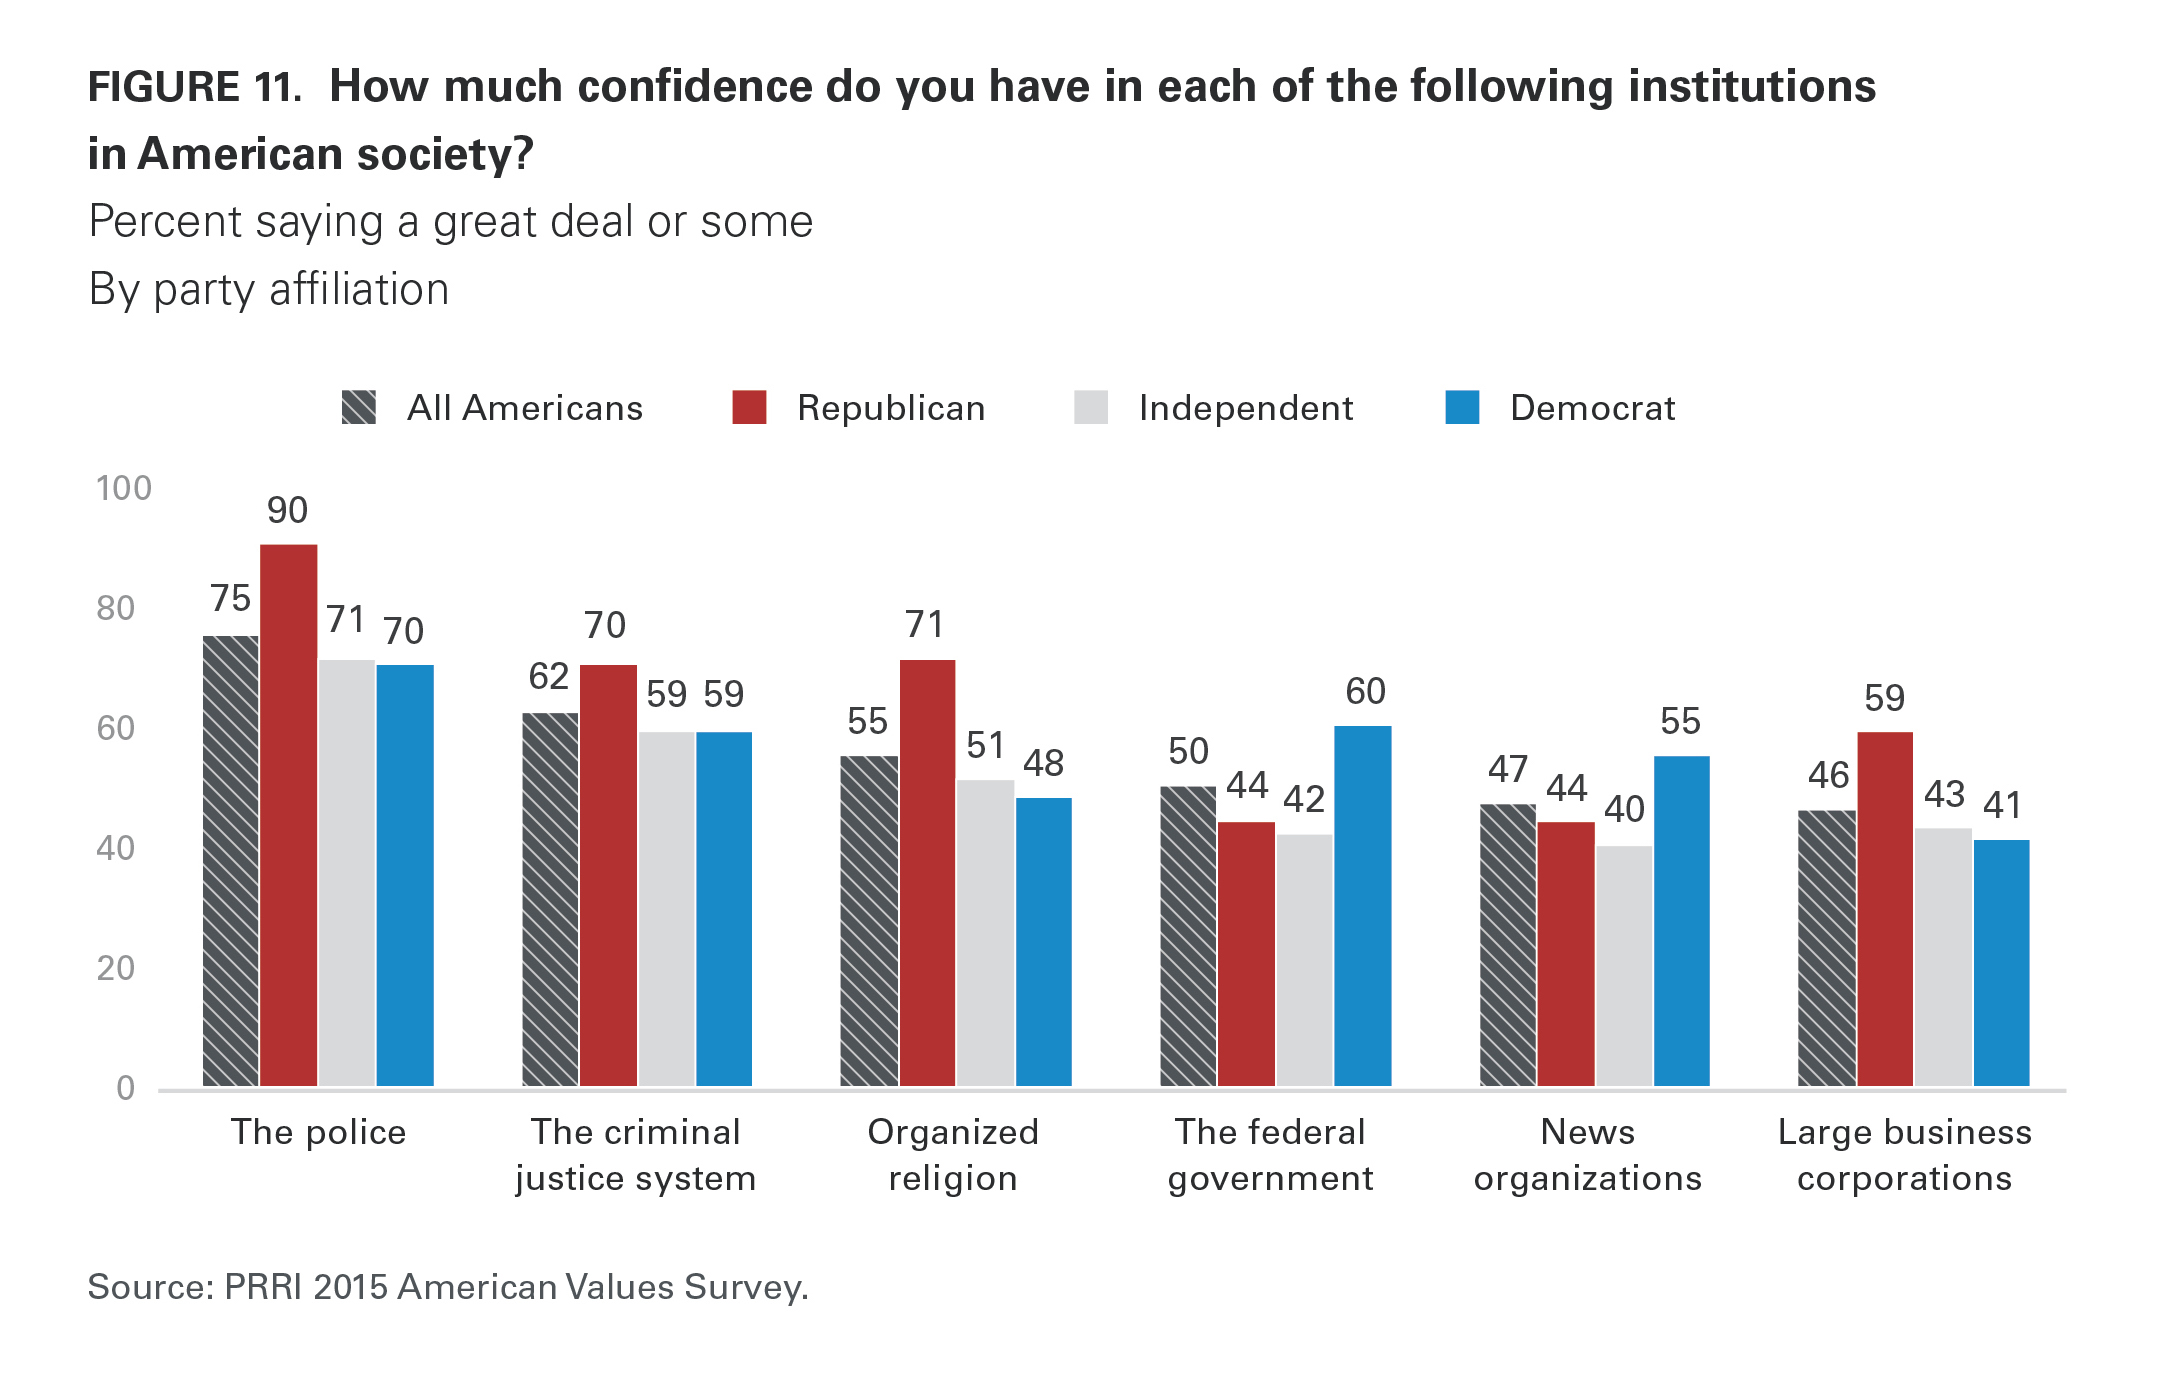
The degree of confidence that Americans have in public institutions also varies according to political affiliation. A majority of Democrats report having a great deal or some confidence in the federal government (60%) and news organizations (55%). In contrast, fewer than half of independents (42%), Republicans (44%), and members of the Tea Party (33%) say they trust the federal government. Similarly, only about four in ten independents (40%), Republicans (44%), and Tea Party members (37%) say they have at least some confidence in news organizations. However, when it comes to large business corporations, the partisan pattern reverses. Roughly six in ten Republicans (59%) and members of the Tea Party (61%) have at least some confidence in large business corporations, a sentiment shared by only about four in ten Democrats (41%) and independents (43%).
Public confidence in organized religion varies starkly by age and religious affiliation. Six in ten (60%) seniors (age 65 and older) say they have at least some confidence in organized religion, while fewer than four in ten (37%) say they have little or no confidence. In contrast, fewer than half (48%) of young adults (age 18-29) say they have at least some confidence in organized religion, while slightly more than half (51%) report having little or no confidence in organized religion.
A majority of most major religious groups report having at least some confidence in organized religion, including white evangelical Protestants (76%), Catholics (69%), black Protestants (64%), and white mainline Protestants (59%). Conversely, fewer than one in five (16%) religiously unaffiliated Americans express confidence in organized religion, while more than eight in ten (83%) say they have little or no confidence.
Confidence that Voting Matters
Nearly two-thirds (64%) of Americans agree that their vote does not matter because of the influence that wealthy individuals and big corporations have on the electoral process. Fewer than four in ten (36%) Americans disagree. There are notable divisions by race, class, and generation.
Black and Hispanic Americans are more likely than white Americans to be discouraged by the influence of powerful interests. Roughly three-quarters (74%) of Hispanic Americans and about two-thirds (66%) of black Americans agree that their vote does not matter because of the influence of wealthy interests. More than six in ten (61%) white Americans say their vote is unlikely to make a difference given the influence of wealthy individuals and businesses. White working-class Americans report greater pessimism than white college-educated Americans (66% vs. 55%, respectively).
Younger Americans, who are typically underrepresented in the electorate, are more inclined to believe their vote does not matter due to the influence of wealthy individuals and businesses. Nearly three-quarters (74%) of young adults (age 18-29) agree that their vote does not matter, a view shared by only 51% of seniors (age 65 and older). Nearly as many seniors (47%) disagree.
Whose Interests Does Government Look Out For?
The lack of confidence Americans express in the federal government may be related to the fact that few Americans believe it looks out for their interests very well. Only about four in ten (42%) Americans say the government looks out for the needs and interests of people like them either somewhat or very well, compared to nearly six in ten (57%) who say that government does not look out for their interests well. Notably, seniors (age 65 and older) are the only major demographic group in which a majority (55%) believe that the government looks out for their needs and interests at least somewhat well.
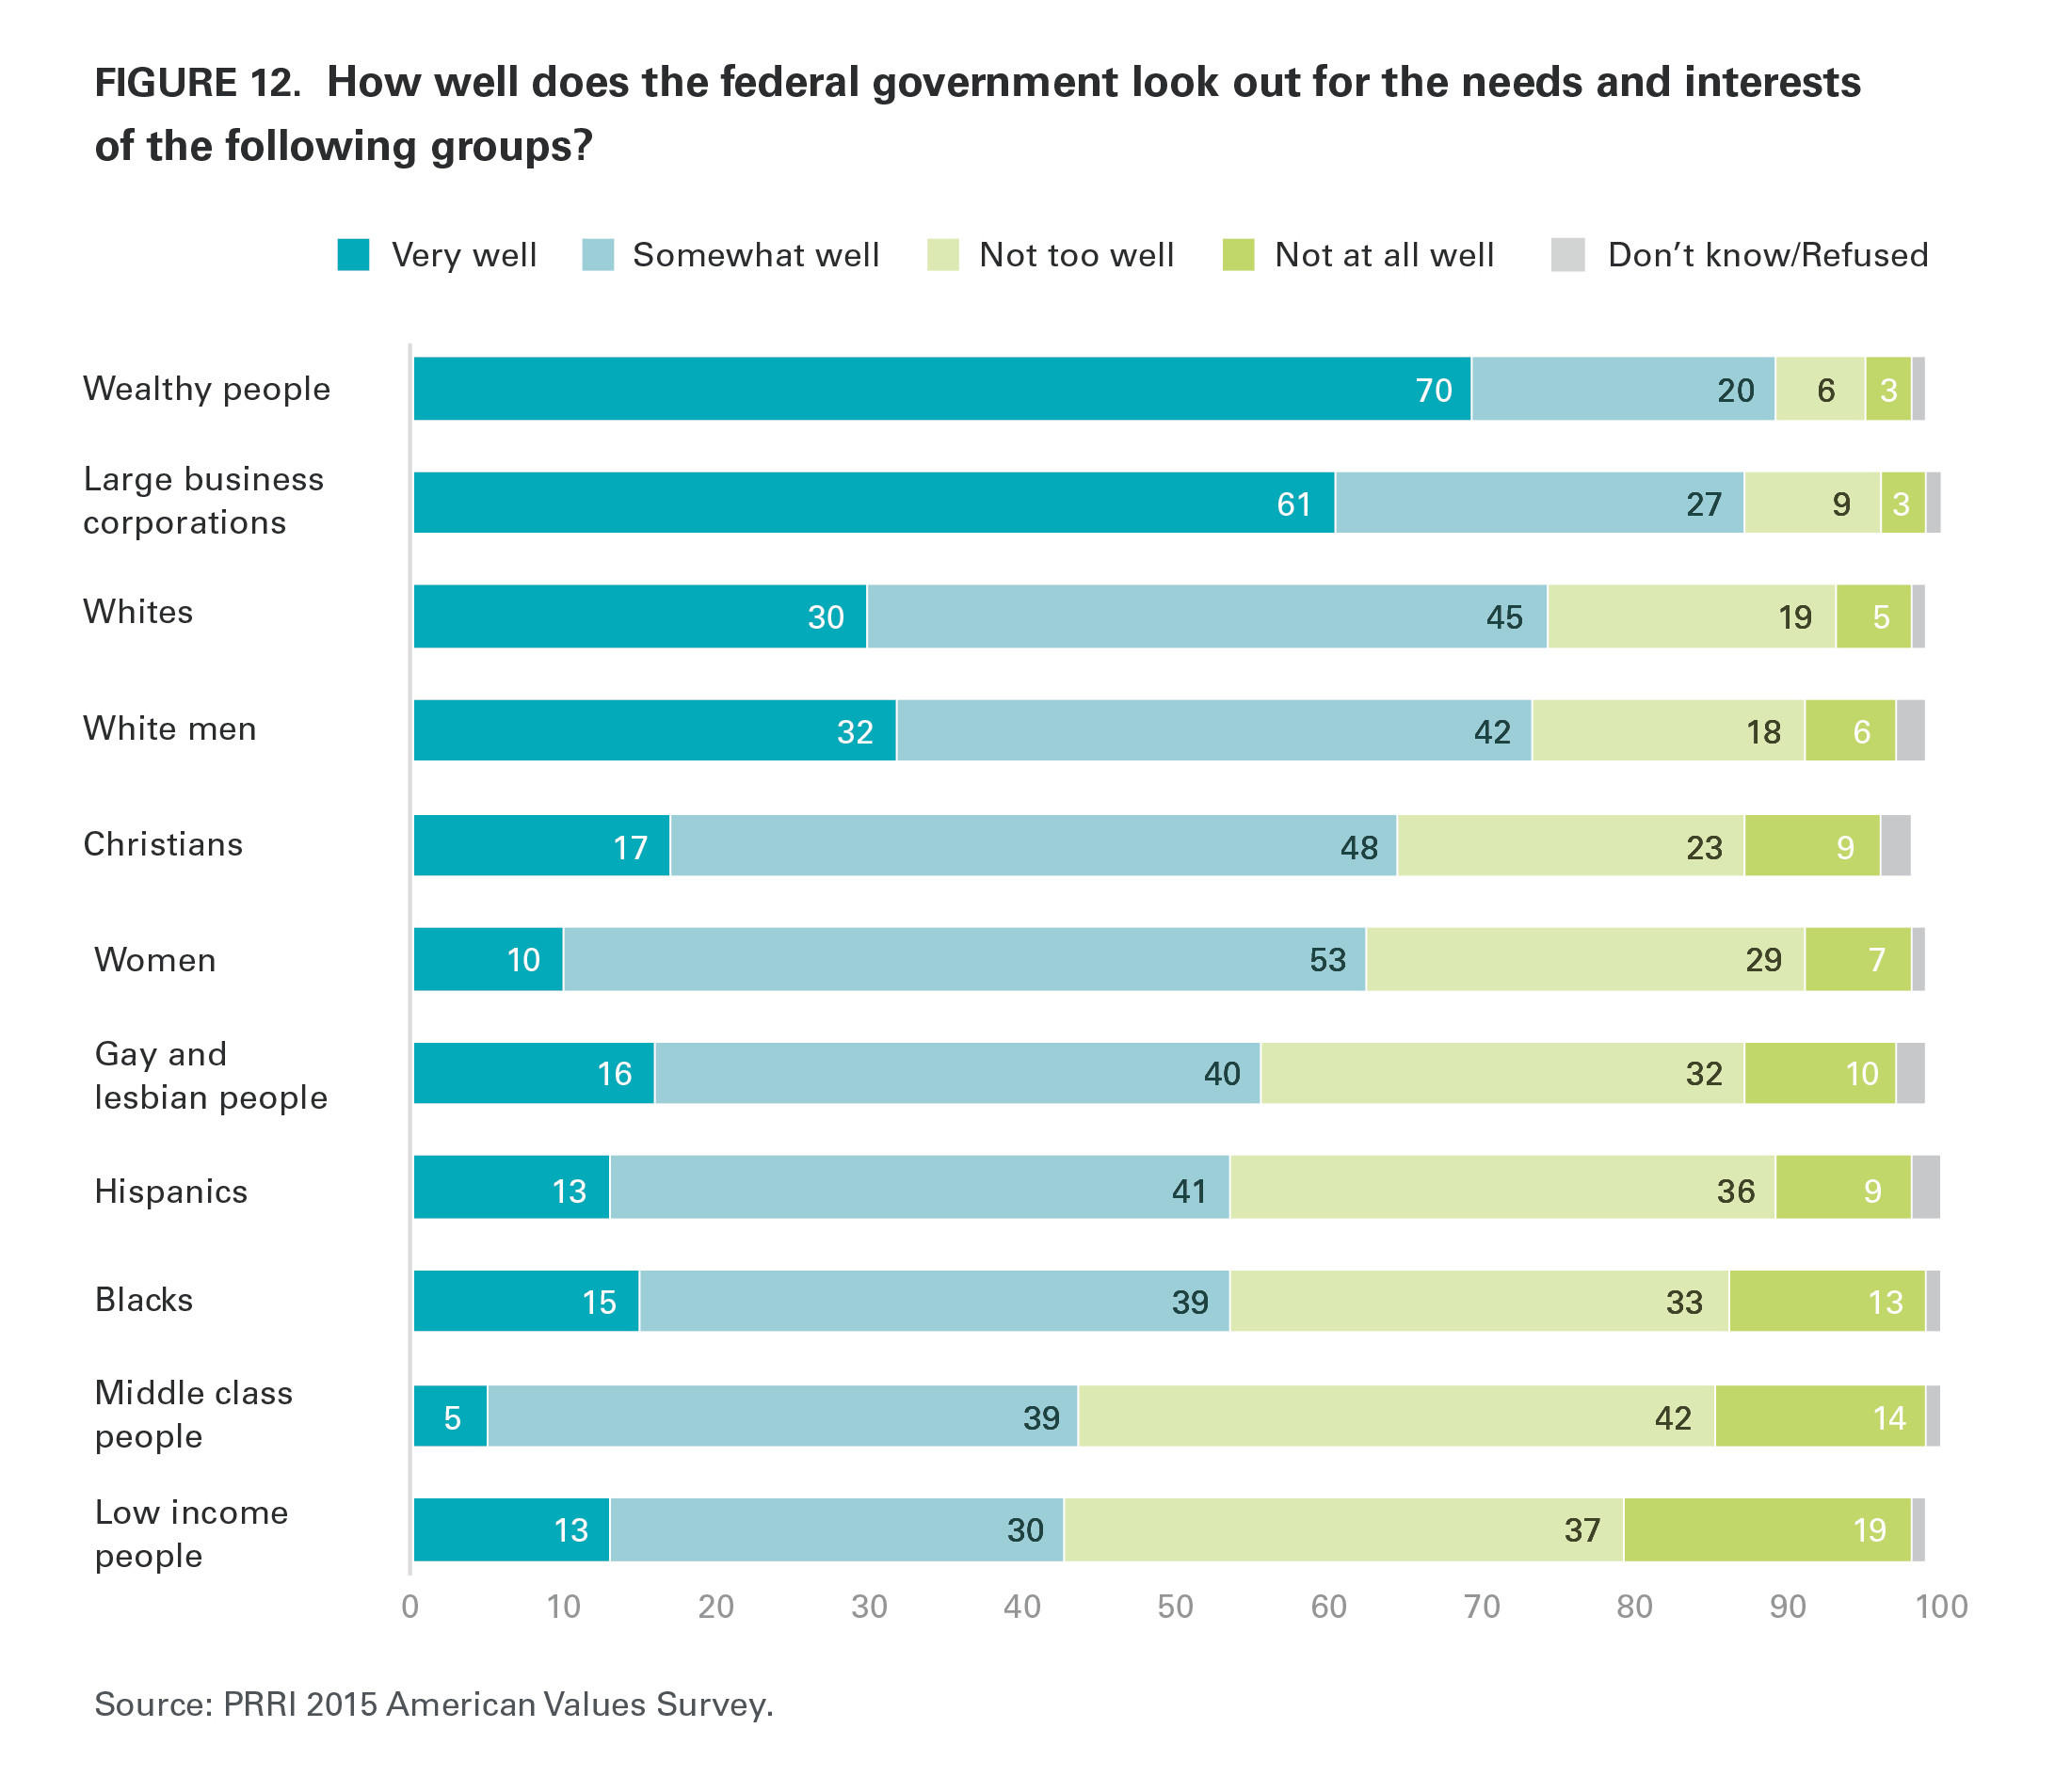
 When asked about specific groups, there is broad agreement that the government is looking out for the interests of wealthy Americans (90%) and large businesses (88%) somewhat or very well. Roughly three-quarters agree that the government looks out for whites (75%) and white men (74%) at least somewhat well. At least six in ten Americans say the needs and interests of Christians (65%) and women (63%) are well attended. Majorities agree that the government looks out for the needs of gay and lesbian people (56%), blacks (54%), and Hispanics (54%) at least somewhat well. Fewer than half of Americans say the government is looking out for the interests and needs of middle-class (44%) and low-income people (43%).
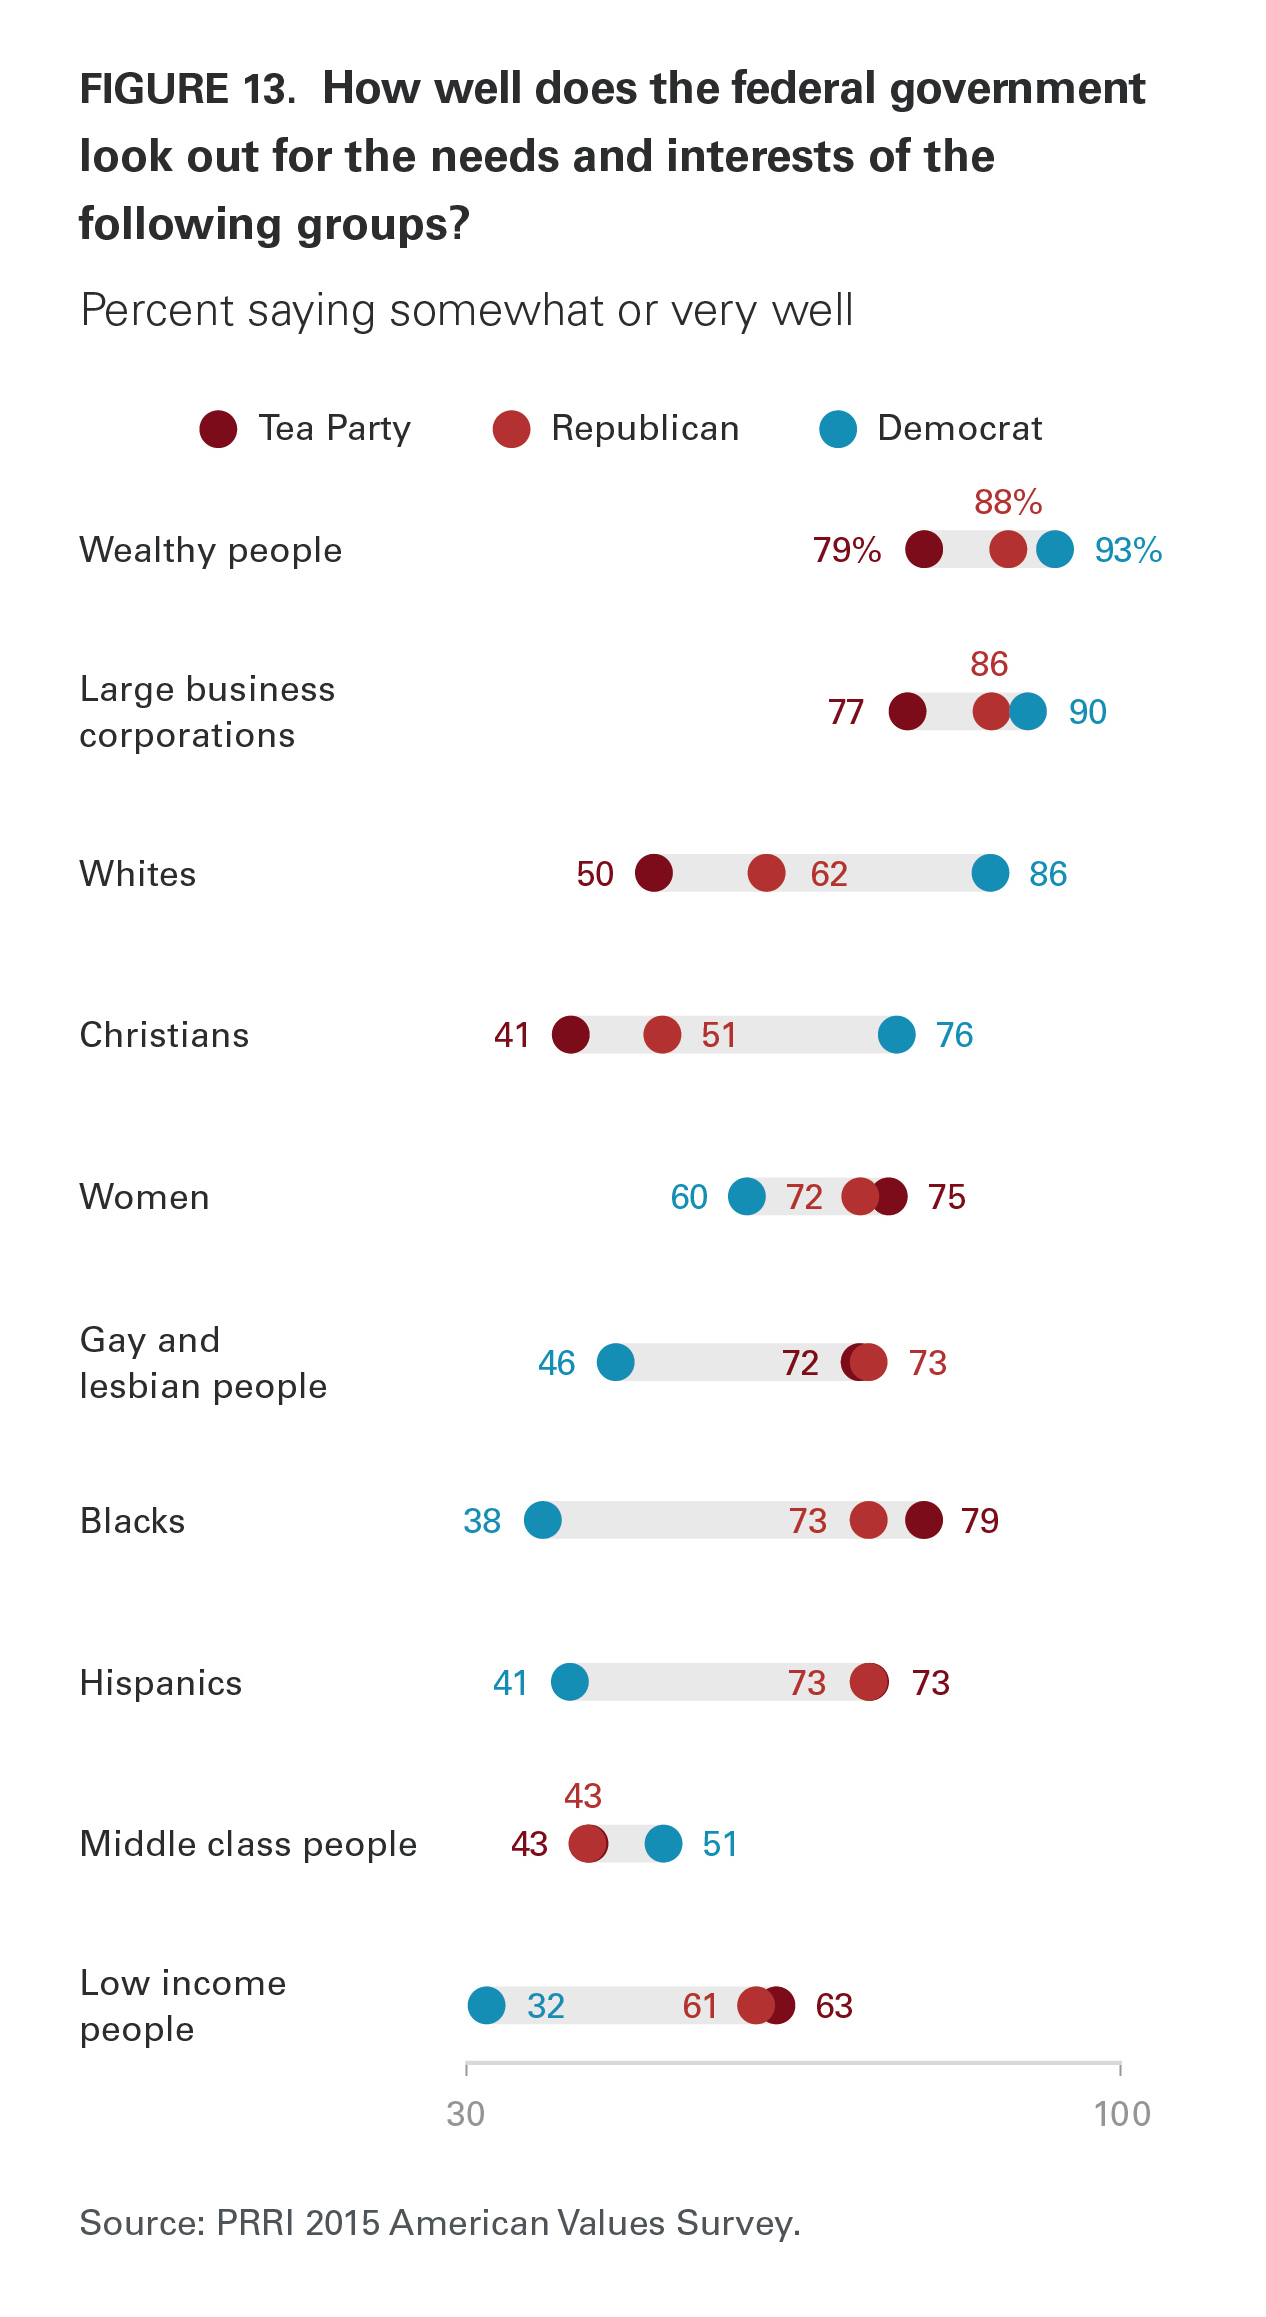
Democrats and Republicans hold starkly different views about the government’s focus. Roughly three-quarters of Republicans say that the government looks out for the needs of blacks (73%) and Hispanics (73%), while fewer than half of Democrats agree that government is looking out for the interests and needs of blacks (38%) and Hispanics (41%). Republicans are also about twice as likely as Democrats to say that government is looking out for the interests of low-income Americans (61% vs. 32%, respectively). Despite these differences, Democrats and Republicans largely agree that wealthy Americans (93% and 88%, respectively) and large business corporations (90% and 86%, respectively) are well taken care of by the government.
Americans who identify with the Tea Party perceive the government quite differently than other Americans. Among Tea Party members, more than seven in ten say that the government looks out for the interests of blacks (79%), wealthy people (79%), business corporations (77%), women (75%), Hispanics (73%), and gay and lesbian people (72%). More than six in ten (63%) Tea Party members say that the interests of low-income people are also well represented by government.
In contrast, relatively few Tea Party Americans believe that the government is addressing their own needs. Fewer than four in ten (37%) say that the government is looking out for the needs and interests of people like them. Similarly, only about four in ten Tea Party members say that the government is looking out for Christians (41%) and middle-class Americans (43%), and only half (50%) say the interests of whites are being represented.(5)
Who’s Better at Setting Government Priorities? Experts vs. Everyday Americans
Nearly two-thirds (66%) of the public agrees that, “everyday Americans understand what the government should do better than the so-called ‘experts.’” There is broad agreement across racial, generational, and partisan lines.
There are, however, notable divisions by social class and education. More than seven in ten (71%) white working-class Americans say that everyday Americans have a better understanding than the experts of what government should be doing. In contrast, white college-educated Americans are divided (51% agree, 49% disagree). Similarly, Americans with a high school education or less are much more likely than those with a post-graduate education to agree that government would be better off taking its instructions from everyday Americans (73% vs. 47%, respectively).
The Institutional Mistrust Index
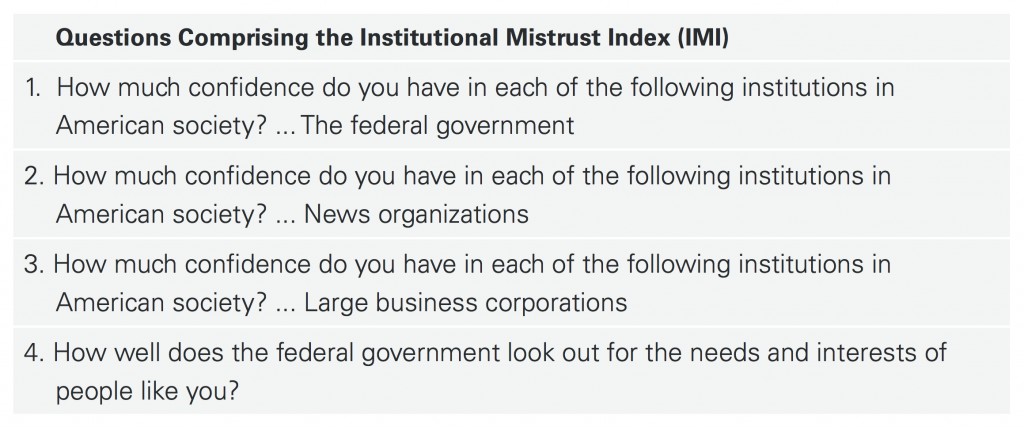
In order to provide a single composite measure of Americans’ confidence in major public and private institutions, we created the Institutional Mistrust Index (IMI), an additive scale that combines four distinct measures:(6)
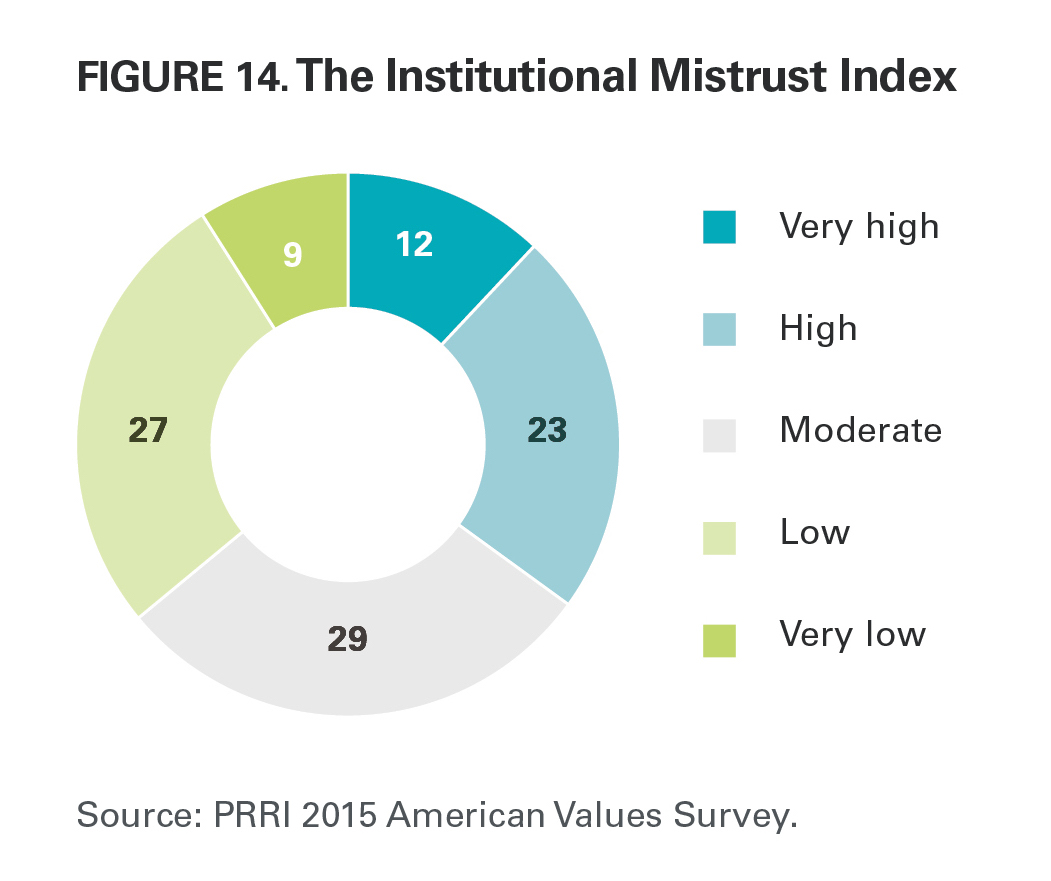 A higher score on the Institutional Mistrust Index (IMI) indicates that a respondent generally distrusts major institutions, while a low score on the IMI indicates that a respondent generally has confidence in major institutions. Americans are fairly evenly distributed across the scale. More than one-third of Americans express high levels of distrust of major institutions, scoring very high (12%) or high (23%) on the IMI. About three in ten (29%) fall into the moderate category, and more than one-third express significant trust in institutions, scoring low (27%) or very low (9%) on the scale.
There are modest racial differences on the IMI. Black and white Americans are equally likely to express high levels of distrust in institutions (high scores on the IMI) (32% vs. 36%, respectively). Black Americans are more likely than white Americans to have low scores on the IMI (45% vs. 34%, respectively). Among whites, white working-class Americans are more likely than white college-educated Americans to have high scores on the IMI (40% vs. 31%, respectively). Younger Americans are also significantly more likely than seniors to express high levels of distrust in institutions. Nearly four in ten (37%) Americans under the age of 30 score high on the IMI, compared to only 26% of seniors (age 65 and older).
Consistent with their less-engaged status, political independents (43%) are more likely to express high levels of distrust (high scores on the IMI) than either Republicans (35%) or Democrats (27%). Nearly half (46%) of those who identify as part of the Tea Party movement register a high level of mistrust in institutions.
Americans who highly distrust institutions (high scores on the IMI) are more likely than those who trust institutions (low scores on the IMI) to say that their vote does not matter because elections are controlled by wealthy people and large corporations (74% vs. 57%, respectively).
Americans with high levels of institutional mistrust (high scores on the IMI) are more likely than those who score low on the IMI to say they seldom or never attend religious services (42% vs. 35%, respectively). Similarly, only about four in ten (39%) Americans who express high levels of distrust, compared to 72% of Americans who score low on the IMI, say they have at least some confidence in organized religion.
Americans who highly distrust major institutions (high scores on the IMI) are significantly more likely than those who mostly trust major institutions (low scores on the IMI) to say that the federal government does not look out for the needs and interests of the middle class (77% vs. 34%, respectively) or low-income people (66% vs. 46%, respectively).
In terms of outlook, Americans who mistrust institutions (high scores on the IMI) hold a decidedly pessimistic outlook on America’s present and future. Two-thirds (66%) of those with high levels of mistrust say that American culture and way of life have changed for the worse since the 1950s, while six in ten (60%) of those who score low on the IMI say the opposite—that things have become better. Similarly, while more than six in ten (62%) Americans who highly distrust major institutions say America’s best days are behind us, the same proportion (62%) of Americans who score low on the IMI say America’s best days are ahead of us.
V. Racial Inequality, Discrimination, and Criminal Justice
Discrimination in American Society
Perceptions of Groups Facing Discrimination
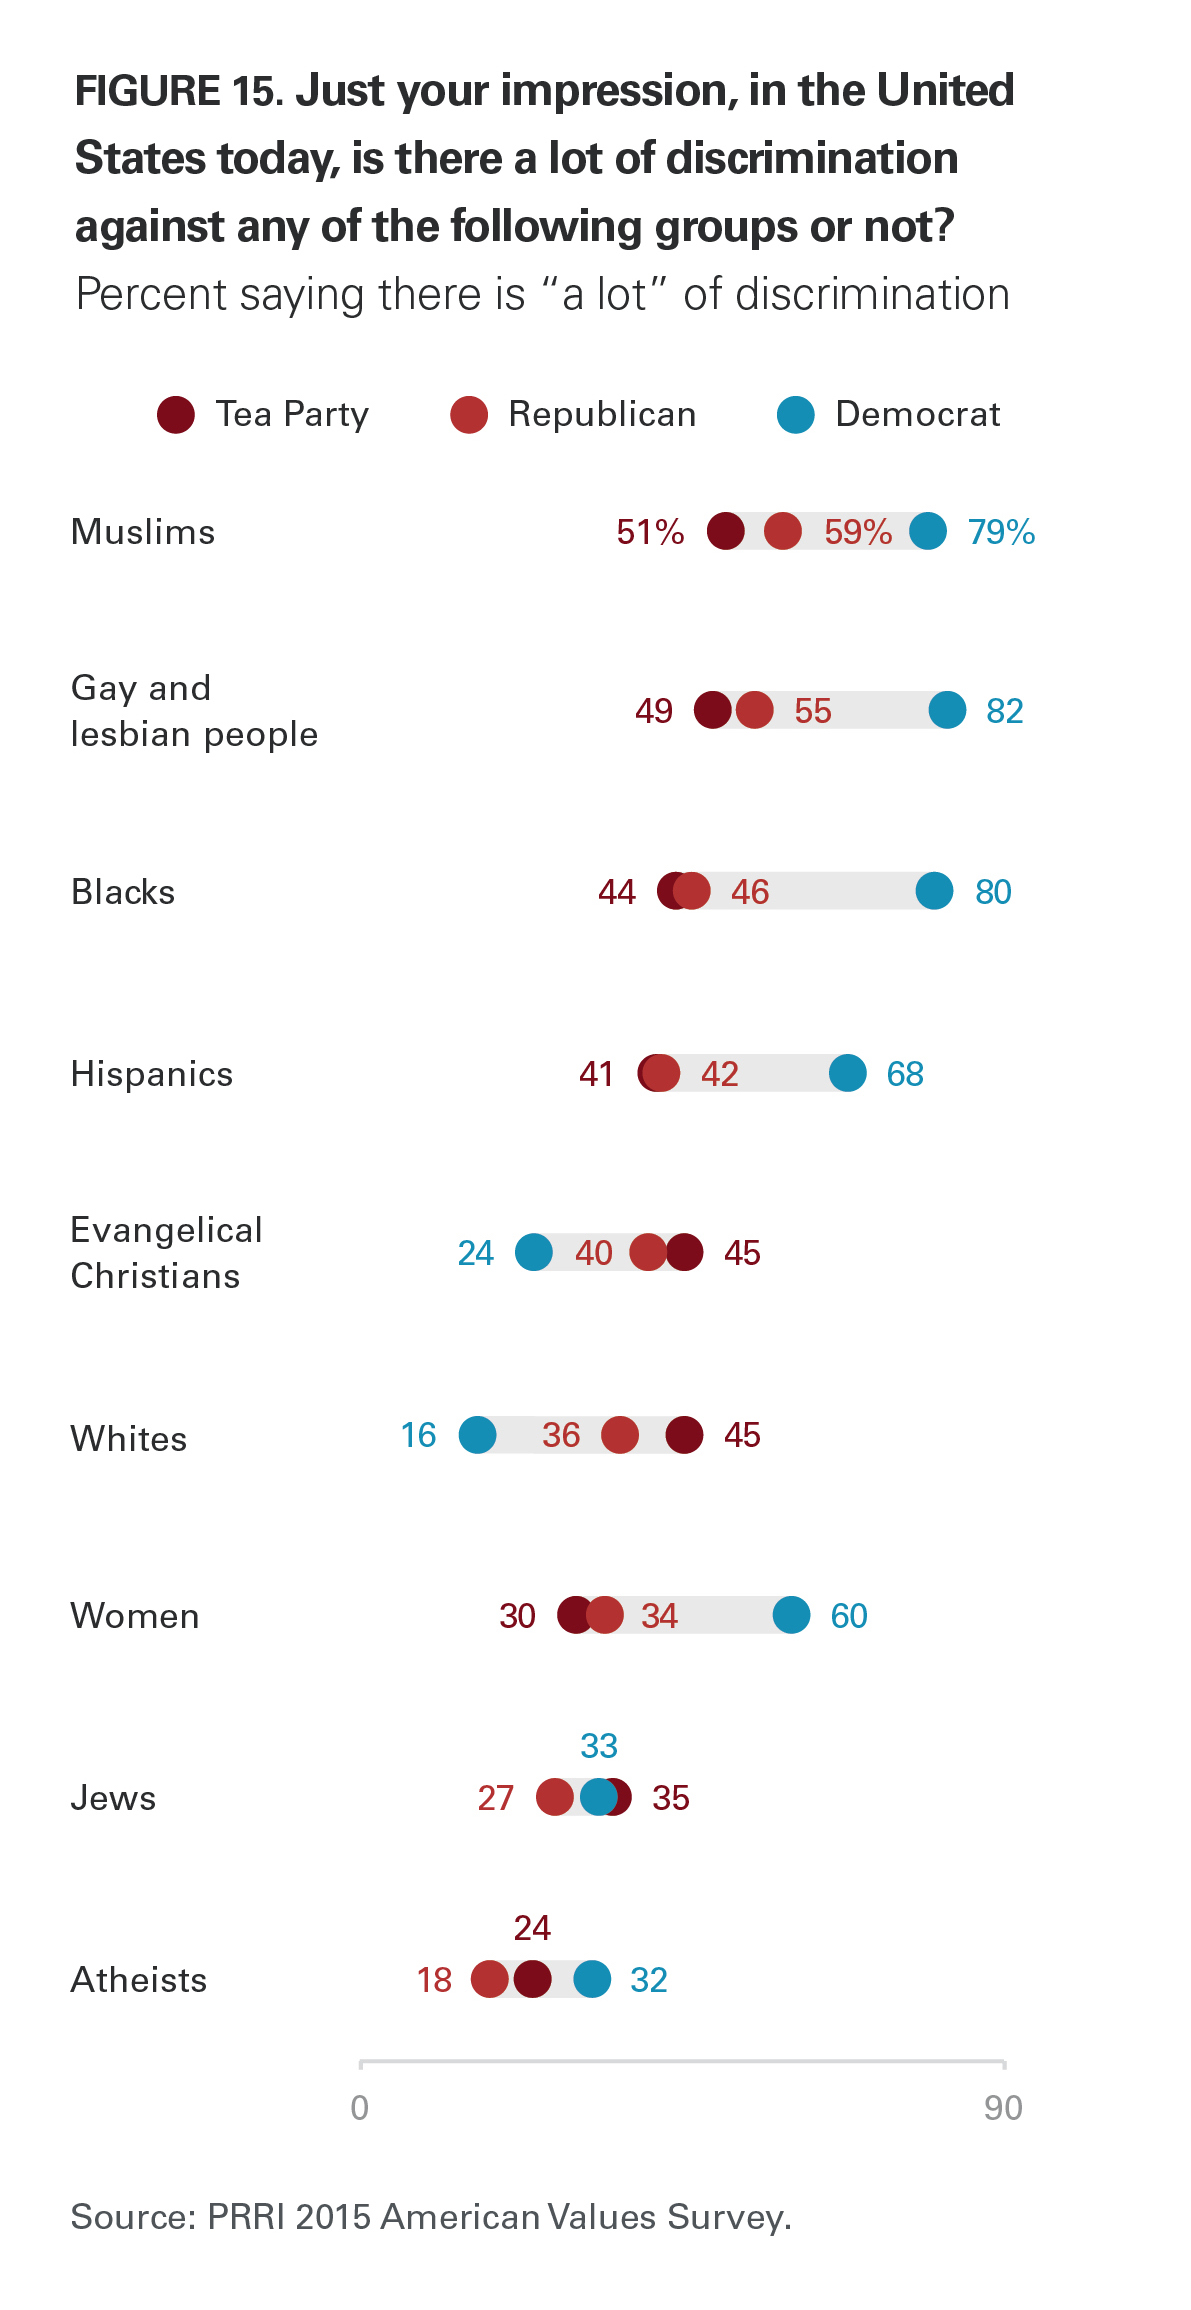
In 2015, no religious, social, or racial and ethnic group is perceived as facing greater discrimination in the U.S. than Muslims and gay and lesbian people. Approximately seven in ten Americans say there is a lot of discrimination against Muslims (70%) and gay and lesbian people (68%) in the country today. Americans also believe that racial minorities face substantial discrimination. A majority of Americans say blacks (63%) and Hispanics (56%) face a lot of discrimination in the U.S.
Americans are more divided on how prevalent discrimination against women is in the United States—45% say there is a lot of discrimination against women in America today, while 53% say there is not.
Relatively few Americans believe that evangelical Christians (30%), Jews (30%), atheists (27%), whites (25%), or white men (22%) confront a great deal of discrimination in American society today.
Americans who belong to particular religious, social, or racial and ethnic groups are much more likely than those who do not to say their particular group faces discrimination. For instance, nearly nine in ten (87%) black Americans say there is a lot of discrimination against blacks in America today, compared to fewer than six in ten (57%) white Americans who say the same. A slim majority (51%) of white evangelical Protestants say evangelical Christians confront a lot of discrimination today in the United States, while fewer than four in ten black Protestants (38%), white mainline Protestants (25%), Catholics (21%), and religiously unaffiliated Americans (15%) say the same. And while most (54%) women say women in America today face a great deal of discrimination, fewer than four in ten (37%) men agree.
Unlike other groups, white Americans are not more likely to say that whites face a lot of discrimination. Roughly one-quarter (27%) of white Americans say that whites face a lot of discrimination in the U.S. Similarly, white men are not more likely than the public overall to believe that white men face substantial discrimination in society (24% vs. 22%, respectively).
Perceptions of discrimination faced by particular groups are highly polarized by political affiliation. Republicans are more than twice as likely as Democrats to say that whites face substantial discrimination in the U.S. (36% vs. 16%, respectively), while nearly half (45%) of Americans who identify with the Tea Party say whites confront a lot of discrimination.(7) Conversely, 80% of Democrats say that blacks face a lot of discrimination, compared to fewer than half of Republicans (46%) and Tea Party members (44%). Democrats (60%) are also much more likely than Republicans (34%) and Tea Party members (30%) to say that women face a lot of discrimination.
 Attitudes about the fairness of the economic system, measured by the Economic Inequity Index (EII), also impact perceptions of which groups are facing discrimination in the country today. Overall, Americans who believe the economic playing field is level (low scores on the EII) are less likely to perceive existing discrimination against minority groups. Americans who perceive the economic playing field to be level (low scores on the EII) are about equally as likely to say that evangelical Christians (40%) face a lot of discrimination as they are to say Hispanic (38%) and black Americans (40%) face a lot of discrimination. Americans who score low on the EII are also significantly less likely than those who score very high to say that the following groups face a lot of discrimination: gay and lesbian people (47% vs. 77%, respectively), women (23% vs. 57%, respectively), and Muslims (50% vs. 78%, respectively). By contrast, Americans who perceive a lot of unfairness in the economic system (very high scores on the EII) are more likely to say Hispanic (64%) and black Americans (73%) experience a lot of discrimination than they are to say evangelical Christians (28%) and white Americans (24%) face a lot of discrimination.
Perceptions of “Reverse Discrimination”
Although only one-quarter (25%) of the public believe that whites face a lot of discrimination in America today, a significantly larger number express concern about the existence of so-called “reverse discrimination” against whites. Over four in ten (43%) Americans say that discrimination against whites has become as big a problem as discrimination against blacks and other minorities; 55% disagree. Opinions about reverse discrimination have remained fairly constant over the past few years.
Substantial racial and ethnic divisions exist in opinions about reverse discrimination. Half (50%) of white Americans agree that discrimination against whites has become as big a problem today as discrimination against blacks and other minorities, while fewer than three in ten Hispanic (29%) and black Americans (25%) agree. Approximately seven in ten black (74%) and Hispanic Americans (70%) do not believe discrimination against whites is now as big of a problem as discrimination against other groups.
There are striking divisions among white Americans by social class. Six in ten (60%) white working-class Americans agree that discrimination against whites has become as big a problem today as discrimination against blacks and other minorities, while roughly four in ten (39%) disagree. The views of white college-educated Americans are almost exactly reversed—fewer than four in ten (36%) say discrimination against whites is now as big a problem as discrimination against non-whites, while 63% disagree.
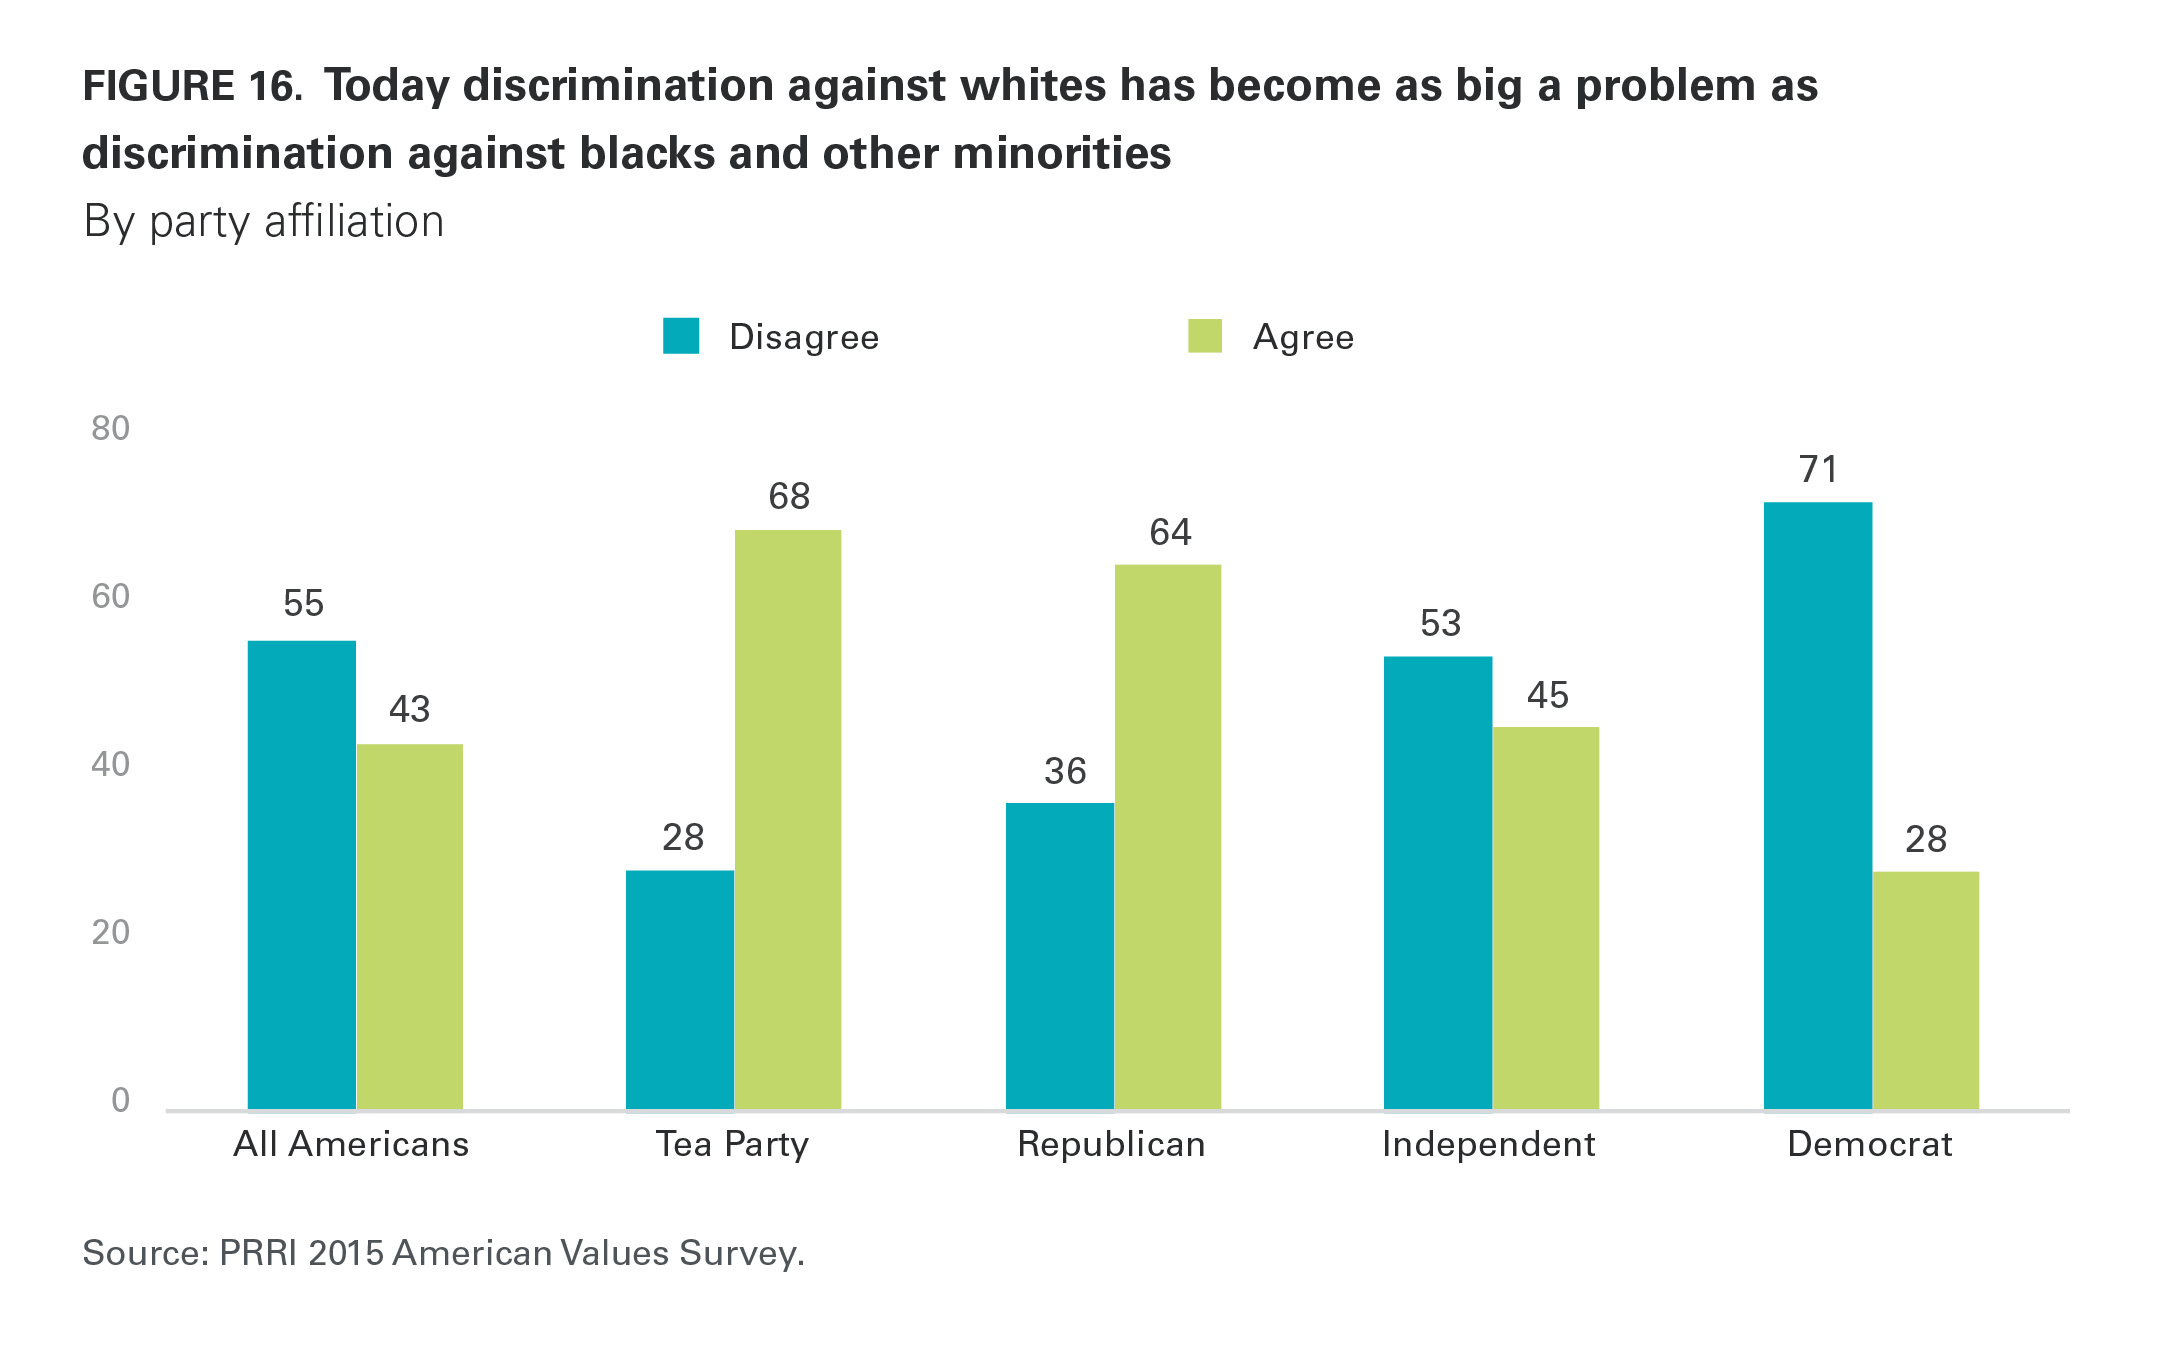
Views about reverse discrimination are also highly politically polarized. Roughly two-thirds of Republicans (64%) and Tea Party members (68%) agree that, today, discrimination against whites has become as big a problem as discrimination against other groups. In contrast, fewer than half (45%) of independents and only about three in ten (28%) Democrats agree that discrimination against whites is as big a problem today as discrimination against blacks and other minorities. Seventy-one percent of Democrats disagree.
Racial Inequality
Has America Done Enough to Give Black Americans Equal Rights?
Americans are divided over whether more changes must be made to give blacks equal rights with whites. Nearly half (49%) of Americans say our country has made the needed changes to give blacks equal rights with whites, while 47% believe our country needs to continue making changes. This finding marks a significant shift from August 2015, when fewer than four in ten (37%) Americans said the U.S. has made the changes needed to make blacks and whites equal, and six in ten (60%) said America needs to continue making changes.(8)
Large racial and ethnic differences persist in views about racial equality. About six in ten (59%) white Americans say our country has made the changes needed to give blacks equal rights with whites, compared to approximately four in ten (41%) Hispanic Americans and only about one in ten (12%) black Americans. More than eight in ten (85%) black Americans say America has to continue making changes to give blacks equal rights with whites.
Among white Americans, views on whether enough changes have been made to achieve racial equality differ somewhat by social class. White working-class Americans are more likely than white college-educated Americans to say our country has made enough changes to give blacks equal rights with whites (63% vs. 50%, respectively).
There are also stark partisan divisions about whether the U.S. has done enough to ensure racial equality. More than seven in ten Republicans (78%) and Tea Party members (72%) say that America has made the necessary changes to give blacks equal rights with whites, a view shared by only about one-quarter (27%) of Democrats. Approximately seven in ten (71%) Democrats say our country must continue making changes to provide blacks with rights equal to those of whites.
Discrimination, Prejudice, and Progress
American attitudes about race are complicated. Most Americans acknowledge that black Americans still face a considerable degree of discrimination in the U.S. today. However, most Americans believe that prejudice and current conditions many blacks face are not impediments to progress. More than six in ten (63%) Americans agree that Irish, Italians, Jewish, and many other minorities overcame prejudice and worked their way up, and blacks should do the same without any special favors; 35% of Americans disagree. Similarly, nearly six in ten (58%) Americans do not believe that generations of slavery and discrimination have created conditions that make it difficult for blacks to work their way out of the lower class, while 41% say the opposite.
Many Americans believe that current racial disparities are due, in large part, to the lack of effort made by black Americans to improve their circumstances. Roughly half of the public (48%) say that racial inequality is the result of black Americans not trying hard enough, while about as many (49%) disagree. Nearly six in ten (58%) Americans do not believe that blacks have gotten less than they deserve in recent years.
Americans’ attitudes about whether blacks would be as well off as whites if they tried harder differ only modestly by race and ethnicity. White Americans are evenly divided over whether black Americans would be as well off as whites if they put forth enough effort (50% agree, 49% disagree). Hispanic Americans are similarly divided (48% agree, 52% disagree). Notably, more than four in ten (43%) black Americans agree that racial disparities between whites and blacks are a matter of effort, while a majority (55%) disagree.
Partisan disagreement on this issue is dramatic. Roughly two-thirds of Republicans (66%) and Tea Party members (68%) agree that blacks could be as well off as whites if they tried harder, while fewer than half of political independents (48%) and Democrats (38%) agree.
The Confederate Flag: Symbol of Southern Pride or Racism?
Following recent controversies surrounding the Confederate flag, a slim majority (51%) of Americans say they see the Confederate flag more as a symbol of Southern pride, while four in ten (40%) Americans say they see it more as a symbol of racism.
Not surprisingly, there are significant racial and ethnic divisions in views of what the Confederate flag symbolizes. Approximately six in ten (61%) white Americans see the Confederate flag more as a symbol of Southern pride, a view shared by just 36% of Hispanic Americans and 22% of black Americans. Nearly three-quarters (73%) of black Americans say they view the Confederate flag more as a symbol of racism. But white Americans are sharply divided by social class. More than seven in ten (72%) white working-class Americans say the Confederate flag is more a symbol of Southern pride than racism, a view shared by less than half (45%) of white college-educated Americans.
Americans are also strongly divided along party lines in views of the Confederate flag. About three-quarters of Republicans (76%) and Tea Party members (73%) and a majority (54%) of independents say they see the Confederate flag more as a symbol of Southern pride than racism, while only about one-third (32%) of Democrats agree. More than six in ten (62%) Democrats, including a majority (53%) of white Democrats, view the flag more as a symbol of racism.
Notably, there are stark religious divides in attitudes about the Confederate flag. Seven in ten white evangelical Protestants (70%) and white mainline Protestants (70%) and roughly two-thirds (65%) of white Catholics say the Confederate flag is more of a symbol of Southern pride. By contrast, 41% of religiously unaffiliated Americans, 39% of Hispanic Catholics, and 20% of black Protestants say the Confederate flag is more a symbol of Southern pride to them. Approximately three-quarters (76%) of black Protestants say it is more a symbol of racism.
The Racial Inequity Index
In order to provide an overall measure of Americans’ attitudes about race, we created a Racial Inequity Index (RII), built as an additive scale using five questions:(9)
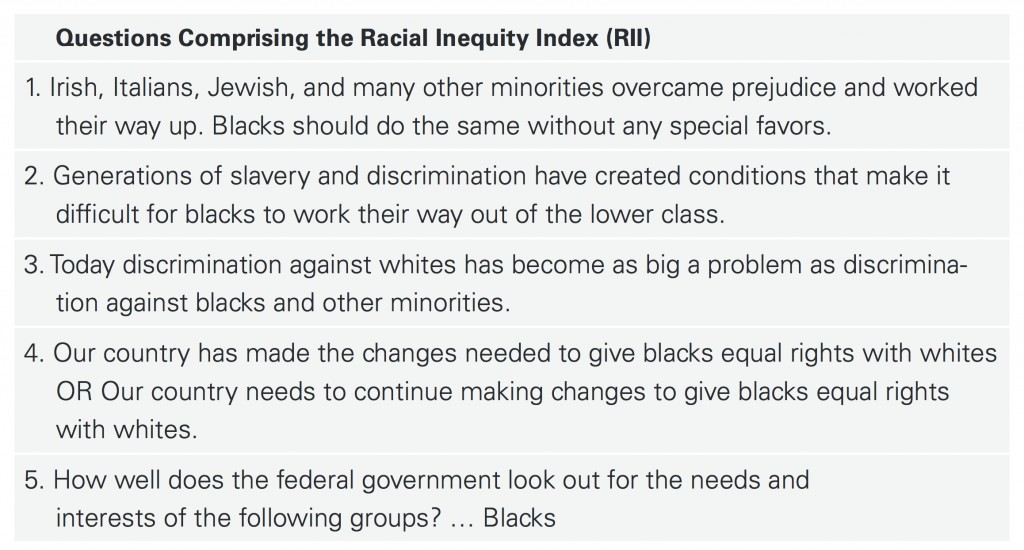
A higher score on the Racial Inequity Index (RII) indicates that a respondent believes generally that systemic discrimination against blacks and other minorities impacts racial inequality today, while a low score on the RII indicates that a respondent believes that racial minorities today have equal opportunities as whites. Overall, more Americans score low than high on the scale. One-third of Americans score very high (10%) or high (23%), while about one in five (21%) fall into the moderate category, and nearly half of Americans score low (38%) or very low (8%) on the RII.
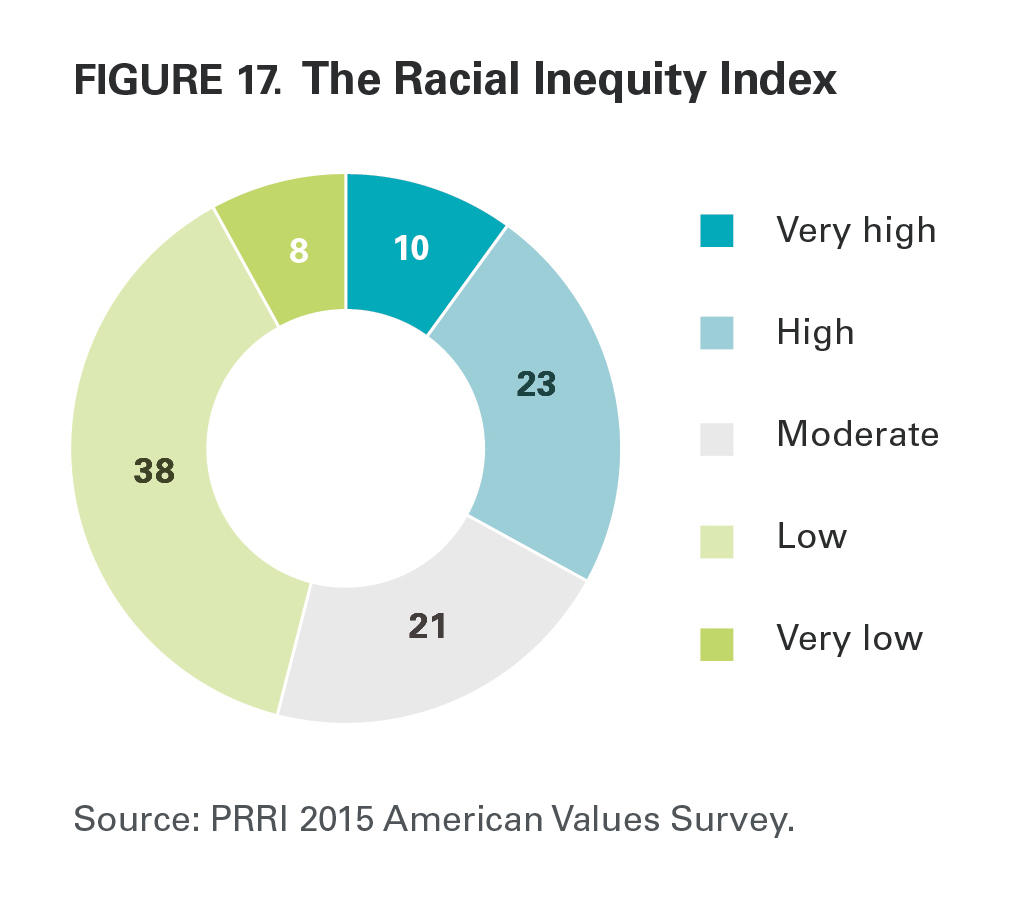 Not surprisingly, white Americans are more likely than non-white Americans to score low on the Racial Inequity Index, indicating a tendency to believe that enough has been done to redress past discrimination and current inequalities. A majority (54%) of white Americans perceive low levels of racial inequality. The class differences among white Americans are substantial: six in ten (61%) white working-class Americans perceive low levels of inequality between whites and blacks, compared to less than half (45%) of white college-educated Americans. By contrast, nearly two-thirds (66%) of black Americans believe that the effects of systemic discrimination are still with us today (high scores on the RII), while 17% fall into the moderate category, and 17% have low scores on the scale. Hispanic Americans are more divided. Forty-five percent of Hispanics have high scores on the RII, 22% have scores in the moderate range, and about one-third (34%) earned low scores.
Aside from race, the most notable demographic differences on the RII are by age. Nearly half (47%) of seniors (age 65 and older), compared to only one-third (33%) of young adults (age 18- 29), perceive low racial inequities today (low scores on RII).
There are pronounced partisan divides on the RII. Approximately three-quarters of Republicans (74%) and Tea Party members (75%) perceive few continued effects of racial discrimination today (low scores on the RII), compared to just 22% of Democrats. Conversely, a majority (55%) of Democrats perceive the effects of systemic discrimination to be operative today (high scores on the RII), compared to fewer than one in ten Republicans (9%) and Tea Party members (6%).
There are also significant differences among religious groups about whether enough has been done to compensate for past racial discrimination. A majority of white evangelical Protestants (63%), white mainline Protestants (61%), and Catholics (52%)—including a strong majority of white Catholics (63%)—have low scores on the RII, compared to only about one-third (32%) of the religiously unaffiliated and fewer than one in five (17%) black Protestants. Nearly half (48%) of the religiously unaffiliated and a majority (64%) of black Protestants perceive continued racial inequities (high scores on the RII).
The RII is strongly correlated with views of the Confederate flag. Among Americans who perceive few effects of racism to be operative today (low scores on the RII), about three-quarters (74%) say they see the Confederate flag as a symbol of Southern pride rather than racism, compared to only 21% of Americans with high RII scores.
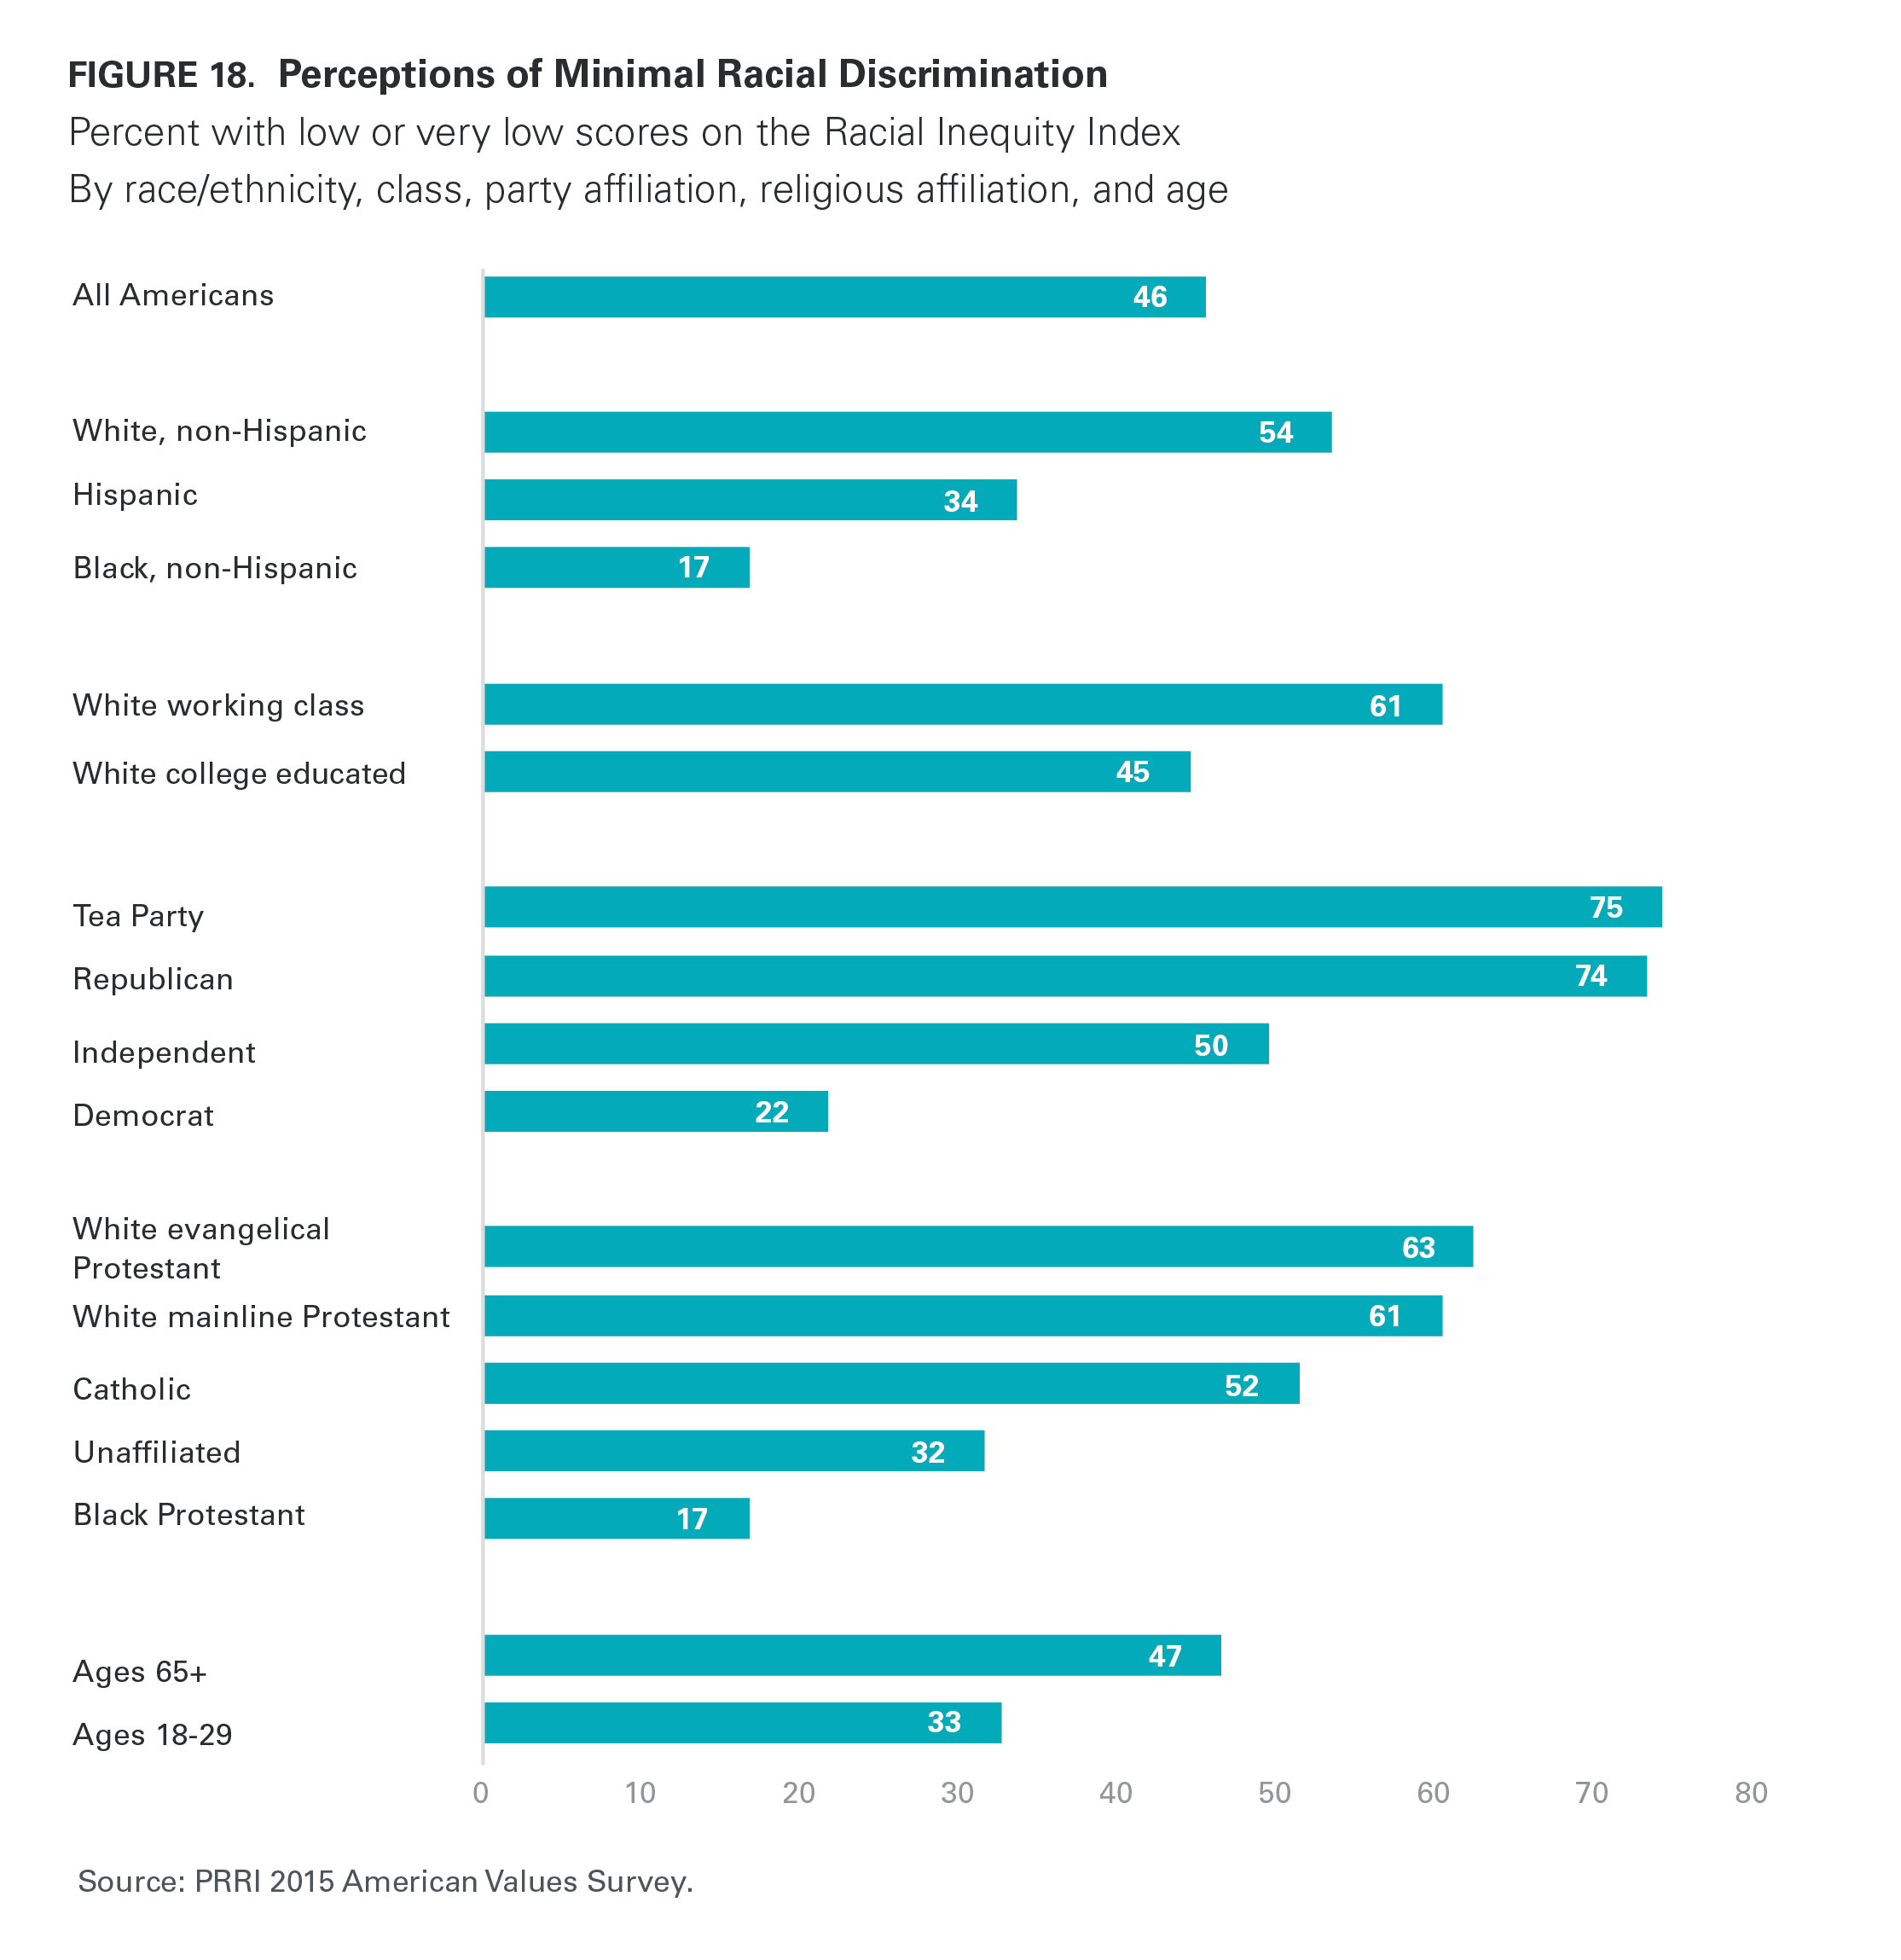
Race and the Criminal Justice System
Treatment of Racial Minorities by Police
Most Americans do not believe that police officers treat blacks and other minorities the same as whites. Only about four in ten (41%) Americans say that the police generally treat racial and ethnic groups equally, while nearly six in ten (57%) disagree. In 2014, Americans were somewhat more divided: 45% said that police treat white and non-white Americans equally, while 52% disagreed.
White Americans are divided in their views about police treatment of racial minorities. Half (50%) say police officers generally treat blacks and other minorities the same as whites, while 48% disagree. In contrast, more than eight in ten (84%) black Americans and nearly three-quarters (73%) of Hispanic Americans say police officers do not generally treat non-whites the same as whites. The attitudes of white Americans are stratified by social class. Fifty-three percent of white working-class Americans believe police officers generally treat non-whites and whites equally, while 45% disagree. In contrast, less than half (44%) of white college-educated Americans say blacks and other minorities are generally treated the same as whites by police officers, while 56% say the opposite.
Additionally, more than six in ten Republicans (67%) and Tea Party members (63%) say police treat blacks and other minorities the same as whites, while only about one-quarter (23%) of Democrats agree. Three-quarters (75%) of Democrats—including two-thirds (67%) of white Democrats—say that police do not treat blacks and whites the same. The views of political independents closely mirror the general public.
There is a strong relationship between scores on the Racial Inequity Index (RII) and views on police treatment of racial minorities. About two-thirds (67%) of Americans who perceive few continued effects of racial discrimination (low scores on the RII)—compared to just 11% of Americans with high scores—say police officers generally treat blacks and other minorities the same as whites. Nearly nine in ten (88%) Americans with high RII scores believe police do not generally treat non-whites the same as whites.
Deaths of Black Men by Police: Isolated Incidents or Part of a Pattern?
Despite the fact that most Americans do not believe that black Americans are treated the same as whites by law enforcement, a majority (53%) of the public say that recent killings of African American men by police are isolated incidents rather than part of a broader pattern of how police treat African Americans (44%).
Views on police killings of African American men are highly stratified by race and ethnicity. Approximately two-thirds (65%) of white Americans say recent killings of African American men by police are isolated incidents, while about four in ten (41%) Hispanic Americans and only 15% of black Americans say the same. More than eight in ten (81%) black Americans say recent police killings of African American men are part of a broader pattern of how police treat African Americans.
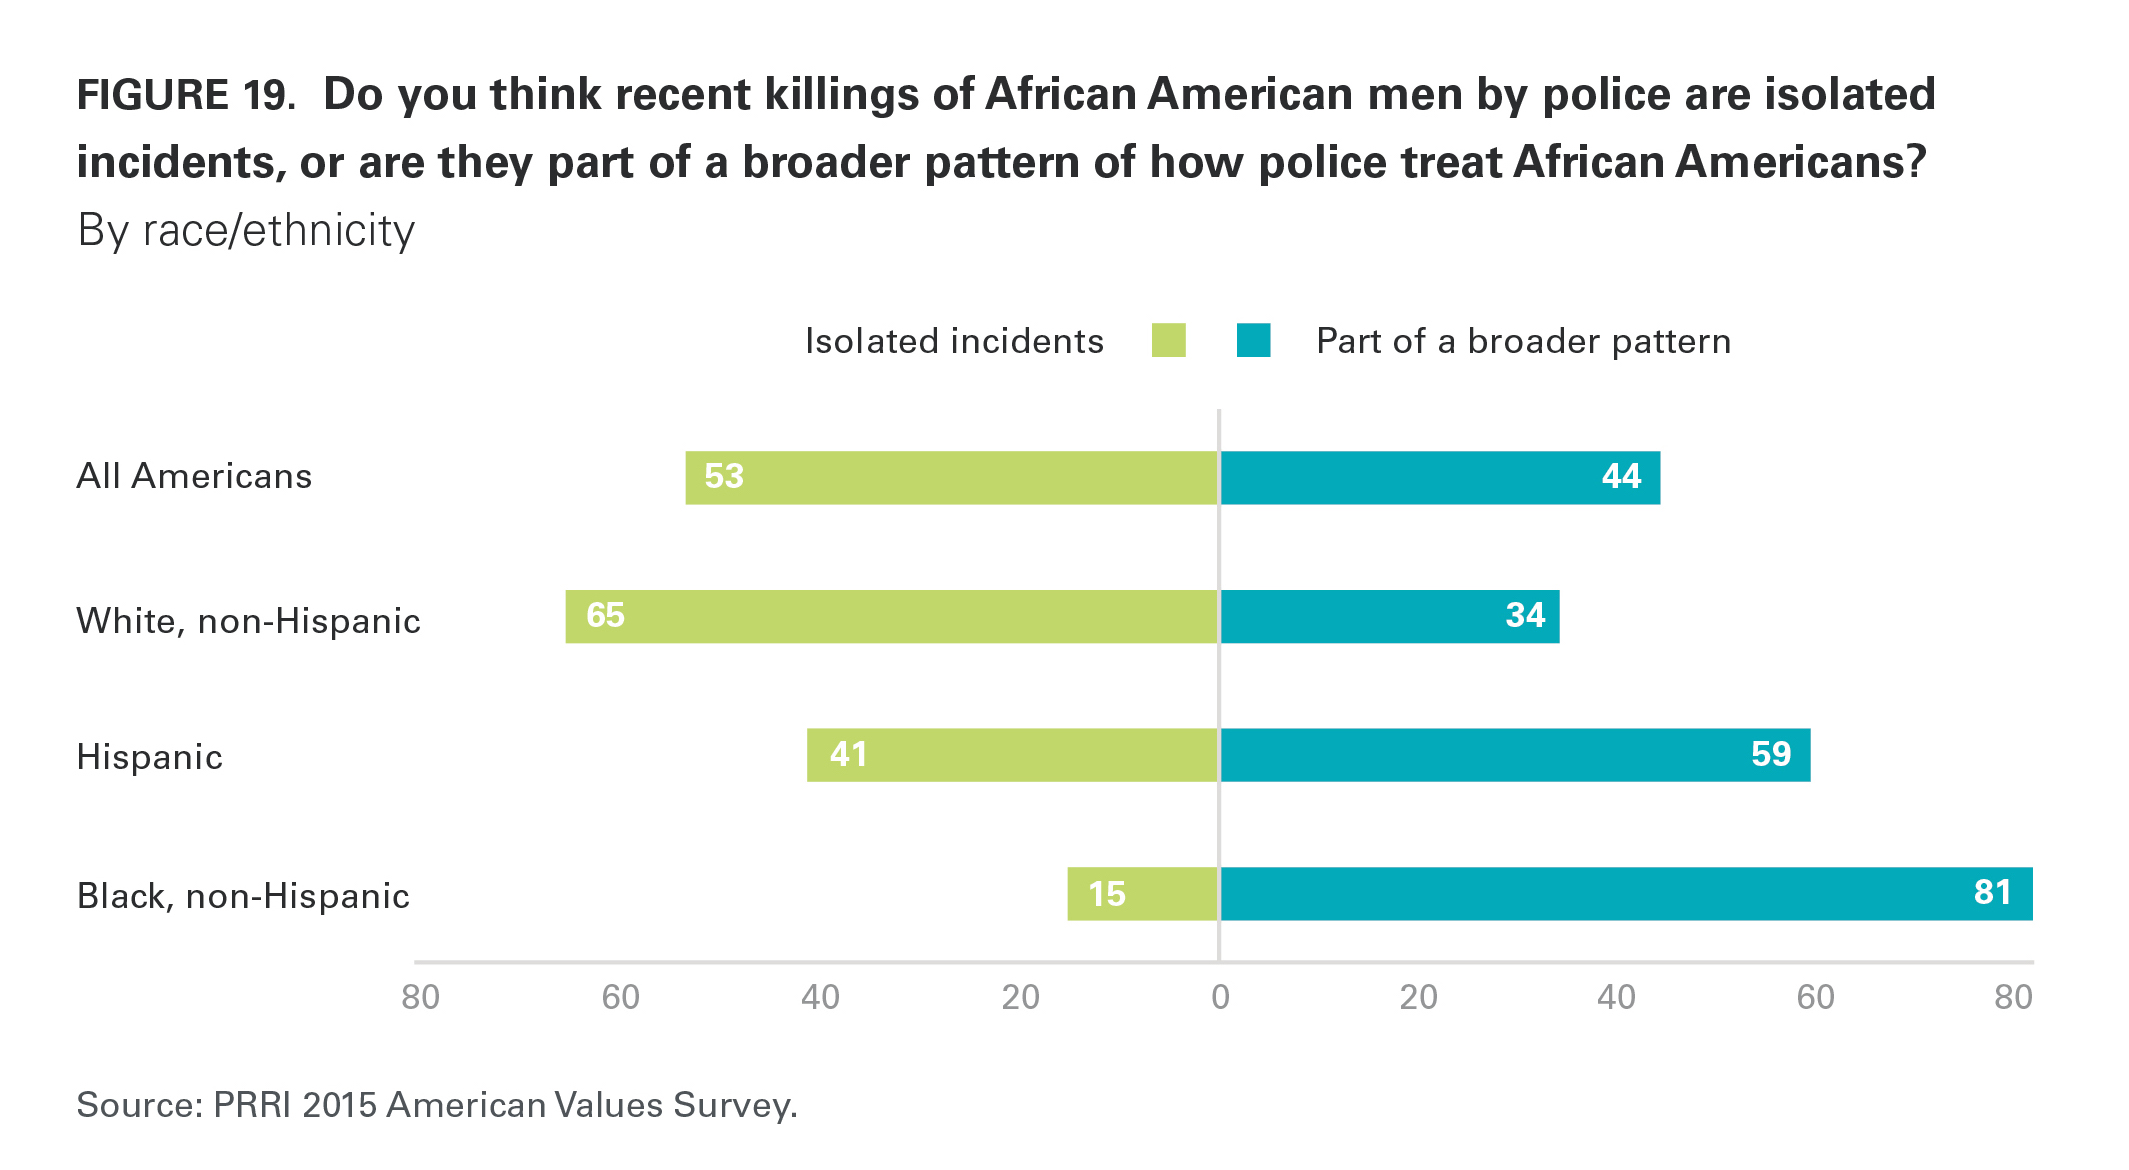
Among religious groups, white Christians are more likely than other religious groups to say that recent killings of African American men by police aren’t connected. More than seven in ten white evangelical Protestants (72%), white mainline Protestants (73%), and white Catholics (71%) believe that killings of African American men by police are isolated incidents. By contrast, about six in ten Americans who are affiliated with non-Christian religions (62%) and religiously unaffiliated Americans (59%) believe that these killings are part of a broader pattern of how police treat minorities. Among black Protestants, more than eight in ten (82%) believe they are part of a broader pattern.
There are substantial partisan divisions in views of police killings of African American men. More than eight in ten Republicans (82%) and Tea Party members (85%) view recent police killings of African American men as isolated incidents, and a majority (55%) of independents say the same. In contrast, about three in ten (32%) Democrats say these are isolated incidents, while roughly two-thirds (66%) say recent killings of African American men by police are part of a broader pattern.
Scores on the Racial Inequity Index (RII) are strongly correlated with views of recent police killings of African American men. Eight in ten (81%) Americans who see few contemporary connections with past racial discrimination (low scores on the RII) say that recent killings of African American men by police are isolated incidents, compared to 16% of Americans who perceive strong continued effects of a history of systemic discrimination and prejudice (high scores on the RII). Eighty-three percent of Americans with high RII scores say recent police killings of African American men are part of a broader pattern of how police treat African Americans; only 18% of Americans with low RII scores agree.
Fairness of the Criminal Justice System
Americans’ views on racial disparities in the criminal justice system largely mirror views on racial disparities in treatment by police. Nearly six in ten (58%) Americans do not believe blacks and other minorities receive equal treatment as whites in the criminal justice system, while four in ten (40%) believe they are treated equally. In 2013, Americans were evenly divided on whether nonwhites receive the same treatment as whites in the criminal justice system (47% agreed, 47% disagreed).
There are stark racial and ethnic divisions in views about the fairness of the criminal justice system. White Americans are closely divided: slightly less than half (47%) say blacks and other minorities receive equal treatment as whites in the criminal justice system, while a slim majority (52%) disagree. In contrast, more than eight in ten (85%) black Americans and two-thirds (67%) of Hispanic Americans disagree that minorities receive equal treatment in the criminal justice system.
White Americans’ attitudes on racial disparities in the criminal justice system differ substantially by class. White working-class Americans are divided: 52% say blacks and other minorities receive equal treatment as whites in the criminal justice system, while 47% disagree. In contrast, just 36% of white college-educated Americans say whites and non-whites are treated equally in the criminal justice system, while nearly two-thirds (64%) disagree.
Partisan divisions on this issue closely mirror divisions on the question of police treatment of whites versus non-whites. More than six in ten Republicans (64%) and Tea Party members (65%) say blacks and other minorities are treated the same as whites in the criminal justice system, while about three-quarters (74%) of Democrats disagree. The views of independents are identical to the views of Americans overall.
There is a strong correlation between placement on the Racial Inequity Index (RII) and views on the fairness of the criminal justice system. Two-thirds (66%) of Americans who see few signs of continued discrimination (low scores on the RII) say that blacks and other minorities receive equal treatment as whites in the criminal justice system, while just 9% of Americans who perceive the continued effects of systemic racial discrimination and prejudice (high scores on the RII) agree. In contrast, more than nine in ten (91%) Americans with high scores on the RII, compared to only about one-third (34%) of Americans with low scores, believe that racial minorities are not generally treated the same as whites in the criminal justice system.
Race and the Death Penalty
When asked which punishment they prefer for people convicted of murder, a majority (52%) of Americans say they prefer life in prison with no chance of parole, compared to 47% who say they prefer the death penalty. Views about the death penalty have held roughly steady since 2012 when the public was closely divided.
Partisan attitudes on this question are mirror opposites. Two-thirds (67%) of Republicans prefer the death penalty over life in prison with no chance of parole for convicted murderers, while nearly two-thirds (65%) of Democrats prefer the opposite. The attitudes of independents mirror the general population.
Americans are also closely divided over whether there are racial disparities in death penalty sentencing. A majority (53%) of Americans agree that a black person is more likely than a white person to receive the death penalty for the same crime, while 45% of Americans disagree. American attitudes about the way that the death penalty is applied are virtually unchanged from 1999, when half (50%) of Americans said a black person is more likely than a white one to be sentenced to the death penalty for an identical crime, and 46% disagreed.(10)
American attitudes about the fairness of death penalty sentences continue to be sharply divided along racial and ethnic lines. More than eight in ten (82%) black Americans and roughly six in ten (59%) Hispanic Americans, compared to fewer than half (45%) of white Americans, report that a black person is more likely than a white person to receive a death penalty sentence for the same crime. A majority (53%) of white Americans disagree. White Americans’ views on this question differ significantly by social class. A majority (54%) of white college-educated Americans say a black person is more likely than a white person convicted of the same crime to receive the death penalty, compared to four in ten (40%) white working-class Americans. A majority (58%) of white working-class Americans say that this is not the case.
Consistent with previous patterns, there are stark partisan divisions in views about the administration of the death penalty. Roughly six in ten (64%) Republicans and Tea Party members (58%) do not believe a black person is more likely than a white one to be sentenced to the death penalty for the same crime, while fewer than three in ten (28%) Democrats agree. Seven in ten (70%) Democrats say that a black person is more likely than a white person to receive the death penalty. Independents are evenly divided over whether a black person convicted of the same crime as a white person is more likely to receive the death penalty (49% agree, 49% disagree).
There is a strong correlation in views about how fairly the death penalty is applied and support for it as punishment for people convicted of murder. A majority (59%) of those who say that there is no racial disparity in death penalty sentencing support capital punishment, compared to 37% who say there are racial disparities.
Endnotes
1 Likely Democratic and Republican primary voters include those who self-identify as Republican or Democratic who are currently registered to vote and who report that they always participate in primary contests. Forty-two percent of self-identified Republicans and roughly one-third (34%) of self-identified Democrats are likely primary voters.
2 For more information about the definition of the white working class, see PRRI’s report, Beyond Guns and God: Understanding the Complexities of the White Working Class in America [http://publicreligion.org/research/2012/09/race-class-culture-survey-2012/].
3 Throughout this report, the term “white Americans” refers to white, non-Hispanic Americans.
4 The Cronbach’s alpha for the three items used in the scale is 0.698, which indicates that they are suitable for the inclusion in a single scale. The Economic Inequity Index was created as an additive scale from the three questions listed above and produced a score range of 3-12. Categories were created as follows: very high (score of 10-12), high (score of 9), medium (score of 7-8), and low (score of 3-6). The scale does not include respondents who answered “don’t know” or refused the question, representing 2% of the sample.
5 Results for members of the Tea Party on this question are based on fewer than 100 respondents and should be interpreted with caution.
6 The Cronbach’s alpha for the four items used in the scale is 0.700, which indicates that they are suitable for the inclusion in a single scale. The Institutional Mistrust Index (IMI) was created as an additive scale from the four questions listed above and produced a score range of 4-16. Categories were created as follows: very high (score of 14-16), high (score of 12-13), moderate (score of 10-11), low (score of 8-9), and very low (score of 4-7). The scale does not include respondents who answered “Don’t know” or refused to answer, representing only 2% of the total sample. For analysis purposes, this section collapses the “high” and “very high” groups into a single “high” group; similarly the “low” and “very low” groups are collapsed into a single “low” group.
7 Results for members of the Tea Party on this question are based on fewer than 100 respondents and should be interpreted with caution.
8 Washington Post Poll, August 2015
9 The Cronbach’s alpha for the five items used in the scale is 0.759, which indicates that they are suitable for the inclusion in a single scale. The Racial Inequity Index was created as an additive scale from the five questions listed above and produced a score range of 6-19. Categories were created as follows: very high (score of 6-8), high (score of 9-11), moderate (score of 12-13), low (score of 14-17), and very low (score of 18-19). The scale does not include respondents who answered “Don’t know” or refused to answer, representing 6% of the total sample. For analysis purposes, this section collapses the “high” and “very high” groups into a single “high” group; similarly the “low” and “very low” groups are collapsed into a single “low” group.
10 Gallup Poll, 1999.
Recommended citation:
Jones, Robert P., Daniel Cox, Betsy Cooper, and Rachel Lienesch. “Anxiety, Nostalgia, and Mistrust: Findings from the 2015 American Values Survey.” PRRI. 2015. http://www.prri.org/research/survey-anxiety-nostalgia-and-mistrust-findings-from-the-2015-american-values-survey/.


