Introduction
Joe Biden campaigned on a commitment to reverse many of the Trump administration’s strictest anti-immigration policies. Though many of these policies have either been reversed or halted — including the travel ban for people from various countries, the ban on temporary work visas, and the expansion of the public charge rule, among others —some remain in place.[1] One such policy is a public health rule known as Title 42, which allows for the immediate expulsion of migrants at the border in order to control the spread of COVID-19. The rule was set to be lifted in late December, but its suspension was delayed by the Supreme Court owing to public backlash and fears that illegal border crossings would increase significantly.[2]
Meanwhile, independent Sen. Kyrsten Sinema and Republican Sen. Thom Tillis have proposed legislation that would both extend Title 42 and provide a pathway to citizenship for two million people who were illegally brought to the United States as children and are now classified as “Dreamers.” The proposal also includes new resources to speed the processing of asylum seekers.[3]
As politicians struggle with how to address immigration issues, Americans’ views on immigration have become increasingly polarized, with Republicans becoming significantly more anti-immigrant in their attitudes over the past few years. Republicans have continually attacked the Biden administration’s handling of immigration, claiming that his policies will increase the flow of immigrants over the southern border and calling for U.S. Secretary of Homeland Security Alejandro Mayorkas to resign. These criticisms are expected to increase now that Republicans have regained control of the House of Representatives.[4]
Though the Trump-era narrative still resonates among certain portions of the American public, this report reveals that majorities of Americans do not view immigrants as a threat. But people who are more likely to think of immigrants as a threat — including those who most trust conservative media sources and Fox News — they are considerably more anti-immigrant and less supportive of open immigration policies.
Immigrants as a Threat to Traditional American Customs and Values
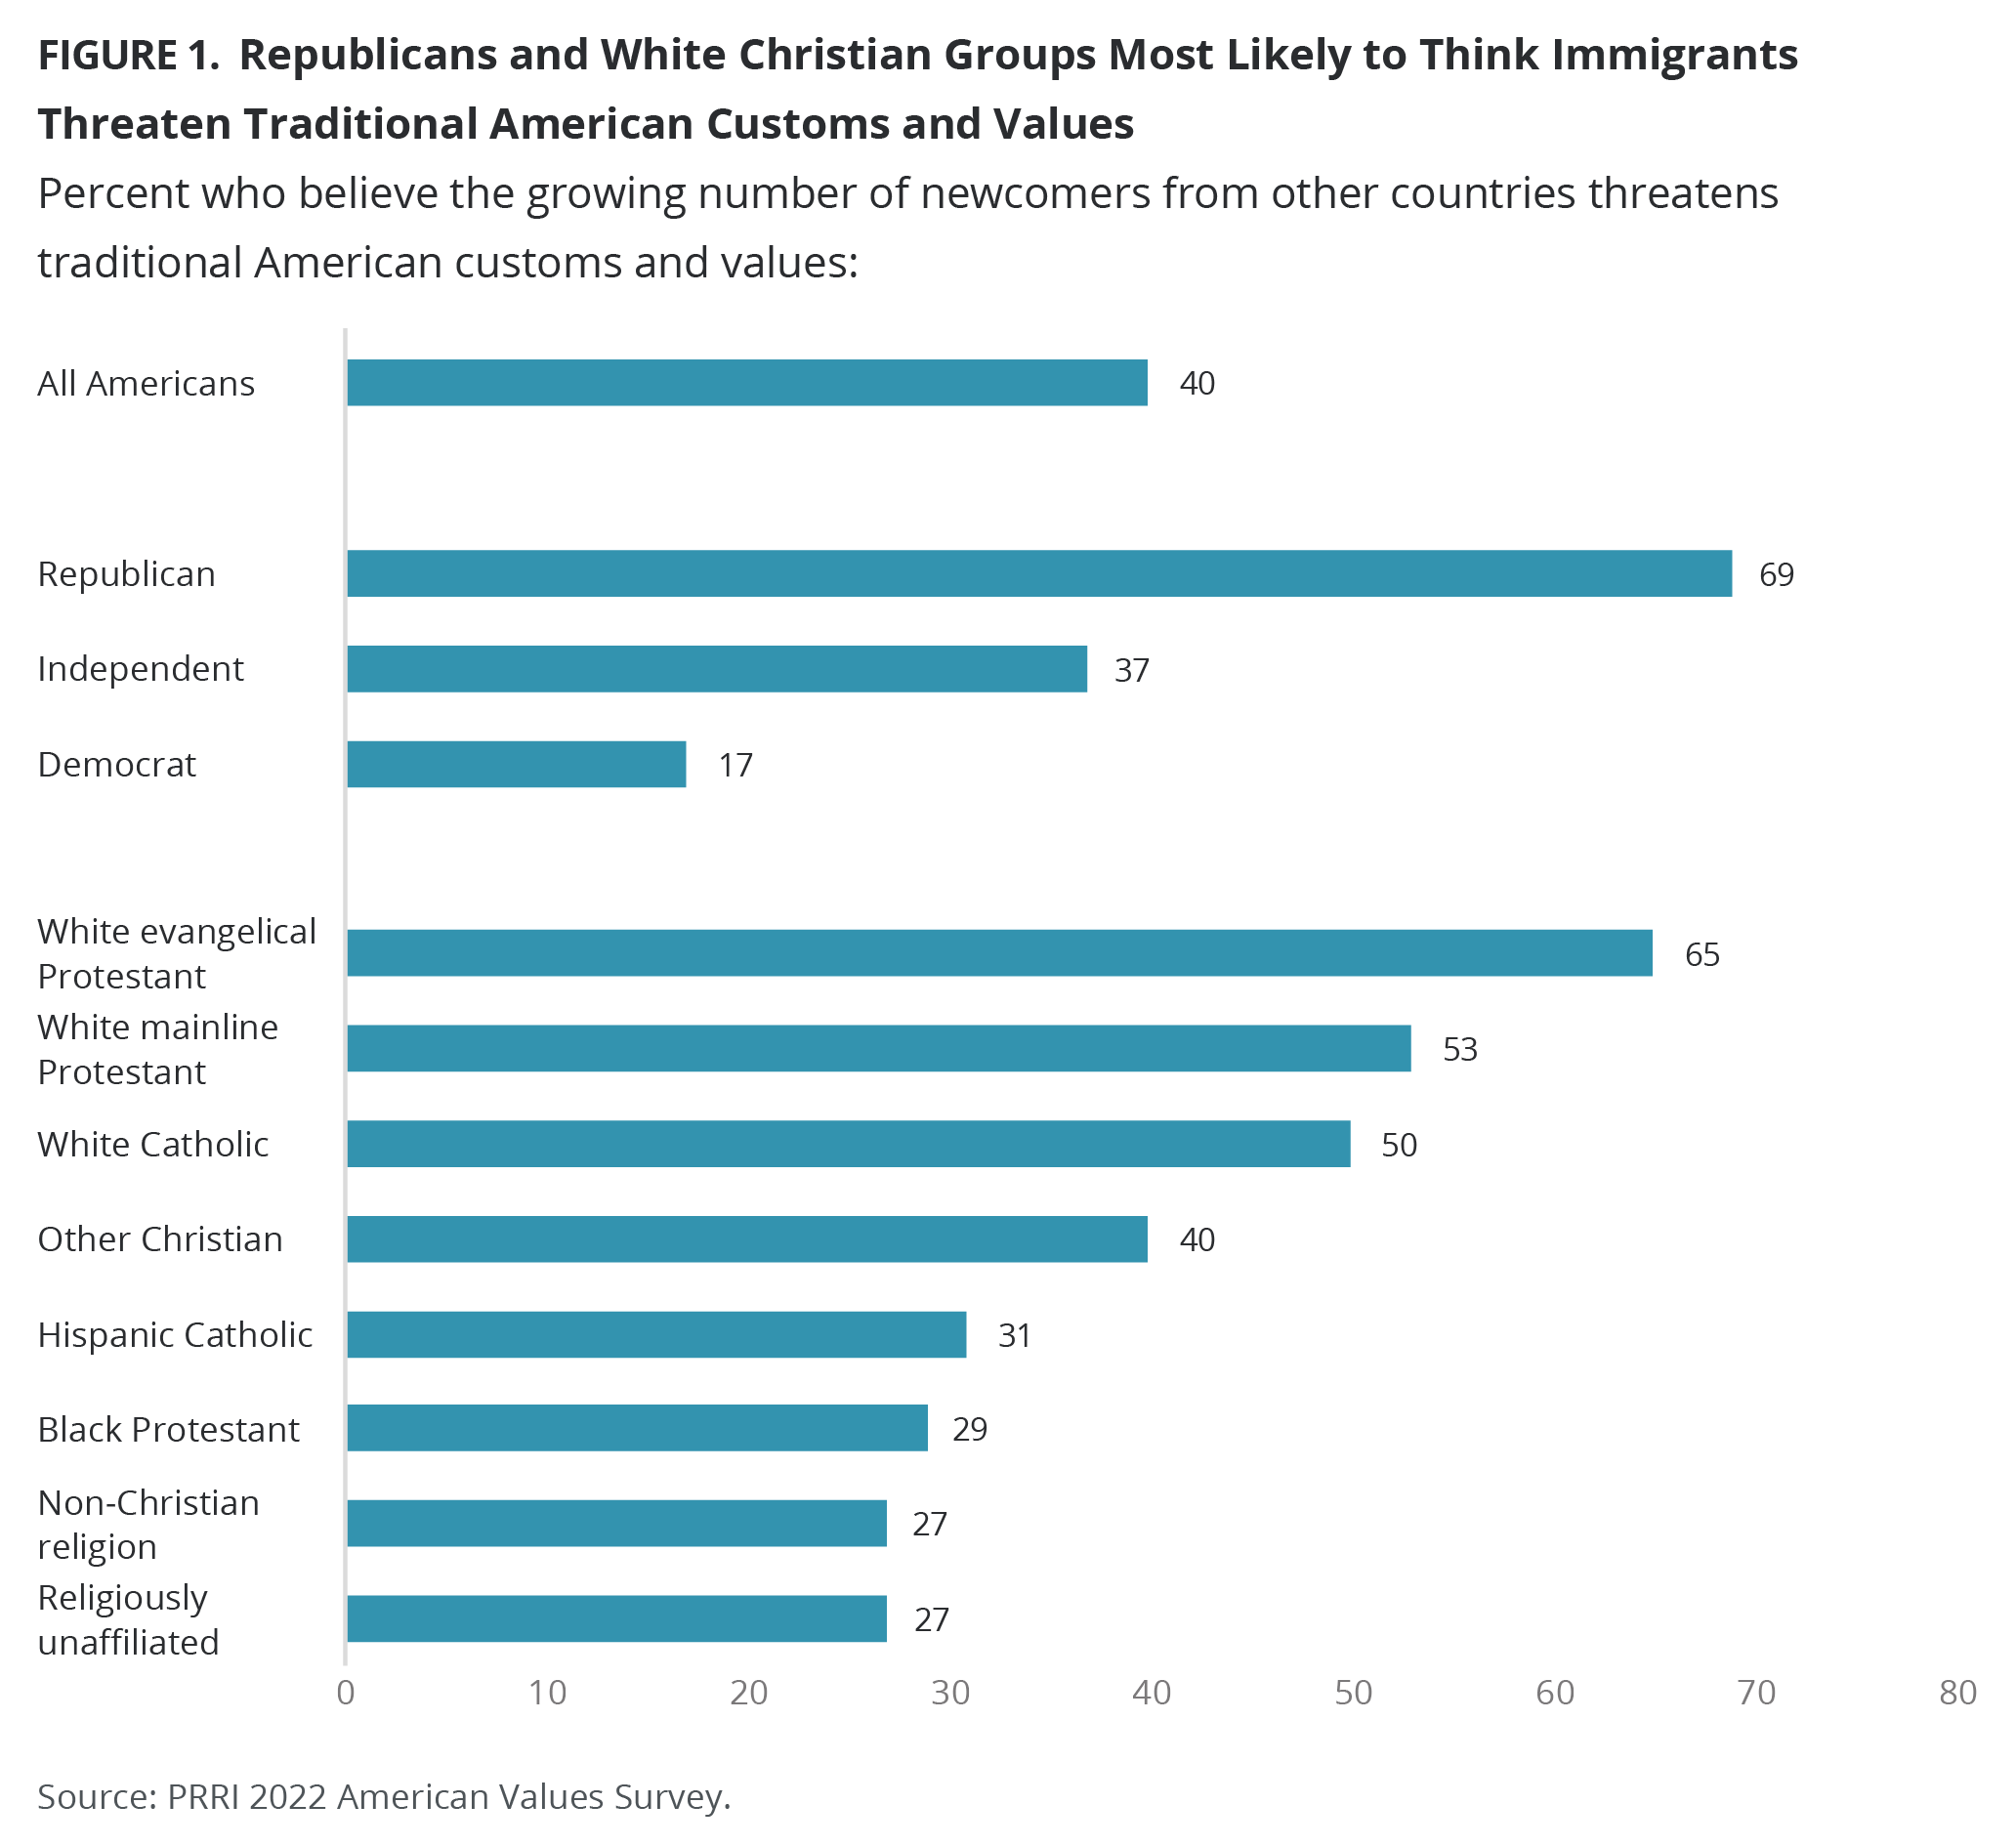
A majority of Americans (55%) say the growing number of newcomers from other countries strengthens American society, while four in ten (40%) say the growing number of newcomers from other countries threatens traditional American customs and values. Republicans (69%) are about twice as likely as independents (37%) and about four more times as likely as Democrats (17%) to say newcomers threaten traditional American customs and values. Though there is now a 52-percentage-point difference between Republicans and Democrats on this question, a little over a decade ago, in 2011, the difference was much lower, at 22 percentage points (Republicans 55% vs. Democrats 33%).
Among religious groups surveyed, white Christians are the most likely to think that newcomers threaten traditional American customs and values. This includes about two-thirds of white evangelical Protestants (65%), a slim majority of white mainline Protestants (53%) and half of white Catholics (50%). By contrast, four in ten other Christians (40%) and about three in ten Hispanic Catholics (31%), Black Protestants (29%), religiously unaffiliated Americans (27%), and members of non-Christian religions (27%) also say immigrants are a threat to American society.[5]
White Americans (46%) are notably more likely than Hispanic Americans (31%), Americans of another race (31%), and Black Americans (28%) to think that newcomers threaten traditional American customs and values.[6] Furthermore, white Americans without a four-year college degree are notably more likely than those with a four-year college degree to hold this view (53% vs. 34%).
People’s views on this topic are significantly affected by whether they know people who are immigrants or are immigrants themselves. Documented immigrants and those who know someone who is a documented immigrant are less likely than those who do not know any documented immigrants to say newcomers threaten traditional American customs and values (36% vs. 49%). The same is true for those who do and don’t know any undocumented immigrants (33% vs. 43%).
Americans’ proximity to people of different races and ethnicities also has an impact on whether they think immigrants threaten American customs and values. About four in ten Americans who are close friends with or know someone of a different race (39%) say that immigrants threaten traditional American customs and values, compared with a slim majority of those who don’t know anyone of a different race or ethnicity (51%).
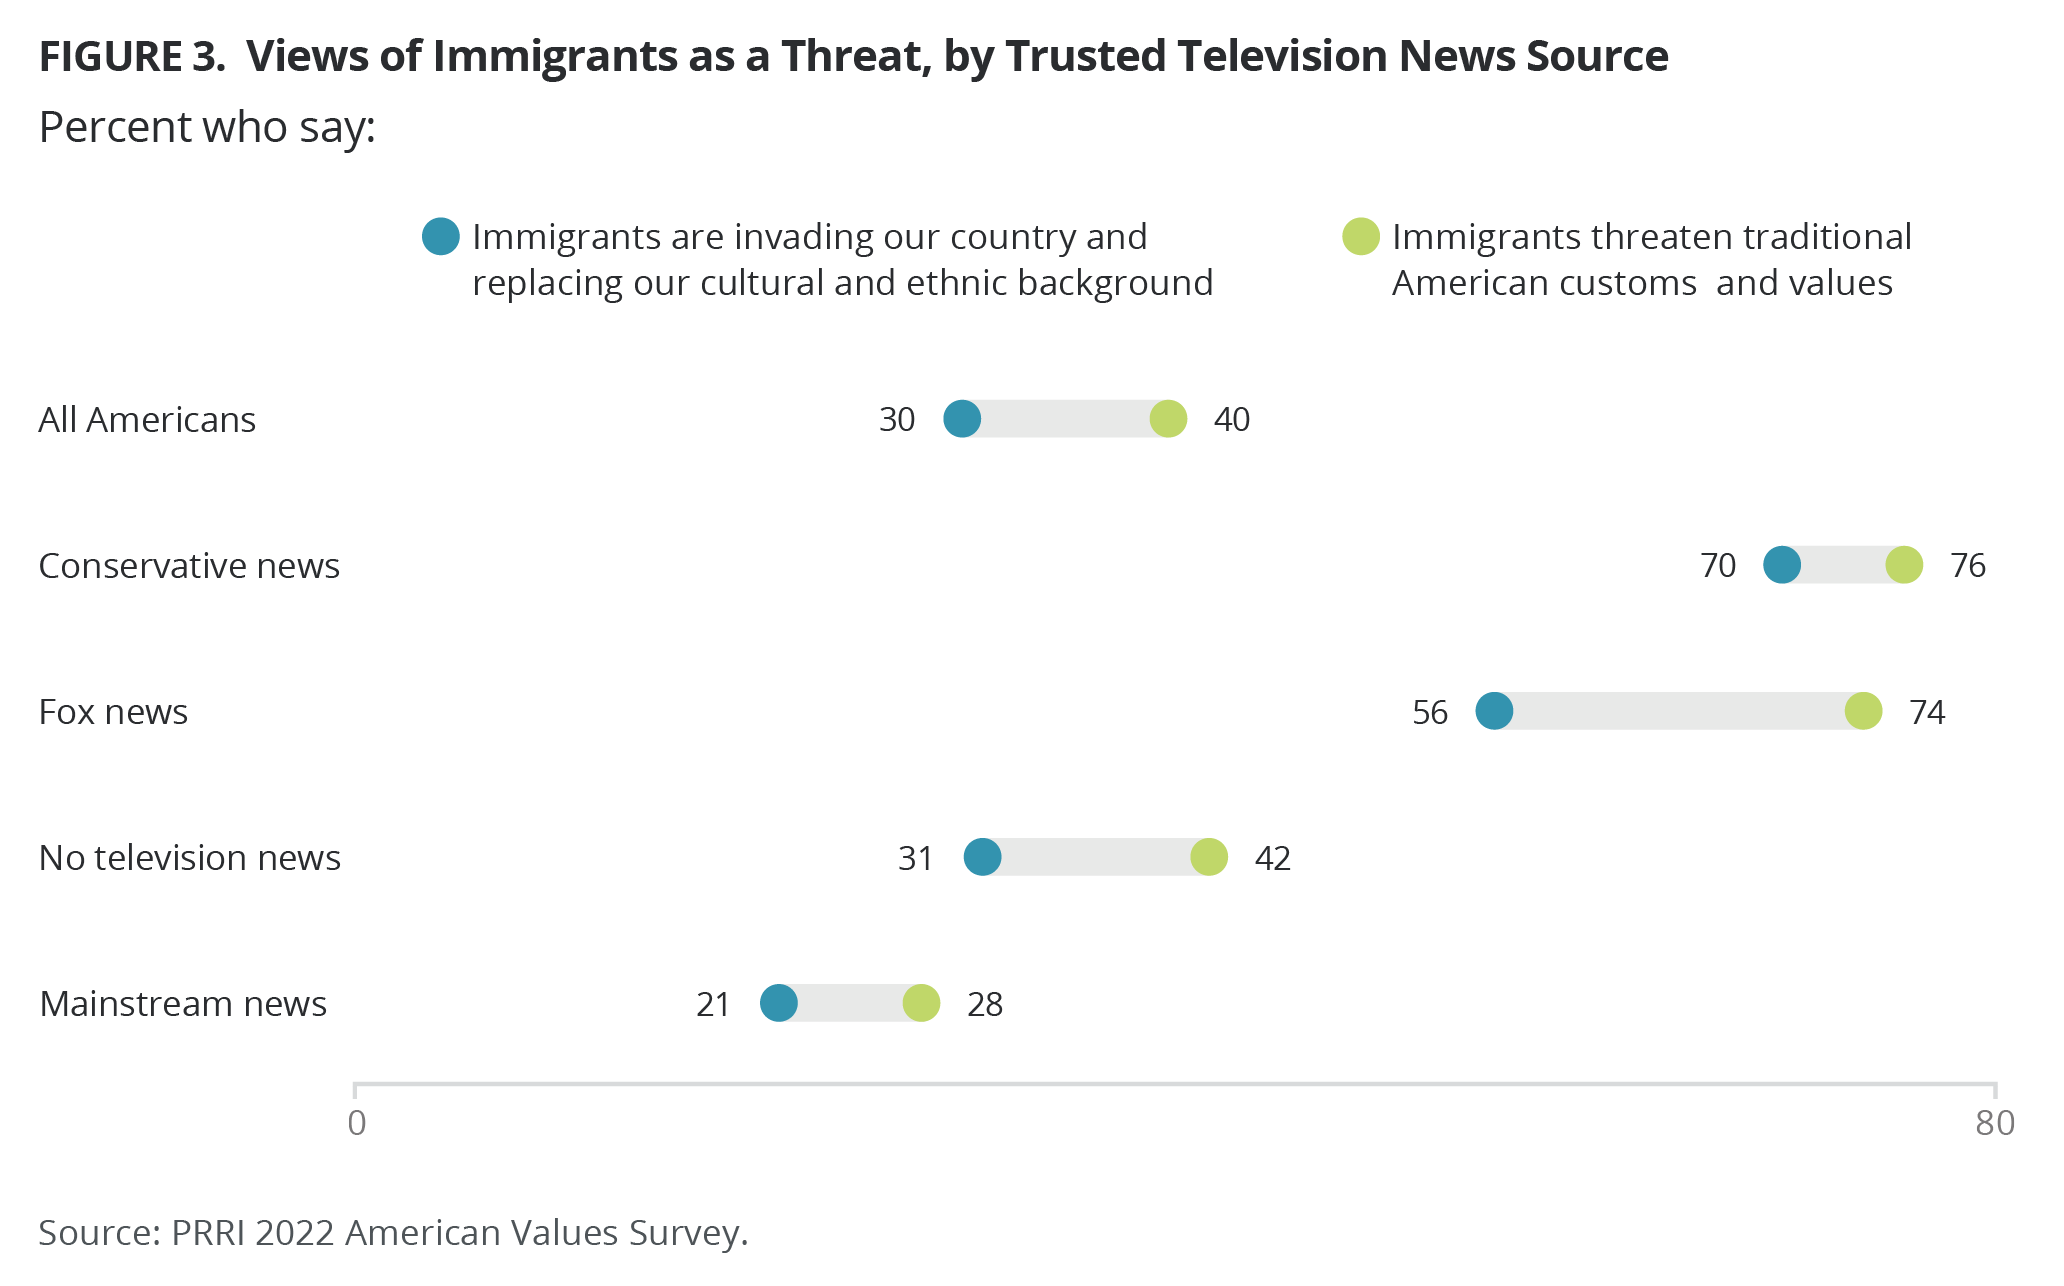
Answers to the threat question also correlate with media consumption. Those who most trust conservative television media (76%) or Fox News (74%) are significantly more likely than those whose most trusted news source is a non-television source (42%) or a mainstream television source (28%) to say that newcomers from other countries threaten traditional American customs and values.
Belief in Cultural Replacement Theory
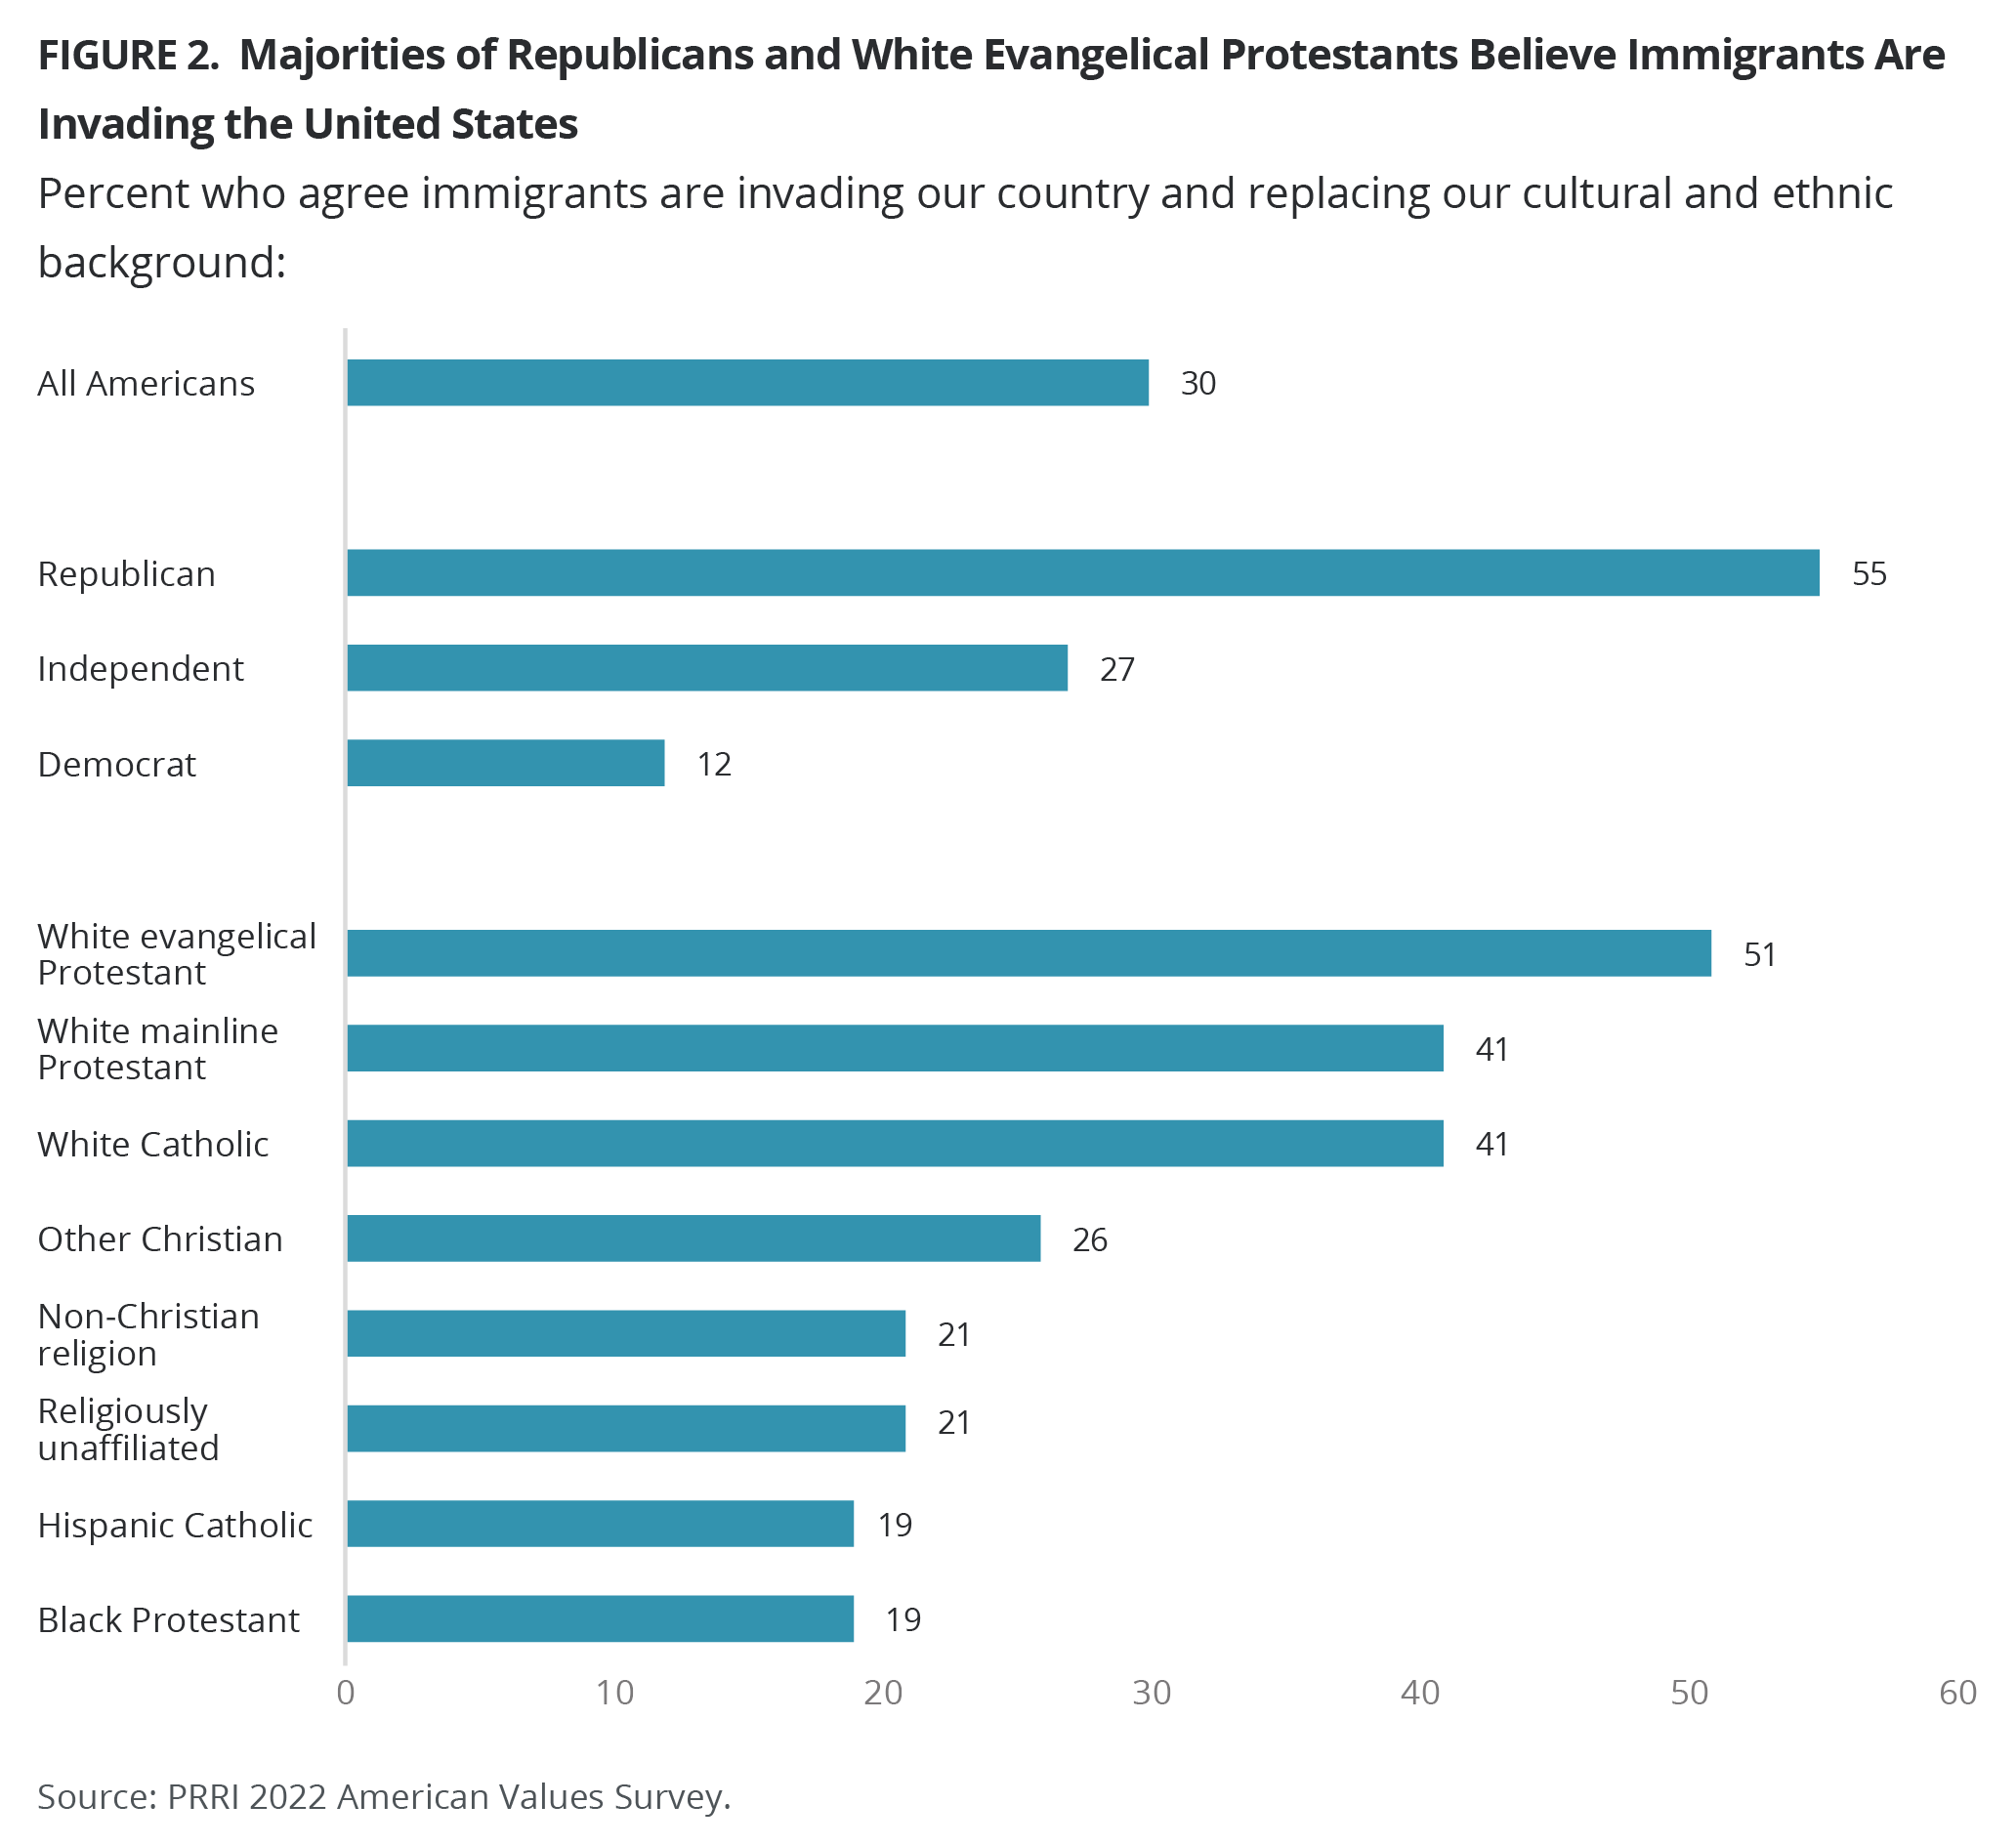
The “great replacement” theory — a conspiracy theory touted by white supremacists that claims nonwhite people are invading or immigrating to the United States in order to push white voters and citizens into the minority — appears to be becoming more mainstream among the political right. While most Americans do not agree with replacement theory, a key minority do. Three in ten Americans (30%) completely or mostly agree with the statement “immigrants are invading our country and replacing our cultural and ethnic background,” while nearly two-thirds (64%) completely or mostly disagree. Republicans (55%) are the outliers, as they are more than four times as likely as Democrats (12%) and twice as likely as independents (27%) to agree.
White Christian subgroups exhibit the most support for replacement theory: half of white evangelical Protestants (51%) and 41% of both white mainline Protestants and white Catholics agree that immigrants are invading the country. In contrast, 26% of members of other Christian religions, 21% of members of non-Christian religions, 21% of religiously unaffiliated Americans, 19% of Black Protestants, and 19% of Hispanic Catholics agree with this statement.
Among racial groups, white Americans remain the most likely to agree with this cultural replacement statement, with 36% agreeing, compared to about one-fifth of Hispanic Americans (21%), Black Americans (19%), and Americans of other races and ethnicities (22%). However, white Americans with a four-year college degree are notably less likely to agree than white Americans without a four-year college degree (26% vs. 43%).
Across demographics, a higher level of education is associated with lower agreement with replacement theory: 37% of those with a high school education or less, 30% of Americans with some college experience, 25% of those with a college degree, and 19% of Americans with a postgraduate degree agree with the statement.
Meanwhile, agreement is higher among older age groups: 19% of Americans ages 18-29, 25% of those ages 30-49, 35% of those ages 50-64, and 43% of those age 65 and older agree that immigrants are invading our country and replacing our cultural and ethnic background.
Whether people personally know any immigrants has a substantial impact on attitudes toward replacement theory. Only about one in four Americans who are or know someone who is a documented immigrant (27%) or who are or know someone who is an undocumented immigrant (26%) agree with replacement theory. However, 38% of those who do not know anyone who is a documented immigrant and 33% of those who do not know any undocumented immigrants agree.
Partisan differences are still present, however. A slim majority of Republicans who know a documented immigrant (51%) or an undocumented immigrant (54%) agree that immigrants are invading the country, compared with 64% of Republicans who do not know any documented immigrants and 57% of those who do not know any undocumented immigrants. By contrast, Democrats are notably less likely to agree with replacement theory, regardless of whether they know any documented (9%) or undocumented immigrants (11%) or do not know anyone who is a documented (18%) or undocumented immigrant (13%).
A majority of Americans who most trust conservative media outlets (70%) and Fox News (56%) among television news sources believe immigrants are invading our country and replacing our cultural and ethnic background, compared with 31% of those whose most trusted news source is a non-television source and 21% who most trust a mainstream television source.
Immigration Policies
Support for Pathway to Citizenship for All Undocumented Immigrants and for Dreamers
Nearly six in ten Americans (57%) say that immigrants living in the United States illegally should be given a way to become citizens, provided they meet certain requirements. More than one in ten (13%) say they would prefer that undocumented immigrants be eligible for permanent residency status but not citizenship, and one in four (25%) say all immigrants living in the country illegally should be identified and deported. Support for a pathway to citizenship for undocumented immigrants has remained remarkably consistent since 2013, when support was at 63%. In those years, support was at its lowest point in July of 2014 at 58% and September of 2022 at 57% and reached a high of 67% in 2019.
Support is lower for a pathway to citizenship for “Dreamers,” children brought illegally to the United States by their parents who are eligible for temporary legal status, but have to renew their status every two years. When informed of the current policy, 41% of Americans say the policy should be changed to allow children of undocumented immigrants to apply for citizenship or permanent resident status. About one-third of respondents (32%) say the policy should be left as it is, and about one in five (22%) say those brought to the country illegally as children should be identified and deported.[7]
Democrats have become more supportive of a path to citizenship for undocumented immigrants in recent years, with support increasing from 71% in 2013, when PRRI first asked the question, to 77% today. By contrast, Republicans (40%) are less supportive in 2022 than they were in 2013 (53%). Today, 10% of Republicans say they would prefer for undocumented immigrants to be eligible for permanent residency status but not citizenship, and nearly half (48%) say all immigrants living in the U.S. illegally should be deported — an increase from 44% in 2021 and 32% in 2013.
When it comes to Dreamers, Democrats (66%) are more than three times as likely as Republicans (18%) to support a pathway to citizenship or permanent residency. Meanwhile, 37% of Republicans and 28% of Democrats say the policy should be left as it is. Just 5% of Democrats say that Dreamers should be identified and deported, compared with more than four in ten Republicans (43%). Independents closely resemble all Americans on this issue, with a 42% plurality supporting a pathway to citizenship or permanent residency for Dreamers, 35% supporting the program as it is, and 19% supporting deportation.
Religious Tradition
Majorities of almost all religious groups support allowing undocumented immigrants to become citizens, including 73% of Black Protestants, 66% of religiously unaffiliated Americans, 62% of Hispanic Catholics, 60% of members of non-Christian religions, 58% of other Christians, 54% of white mainline Protestants, and 54% of white Catholics. White evangelical Protestants stand out as the only religious group in which a majority does not support a path to citizenship for undocumented immigrants, with only 42% expressing support. White evangelical Protestants are also the most likely to say undocumented immigrants should be identified and deported, with 49% expressing this view.
By contrast, the only religious groups in which majorities support a pathway to citizenship or residence for Dreamers are Black Protestants (57%), Hispanic Catholics (55%), and religiously unaffiliated Americans (54%). By contrast, only 42% of other Christians, 40% of members of non-Christian religions, 35% of white mainline Protestants, and 30% of white Catholics support this policy change. White evangelical Protestants are the least likely to support giving Dreamers a pathway to citizenship (21%) and the most likely to say that undocumented children of immigrants should be identified and deported (40%).
Demographics
Majorities of every racial and ethnic group support a pathway to citizenship for undocumented immigrants, including 53% of other races, 55% of white Americans, 64% of Black Americans, and 64% of Hispanic Americans. Among white Americans, those with a college degree are more likely to support this policy than those who do not have a college degree (61% vs. 51%). On the question of giving Dreamers a pathway to citizenship or permanent residency, slim majorities of Black Americans (53%) and Hispanic Americans (52%) express support, as do more than one-third of white Americans (37%) and Americans of other races (36%). White Americans with a college degree are notably more likely to support this policy than whites without a college degree (46% vs. 32%).
Majorities of Americans across all age groups support a pathway to citizenship for all undocumented immigrants, including 65% of Americans ages 18-29, 56% of Americans ages 30-49), 57% of Americans ages 50-64, and 54% of Americans 65 and over. However, Americans ages 18-29 (54%) are the only group in which a majority supports a pathway to citizenship or permanent residency for Dreamers. This policy doesn’t reach majority support among any of the other age groups: ages 30–40 (45%), ages 50-64 (33%), age 65 years and over (34%).
Support for a pathway to citizenship for all undocumented immigrants is higher among women (60%) than among men (55%). The same is true of support for a pathway for Dreamers, though support is lower on this question among both women (45%) and men (38%).
Perceptions of Threat
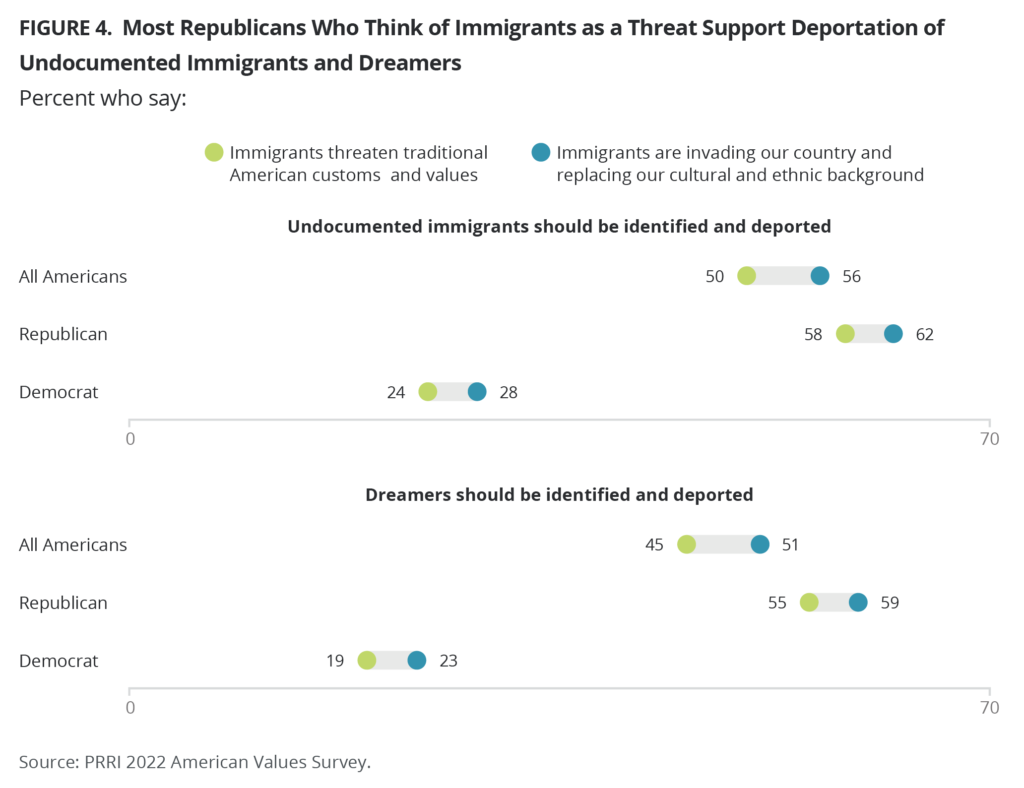
Nearly four in ten Americans who think that immigrants are a threat to traditional American values and customs (38%) also say that undocumented immigrants should be allowed a way to become citizens provided they meet certain requirements, and one in ten (11%) say they should be allowed to become permanent legal residents but not citizens. Half of Americans who view immigrants as a threat (50%) say that undocumented immigrants should be identified and deported. This number rises to 58% among Republicans who view immigrants as a threat, while only about 24% of Democrats in this group think the same.
Among Americans who think immigrants are invading the country and replacing our cultural and ethnic background, 33% say that undocumented immigrants should be allowed a way to become citizens if they meet certain requirements, and 10% say they should be allowed to become permanent legal residents but not citizens. A majority of this group (56%) say undocumented immigrants should be identified and deported, with Republicans (62%) more than twice as likely as Democrats (28%) to agree with this statement.
These patterns hold for Dreamers. Only 18% of those who think immigrants are a threat say that Dreamers should be allowed to apply for citizenship or permanent residency. But 35% of this group say the current policy should be left as it is and 45% say that Dreamers should be identified and deported — a view that is supported by 55% of Republicans in this group and 19% of Democrats.
Among those who think immigrants are invading the country and replacing its cultural and ethnic background, 15% say the policy should be changed to allow Dreamers to apply for citizenship or permanent residency, 33% say the policy should be left as it is, and a slim majority (51%) say Dreamers should be identified and deported. This last number jumps to 59% among Republicans in this group, compared to 23% of Democrats.
Media Consumption
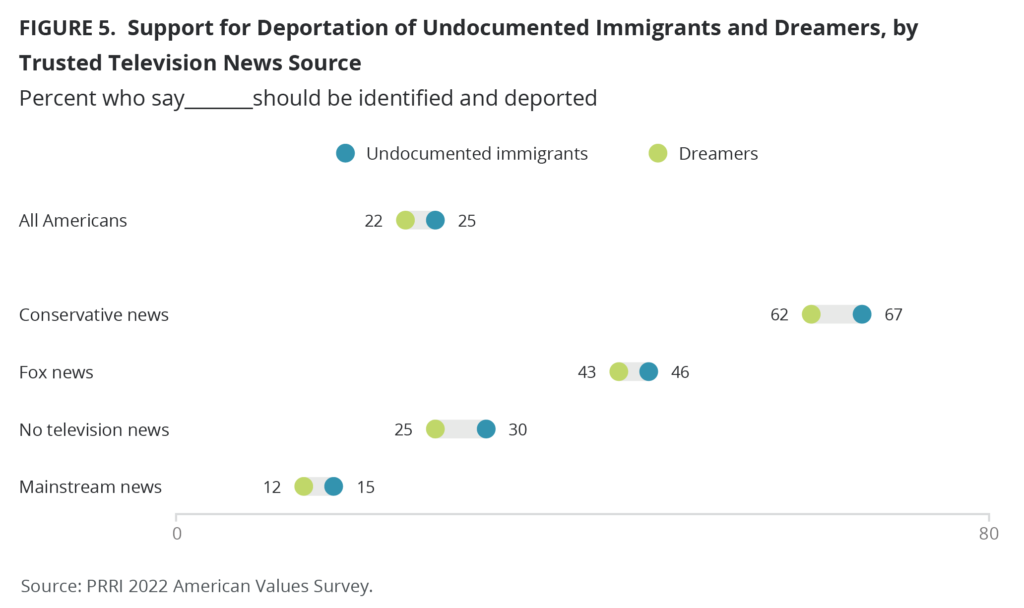
Support for these policies also varies according to which news sources respondents said they most trusted. Those who most trust conservative media outlets (22%) and Fox News (38%) among television news sources are less likely than those who most trust a non-television source (54%) or a mainstream television source (70%) to support a pathway to citizenship for undocumented immigrants. However, Americans are notably less supportive of Dreamers across all of these media-consumption groups (12%, 13%, 40%, and 53%, respectively). In fact, majorities of Americans who most trust conservative television news sources say undocumented immigrants (67%) and Dreamers (62%) should be identified and deported, compared to 46% and 43%, respectively among those who trust Fox News. Three in ten or fewer of those who do not trust a television news source or trust mainstream news support identifying and deporting immigrants and Dreamers.
Support for Refugees and Work Immigrants
Accepting Afghan Refugees vs. Ukrainian Refugees
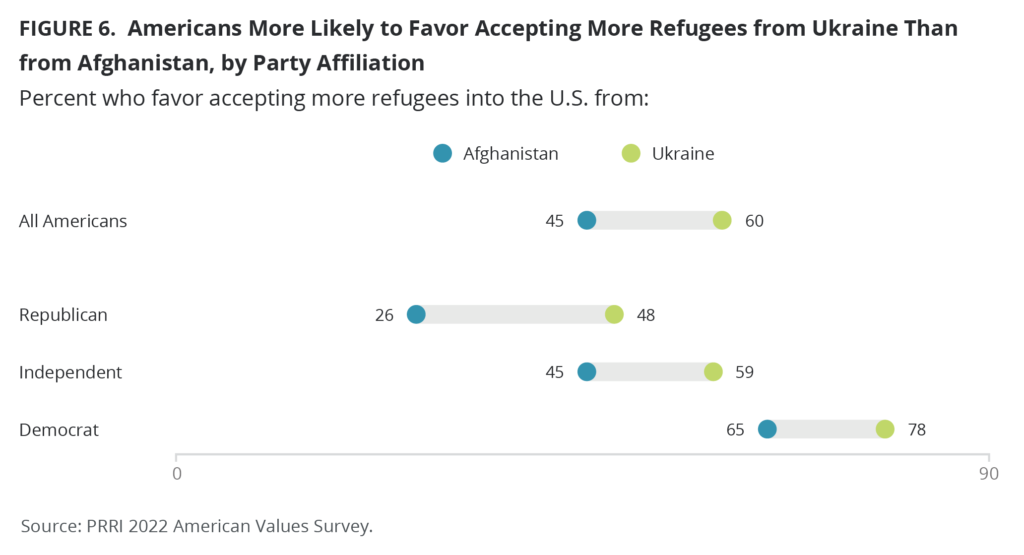
With the United States pulling its troops out of Afghanistan in 2021 and the conflict between Ukraine and Russia escalating in early 2022, PRRI asked Americans if they favor or oppose accepting more refugees from these two nations into the U.S. The results showed stark differences: a majority of Americans (60%) favor accepting more refugees from Ukraine, compared to 45% who favor accepting more refugees from Afghanistan. These differences are evident across party affiliation and every demographic group.
Even though Republicans are less likely than Democrats to favor accepting refugees overall, they are significantly less likely to favor accepting more Afghan refugees (26%) than they are Ukrainian refugees (48%). A majority of Democrats favor accepting more refugees from Afghanistan (65%) but even more favor accepting Ukrainian refugees (78%). Independents mirror all Americans.
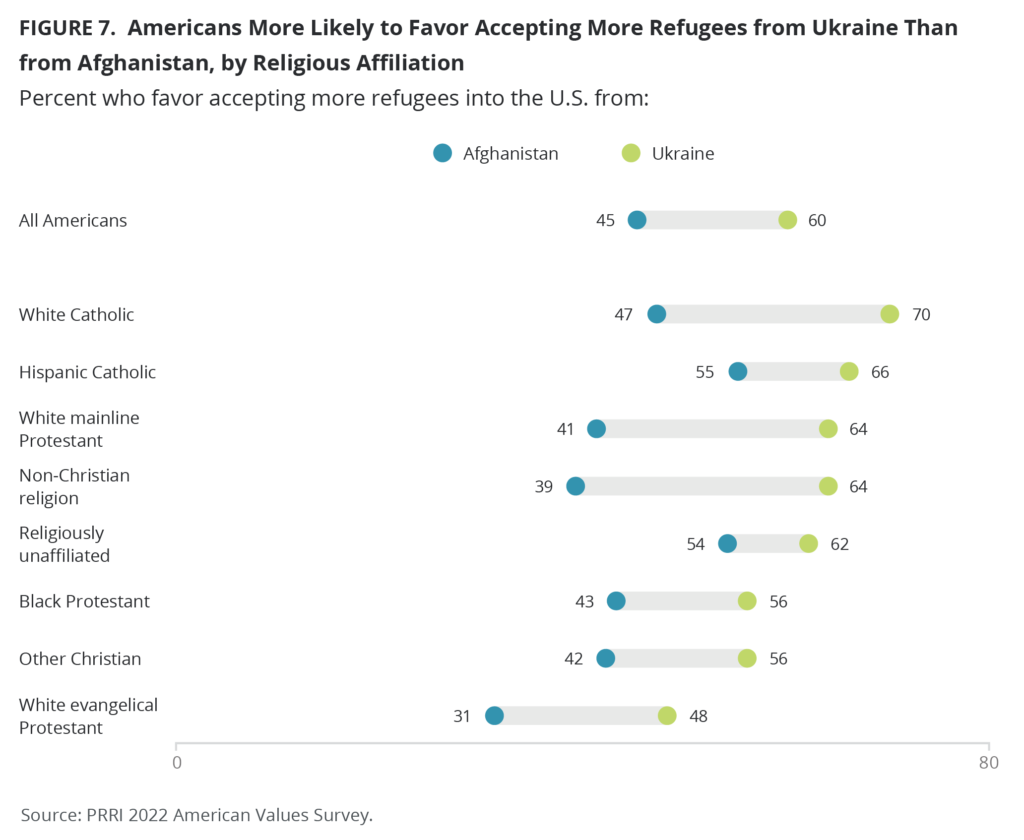
Majorities across all religious groups favor accepting more refugees from Ukraine, including 70% of White Catholics, 66% of Hispanic Catholics, 64% of white mainline Protestants, 64% of members of non-Christian religions, 62% of religiously unaffiliated Americans, 56% of Black Protestants and other Christians, and 48% of white evangelical Protestants. However, Hispanic Catholics (55%) and religiously unaffiliated Americans (54%) are the only groups in which a majority favor accepting more refugees from Afghanistan. Less than half of white Catholics (47%), 43% of Black Protestants, 42% of other Christians, 41% of white mainline Protestants, 39% of members of non-Christian religions, and only 31% of white evangelical Protestants favor accepting more refugees from Afghanistan.
Across racial groups, a similar pattern emerges in which Americans are more willing to accept more Ukrainian refugees than to accept more Afghan refugees. This is true among white Americans (62% vs. 45%), Hispanic Americans (63% vs. 48%), other-race Americans (56% vs. 38%), and Black Americans (50% vs. 40%). However, whites with a college degree are more accepting of both Ukrainian (76%) and Afghan refugees (61%) than are whites without a college degree (52% and 36%, respectively).
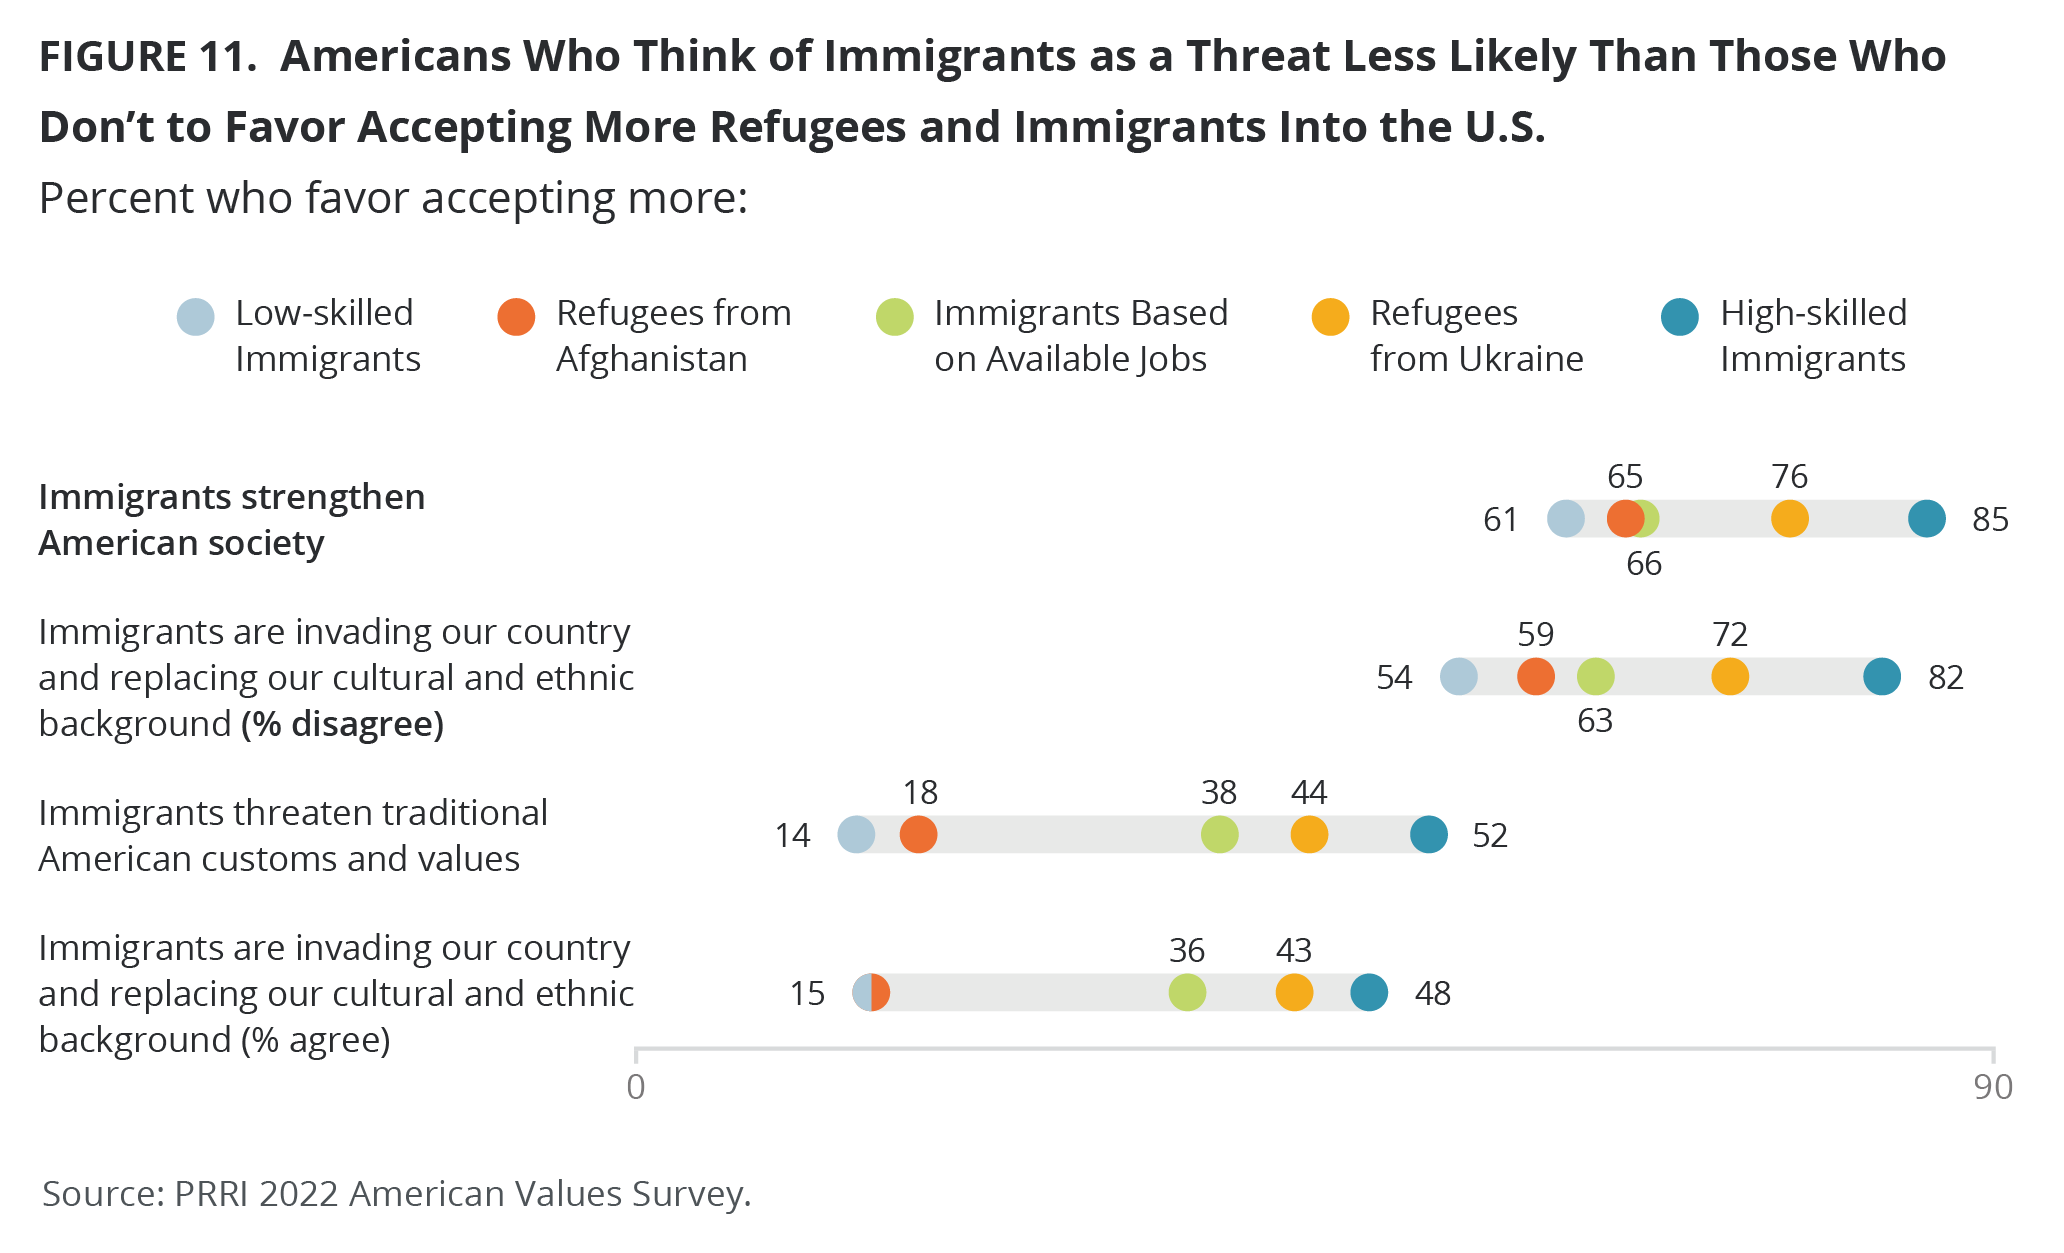
Not surprisingly, Americans who think that immigrants pose a threat to traditional values and customs are notably less likely than all Americans to favor accepting more refugees from Ukraine, with 44% expressing support, but this number is even smaller when it comes to refugees from Afghanistan, at only 18%. Similarly, Americans who think that immigrants are invading our country and replacing our ethnic and cultural background are notably less likely to favor accepting more refugees from Ukraine (43%) and even less likely to favor accepting those from Afghanistan (15%).
Americans who most trust Fox News among television news sources are the least likely to favor accepting more refugees from both Ukraine (47%) and Afghanistan (23%), compared with those whose most trusted news source is a non-television source (53% and 41%, respectively) or a mainstream television source (74% and 56%).[8]
Accepting Highly Skilled vs. Low-Skilled Immigrants
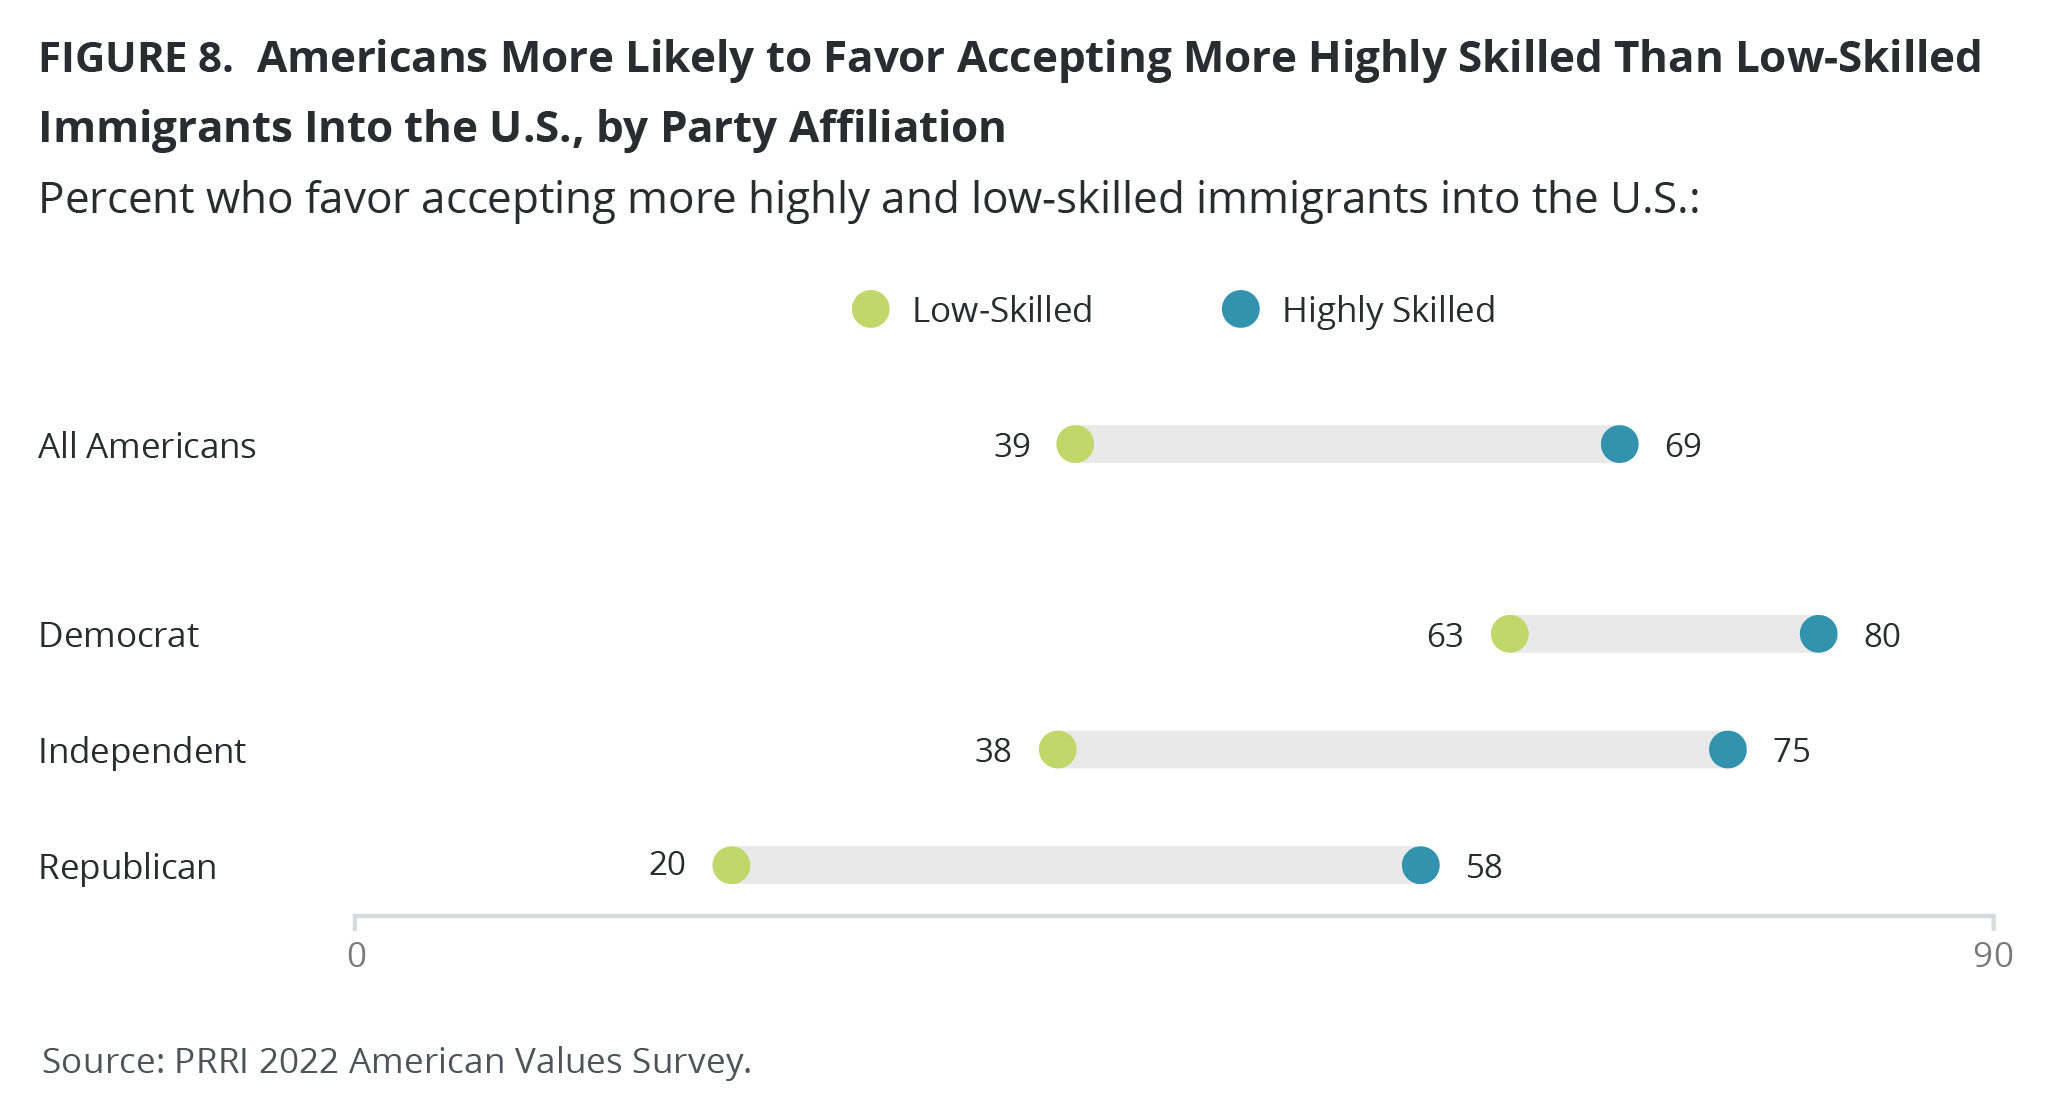
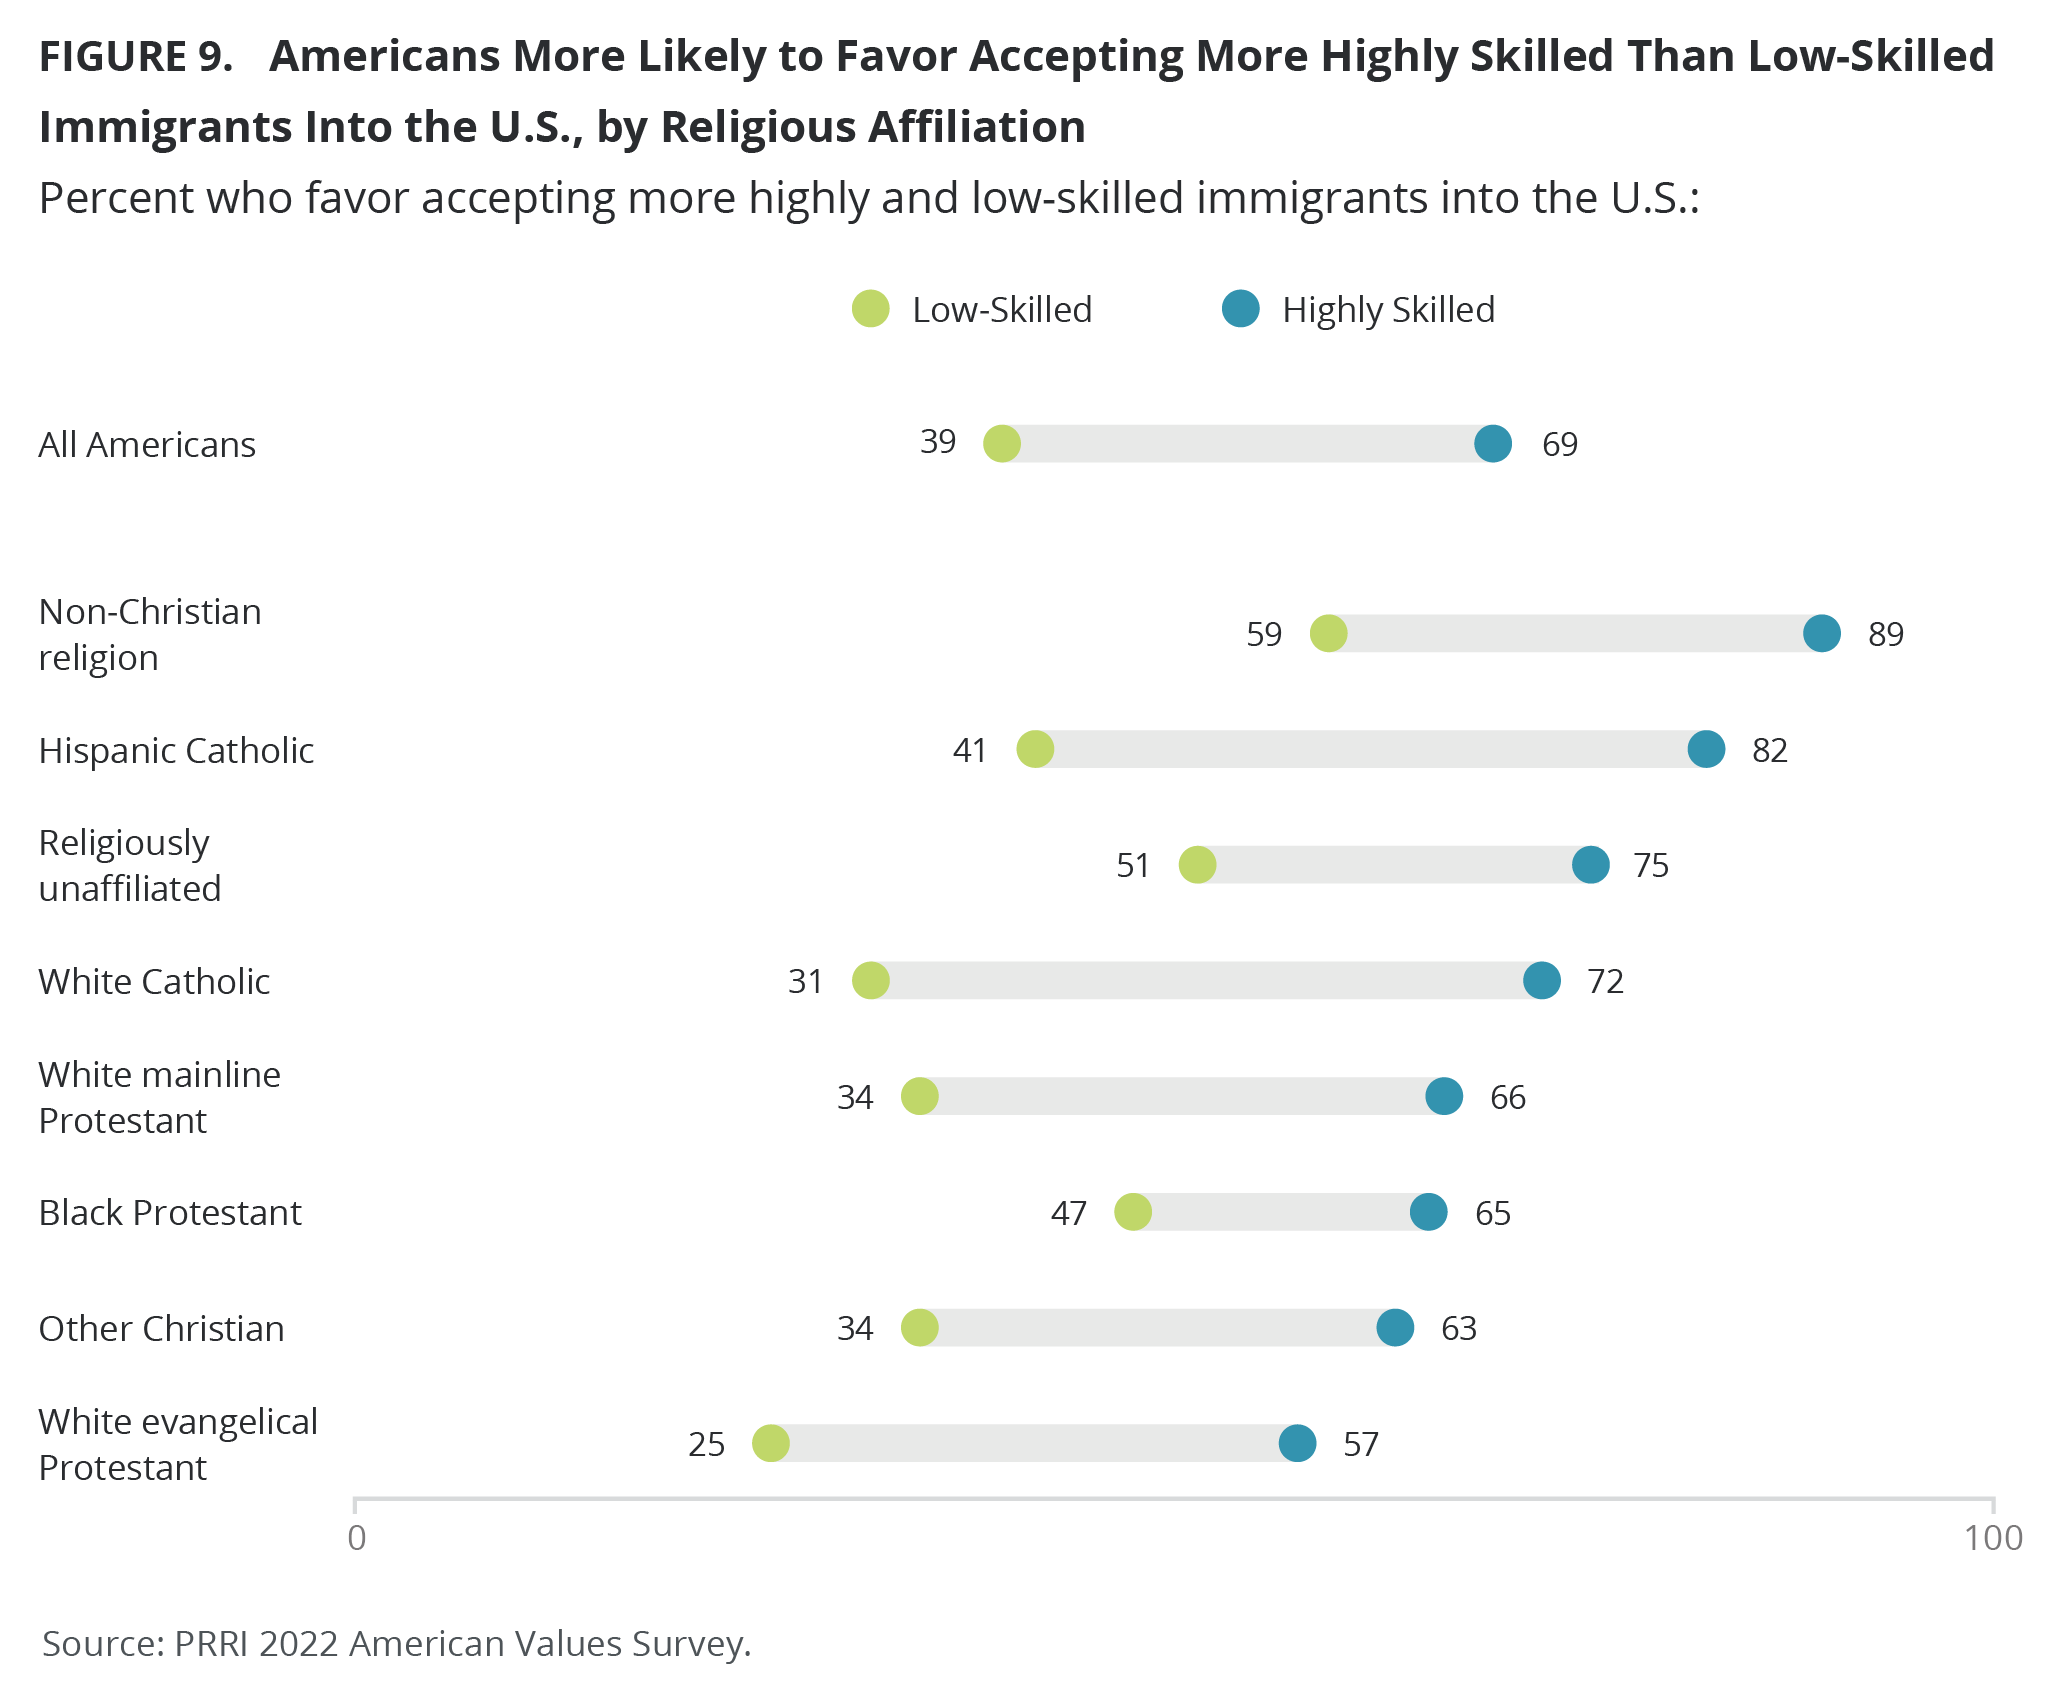
Americans are significantly more likely to favor accepting more highly skilled immigrants (69%) into the United States than to favor accepting more low-skilled immigrants (39%), and this is true across all party affiliations and demographic groups. In fact, across demographics, there is not much variation in support for accepting more highly skilled immigrants into the country, and majorities of Republicans (58%), independents (75%), and Democrats (80%) all express support.
Similarly, 57% of white evangelical Protestants, 63% of other Christians, two-thirds of Black Protestants (65%) and white mainline Protestants (66%), 72% of white Catholics, 75% of religiously unaffiliated Americans, 82% of Hispanic Catholics, and 89% of members of non-Christian religions favor accepting more highly skilled immigrants into the country.
By contrast, only 20% of Republicans are in favor of accepting more low-skilled immigrants into the United States, compared with 38% of independents and 63% of Democrats.
Religiously unaffiliated Americans (51%) and members of non-Christian religions (59%) are the only two religious groups in which majorities favor accepting more low-skilled immigrants. A minority of all other groups express support, including 47% of Black Protestants, 41% of Hispanic Catholics, 34% of both white mainline Protestants and white Catholics, 31% of white Catholics, and 25% of white evangelical Protestants .
At least half the members of every racial group are supportive of accepting more high-skilled immigrants, including 63% of Hispanic Americans, 62% of white Americans, 56% of Americans of other races, and 50% of Black Americans. However, Americans of every racial group are notably less likely to accept low-skilled immigrants, including 48% of Hispanic Americans, 45% of white Americans, 38% of Americans of other races, and 40% of Black Americans. White Americans with a college degree are notably more supportive of accepting both highly skilled (76%) and low-skilled (61%) immigrants than are whites without a college degree (52% and 36%, respectively).
Interestingly, even among Americans who view immigrants as a threat to traditional values and customs, a majority (52%) favor accepting high-skilled immigrants into the United States, though only 14% support accepting low-skilled immigrants. A similar pattern emerges among Americans who think that immigrants are invading our country and replacing our ethnic and cultural background: about half (48%) favor accepting high-skilled immigrants into the United States, while only 15% favor accepting low-skilled immigrants.
Across media-consumption groups, solid majorities favor accepting high-skilled immigrants, including 74% of those who most trust a mainstream television source, 69% of those who most trust a non-television source, and 67% of those who most trust Fox News. By contrast, 49% of those who most trust a mainstream television source, 38% of those who trust non-television sources, and only 18% of those who trust Fox News favor accepting low-skilled immigrants.[9]
Accepting More Immigrants Based on What Types of Jobs Are Available
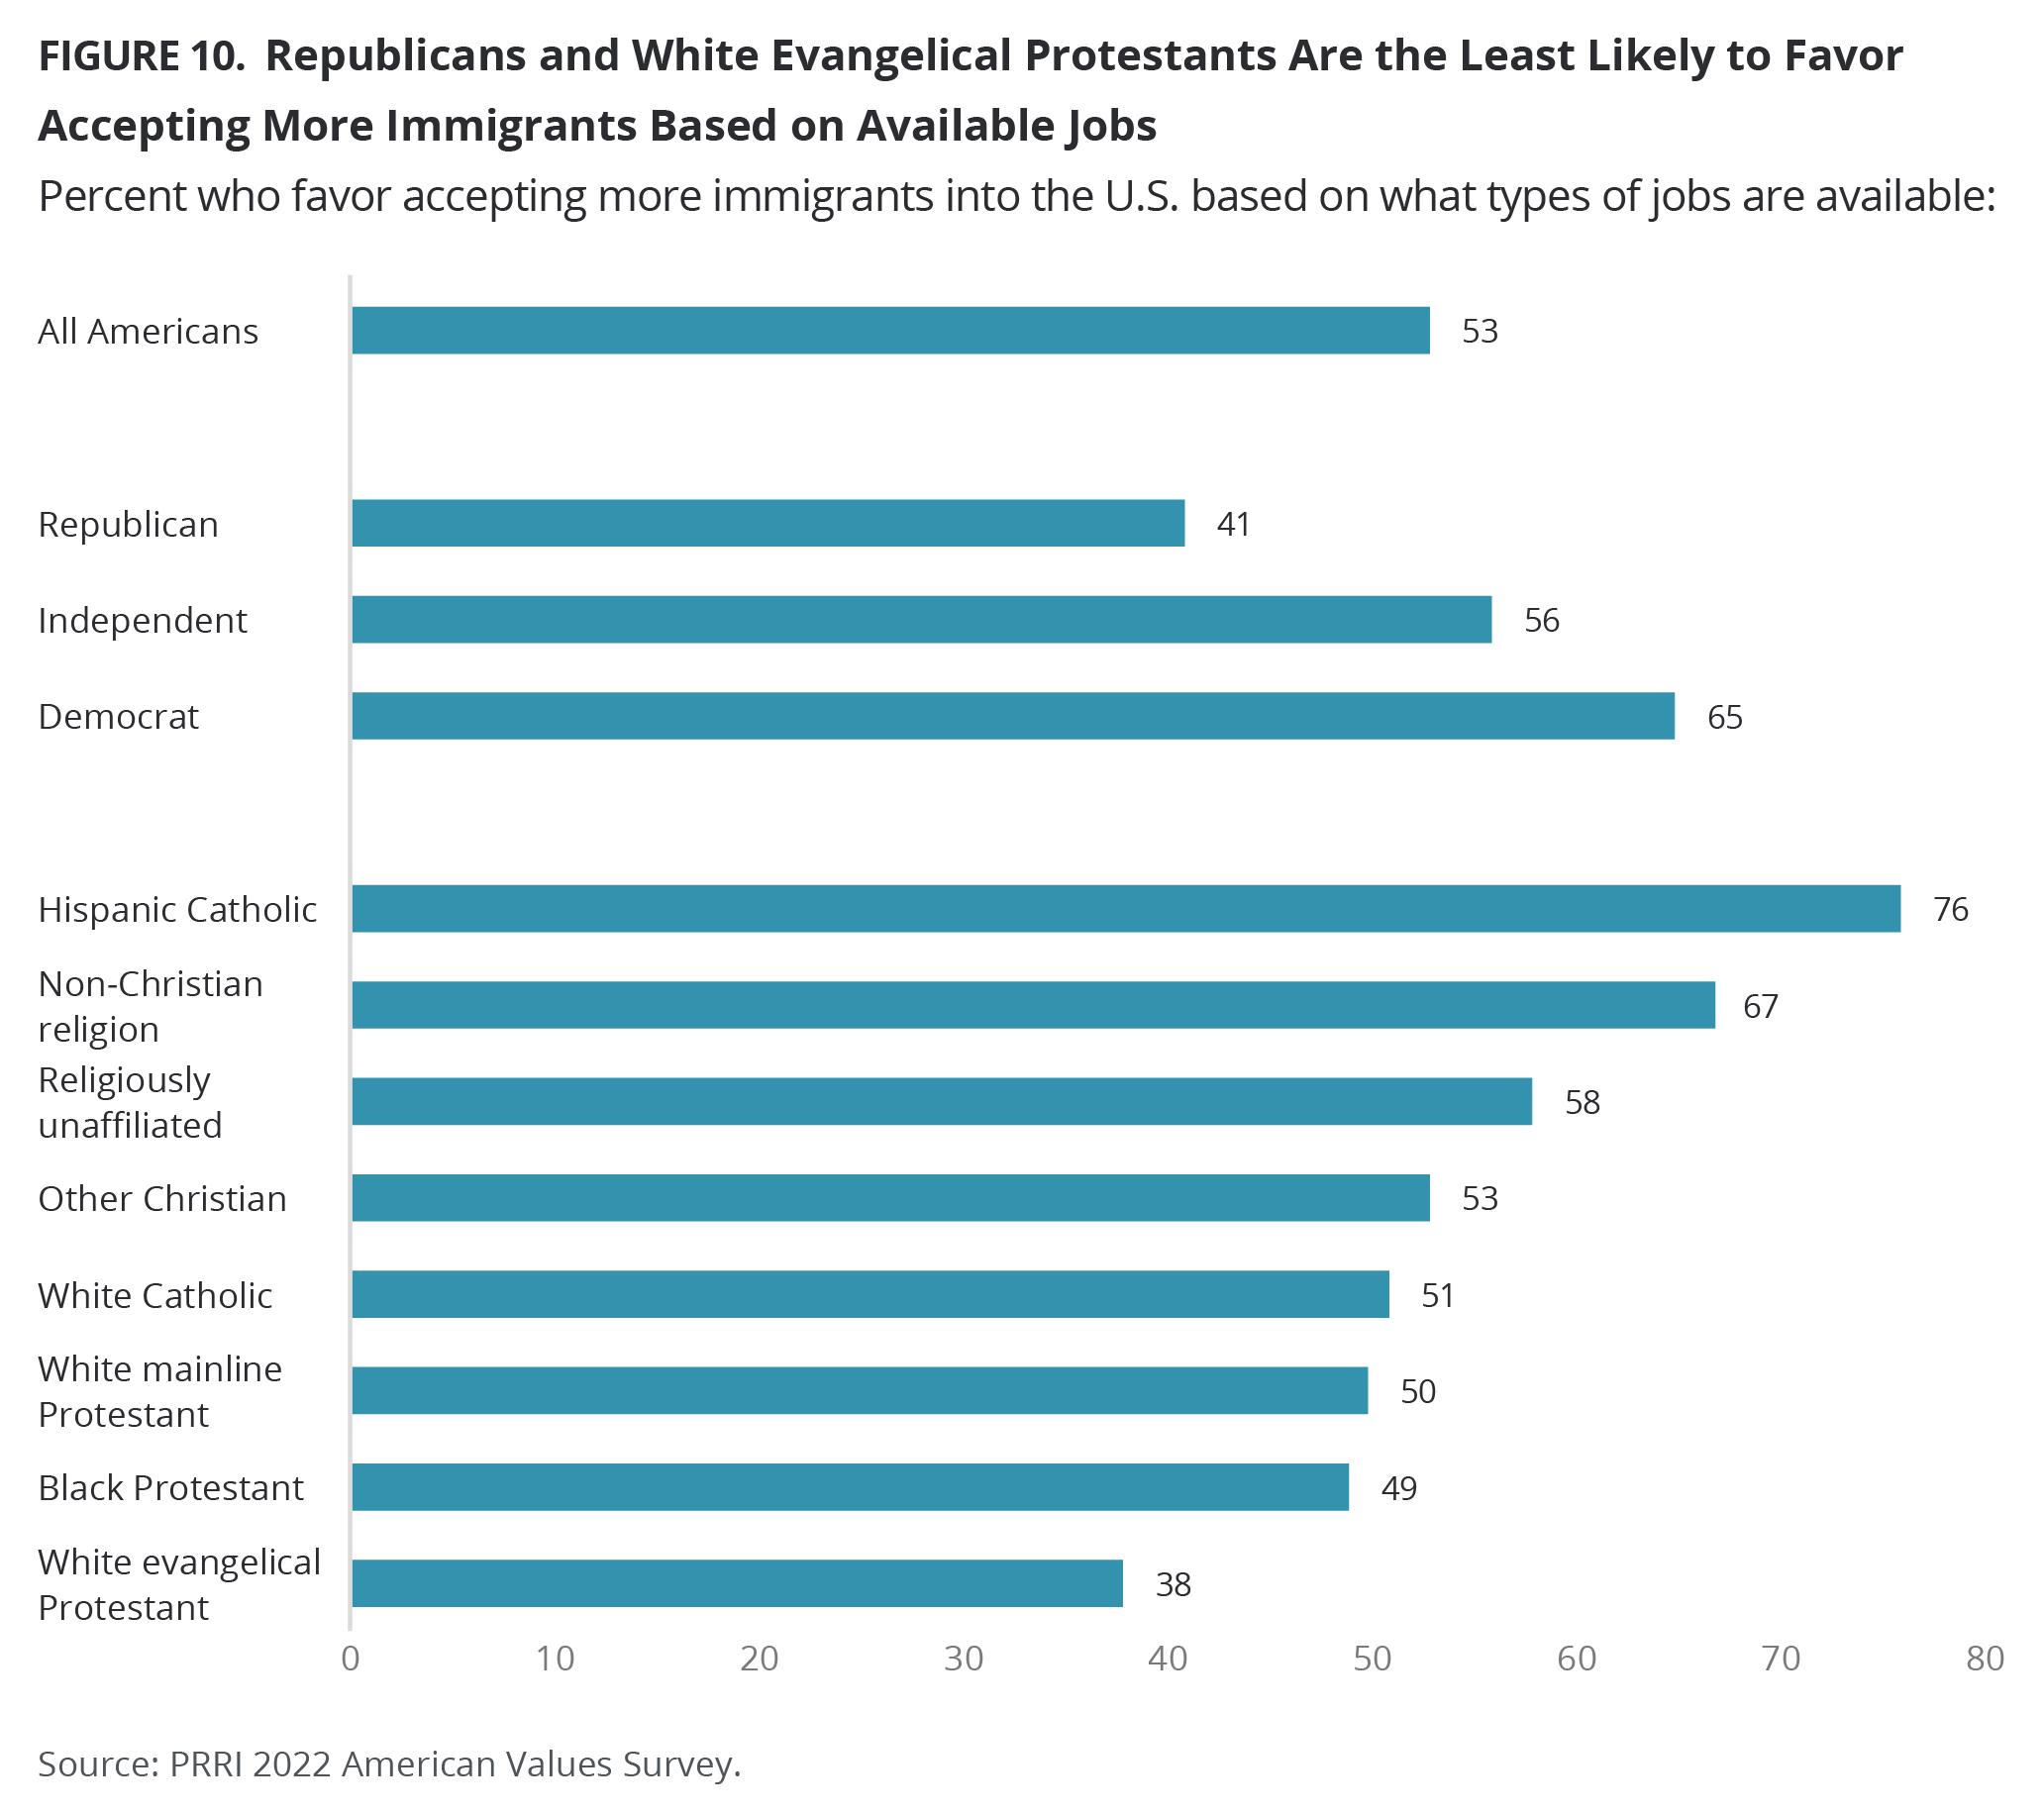
Americans are divided on the question of accepting more immigrants into the United States based on what types of jobs are available, with 53% favoring and 43% opposing the idea, and there is considerable variation across different groups.
About two-thirds of Democrats (65%), 56% of independents, and 41% of Republicans favor accepting more immigrants based on the jobs available.
Hispanic Catholics (76%) are the most likely to favor this policy, followed by members of non-Christian religions (67%), religiously unaffiliated Americans (58%), and other Christians (53%). About half of white Catholics (51%), white mainline Protestants (50%), and Black Protestants (49%) also favor this policy, compared with only 38% of white evangelicals.
Black Americans (43%) are the least likely to favor accepting immigrants based on the types of jobs available, compared with 50% of white Americans, 60% of other-race Americans, and 66% of Hispanics. Whites with a college degree are more likely to favor this policy than are whites without a college degree (64% vs. 42%).
Support for this policy generally increases with education: 45% of Americans with a high school degree or less, 50% of Americans with some college, 65% of Americans with a college degree, and 64% of Americans with a postgraduate degree express support.
By contrast, support decreases with age: 57% of Americans ages 18-29, 54% of Americans ages 30-49, 49% of Americans 50-64, and 51% of Americans 65 or over support the policy. Men are more likely than women to favor accepting immigrants based on the types of jobs available (56% vs. 49%).
Among Americans who think that immigrants are a threat to traditional values and customs, 38% favor accepting more immigrants into the United States. based on what jobs are available. The level of support is about the same as among those who think that immigrants are invading the country and replacing its ethnic and cultural background (36%).
Americans who most trust Fox News (49%) or a non-television source (50%) are less likely than those who most trust a mainstream television source (60%) to favor accepting more immigrants into the U.S. based on the types of jobs available.
General Views About the Country and Views of Immigrants as a Threat
Views About the Country and Immigrants as a Threat to Traditional Customs and Values
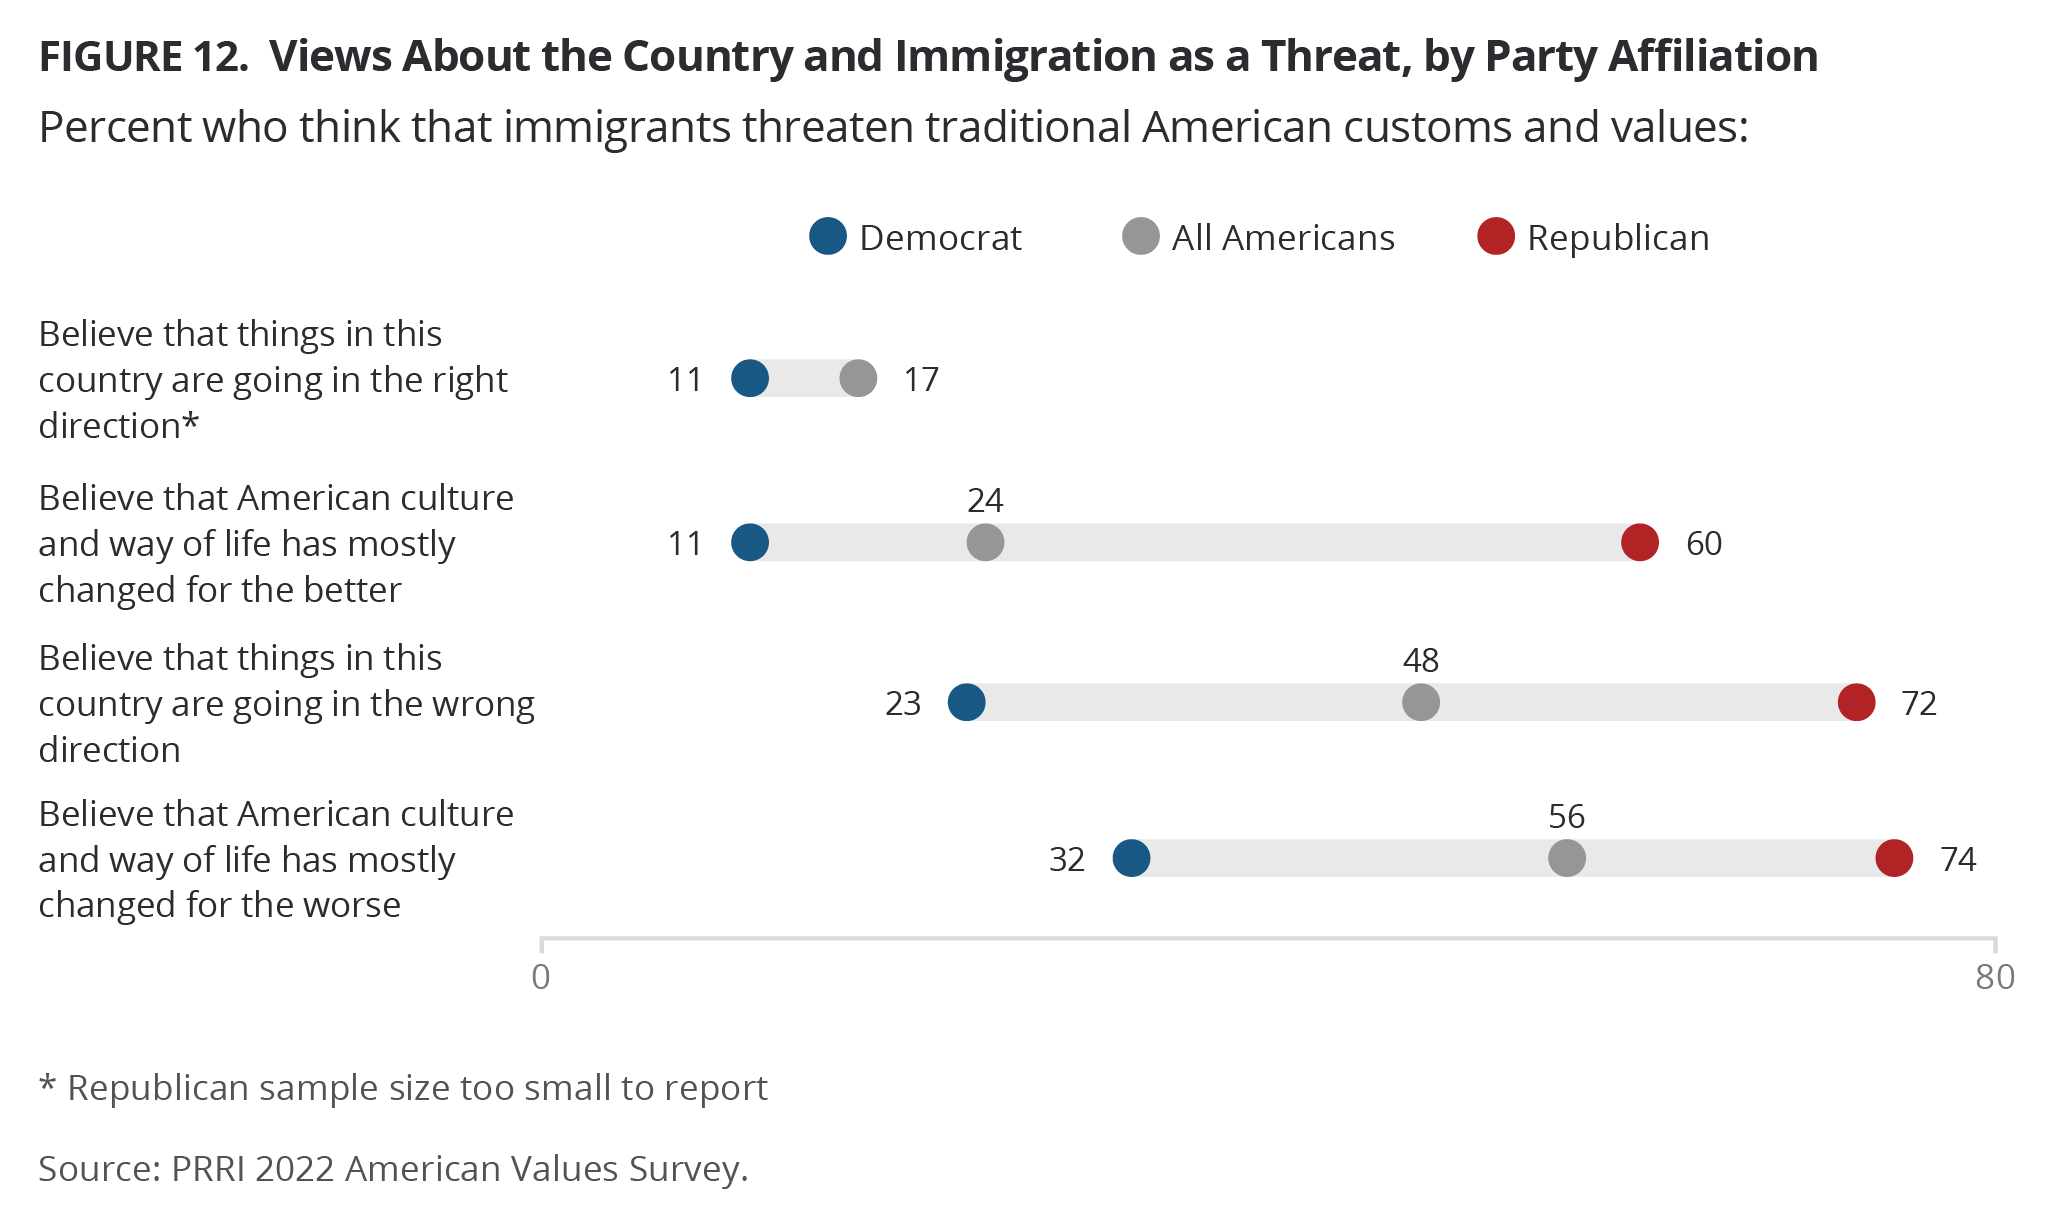
Among Americans who say things in this country are going in the right direction, only 17% say that immigrants are threatening traditional American values and customs, compared with 48% of those who say that the country is going in the wrong direction. The partisan divide remains, though: Republicans who say that the country is going in the wrong direction are about three times more likely than Democrats in that group to think that immigrants are threatening American society (72% vs. 23%).
The majority of those who say America’s culture and way of life have mostly changed for the worse since the 1950s (56%) also believe that the growing number of newcomers threatens traditional American customs and values, compared with only 24% of those who think the country has mostly changed for the better. Negative views of immigrants are higher among Republicans who think that American culture and way of life has changed for the worse (74%) than among Republicans who think it has changed for the better (60%). There is a similar difference among Democrats, though Democrats are generally less likely to hold negative views of immigrants. Democrats who think that American society has changed for the worse (32%) are about three times more likely than Democrats who think it has changed for the better (11%) to say that immigrants are a threat to American customs and values.
Of those who view President Joe Biden favorably, only 17% say that newcomers are a threat to American customs and values. This is in stark contrast to those who view him unfavorably, among whom a majority (58%) think immigrants are a threat. Viewing immigrants as a threat to American customs and values is even less common among Americans who strongly approve of Biden as president (16%), or among those who approve of Biden’s handling of immigration (14%). By contrast, among those who view former President Donald Trump favorably, the vast majority (71%) say that newcomers are threatening American society, compared with 24% of those who view Trump unfavorably.
Florida Gov. Ron DeSantis has recently come to the forefront of national politics, partly because of policies that involve taking a tough stand on immigration issues. Unsurprisingly, Americans who view DeSantis favorably are notably more likely than those who view him unfavorably to say that newcomers are a threat to American customs and values (69% vs. 22%).
Critical Issues and Views of Immigrants as a Threat to Traditional Customs and Values
Four in ten Americans (40%) say that immigration was a critical issue in deciding how they vote in the 2022 midterm elections. Among this group, 63% view newcomers as threatening American customs and values, while 35% think immigrants strengthen the country. Republicans in this group are about three times as likely as Democrats to think immigrants threaten traditional American customs and values (78% vs. 25%)
Among the 47% of Americans who considered crime a critical issue in the midterm election, the majority (53%) think that immigrants threaten traditional American customs and values, compared with 44% who think immigrants strengthen the country. Republicans who find crime to be a critical issue are substantially more likely than Democrats who think the same to say that immigrants threaten traditional American customs and values (74% vs. 22%).
Among the one-third of Americans (33%) who considered jobs and unemployment to be a critical issue in the midterm election, their views of immigrants is divided: 50% see newcomers as a strength, and 48% see them as a threat to American society. Among Republicans in this group, 74% say that immigrants are a threat, compared with 17% of Democrats in this group.
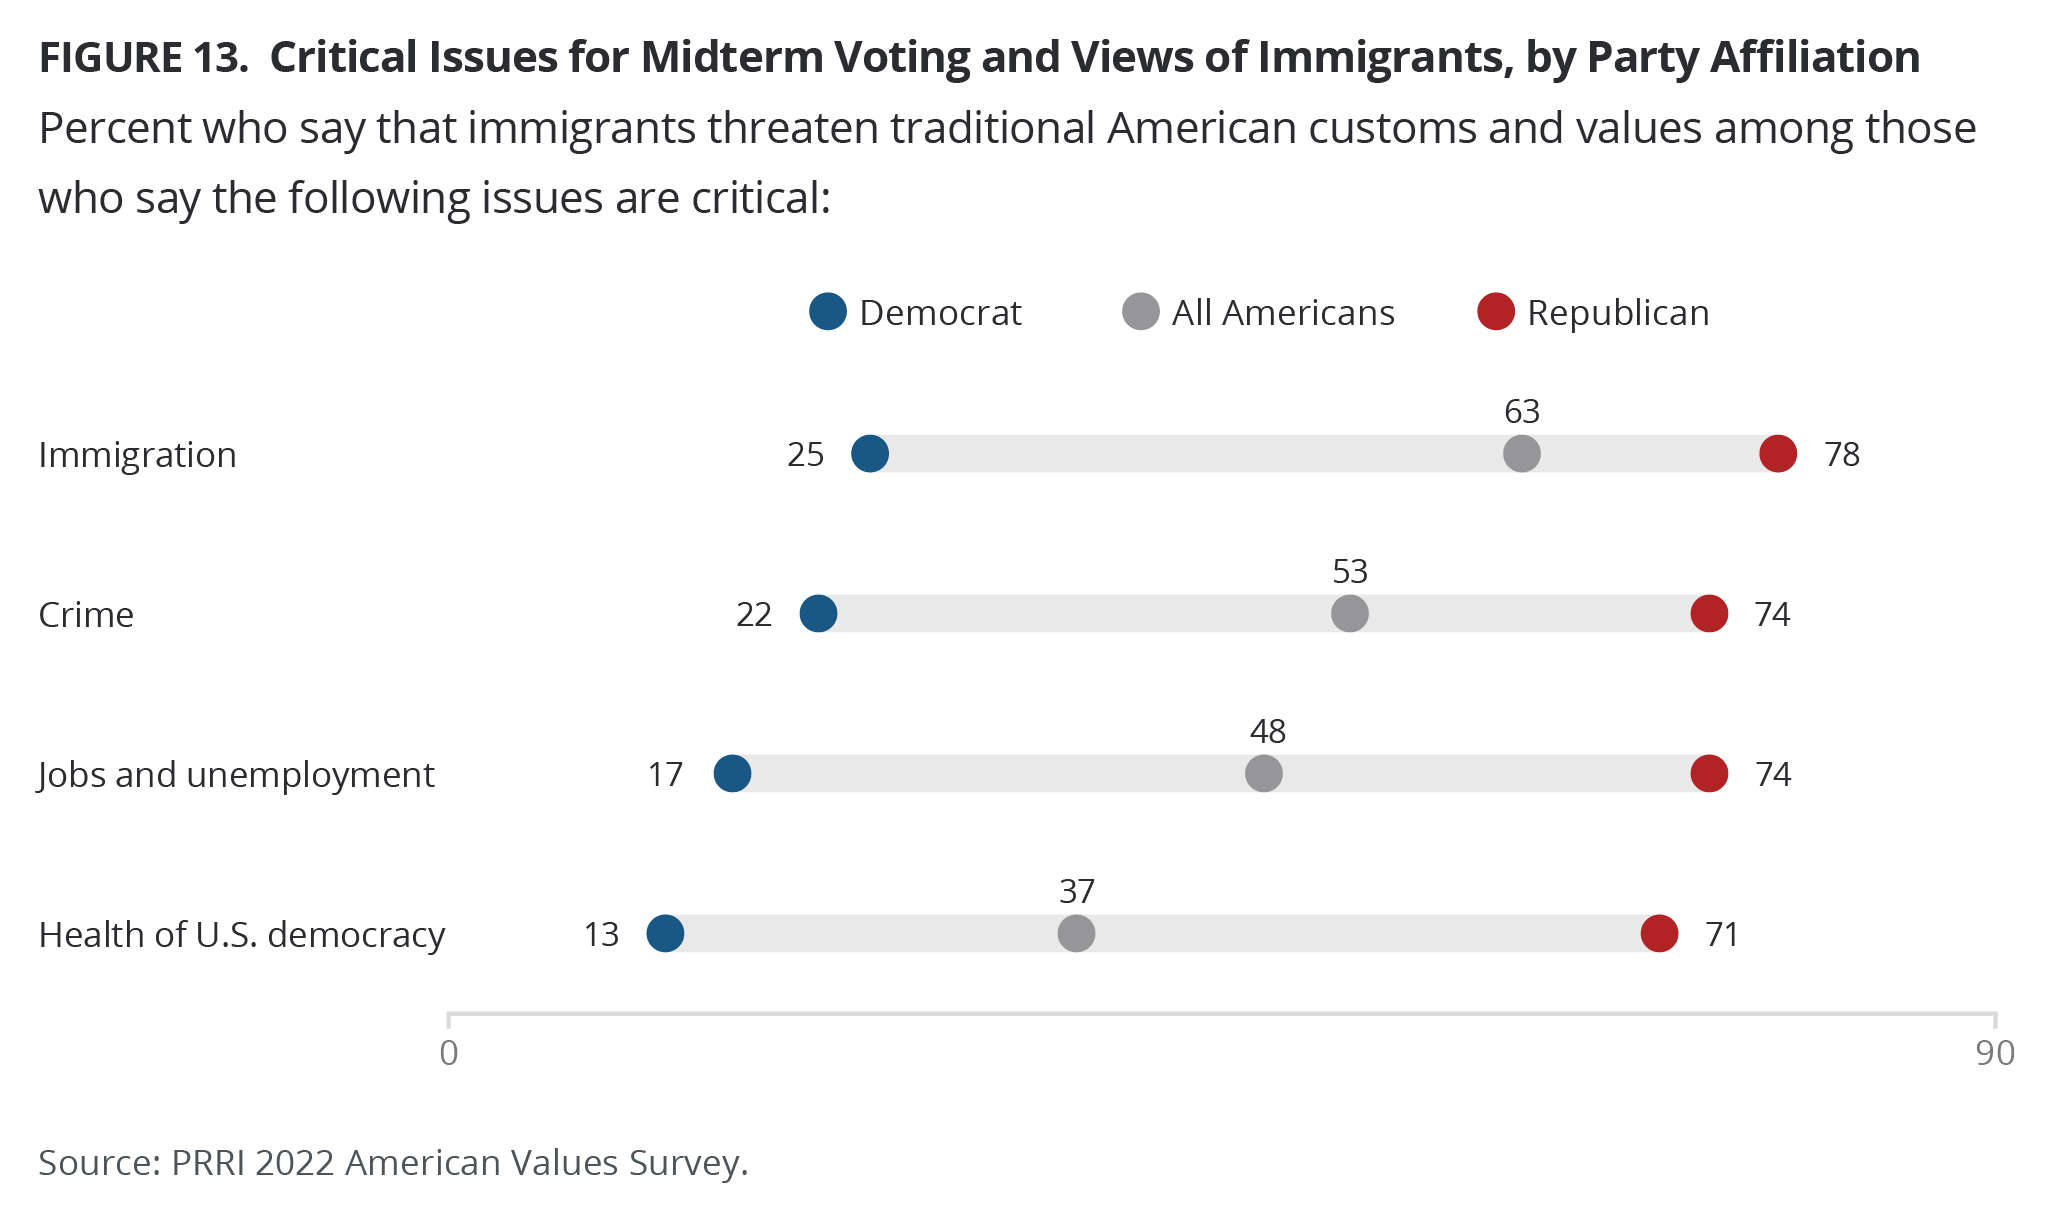
Interestingly, among the 57% of Americans who considered the health of the country’s democracy to be a critical election issue, there is a significant divide in views of immigrants: 37% think that immigrants are a threat to traditional American customs and values, including 71% of Republicans in this group and only 13% of Democrats, compared with 61% who think that immigrants strengthen the country.
Views About the Country, QAnon Beliefs and Agreement with Replacement Theory
Americans who say that things in this country are going in the wrong direction are more than twice as likely as those who say things are going in the right direction to agree with replacement theory (36% vs. 14%). Of Republicans who state that things in this country are going in the wrong direction, 58% also say immigrants are invading the country and replacing our cultural and ethnic background. By contrast, among Democrats who believe the country is headed in the wrong direction, only 14% say this about immigrants.
Similarly, those who say that the American culture and way of life have changed for the worse since the 1950s are more likely to say that immigrants are invading the country than are those who say it has changed for the better (45% vs. 16%). Among people who say American culture has worsened, Republicans (61%) are three times as likely as Democrats (20%) to agree that immigrants are invading the country.
There is also a stark division that emerges with respect to favored politicians. Among those who view President Joe Biden favorably, only 14% agree that immigrants are replacing our country’s culture and ethnic background. By contrast, majorities of those who have favorable views of former President Donald Trump (56%) and Florida Gov. Ron DeSantis (54%) agree with replacement theory.
Six in ten Americans who are QAnon believers (60%) agree with replacement theory, compared with about one-third of QAnon doubters (32%) and one in ten QAnon rejecters (11%).[10] Notably, nearly eight in ten Republicans who are QAnon believers (79%) also believe in replacement theory.[11]
A majority of those who believe that American life needs to be protected from foreign influence (56%) also believe that immigrants are invading our country and replacing our cultural and ethnic background. Unsurprisingly, there are substantial partisan differences: among those who believe that American life needs to be protected against foreign influence, roughly one-third of Democrats (34%) support replacement theory, compared with more than two-thirds of Republicans (69%).
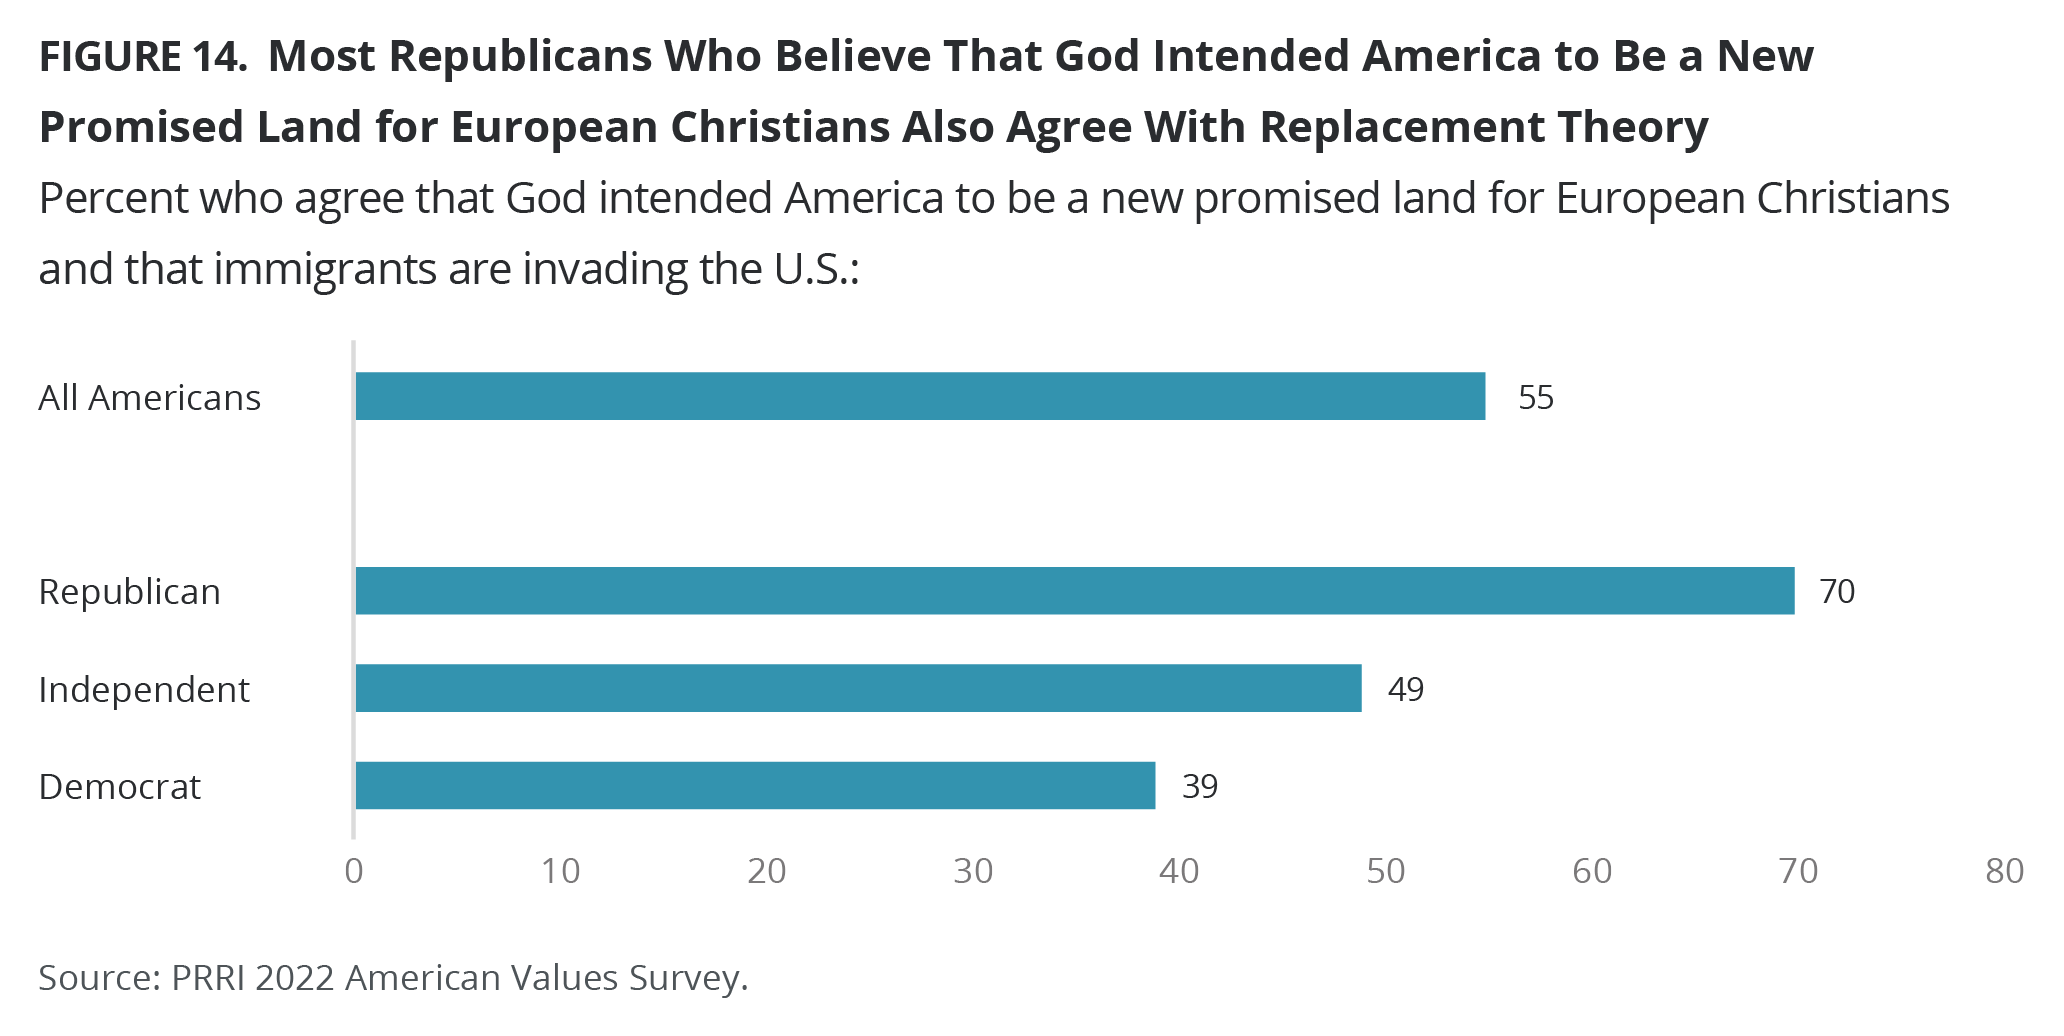
The majority of Americans who agree that God intended America to be a new promised land for European Christians also agree with replacement theory, with 55% holding these views. Distinct partisan differences appear once again: 70% of Republicans who believe that God intended America to be a new promised land also view immigrants as an invading force, compared with 39% of Democrats.
Critical Issues and Agreement with Replacement Theory
Of those who consider immigration to be a critical issue in the midterm election, a slim majority think immigrants are invading the country and replacing our cultural and ethnic background (53%). Republicans in this group (66%) are more than three times as likely as Democrats (20%) to agree.
Among Americans who think that crime is a critical issue in the midterm election, a plurality of 44% agree with replacement theory, including a majority of Republicans (63%) and just 17% of Democrats in this group.
Among Americans who consider jobs and unemployment to be a critical election issue, 38% agree with replacement theory, including 62% of Republicans and 15% of Democrats in this group.
An even larger divide is present among those who saw the health of the country’s democracy as a critical issue in the midterm election. Three in ten in this group (31%) agree with replacement theory, and Republicans are six times as likely as Democrats to do so (60% vs. 10%).
Negative Attitudes Toward Immigrants
When asked about their attitudes toward immigrants coming to the United States today, a majority of Americans say that immigrants make an effort to learn English (57% agree vs. 40% disagree), but they are divided on whether immigrants burden local communities by using more than their share of social services (46% agree vs. 51% disagree). Meanwhile, about one-third agree that immigrants increase crime in local communities (35% agree vs. 61% disagree) and that immigrants take jobs from Americans (34% vs. 62%).
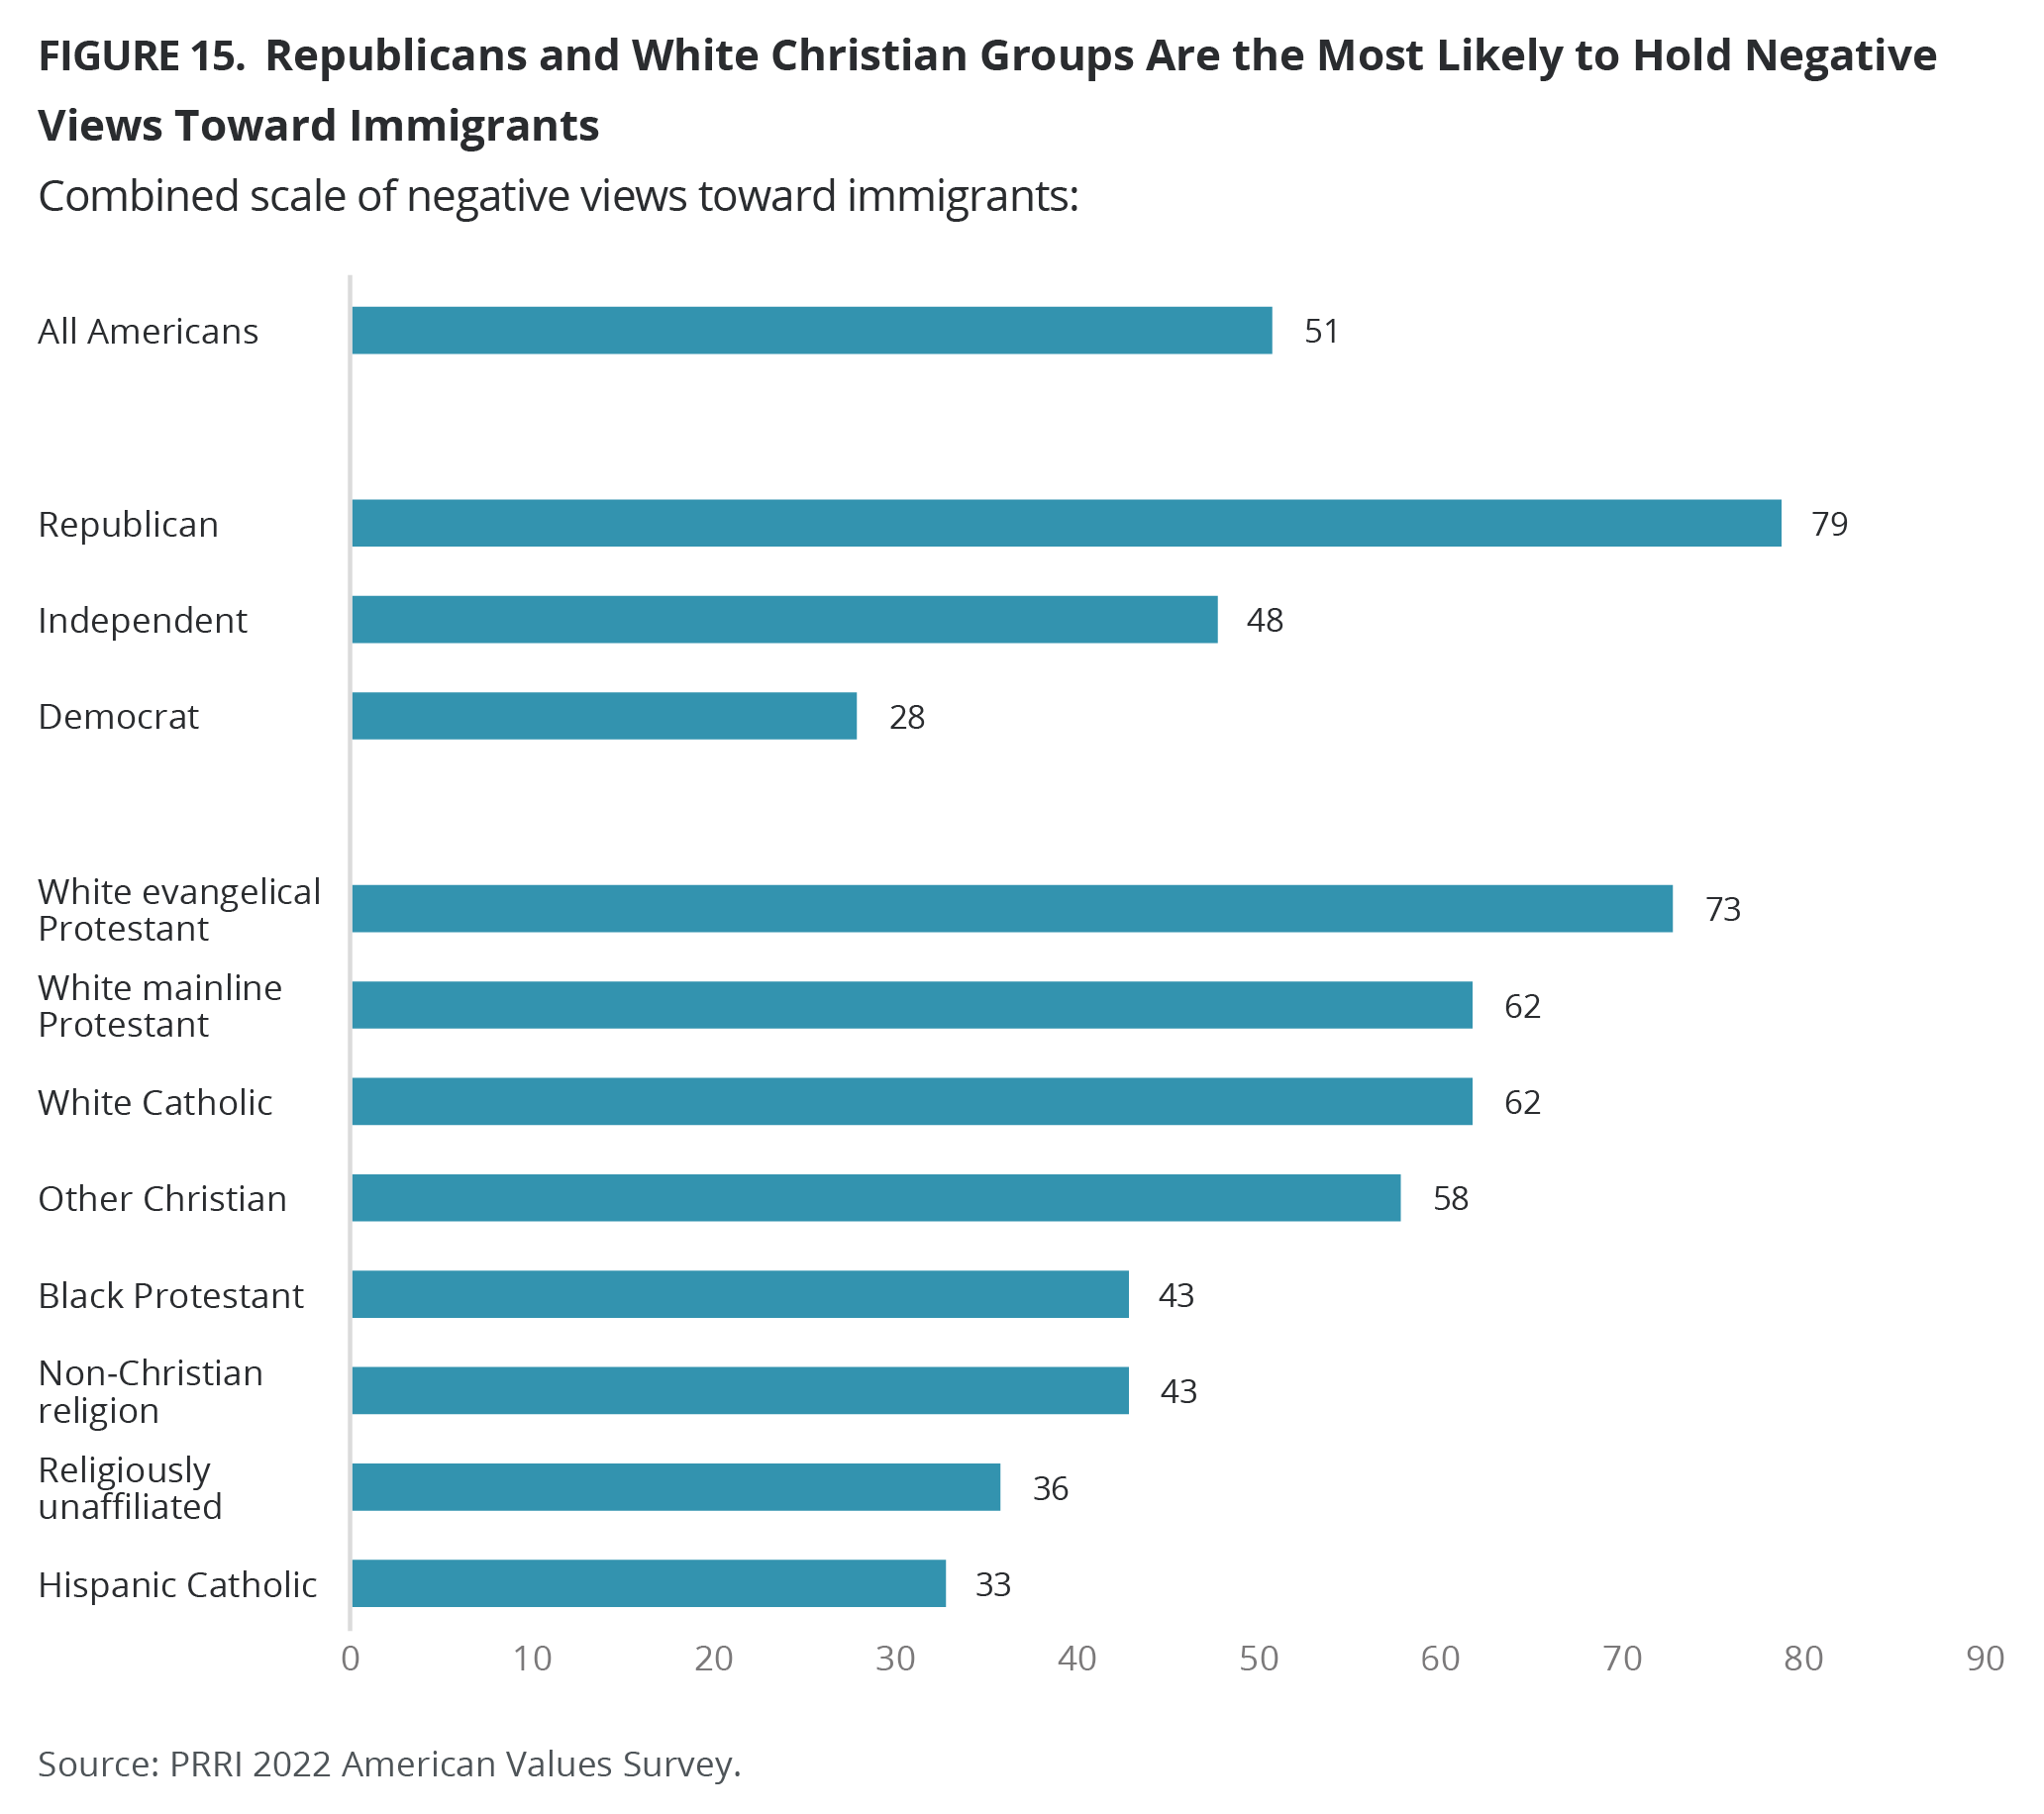
With the exception of respondents’ views of immigrants as making an effort to learn English, the responses to these questions correlate very strongly. Therefore, a four-point composite index was developed to measure where each respondent stands on their overall attitude toward immigrants, from very unfavorable to very favorable.[12] According to this index, Americans are almost evenly divided in their attitudes toward immigrants, with 51% exhibiting unfavorable attitudes and 49% expressing favorable ones. This includes 17% who show very unfavorable attitudes and 15% who show very favorable attitudes.
Most Republicans (79%) hold negative views of immigrants, compared with 48% of independents and 28% of Democrats.
Majorities of several Christian groups hold negative attitudes toward immigrants, including 73% of white evangelical Protestants, 62% of both white mainline Protestants and white Catholics, and 58% of other Christians. Less than half of both Black Protestants (43%) and members of non-Christian religions (43%), along with about one-third of the religiously unaffiliated (36%) and Hispanic Catholics (33%), also hold negative attitudes.
A majority of white Americans (57%) hold negative views of immigrants, compared with 49% of other-race Americans, 41% of Hispanics, and 39% of Black Americans. However, white Americans with a college degree hold views that are notably less negative than those of whites without a college degree (45% vs. 64%). Men are more likely than women to hold negative views of immigrants (55% vs. 47%), and younger Americans are less likely to do so than older Americans. Among those ages 18-29, 43% hold negative views, as do 45% of those ages 30-49, and 58% of both people ages 50-64 and those age 65 and older.
Among Americans who think that immigrants are a threat to traditional values and customs, the vast majority hold negative views of immigrants (84%) and the same is true among those who say that immigrants are invading the country and replacing its ethnic and cultural background (86%).
Negative attitudes toward immigrants also correlate with media consumption. The overwhelming majority of those who most trust conservative media (90%) and Fox News (84%) among television news sources hold negative views toward immigrants, compared with a slim majority of those who most trust a non-television source (52%) and about four in ten of those who trust a mainstream television source (39%).
Appendix: Survey Methodology
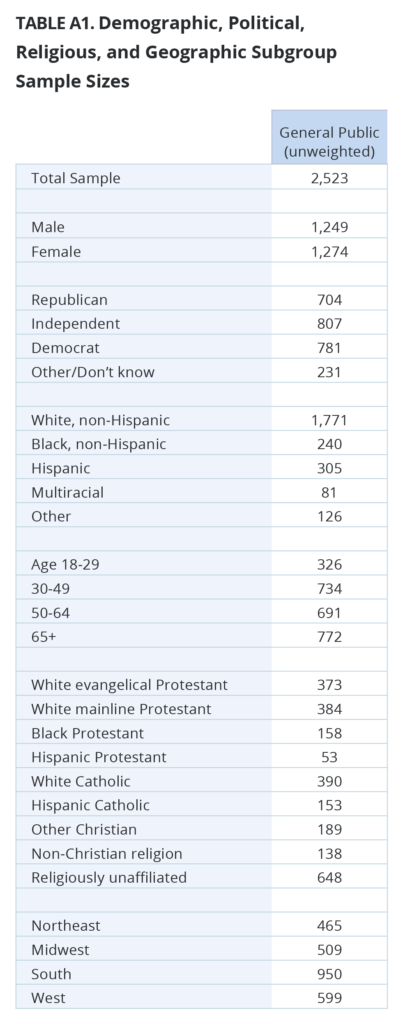 The survey was designed and conducted by PRRI. The survey was made possible through the generous support of the Carnegie Corporation of New York, with additional support from the Ford Foundation and the Unitarian Universalist Veatch Program at Shelter Rock. The survey was conducted among a representative sample of 2,523 adults (age 18 and up) living in all 50 states in the United States, who are part of Ipsos’s Knowledge Panel. Interviews were conducted online between September 1-11, 2022.
Respondents are recruited to the KnowledgePanel using an addressed-based sampling methodology from the Delivery Sequence File of the USPS – a database with full coverage of all delivery addresses in the U.S. As such, it covers all households regardless of their phone status, providing a representative online sample. Unlike opt-in panels, households are not permitted to “self-select” into the panel; and are generally limited to how many surveys they can take within a given time period.
The initial sample drawn from the KnowledgePanel was adjusted using pre-stratification weights so that it approximates the adult U.S. population defined by the latest March supplement of the Current Population Survey. Next, a probability proportional to size (PPS) sampling scheme was used to select a representative sample.
To reduce the effects of any non-response bias, a post-stratification adjustment was applied based on demographic distributions from the most recent American Community Survey (ACS). The post-stratification weight rebalanced the sample based on the following benchmarks: age, race and ethnicity, gender, Census division, metro area, education, and income. The sample weighting was accomplished using an iterative proportional fitting (IFP) process that simultaneously balances the distributions of all variables. Weights were trimmed to prevent individual interviews from having too much influence on the final results. In addition to an overall national weight, separate weights were computed for each state to ensure that the demographic characteristics of the sample closely approximate the demographic characteristics of the target populations. The state-level post-stratification weights rebalanced the sample based on the following benchmarks: age, race and ethnicity, gender, education, and income.
The margin of error for the national survey is +/- 2.3 percentage points at the 95% level of confidence, including the design effect for the survey of 1.35. In addition to sampling error, surveys may also be subject to error or bias due to question wording, context, and order effects. Additional details about the KnowledgePanel can be found on the Ipsos website: https://www.ipsos.com/en-us/solution/knowledgepanel.
Endnotes
[1] The public charge rule was a policy that denied a green card, visa, or admission into the United States to any person likely to become dependent on government benefits. https://www.uscis.gov/public-charge
[2] https://www.nytimes.com/2022/12/29/us/title-42-border-el-paso.html?searchResultPosition=1
[3] https://www.washingtonpost.com/opinions/2022/12/05/finally-bipartisan-deal-help-dreamers-is-within-reach/; After the announcement of the bipartisan proposal, Sinema indicated that she would be leaving the Democratic party. https://www.politico.com/news/2022/12/09/sinema-arizona-senate-independent-00073216
[4] https://edition.cnn.com/2022/11/22/politics/kevin-mccarthy-homeland-security-secretary-alejandro-mayorkas-impeachment/index.html; https://www.politico.com/2022-election/results/senate/
[5] Other Christians includes any Christian not included in the white evangelical, white mainline, Black Protestant, or white and Hispanic Catholic groups. This group is multiracial and includes all Latter-day Saints, Jehovah’s Witnesses, Orthodox Christians, and Hispanic Protestants.
[6] Other race Americans includes Asian Americans and Pacific Islanders, Native Americans, and any single race category that is not large enough in the survey to report independently.
[7] These results may reflect changes in wording implemented in 2022. From March 2018 until 2021 PRRI asked the following question about Dreamers: “How much do you favor or oppose allowing immigrants brought illegally to the U.S. as children to gain legal resident status?” Majorities of Americans have continuously supported this policy over this period, most recently with about two-thirds (64%) in favor. See, https://www.prri.org/research/welcoming-immigration-policies-remain-popular-but-immigration-is-not-a-critical-issue-for-most-americans/
[8] The number of cases for conservative news viewers is too small to report.
[9] The number of cases for conservative news viewers is too small to report.
[10] For an explanation of how PRRI categorizes QAnon believers, doubters, and rejecters, see our recent analysis: https://www.prri.org/spotlight/qanon-beliefs-have-increased-since-2021-as-americans-are-less-likely-to-reject-conspiracies/.
[11] There are not enough Democrats in this category to report.
[12] Each question was combined using an additive scale that was converted into a 4-point scale where a score of 1 indicates very unfavorable attitudes, 2 indicates somewhat unfavorable attitudes, 3 indicates somewhat favorable attitudes, and 4 indicates very favorable attitudes.