

I. Executive Summary
Current Controversies: Sexual Harassment, the National Anthem, Confederate Monuments, and Bias in the Media
Seven in ten (70%) Americans say that recent stories about women being sexually harassed and assaulted in the workplace are part of a broader pattern of how women are often treated, while about one-quarter (24%) say that they are isolated incidents.
• Nearly eight in ten (78%) women, and more than six in ten (63%) men, say that recent reports of sexual harassment and assault are not isolated incidents.
• More than seven in ten Democrats (77%) and independents (73%) say these stories reflect a broader pattern. Roughly six in ten (59%) Republicans agree.
There is a vast partisan divide in views of many current controversies:
• More than eight in ten (86%) Republicans say that athletes should be required to stand during the national anthem, while fewer than one-third (32%) of Democrats agree.
• More than eight in ten (84%) Republicans believe Confederate monuments are symbols of Southern pride rather than racism, a view shared by only 40% of Democrats.
• Roughly eight in ten (79%) Republicans believe most reporters have a personal or political agenda, compared to only 31% of Democrats.
Evaluations of Trump’s Presidency and Support for Impeachment
A majority (53%) of the public does not believe Trump is looking out for their interests, while close to half (46%) say he is doing this at least somewhat well.
• A majority (54%) of white Americans and four in ten (40%) Hispanics believe Trump is looking out for them at least somewhat well, but only 11% of black Americans agree.
Donald Trump gets low marks from the public on his job performance as president. About four in ten (41%) Americans approve of the job he is doing, while a majority (54%) disapprove.
• Among those who approve of Trump’s job performance, nearly four in ten (37%) say there is almost nothing the president could do to lose their approval.
• Among those who disapprove of Trump’s job performance, approximately six in ten (61%) say there is almost nothing the president could do to win their approval.
Four in ten (40%) Americans say that, based on what they have heard or read, President Trump should be impeached and removed from office. A majority (56%) of the public disagrees. Support for impeachment has been stable since the summer, when an identical number of Americans (40%) expressed the view that Trump should be impeached.
• Women express greater support for impeachment than men. Women are evenly divided over whether Trump should be impeached (48% favor, 48% oppose), while fewer than one in three (31%) men favor this action. Close to two-thirds (65%) of men say Trump should not be impeached.
• More than seven in ten (72%) black Americans and a majority (52%) of Hispanic Americans say the president should be impeached. Fewer than one-third (31%) of white Americans favor impeachment.
Trump and the Republican Party
More than six in ten (63%) Republicans say they would prefer Trump be the Republican Party’s nominee for the 2020 election, compared to approximately one-third (31%) who say they would prefer another Republican candidate.
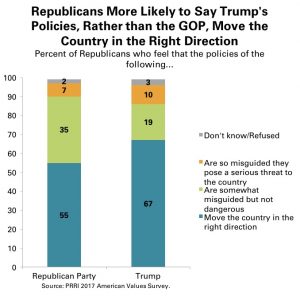
Republicans have more confidence in Trump’s policies than those of the GOP overall. Two-thirds (67%) of Republicans say Trump’s policies are moving the country in the right direction, while only 55% of Republicans say the same about the Republican Party.
Trump is well-regarded among Republicans, but he fares particularly well among those who have a strong attachment to the GOP. More than nine in ten (91%) “strong” Republicans approve of the job Trump is doing as president, including 67% who strongly approve.
Despite his low approval ratings, Trump retains considerable support among those who identify with or lean towards the Republican Party:
• 18% are Never Trump, neither supporting him in the 2016 GOP primary nor for 2020;
• 23% are leaning away from Trump, having supported him in the 2016 GOP primary but not for 2020;
• 19% are leaning toward Trump, not having supported him in the 2016 GOP primary but now supporting him for 2020; and
• 40% are Always Trump, supporting him both in the 2016 GOP primary and for 2020.
A few notable traits stand out among these Republican subgroups:
• The Never Trump group is significantly more likely than other Republican subgroups to identify as Mormon (11%).
• The Always Trump group is made up mostly of those who are most strongly committed to the Republican Party. A majority (55%) of those who are Always Trump identify as strong Republicans, compared to only 38% of those leaning towards Trump, 22% of those leaning away from Trump, and 22% of those in the Never Trump group.
• Republicans leaning away from Trump are disproportionately likely to be nonwhite — only 59% are white. About four in ten are black (6%), Hispanic (21%), or identify as other or mixed race (14%). Conversely, 85% of the Always Trump group are white, non-Hispanic.
Negative Partisanship and the 2018 Midterm Elections
Democratic candidates currently have a notable advantage over Republican candidates running for Congress in 2018 among registered voters. Forty-four percent of voters say if the 2018 elections were being held today they would support the Democratic candidate, while 37% say they would support the Republican candidate in their district. Six percent say they would opt for a third-party candidate, and 14% offer no opinion.
• More than half (51%) of women voters express a preference for the Democratic candidate, while only 31% say they would cast their vote for the Republican candidate in their district.
• Men are more likely to favor the Republican candidate than the Democratic candidate, but by a much narrower margin (43% vs. 36%, respectively).
There is a striking near equivalence in how Republicans and Democrats view the policies of the other party.
Republicans say the following about the policies of the Democratic Party:
• Five percent: Are moving the country in the right direction
• 39%: Misguided but not necessarily dangerous
• 52%: Policies are so misguided they pose a threat to the country
Likewise, Democrats say the following about the policies of the Republican Party:
• Five percent: Are moving the country in the right direction
• 38%: Misguided but not necessarily dangerous
• 54%: Policies are so misguided they pose a threat to the country
Nearly half (46%) of Americans say Trump’s policies are so misguided they constitute a serious threat to the country. Twenty-two percent say they are simply misguided, not dangerous. Only 29% say they move the country in the right direction.
• Two-thirds (67%) of Republicans say Trump’s policies are moving the country in the right direction, compared to 19% who say they are misguided but not dangerous and 10% who say they pose a threat to the country.
• By contrast, only seven percent of Democrats believe Trump’s policies move the country in the right direction. Nearly one in five (18%) Democrats believe Trump’s policies are misguided but not dangerous, while fully three-quarters (75%) believe Trump’s policies constitute a serious threat to the country.
Policies: Taxes, Health Care, the Budget Deficit, and Immigration
Few Americans believe that the president’s tax proposal will help them or their family financially. Only 15% say the proposed policy will help them a lot, while 30% say it will help a little. Nearly half (48%) of the public say Trump’s tax policy will not be of any benefit to them at all.
Nearly six in ten (59%) Americans agree that the government should guarantee health insurance for all of its citizens, even if it means raising taxes, while four in ten (40%) disagree.
• More than three-quarters (78%) of Democrats agree that the government should guarantee health insurance for all citizens, even if it means raising taxes, compared to only about one-third (32%) of Republicans.
• Notably, Republican opposition to government-guaranteed health insurance has declined nine percentage points since 2013, from 75% to 66%.
No issue is considered a more important priority by the public than reducing health care costs. Close to half (46%) of the public, including 41% of Republicans and 51% of Democrats, say this should be the highest priority for President Trump and Congress next year.
• Half (50%) of Americans now say they are somewhat or very worried that they or someone in their family will lose health insurance coverage in the next year. Nearly half (48%) say they are not too worried or not at all worried about this happening.
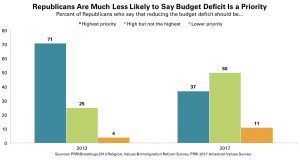
Concern about the budget deficit has fallen precipitously over the past few years, primarily due to its dramatic decline in priority among Republicans. In 2013, more than seven in ten (71%) Republicans said this issue should be the top priority. Only 37% say this today.
On immigration issues, there is bipartisan support for the basic policy provisions of DACA, but deep partisan divides over other immigration-related policies that have been put forward by Trump:
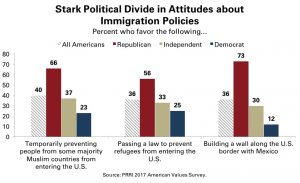
• More than seven in ten (72%) Americans — including 63% of Republicans and 81% of Democrats — favor allowing illegal immigrants brought to the U.S. as children to gain legal resident status if they join the military or go to college. Support for this policy has increased substantially from 57% in 2011.
• Nearly two-thirds (66%) of Republicans favor temporarily preventing people from some majority Muslim countries from entering the country, a view shared by 23% of Democrats. More than seven in ten (72%) Democrats, as well as 55% of Americans overall, oppose this policy.
• A majority (56%) of Republicans favor preventing refugees from entering the country, compared to only 25% of Democrats. More than seven in ten (72%) Democrats, as well as 59% of the public, oppose this policy.
II. Current Controversies: The National Anthem, Confederate Monuments, Sexual Harassment, and Trust in the Media
Protests during the National Anthem
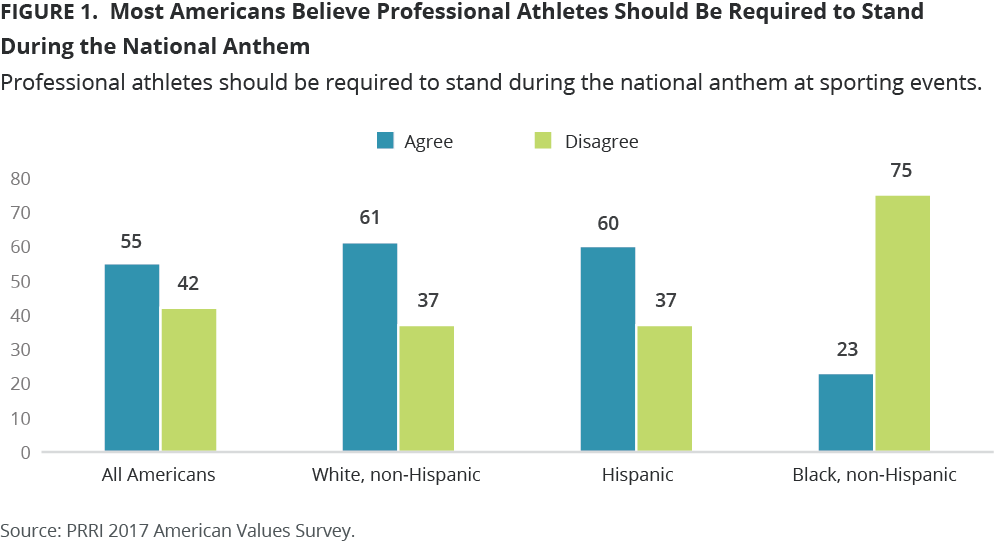
Most (55%) Americans believe that professional athletes should be required to stand during the national anthem at sporting events. About four in ten (42%) Americans say that professional athletes should not be required to stand during the national anthem.
However, views vary dramatically by race, ethnicity, and education. About six in ten white (61%) and Hispanic Americans (60%) say professional athletes should be required to stand during the national anthem, but only about one-quarter (23%) of black Americans say the same.1 Three-quarters (75%) of black Americans do not believe athletes should be required to stand for the national anthem. There are sizable differences among whites by education. Nearly seven in ten (69%) whites without a college degree say that professional athletes should be required to stand for the national anthem, while fewer than half (47%) of whites with a college degree agree. A slim majority (51%) of college-educated whites say that standing during the anthem should not be compulsory for athletes.
Partisan differences of opinion are vast. Close to nine in ten (86%) Republicans say that athletes should have to stand during the national anthem, while fewer than one-third (32%) of Democrats agree. Roughly two-thirds (64%) of Democrats say athletes should not be required to stand while the national anthem is played at sporting events. The views of independents roughly mirror those of the general population.
Older Americans are more likely than younger Americans to say that athletes should be required to stand during the national anthem. While more than two-thirds (68%) of seniors (age 65 or older) say that professional athletes should be required to stand for the national anthem, fewer than half (43%) of young adults (age 18-29) say the same. A majority (55%) of young adults do not believe athletes should be required to stand.
Confederate Monuments
Nearly six in ten (58%) Americans say that monuments to Confederate soldiers are symbols of Southern pride, compared to three in ten (30%) who say that they are symbols of racism.
Views of Confederate monuments, however, vary starkly by race and ethnicity. More than two-thirds (68%) of white Americans and a majority (54%) of Hispanic Americans agree that Confederate monuments are symbols of Southern pride, while fewer than three in ten (29%) black Americans say the same. More than six in ten (63%) black Americans believe that monuments to Confederate soldiers are symbols of racism.
Views of monuments to Confederate soldiers also differ greatly by political affiliation. More than eight in ten (84%) Republicans believe Confederate monuments are symbols of Southern pride, a view shared by only 40% of Democrats. Notably, white Democrats are more divided. Nearly half (49%) of white Democrats say Confederate monuments are more about celebrating the South, compared to 40% who say they are symbols of racism. Independents mirror the opinions of the general population.
Sexual Harassment in the Workplace
Seven in ten (70%) Americans say that recent stories about women being sexually harassed and assaulted in the workplace are part of a broader pattern of how women are often treated, while about one-quarter (24%) say that they are isolated incidents.
More than seven in ten Democrats (77%) and independents (73%) say that recent stories of women being sexually harassed and assaulted in the workplace are part of a broader pattern. Roughly six in ten (59%) Republicans agree, but nearly four in ten (37%) say these stories are isolated incidents.
Across racial and ethnic groups there is agreement that recent stories about sexual harassment in the workplace are evidence of a broader societal problem. Nearly three-quarters of white Americans (73%) and roughly two-thirds of Hispanic (64%) and black (67%) Americans say they are part of a broader pattern.
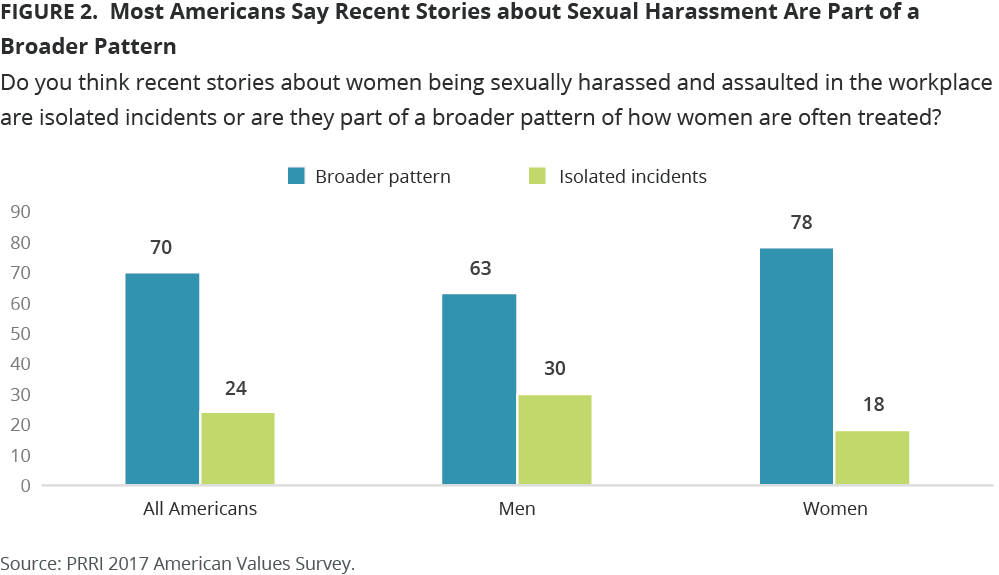
Women are more likely than men to view recent stories of sexual harassment as part of a broader pattern, although majorities of both agree. Nearly eight in ten (78%) women, and more than six in ten (63%) men, say that these events are not isolated incidents. Three in ten (30%) men, and fewer than one in five (18%) women, say that they are just isolated incidents.
Do Reporters Have Political or Personal Agendas?
Americans are generally distrusting of reporters’ motives and agendas. A majority (53%) of Americans think most reporters have a personal or political agenda, although more than four in ten (43%) believe that most reporters try to report the news fairly and accurately.
White Americans are more likely than nonwhite Americans to believe that reporters are motivated by personal and political biases. While nearly six in ten (57%) white Americans say that most reporters have a personal or political agenda, only about four in ten Hispanic (40%) and black (38%) Americans say the same.
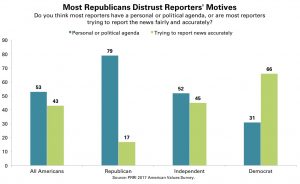
There is a stark partisan gap in perceptions of reporter’s motivations. Nearly two-thirds (66%) of Democrats say that most reporters try to report the news fairly and accurately, while only 17% of Republicans agree. Roughly eight in ten (79%) Republicans believe reporters are influenced by their personal or political agendas.
Americans are divided by gender on this question. Six in ten (60%) men say that most reporters have a personal or political agenda, compared to fewer than half (46%) of women who say the same. Half (50%) of women say that most reporters try to report the news fairly.
There are clear generational divides on trust in the media, with Americans under the age of 50 less confident that reporters aim to be objective. Close to six in ten 18-29 year-olds (57%) and 30-49 year-olds (59%) believe that most reporters have a personal agenda. By contrast, both 50-64 year-olds (47% personal agenda, 49% fair reporting) and seniors (46% personal agenda, 50% fair reporting) are more evenly divided.
III. Priorities for the President and Congress
No issue is viewed as more important than reducing health care costs. Close to half (46%) of the public say this should be the highest priority for America’s political leaders. Four in ten (40%) say reducing health care costs should be a high priority but not the highest, while 12% say it should be a lower priority. Americans are as likely to rate health care as the highest priority today as they were in 2014, when 45% said it should be the country’s highest priority.
Roughly four in ten white (44%) and Hispanic (46%) Americans say lowering health care costs should be a priority for elected leaders, while 53% of black Americans say the same. There is an education gap among whites. Whites without a four-year college degree are more likely than college-educated whites to say this should be the highest priority of members of Congress and the President (47% vs. 38%, respectively).
Notably, while Republicans are significantly less likely than Democrats to say reducing health care costs should be the highest priority (41% vs. 51%, respectively), nearly half (49%) of Republicans nonetheless say it should be a high priority, even if not the highest. Only nine percent of Republicans say it should be a lower priority.
Reducing the budget deficit is the highest priority for about one in three (32%) Americans. Close to half (46%) say it should be a high priority but not the highest, while 19% say it should be a lower priority. Concern about the budget deficit has fallen precipitously over the past few years. In 2013, a majority (56%) of Americans said reducing the deficit should be highest priority of members of Congress and the President.
Partisan differences are muted on this issue. Relatively few Republicans (37%) and Democrats (31%) say the budget deficit should be the country’s top priority today; in 2013, it was the highest priority for more than seven in ten (71%) Republicans and close to half (46%) of Democrats.
Fewer than one-third (31%) of the public say that making the tax system more equitable should be government’s highest priority. About half (48%) say it should be an important priority, but not the most important. The public is slightly less likely to prioritize fairness in the tax system today than a few years ago. In 2013, 37% of Americans said modifying the tax system to make it more fair should be the nation’s highest priority.
Notably, Republicans today are more likely than Democrats to say fairness in the tax system should be the top priority for Congress and the President. Forty percent of Republicans, compared to only about one-quarter (26%) of Democrats, say this should be the highest priority. In 2013, views were reversed, with Democrats significantly more likely than Republicans to prioritize restructuring the tax system (42% vs. 29%, respectively).
Only about one in four (26%) Americans say enacting stricter gun control laws should be the country’s highest priority. Twenty-nine percent say this should be a high priority but not the highest, while 42% say it should be a lower priority. Americans are not any more likely to prioritize gun control today than they were in 2013, when an identical number (26%) said gun control should be the top priority for elected leaders.
Immigration also continues to be a top priority for a minority of Americans. Only 25% of the public say reforming the nation’s immigration system should be the most important priority for the country. About one-third (35%) say it should be a high priority but not the highest, while 36% say it should be a lower priority.
Compared to 2013, the only issue that more Americans believe should be a priority today is climate change. Twenty-six percent of the public say enacting legislation to address climate change should be the country’s highest priority. One-third (33%) say it should be a high priority but not the highest, while 39% say it should be a lower priority. In 2013, only 16% said climate change was the most important issue for the nation’s leaders to address, while 31% said it was a concern but not the top concern. A majority (51%) said it was a lower priority.
Partisan differences in concerns about climate change are stark. Democrats are about four times more likely than Republicans to say climate change legislation should be the top priority for Congress and the President (40% vs. 11%, respectively). Democrats today are much more likely to say enacting climate change legislation is a top priority than four years earlier, when only 21% mentioned it as the country’s most pressing concern.
IV. Reactions to Trump’s Presidency: Who Feels Represented?
Personal Favorability
Public views of Donald Trump remain at historic lows for a first-term president and have changed little over the past year. About four in ten (41%) Americans have a positive opinion of Trump, while a majority (55%) have an unfavorable view of him. In January, 43% of the public expressed a favorable opinion of Trump, while 52% viewed him negatively. Personal feelings about Trump closely track views of his job performance.2
Feelings about the Trump Presidency
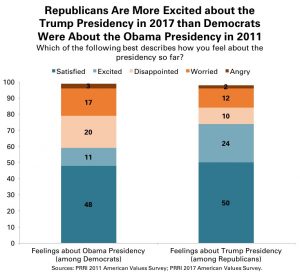
Americans are more likely to express negative than positive feelings about the Trump presidency at this stage. A majority say they feel disappointed (22%), worried (29%), or angry (11%). Only about one-third say they are satisfied (25%) or excited (9%).
Women express less enthusiasm for Trump’s presidency than men. About four in ten (41%) men feel positively about the Trump presidency — either satisfied or excited — compared to 28% of women. Notably, the gender gap among whites without a college degree is even wider. A majority (57%) of white men without a college degree feel satisfied or excited about Trump’s presidency, compared to only 37% of white women without a degree. Fewer than four in ten white men (39%) and white women (27%) with a college education feel positively about Trump’s presidency.
In 2011, the public felt similarly negative about Barack Obama’s presidency. A majority said they felt disappointed (29%), worried (26%), or angry (10%). Only about one in three Americans said they were satisfied (28%) or excited (5%). Notably, Republicans feel more positively about Trump’s presidency so far than Democrats felt about Obama’s presidency at the three-year mark. About three-quarters of Republicans say they feel satisfied (50%) or excited (24%) about Trump’s presidency. About six in ten Democrats said they felt satisfied (48%) or excited (11%) about the Obama presidency.
Strong Republicans express greater satisfaction and excitement about Trump’s presidency than other Republicans.3 More than eight in ten strong Republicans say they are satisfied (54%) or excited (30%). Far fewer weak Republicans report being satisfied (43%) or excited (14%) about the Trump presidency so far.
Who Does Trump Represent: The Wealthy, the Working Class, or the Middle Class?
Americans overwhelmingly believe that Trump is looking out for the interests of wealthy people. Nearly nine in ten say he is representing the interests of wealthy Americans somewhat (30%) or very well (59%). Americans are divided over how well Trump is looking out for the working class — 50% say somewhat or very well, while 48% say not too well or not at all well. Similarly, the public disagrees over whether Trump is looking out for the middle class. Half (50%) say he is representing their interests, while nearly as many (48%) say he is not.
The belief that Trump represents the interests of the wealthy crosses lines of race, ethnicity, and education. More than eight in ten Hispanic (84%), black (85%), and white Americans (91%), including equal numbers of whites with (92%) and without (92%) a college degree, say Trump looks out for the interests of wealthy Americans.
There are large differences across lines of race and ethnicity on the question of how well Trump is representing the interests of working class Americans. A majority (55%) of white Americans and half (50%) of Hispanics say Trump is looking out for working class Americans, while only 24% of black Americans say the same.
Whites without a college degree are significantly more likely than those with a degree to believe Trump is representing the interests of working class Americans (60% vs. 46%, respectively). But a gender gap is evident among whites without a college degree: Men in this group are considerably more likely than women to say Trump is looking out for the working class (69% vs. 52%, respectively).
These opinion patterns are nearly identical to perceptions of how well Trump represents the interests of middle class Americans.
Is Trump Looking Out for You?
A majority (53%) of the public does not believe Trump is looking out for their interests, while close to half (46%) say he is doing this at least somewhat well.
Perceptions vary substantially by race and ethnic background. A majority (54%) of white Americans, and four in ten (40%) Hispanics, believe Trump is looking out for them. Only 11% of black Americans believe Trump is representing them well. Nearly nine in ten (88%) black Americans say he is not looking out for their interests well, including 71% who say he is not looking out for them at all.
An educational divide is evident among whites. White Americans without a four-year college degree are somewhat more likely to believe Trump is looking out for them than whites who completed college (57% vs. 48%, respectively).
The gender divide in views about Trump is significant. A majority of men (53%) say Trump is looking out for them, while fewer than four in ten (39%) women agree. Six in ten (60%) women say that Trump is not representing their interests.
V. Negative Partisanship in the Trump Era
Do Democratic and Republican Policies Threaten the Country?
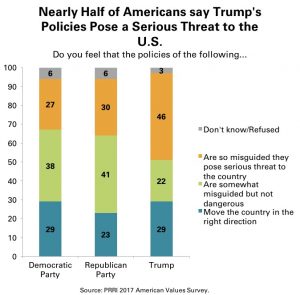
The public has little confidence that the policies of either political party are moving the country in the right direction. About three in ten (29%) Americans say the policies promoted by the Democratic Party are moving the country in the right direction. Approximately four in ten (38%) say Democratic policies are misguided but not dangerous, while 27% say they pose a serious threat to the country. Even fewer Americans (23%) say Republican policies are moving the country in the right direction, while more than four in ten (41%) say they are misguided but not dangerous, and 30% say they pose a serious threat to the country.
Republicans and Democrats have equally negative views of the other party. Only five percent of Republicans say the policies of the Democratic Party are moving the country in the right direction. Roughly four in ten (39%) Republicans say Democrats are pursuing actions that are misguided but not necessarily dangerous. Notably, a majority (52%) of Republicans say Democratic policies are so misguided they present a threat to the country. Similarly, only five percent of Democrats believe the policies of the Republican Party are moving the country in the right direction. About four in ten Democrats (38%) say GOP policies are misguided but not dangerous, and a majority (54%) say the policies of the Republican Party are so misguided they threaten the country’s wellbeing.
Democrats express greater confidence in their party’s policies than Republicans do in GOP policies. Roughly two-thirds (64%) of Democrats say the party’s policies are moving the country forward, while about one in four (24%) say they are misguided; nine percent say they constitute a threat to the country. A majority (55%) of Republicans say their party’s policies are moving the country in the right direction, while 35% say they are misguided and seven percent say they are a threat.
Trump’s Policies: More Polarizing than Those of Either Party
Americans as a whole think Trump’s policies are more dangerous than the policies of either political party. Nearly half (46%) of Americans say Trump’s policies are so misguided they constitute a serious threat to the country. Twenty-two percent say they are simply misguided. Only 29% say they move the country in the right direction.
Republicans have more confidence in Trump’s policies than in those of the GOP, while Democrats express less confidence in Trump’s policies than those of the GOP. Two-thirds (67%) of Republicans say Trump’s policies are moving the country in the right direction, compared to 19% who say they are misguided but not dangerous, and 10% who say they pose a threat to the country. By contrast, only seven percent of Democrats believe Trump’s policies move the country in the right direction. Nearly one in five (18%) Democrats believe Trump’s policies are misguided but not dangerous, while fully three-quarters (75%) believe Trump’s policies constitute a serious threat to the country. Independents closely track the public overall.
Trump’s Tax Proposal
Few Americans believe that the President’s tax proposal would significantly help them or their family. Only 15% say the proposed policy would help them a lot, while 30% say it would help them a little. Nearly half (48%) of the public say Trump’s tax policy would not be of any benefit to them at all.
Close to half of white (48%) and Hispanic Americans (46%) believe the tax proposal would help them at least a little, but only 24% of black Americans agree. There is no significant difference in the views of whites by educational attainment.
Views are fractured along partisan lines. Nearly three-quarters (73%) of Republicans believe they or their family would get at least a little help from Trump’s tax proposal, although fewer than one-third (32%) believe they would be substantially helped. Only 26% of Democrats say that Trump’s tax policy would benefit them personally. Seven in ten (70%) say it would not help them at all. The perceptions of political independents generally align with the public overall.
Women remain more skeptical than men about the potential benefits of Trump’s tax proposal. A slim majority (51%) of men say the policy would benefit them at least a little, while only 39% of women agree. A majority (54%) of women say the policy would not be of any help to them or their family.
The 2020 Republican Nomination
More than six in ten (63%) Republicans say they would prefer Trump to be the Republican Party’s nominee for the 2020 election, compared to approximately one-third (31%) who say they would prefer another Republican candidate. Strong Republicans are solidly behind Trump: More than three-quarters (76%) say they would prefer him to be the 2020 nominee, a view shared by only 42% of weak Republicans. About half (48%) of weak Republicans say they would prefer an alternative to Trump, and 10% do not express an opinion.
Despite the solid support Trump has among Republicans overall, he has not solidified support among the approximately one-quarter of Republicans who favored other candidates in the 2016 GOP primary. Only 34% of Republicans who supported Trump’s opponents in the Republican primary say they would want Trump to be the party’s nominee for the 2020 election. Six in ten (60%) say they would prefer someone else to be the party’s nominee.
Impeachment
Four in ten (40%) Americans say that, based on what they have heard or read, Trump should be impeached and removed from office. A majority (56%) of the public disagrees. Support for impeachment has been stable since the summer, when an identical number of Americans (40%) expressed the view that Trump should be impeached.4 The issue of impeachment divides Americans by race, ethnicity, gender, age, and political affiliation.
Support for impeachment is strong among nonwhite Americans. More than seven in ten (72%) black Americans and a majority (52%) of Hispanic Americans say the president should be impeached and removed from office. Fewer than one-third (31%) of white Americans favor impeachment; roughly two-thirds (66%) oppose it. Educational differences among whites are modest: Relatively few whites with (36%) or without (28%) a college degree support impeachment.
Nearly seven in ten (69%) Democrats say Trump should be impeached and removed from office, while more than one-quarter (27%) disagree. Republicans are nearly unanimous in their opposition to impeachment — 91% say Trump should not be impeached. Independents resemble the public overall.
There is an enduring gender divide on this issue.5 Women are split over impeachment, with equal numbers supporting (48%) and opposing (48%) it. Fewer than one in three (31%) men favor this action, while close to two-thirds (65%) of men say Trump should not be impeached.
Young adults (age 18-29) are more likely than seniors (age 65 or over) to express support for impeaching Trump (45% vs. 35%, respectively). Half (50%) of young adults, however, do not support this action.
The 2018 Election
At this early stage, Democratic candidates have a significant advantage over Republican candidates running for Congress in 2018 among registered voters. Forty-four percent of voters say that, if the 2018 election were being held today, they would support the Democratic candidate, while 37% say they would support the Republican candidate. Six percent say they would opt to support a third-party candidate, and 14% offer no opinion.
There is a sizable gender gap in candidate preference. More than half (51%) of female voters express a preference for the Democratic candidate, while only 31% say they would vote Republican. Men are more likely to favor the Republican than Democratic candidate, but by a much narrower margin (43% vs. 36%, respectively).
VI. Immigration Policy in 2017
Support for DACA
Americans are generally supportive of the policies behind the Deferred Action for Childhood Arrivals (DACA) program. More than seven in ten (72%) Americans favor granting legal resident status to immigrants who were brought to the U.S. illegally as children, provided they join the military or go to college. One-quarter (25%) of Americans oppose such a policy. Public support for this policy has grown over the past few years. In 2011, only 57% of the public supported it.
Support for the policies behind DACA is relatively consistent across racial and ethnic lines. Close to eight in ten (79%) Hispanic Americans, along with about seven in ten white (73%) and black Americans (69%), favor giving these immigrants an opportunity to gain legal resident status.
The policy also garners support across the partisan divide. More than six in ten (63%) Republicans favor it, as do more than eight in ten (81%) Democrats. The views of independents mirror those of the general population.
Temporary Ban on People from Majority Muslim Countries
A majority (55%) of Americans oppose a policy that would temporarily prevent people from some majority Muslim countries from entering the U.S. Four in ten (40%) Americans support this type of travel restriction.
Attitudes diverge significantly by race and ethnicity. Three-quarters (75%) of black Americans and a majority (55%) of Hispanic Americans oppose a policy that would prevent travel to the U.S. from some predominantly Muslim countries. White Americans are more divided (44% favor, 51% oppose).
Nearly two-thirds (66%) of Republicans favor temporarily preventing people from some majority Muslim countries from entering the country, a view shared by 37% of independents and 23% of Democrats. Nearly six in ten (58%) independents and more than seven in ten (72%) Democrats oppose this policy.
White evangelical Protestants are unique among religious groups in their support overall for a temporary travel ban. More than six in ten (61%) white evangelical Protestants favor a policy that would prevent people from some majority Muslim countries from entering the country. White Catholics are evenly split (48% favor, 48% oppose). Fewer white mainline Protestants (42%), Hispanic Catholics (37%), religiously unaffiliated Americans (31%), and black Protestants (24%) express support for the ban.
Women express less support for a temporary travel ban than men. Only about one-third (35%) of women favor temporarily preventing people from some majority Muslim countries from entering the U.S., while close to half (46%) of men support the idea.
A Ban on Refugees
Nearly six in ten (59%) Americans oppose the passage of a law that prevents refugees from entering the U.S., while more than one-third (36%) favor this type of restriction.
Opposition to a refugee ban spans racial and ethnic categories. A majority of white (57%), Hispanic (57%), and black Americans (71%) oppose passing a law to prevent refugees from entering the U.S. There are notable divisions among whites by education level, however: Nearly two-thirds (65%) of white, college-educated Americans oppose a refugee ban, compared to about half (52%) of those without a college degree.
Republicans stand out in their support for a law that would deny refugees entry to the U.S. More than half (56%) of Republicans favor preventing refugees from entering the country, compared to 39% who oppose this policy. Only 33% of independents and 25% of Democrats support this policy. More than six in ten (63%) independents and about seven in ten (72%) Democrats reject it.
Young Americans (age 18-29) are notably less likely than older Americans (age 65 or over) to support banning refugees from entering the U.S. About one-quarter (27%) of young Americans favor passing a law to prevent refugees from entering the U.S., compared to four in ten (40%) seniors.
The Wall
Public sentiment is similar when it comes to building a wall along the U.S.-Mexico border. More than six in ten (63%) Americans oppose the construction of a wall along the border, while about one-third (36%) support it.
In the year since Donald Trump’s election, opposition to building a border wall has increased five percentage points, up from 58%.6 At that time, about four in ten (41%) were in favor of building the wall. Notably, among Americans who oppose the wall, the number of those who strongly oppose it has also risen, from 34% last year to 42% today.
Opposition to the border wall is much more pronounced among nonwhite Americans. More than seven in ten Hispanic (73%) and black Americans (83%) oppose building a wall along the U.S.-Mexico border, only about half (55%) of white Americans oppose it. However, education shapes views about the border wall among whites. About two-thirds (64%) of whites with a college degree oppose building a border wall, a view shared by about half (51%) of those without a degree. Nearly half (47%) of whites without a college degree favor building a wall between the U.S. and Mexico.
There is a massive partisan divide on this issue. Nearly three-quarters (73%) of Republicans, compared to only 12% of Democrats, favor the construction of a wall along the U.S.-Mexico border. Nearly nine in ten (87%) Democrats oppose it, including roughly two-thirds (66%) who strongly oppose it. Although Republican support for the wall has remained relatively stable since 2016, Democrats have become more unified in their opposition.
VII. America and the World: Foreign Policy and Trade
The Nuclear Agreement with Iran
A majority (52%) of Americans oppose withdrawing from the nuclear agreement with Iran, with only about one-third (36%) in favor. Notably, 13% of Americans say they do not know or offer no opinion on the subject.
There are modest differences of opinion by race and ethnicity. Black Americans express the greatest reservations about withdrawing from the nuclear agreement with Iran. More than seven in ten (71%) black Americans oppose ending the nuclear agreement, compared to fewer than half of white (49%) and Hispanic Americans (49%). Fewer than four in ten white (39%) and Hispanic Americans (36%) favor withdrawing from the agreement. More than one in ten white (11%) and Hispanic Americans (15%) offer no opinion.
There are strong partisan divides on this issue. More than six in ten (61%) Republicans favor withdrawing from the agreement, and fewer than three in ten (28%) oppose such a policy. By contrast, more than seven in ten (71%) Democrats are opposed to such a policy, and fewer than one in five (19%) are in favor. Independents closely resemble the public as a whole.
Does America Set a Good Moral Example for the World?
Americans as a whole do not think that America sets a good moral example for the world, but views differ by party identification, gender, and race and ethnicity. Nearly six in ten (57%) Americans disagree with the statement “America today sets a good moral example for the world,” compared to 41% who agree. Views have not changed substantially since 2015, when 43% of the public said that the U.S. was setting a good moral example for the world.7
Black Americans are unique in the extent to which they disagree that America sets a good example. Seven in ten (70%) black Americans disagree with this statement, while fewer than three in ten (29%) agree. Attitudes of white and Hispanic Americans mirror the public as a whole.
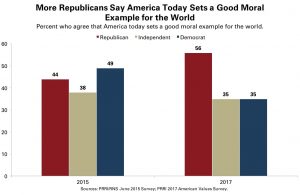
Even as views overall have not shifted much over the last two years, the opinions of partisans have undergone significant realignment. Today, a majority (56%) of Republicans say the U.S. sets a good example for the world, while only 35% of Democrats agree. Nearly two-thirds (64%) of Democrats today say the U.S. is not a good example. In 2015, 44% of Republicans said the U.S. served as a moral example. Interestingly, Democrats were divided: 49% agreed, and 47% disagreed.
Men are far more likely than women to say that America sets a good moral example for the world. Half (50%) of men agree with the statement, while 48% disagree. Only one-third (33%) of women agree America is setting a good moral example; about two-thirds (65%) disagree.
Free Trade or More Foreign Trade Restrictions?
More than six in ten (63%) Americans are in favor of promoting free trade, while about three in ten (29%) say the U.S. should place more restrictions on foreign trade.
There is little appetite for trade restrictions among most demographic groups. No more than one-third of white (33%), black (23%), and Hispanic Americans (21%) express support for policies that would rein in free trade. Even among whites without a college degree, only 38% want to restrict free trade. Most whites with and without a college degree say the U.S. should do more to expand free trade (68% and 54%, respectively).
Democrats and independents strongly support free trade, while Republicans are more divided on the issue. More than seven in ten (72%) Democrats and about two-thirds (66%) of independents favor promoting free trade over implementing more trade restrictions. Nearly half (49%) of Republicans favor promoting free trade, while 45% would put more restrictions in place. Notably, Republican women are more likely than Republican men to favor protectionist policies (52% vs. 43%, respectively).
America First?
Six in ten (60%) Americans agree with the statement, “In the past, America’s leaders have been too focused on helping other nations at the expense of our own country.” Fewer than four in ten (37%) disagree.
The desire for leaders to focus more on domestic concerns cuts across racial and ethnic groups. Roughly equal numbers of white (62%), black (60%), and Hispanic Americans (57%) agree that American leaders have been too focused on helping other nations in the past. Among whites, however, there is a considerable educational divide. Seven in ten (70%) whites without a college degree say that America’s leaders have been too focused on helping other nations at the expense of our own country, and fewer than three in ten (29%) disagree. Whites with a college degree, however, are about evenly split: Nearly half (48%) agree with this statement, while a slim majority (51%) do not believe that America’s recent leaders have been too focused on issues abroad.
No group shows stronger agreement that American leaders have devoted too much attention to foreign affairs than Republicans. More than three-quarters (78%) of Republicans agree that past American leaders have been too focused on problems abroad rather than issues at home, while roughly one in five (21%) disagree. Much smaller majorities of both independents (56%) and Democrats (53%) agree with the statement; fewer than half (42% and 46%, respectively) disagree.
VIII. Healthcare Policy and Concerns
Americans Increasingly Worried about Losing Health Insurance Coverage
Half (50%) of Americans now say they are somewhat or very worried that they or someone in their family will lose health insurance coverage in the next year. Nearly half (48%) say they are not too worried or not at all worried about this happening. Earlier this year, 45% of Americans expressed concern that they or a family member would become uninsured.8
Concerns about health care are sharply polarized. Only 29% of Republicans report being worried about losing health care coverage, compared to roughly two-thirds (66%) of Democrats. Democrats are also increasingly likely to express concerns. In August 2017, 55% of Democrats said they were worried about losing health care coverage — an 11-point shift. Attitudes of independents largely reflect the public as a whole.
Women are also more likely to report concern over losing healthcare coverage in the next year. A majority (56%) of women say they are somewhat or very worried about the possibility, while fewer than half (44%) say they are not too worried or not at all worried.
Americans with different types of health care coverage also express differing levels of concern. About seven in ten Americans who are covered by Medicare (68%) or Medicaid (68%) say they are worried about possibly losing coverage in the next 12 months, and about half (Medicare 46%, Medicaid 50%) say they are very worried. More than six in ten (63%) Americans who have personally purchased health care insurance from an insurance company or a state or federal marketplace also report being worried. By contrast, only 41% of Americans with employer-sponsored health care say they are worried about losing coverage.
Americans Skeptical that Rolling Back Obamacare Will Help
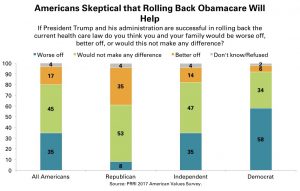
Fewer than one in five (17%) Americans think that if President Trump and his administration are successful in rolling back the current healthcare law, it will make them and their family better off, compared to 35% who say it will make their family worse off. Close to half (45%) say it will make no difference for themselves and their families.
Black Americans are far more likely than other Americans to say they would be worse off without the current health care law. A majority (56%) of black Americans think they and their family would be worse off if the current health care law were rolled back. By contrast, only about one-third of white (31%) and Hispanic Americans (35%) believe this action would affect them negatively. About half of white (47%) and Hispanic Americans (46%) say they and their families would not be affected.
Views on the impact of rolling back the current healthcare law vary significantly by party identification, but neither Democrats nor Republicans, on the whole, say they would be better off without it. Nearly six in ten (58%) Democrats say a rollback would make their family worse off, about one-third (34%) say it would not make any difference, and only six percent say it would make their family better off. And while about one-third (35%) of Republicans believe that rolling back the current health care law would have a positive impact on their family, a majority (53%) think it would not make any difference. Fewer than one in ten (8%) Republicans say their family would be worse off if the current health care law was rolled back.
Women are significantly more likely than men to think a rollback would make them and their family worse off. More than four in ten (41%) women, compared to 28% of men, say they or their family would be worse off if the current health care law were rescinded. Roughly half (48%) of men and 42% of women say this action would not make any difference to them and their family.
Widespread Support for Government-Funded Health Coverage
There is enduring consensus among Americans that government should guarantee health insurance for all citizens, even if it means raising taxes. Nearly six in ten (59%) Americans agree that the government should guarantee health insurance for all of its citizens, even if it means raising taxes, while four in ten (40%) disagree. In 2013, a slightly smaller majority (56%) of the public said government should provide all citizens with health care coverage.9
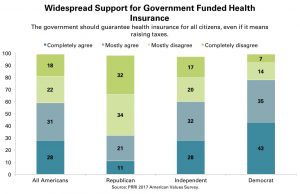
But Americans are sharply divided on this issue by political affiliation. More than three-quarters (78%) of Democrats agree that the government should guarantee health insurance for all citizens, even if it means raising taxes, compared to only about one-third (32%) of Republicans. About two-thirds (66%) of Republicans disagree. Notably, however, Republican opposition has declined over the last couple years. In 2013, three-quarters (75%) of Republicans opposed government-provided universal health care coverage for all citizens.10
IX. A Typology of Trump Approval
Overall Job Approval
A year out from the 2016 presidential election, Donald Trump is getting low marks from the public on his job performance. About four in ten (41%) Americans approve of the job he is doing, while a majority (54%) disapprove. Americans are also about twice as likely to strongly disapprove than to strongly approve (42% vs. 22%, respectively).
Views of Trump’s job performance are highly stratified by race. Half (50%) of white Americans, but only 27% of Hispanic and nine percent of black Americans, approve of the way Trump is doing his job as president. Nearly nine in ten (87%) black Americans and roughly six in ten (63%) Hispanics disapprove of Trump’s job performance. Fewer than half (47%) of white Americans disapprove of Trump’s job performance, but there are notable divisions by education level. A majority (55%) of whites without a four-year college degree approve of the way Trump is handling the presidency, compared to only 40% of college-educated whites.
The views of partisans are near mirror images of each other. Eighty-four percent of Republicans approve of Trump’s job performance, and 85% of Democrats disapprove. However, Democrats are more likely to strongly disapprove (72%) of Trump’s performance than Republicans are to strongly approve (51%) of it.
Trump is well-regarded among self-identified Republicans, but he fares particularly well among those who have a strong attachment to the GOP. More than nine in ten (91%) strong Republicans approve of the job Trump is doing as president, including 67% who strongly approve. About three-quarters (73%) of weak Republicans approve of Trump, but only 27% express strong approval.
White evangelical Protestants continue to be among Trump’s strongest supporters. More than seven in ten (72%) white evangelicals approve of Trump’s job performance. White mainline Protestants (49% approve, 49% disapprove) and white Catholics (49% approve, 47% disapprove) are about equally divided. By contrast, fewer than one in three religious but non-Christian Americans (31%), religiously unaffiliated Americans (30%), Hispanic Catholics (21%), and black Protestants (9%) approve of Trump.
Men and women are of starkly different opinions about Trump’s job performance as president. Nearly half (48%) of men give Trump positive marks, while only 33% of women agree. About six in ten (61%) women disapprove of how Trump is handling the job, including 49% who strongly disapprove.
The gender gap is substantial even among groups that are largely sympathetic to Trump. Nearly two-thirds (66%) of white men without a college degree approve of the job Trump is doing as president, compared to fewer than half (45%) of white non-college-educated women. White college-educated men are similarly more likely to approve of Trump than white college-educated women (48% vs. 33%, respectively).
Trump Supporters and Opponents
In order to shed more light on the traditional job approval measures, the survey asked respondents whether there was anything President Trump could do to gain or lose their support. Among those who approve of Trump’s job performance, nearly four in ten (37%) say there is almost nothing the president could do to lose their approval, compared to about six in ten (58%) who say Trump could do something to lose their approval. Among those who disapprove of Trump’s job performance, approximately six in ten (61%) say there is almost nothing the president could do to gain their approval, while about four in ten (37%) say it is possible Trump could do something to win their approval.
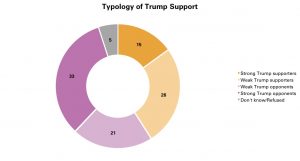
Combining these measures yields the following four groups:
• Strong Trump supporters (15%): those who approve of Trump’s job performance and say there is almost nothing he could do to lose their support
• Weak Trump supporters (26%): those who approve of Trump’s job performance but say it is possible for Trump to lose their support
• Weak Trump opponents (21%): those who disapprove of Trump’s job performance but say it is possible for Trump to win their support
• Strong Trump opponents (33%): those who disapprove of Trump’s job performance and say there is almost nothing he could do to win their support
Who Are Trump’s Most Committed Supporters?
Despite the fact that strong Trump opponents outnumber strong Trump supporters by a margin of roughly two to one, Trump has strong support among Republicans overall and key groups in his base, such as white evangelical Protestants, whites without a college degree, and white men.
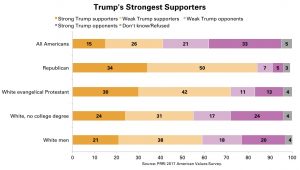
Approximately one-third (34%) of Republicans are strong Trump supporters who approve of his job performance and say there is virtually nothing he could do to lose their support. Half (50%) of Republicans are weak Trump supporters, while only seven percent are weak Trump opponents and five percent are strong Trump opponents.
Three in ten (30%) white evangelical Protestants are strong Trump supporters, while about four in ten (42%) are weak Trump supporters. Fewer than one in four white evangelical Protestants are weak Trump opponents (11%) or strong Trump opponents (13%).
Notably, only about one in four (24%) white Americans without a college education are strong Trump supporters, while 31% are weak Trump supporters. By contrast, 17% of non-college-educated whites are weak Trump opponents, while roughly one in four (24%) are strong Trump opponents.
White men are also strong supporters of Trump. Nearly six in ten white men are either strong (21%) or weak (38%) Trump supporters, compared to 18% who are weak Trump opponents and 20% who are strong Trump opponents.
Who Are Trump’s Most Ardent Opponents?
In contrast, President Trump faces considerable opposition from Democrats and key groups in the Democratic base, such as black Americans, Hispanic Americans, religiously unaffiliated Americans, and women.
Nearly six in ten (57%) Democrats are strong Trump opponents, who not only disapprove of the president, but also say there is almost nothing he could do to gain their support. Another 29% are weak Trump opponents, compared to only nine percent who are weak Trump supporters and two percent who are strong Trump supporters.
Trump also faces formidable opposition among black Americans. Fully six in ten (60%) black Americans are strong Trump opponents, and an additional 26% are weak Trump opponents. Less than one in ten black Americans are weak Trump supporters (9%), and less than one percent are strong Trump supporters.
President Trump also faces considerable opposition from Hispanic Americans, although their opposition is less intense than that of black Americans. More than one-third (36%) of Hispanics are strong Trump opponents and an additional 27% are weak Trump opponents. By contrast, roughly one-quarter of Hispanics are either weak (17%) or strong (10%) Trump supporters.
Nearly two-thirds of religiously unaffiliated Americans are either strong (42%) or weak (23%) Trump opponents. Twenty percent are weak Trump supporters, and less than one in ten (9%) are strong Trump supporters.
Women are also among Trump’s most ardent political opponents. About six in ten women are either strong (41%) or weak (20%) Trump opponents. By contrast, fewer than half of men are classified as strong (24%) or weak (22%) Trump opponents.
X. Is the GOP Now the Party of Trump?
In order to examine Trump’s current standing among Republicans in greater detail, we created a typology of Trump support using two questions: whether Trump was respondents’ preferred candidate during the 2016 GOP primary contest, and whether respondents prefer Trump to be the GOP nominee in the 2020 presidential election.11
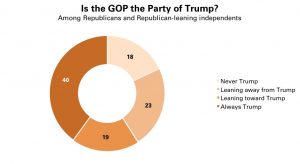
Despite his low approval ratings, Trump retains considerable support among those who identify with or lean toward the Republican Party:
• 18% are Never Trump, neither supporting him in the past nor for 2020;
• 23% are leaning away from Trump, having supported him in the past but not for 2020;
• 19% are leaning toward Trump, not having supported him in the past but now supporting him for 2020; and
• 40% are Always Trump, supporting him over other Republican candidates both in the past and for 2020.
A Brief Profile of Republican Subgroups
Americans who identify with or lean toward the Republican Party are overwhelmingly white (76%) as a group.12 Notably, Republicans leaning away from Trump are disproportionately likely to be nonwhite — only 59% are white. About four in ten are black (6%), Hispanic (21%), or identify as other or mixed race (14%). Conversely, 85% of Always Trump Republicans are white, non-Hispanic.
Educational backgrounds also vary significantly among these groups. Half (50%) of Republicans who are leaning away from Trump have a high school education or less, a significantly higher proportion than of Never Trump Republicans (29%), those who are leaning toward Trump (29%), and those in the Always Trump group (39%).
Notably, Never Trump Republicans are significantly more likely than other Republican subgroups to identify as Mormon. More than one in ten (11%) Republicans in the Never Trump category are Mormon.
This analysis also reveals that the Always Trump group is made up primarily of those who are most strongly committed to the Republican Party. A majority (55%) of those who are Always Trump identify as strong Republicans, compared to only 38% of those leaning toward Trump, 22% of those leaning away from Trump, and 22% of those who are Never Trump.
Views of the President and Negative Partisanship
Notably, even among those in the Never Trump group, more than four in ten (43%) still approve of the president’s job performance, compared to 55% who disapprove. A majority (54%) of Republicans leaning away from Trump, and nearly all of those who are leaning toward Trump (97%) or in the Always Trump group (99%), approve of Trump’s job performance.
When asked how well President Trump is looking out for people like them, there are stark differences among these Republican subgroups. More than six in ten (63%) Republicans in the Always Trump group and about half (49%) of those leaning toward Trump say he is looking out for the interests of “people like you” very well, compared to only 14% of those leaning away from Trump and 11% of those in the Never Trump group.
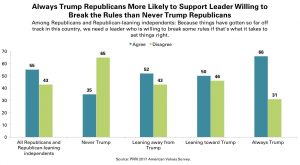
Similarly, the Never Trump and Always Trump camps have mirror opposite opinions about the need for a leader willing to break the rules. Roughly two-thirds (66%) of Republicans in the Always Trump group agree that “because things have gotten so far off track in this country, we need a leader who is willing to break some rules if that’s what it takes to set things right,” while only about one-third (35%) of those in the Never Trump group agree. Roughly two-thirds of those in the Never Trump group (65%) disagree.
These differences among Republican subgroups are also reflected in support for impeachment. While fewer than one percent of the Always Trump group and only one percent of those leaning toward Trump support impeaching President Trump, 20% of those leaning away from Trump and 23% of those in the Never Trump group say the president should be impeached and removed from office.
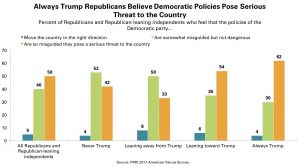
The power of negative partisanship is apparent, especially among the Republican subgroups that say they would support Trump as the GOP nominee for president in 2020. For example, 62% of Always Trump Republicans and 54% of those leaning toward Trump say the policies put forward by the Democratic Party are so misguided they pose a fundamental threat to the country, compared to only 33% of those leaning away from Trump and 42% of the Never Trump group.
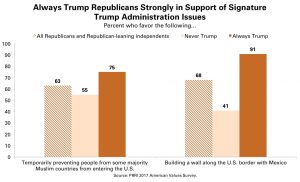
Views of Signature Trump Administration Issues
There are also notable differences among these Republican subgroups on signature Trump administration issues. Ninety-one percent of Republicans in the Always Trump group and 84% of those leaning toward Trump favor building a wall between the U.S. and Mexico, compared to only about four in ten of those who are leaning away from Trump (39%) or in the Never Trump group (41%). Similarly, 75% of Always Trump Republicans and 69% of those leaning toward Trump favor temporarily preventing people from certain majority Muslim countries from entering the U.S., while those leaning away from Trump and those in the Never Trump group are more divided (48% and 55% agree, respectively).
There are wide disparities between the groups in perceptions of how much enacting Trump’s tax proposal would help them. More than four in ten of those in the Always Trump group (45%) and of those leaning toward Trump (41%) say President Trump’s tax plan would financially help their family a lot, compared to only 11% of those leaning away from Trump and eight percent of those in the Never Trump group.
There are also substantial differences of opinion on the issue of trade. Half (50%) of Republicans in the Always Trump group say that the U.S. should put more restrictions on foreign trade, a view shared by substantially fewer (32%) Never Trump Republicans. Nearly two-thirds (64%) of Republicans in the Never Trump group say the U.S. should do more to promote free trade.
Endnotes
1Here and throughout the report “white” and “black” refer to those who do not identify as Hispanic.
2The correlation between Trump’s personal favorability and his job approval is quite high (0.89).
3In this report, “strong Republicans” include all self-identified Republicans who strongly identified with their party label, while “weak Republicans” are those who do not identify strongly with the GOP.
4PRRI August 2017 Survey.
5In August 2017, only about one-third (32%) of men, but nearly half (47%) of women, said the President should be impeached and removed from office.
6PRRI 2016 American Values Survey.
7PRRI/RNS June 2015 Survey.
8PRRI August 2017 Survey.
9PRRI/Brookings 2013 Economic Values Survey.
10Ibid.
11This analysis was conducted among Republicans and Republican-leaning independents. The Never Trump category includes those who supported a candidate other than Trump in the 2016 Republican primary and who currently do not want Trump as the 2020 nominee. The “leaning away from Trump” group includes those who supported Trump in the 2016 primary or expressed no preference in the nominating contest, and currently do not want Trump to be the nominee in 2020. The “leaning toward Trump” group includes those who backed another Republican candidate in 2016 or expressed no preference, and now favor Trump to be the party’s nominee in 2020. The Always Trump category includes those who backed Trump in 2016 and prefer that he be the nominee in 2020.
12For the remainder of this analysis, “Republican” will be used as shorthand for the group that includes Republicans and Republican-leaning independents.
Recommended Citation
Jones, Robert P., Daniel Cox, Molly Fisch-Friedman and Alex Vandermaas-Peeler. “One Nation, Divided, Under Trump. Findings from the American Values Survey” PRRI. 2017.


