

State of the Country
The Direction of the Country
Despite a strong economy, Americans remain relatively pessimistic in their outlook on the direction of the country. Nearly two-thirds (64%) of the public believe things in the country have gotten pretty seriously off on the wrong track, while about one-third (35%) say things are generally moving in the right direction.
Americans are far more likely to believe the country has gone off course in just the last few years than to say this has been happening for a long time. Four in ten (40%) Americans say the country has gotten off on the wrong track recently, while about one-quarter (24%) say the U.S. has been on the wrong track for a long time.
Among partisans, views about the direction of the country have flipped since 2016. Today, seven in ten (70%) Republicans say the country is headed in the right direction, while nearly three in ten say that the country has gotten off on the wrong track in the last few years (10%) or has been on the wrong track for a long time (19%). In contrast, in the fall of 2016, only seven percent of Republicans said the U.S. was headed in the right direction, while more than nine in ten Republicans said the country had been on the wrong track for a long time (42%) or had gotten off on the wrong track in just the last few years (49%).1
Similarly, views among Democrats have shifted recently. Today, only eight percent of Democrats believe the U.S. is headed in the right direction. About nine in ten Democrats say things have gotten off on the wrong track in the last few years (72%) or the U.S. has been on the wrong track for a long time (19%). In 2016, more than four in ten (42%) Democrats said the U.S. was headed in the right direction. Less than six in ten said the country had gotten off on the wrong track in the last few years (21%) or had been off track for a long time (36%).
Demographic Change: America Becoming a Majority Non-White Nation
Most Americans believe that ongoing demographic change, which will result in people of color making up the majority of the U.S population at some point in the next few decades, will have a mostly positive impact on the country. Nearly two-thirds (64%) of the public say that the impact of U.S. Census projections indicating that African-Americans, Latinos, Asians, and other racial and ethnic minority groups are likely to become a majority by 2043 will be mostly positive for the country. Approximately one-third (31%) of the public say these changes will impact the country negatively.
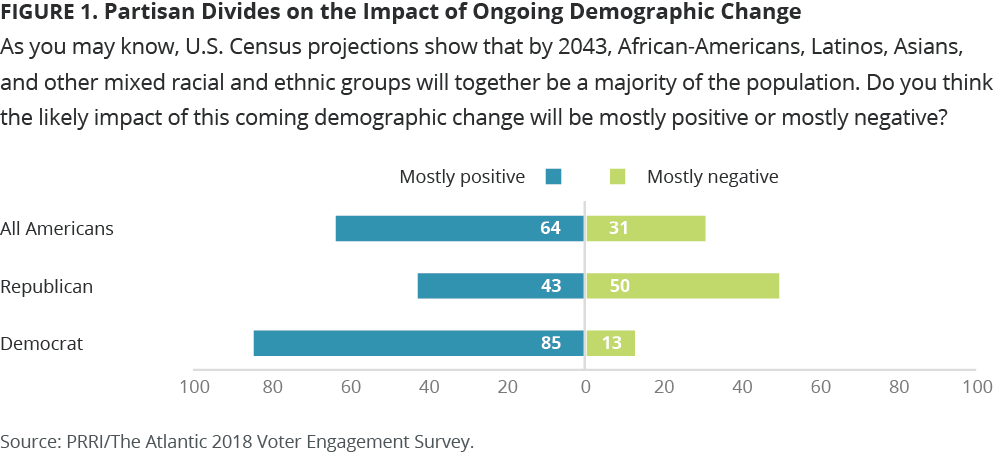
Democrats and political independents are much more welcoming of these demographic changes than Republicans are. More than eight in ten (85%) Democrats and nearly six in ten (59%) independents believe a majority of the country being nonwhite will have a positive effect. Republicans are more ambivalent. Half (50%) of Republicans say these demographic changes will have a largely negative impact on American society, while 43% say these changes will be positive.
Americans of different racial and ethnic backgrounds judge this demographic realignment somewhat differently. Hispanic (78%) and black (78%) Americans are significantly more likely than white Americans (56%) to say these demographic shifts will ultimately be beneficial to the U.S. Among whites, there is a substantial divide by education. Nearly seven in ten (69%) whites with a four-year college degree say these ongoing demographic changes are a mostly positive development. Whites without a four-year college education are far more divided: Half (50%) say these changes will be positive, while nearly as many (44%) say they will have a negative impact.
Among religious groups, white evangelical Protestants are unique in the extent to which they feel demographic change will represent a negative development for the U.S. More than half (52%) of white evangelical Protestants say a majority of the U.S. population being nonwhite will be a negative development, while fewer than four in ten white mainline Protestants (39%), Catholics (32%), and religiously unaffiliated Americans (23%) say the same.
Views of President Trump
The public expresses negative views of President Trump overall. Six in ten (60%) Americans have an unfavorable opinion of the president, including 41% who view him very unfavorably. Only 37% of Americans view Trump favorably.
There are robust partisan divisions in perceptions of Trump. Eight in ten (80%) Republicans have a favorable view of Trump, including 37% who view him very favorably. In contrast, more than nine in ten (92%) Democrats view the president unfavorably, and an astonishing 75% report a very unfavorable view. Political independents closely track the views of the public overall.
Views about Trump also vary starkly by age. Seniors (age 65 or older) are about twice as likely as young adults (age 18-29) to have a favorable view of the president (53% vs. 28%).
There is a sharp divide in views of Trump by religious affiliation. More than three-quarters (77%) of white evangelical Protestants express a favorable opinion of Trump. White mainline Protestants (50% favorable vs. 49% unfavorable) and white Catholics (50% favorable vs. 50% unfavorable) are narrowly divided, while few religiously unaffiliated Americans (28%) and nonwhite Protestants (17%) view Trump positively.
The 2018 Election
At this stage in the 2018 election cycle, half (50%) of Americans report that they are absolutely certain to vote in the upcoming midterm election, while 16% say they will probably vote. Roughly one-third (32%) of the public give themselves no better than a 50-50 chance of voting, including 12% who say they are definitely not voting.
At the same time in 2014, a remarkably similar number of Americans reported they were committed to voting. About half (51%) of the public said they were absolutely certain to vote in the 2014 midterm election.2
Republicans and Democrats are about equally likely to say they are sure to vote this year (59% vs. 56%). In 2014, Republicans held a considerable edge. More than two-thirds (68%) of Republicans, compared to only about half (51%) of Democrats, said they were absolutely certain to vote in 2014.
The generation gap in reported voting intent is massive. Only 28% of young adults say they are absolutely certain they will vote in the 2018 election compared to 74% of seniors.
Notably, white (56%) and black (52%) Americans are about equally likely to say they are absolutely certain to vote this year. Fewer than one-third (31%) of Hispanic Americans report being absolutely certain about casting a ballot in the coming election. There are sizable differences between white Americans by education level. More than two-thirds (68%) of white Americans with a four-year college degree are absolutely certain they will vote, compared to fewer than half (49%) of those without a four-year college education.
However, black Americans are more likely than white Americans to say their close friends are planning on voting in the 2018 congressional election. More than seven in ten black Americans say all of their friends (27%) or most of their friends (45%) will be voting in the coming election. A majority of white Americans report that all (10%) or most (46%) of their friends will be voting. Fewer than half of Hispanic Americans report that all (12%) or most (29%) of their friends will be voting.
Voter Engagement: A Typology of American Voting Habits
In an effort to better understand the differing experiences and perspectives of Americans who participate in elections regularly as well as those who vote less often or not at all, we developed a composite Voter Engagement Scale based on the frequency with which Americans report voting in various types of elections: presidential elections, midterm elections, and local elections. The resulting scale identified four distinct groups of voters: Consistent Voters, Presidential Voters, Irregular Voters, and Non-Voters.3 Consistent Voters almost always show up at the polls regardless of the type of contest, local or national, midterm or presidential. Presidential Voters, as the name suggests, report participating in presidential elections frequently but are less likely to vote in midterm and local elections. Irregular Voters report participating in presidential elections occasionally but are far less likely to vote in other types of elections. Non-Voters report that they rarely—if ever—participate in elections, regardless of the type.
According to the Voter Engagement Scale, roughly one-third (34%) of Americans are Consistent Voters, fewer than one-quarter (23%) are Presidential Voters, 27% are Irregular Voters, and 16% are Non-Voters.
Voter engagement varies across demographic groups according to the scale. Men are more likely than women to report being Consistent Voters (38% vs. 30%), while they are about equally likely to be Non-Voters (16% vs. 15%). Young adults are much less likely than seniors to report being Consistent Voters (15% vs. 60%) and more likely to report being Non-Voters (21% vs. 7%). White Americans are more likely than black and Hispanic Americans to report being Consistent Voters (39% vs. 30% and 23%, respectively), while Hispanic Americans are more likely than black and white Americans to report being Non-Voters (26% vs. 14% and 12%, respectively).
Those who identify with a political party are more likely to be electorally engaged than political independents. Republicans (44%) and Democrats (39%) are more likely than independents (24%) to report being Consistent Voters. Independents (26%) are also much likelier than either Democrats (10%) or Republicans (6%) to be Non-Voters.
Candidate Preference
Democratic congressional candidates have a sizable advantage over Republican candidates among registered voters at this stage in the 2018 election cycle. A majority (53%) of registered voters report that they would vote for the Democratic candidate in their election district if the election were held today, while 42% say they would support the Republican candidate.4
There are not significant differences in the candidate preferences of different types of voters. A majority of Consistent Voters (53%), Presidential Voters (53%), and Irregular Voters (54%) report that if the 2018 congressional election were held today, they would vote for the Democratic candidate in their election district.
Not only do Democratic candidates currently have an edge over Republican candidates, but it is also less clear that communities that backed Trump in 2016 will rally around Republican congressional candidates this year. Three-quarters (75%) of voters who report living in communities that supported Clinton in the 2016 election believe their community is likely to back the Democratic candidate this fall, while only 64% of voters who report living in communities that supported Trump in the 2016 election say their community is likely to back the Republican candidate.5
Reasons for Voting in 2018
When asked about the most important reason to vote in the 2018 election, Americans are most likely to say they are voting to elect candidates who support issues they care about. Close to half (46%) of Americans say supporting candidates who advocate for the issues that are important to them is the overriding reason to vote in the 2018 election. One-quarter (25%) say the most important reason to vote is a sense of duty and responsibility as a citizen. Fewer Americans (14%) report that voting against officials who broke promises or engaged in misconduct is the most important reason to vote. Only 12% of the public say the most important reason to vote in the 2018 election is that it could make a difference in a close election.
Different groups of voters have somewhat divergent views about the most important reason to vote. Consistent Voters are more likely to cite the importance of duty and obligation as a citizen than any other group: Nearly one-third (31%) of Consistent Voters say this is the most important reason to vote this year. Non-Voters (16%) are least likely to point to duty and obligation as the most important reason. Irregular Voters (18%) and Non-Voters (17%) are most likely to say that punishing officials who broke promises or engaged in misconduct is the most important reason to vote. Notably, Non-Voters (22%) are more likely than any other group to say making the difference in a close election is the most important reason to vote.
Problems with the Current Election System
When asked about problems with the country’s election system, Americans are most likely to point to the influence of wealthy people and corporations and the lack of people who are willing or able to vote. Roughly two-thirds of the public say the participation of too few voters (67%) and the disproportionate influence of wealthy individuals and corporations (66%) are major problems with the current election system. About six in ten Americans say too many uninformed people voting (60%) and media bias against certain candidates (57%) are major problems. Close to half (45%) of the public say outside influence or interference from foreign governments is a major problem. Fewer Americans cite eligible voters being denied the right to vote (38%) or people casting votes who are not eligible (36%) as major problems with the country’s election system.
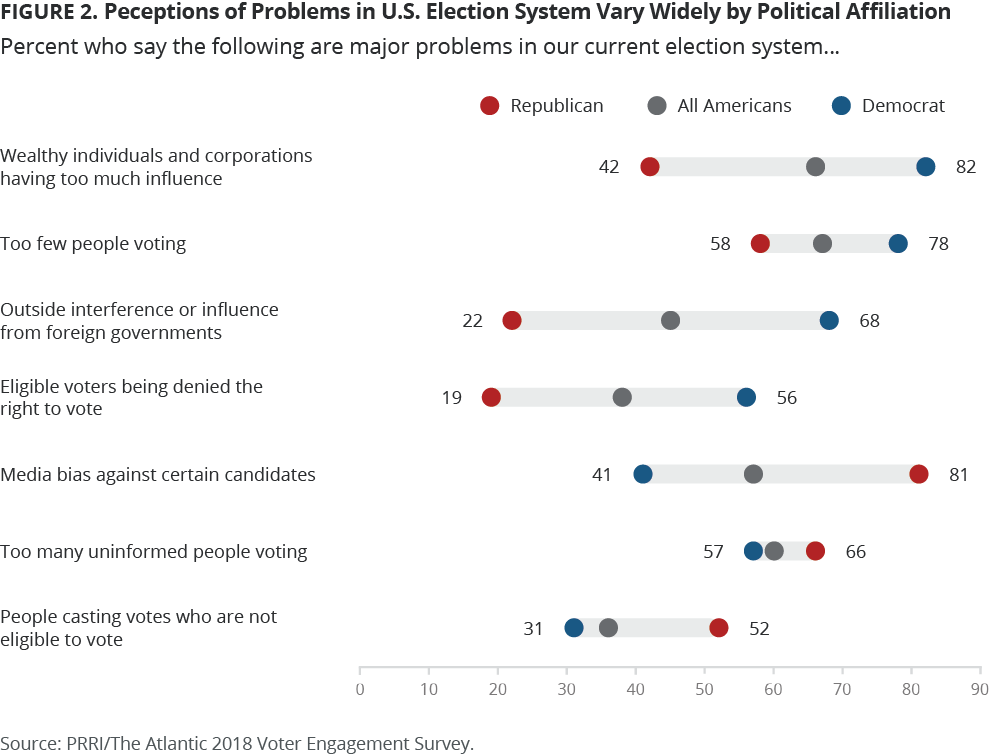
Concerns about America’s election system vary widely between Democrats and Republicans, although there are a few places of agreement. Democrats are far more likely than Republicans to say outside influence or foreign interference (68% vs. 22%), the influence of wealthy individuals and corporations (82% vs. 42%), and disenfranchisement of eligible voters (56% vs. 19%) are major problems with the system. Conversely, Republicans are much more likely than Democrats to say voter fraud (52% vs. 31%) and media bias (81% vs. 41%) are major problems. Majorities of both Democrats and Republicans believe that too few people showing up to vote (78% vs. 58%) and too many uniformed voters (57% vs. 66%) are major problems for the election system.
There is greater agreement among Americans of different racial and ethnic backgrounds about the biggest problems facing the country’s election system, although there are sharp divisions over a few issues. Few Hispanic (44%), white (34%), and black (33%) Americans say voter fraud is a major problem, while a majority of Hispanic (72%), black (70%), and white (63%) Americans believe the influence of wealthy individuals and corporations is a major concern. However, white Americans are far less likely than black and Hispanic Americans to express concerns about eligible voters being denied the right to vote. Only about one-quarter (27%) of white Americans say this is a serious issue, compared to at least six in ten Hispanic (60%) and black (62%) Americans. White Americans (36%) are also less likely than black (57%) and Hispanic (66%) Americans to say foreign interference is a major problem with America’s voting system. Conversely, white Americans (61%) are more likely than Hispanic (48%) and black (40%) Americans to cite media bias as a serious problem.
In general, views of the election system do not differ appreciably across the different voting groups. However, Consistent Voters (73%) are significantly more likely than Irregular Voters (61%) and Non-Voters (60%) to say that too few people voting is a major problem with the election system.
Notably, white evangelical Protestants are uniquely likely to say that media bias against certain candidates is a problem with the current election system. About eight in ten (79%) white evangelical Protestants say media bias against certain candidates is a major problem, while an 15% say it is a minor problem. Only five percent of white evangelical Protestants say this is not a problem.
Voter Fraud vs. Disenfranchisement
When considering whether voter disenfranchisement or voter fraud is the more pressing problem, Americans are roughly divided. Thirty-eight percent of the public say people casting votes who are ineligible to vote is the bigger problem, while 40% say denying eligible voters their right to vote is the more serious concern. Almost one in five (17%) Americans identify some other election-related issue as the bigger problem.
There are stark partisan divides on this issue. More than six in ten (62%) Democrats say voter disenfranchisement is the bigger problem, while more than two-thirds (68%) of Republicans point to voter fraud as the greater concern.
Voting Experiences
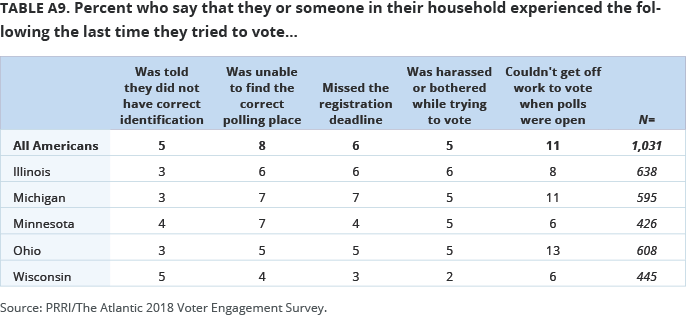
Few Americans report experiencing problems, such as having trouble finding their polling place or lacking proper identification, the most recent time they attempted to vote, but those who do report such issues are far more likely to be black and Hispanic than white.
Only five percent of Americans report that they or someone in their household were told that they lacked the correct identification the last time they tried to vote. However, black (9%) and Hispanic (9%) Americans are three times more likely than white Americans (3%) to say this happened to them or someone in their household.
There is a similar gap between white and nonwhite Americans in reports of difficulty locating the correct polling place. Overall, eight percent of the public report that they or someone in their household were unable to find their polling place the last time they attempted to vote, but black (15%) and Hispanic (14%) Americans are roughly three times more likely than white Americans (5%) to report this experience.
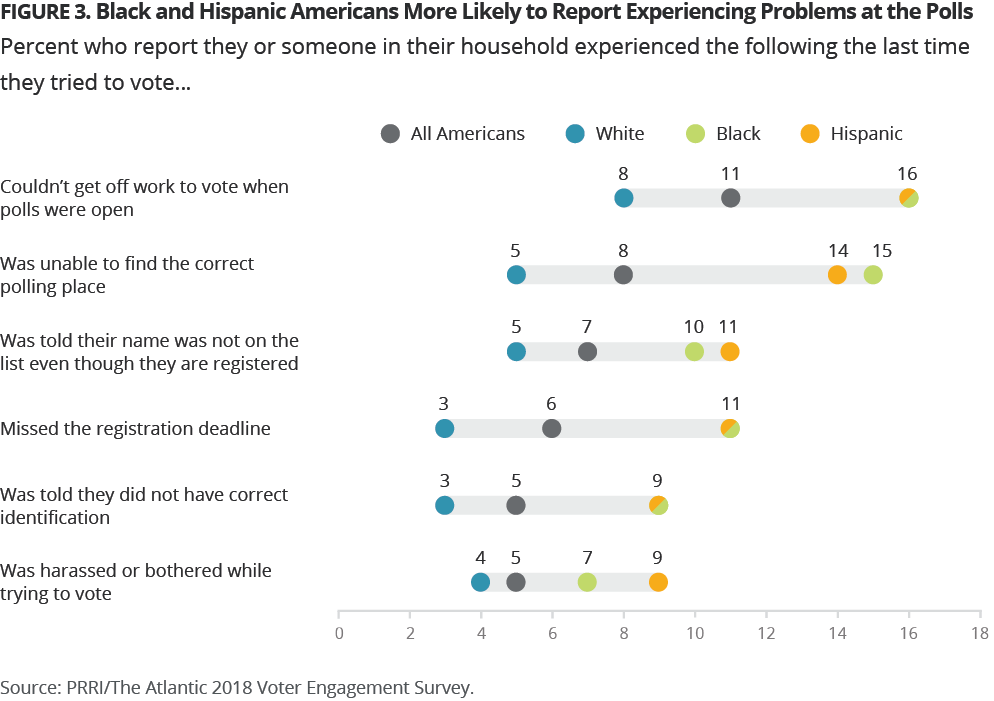
Six percent of Americans report that they or someone in their household missed the registration deadline when they tried to vote most recently. More than one in ten black (11%) and Hispanic (11%) Americans report having this experience, compared to only three percent of white Americans.
Few Americans report that they or a household member were harassed or bothered while trying to vote during their most recent visit to the polls. Only five percent of Americans, including four percent of white Americans, seven percent of black Americans, and nearly one in ten (9%) Hispanic Americans, say they or a family member were harassed the last time they tried to vote.
Overall, seven percent of Americans report that the last time they tried to vote, they or a household member were told their name did not appear on the rolls even though they were registered. Black (10%) and Hispanic (11%) Americans are about twice as likely as white Americans (5%) to report that they or a household member had this experience.
A more common problem experienced by Americans trying to vote is the inability to take time off work to do so. More than one in ten (11%) Americans say they or a member of their household experienced this problem the last time they attempted to vote. Black (16%) and Hispanic (16%) Americans are much more likely to report this experience than white Americans (8%).
Public Knowledge of State Voting Laws
Americans are remarkably uncertain about the election laws in their state. When presented with a wide variety of real and fictional election laws, Americans displayed low levels of familiarity with the rules in their state. Respondents were asked about whether people could vote in their state under the following conditions:
- If it is before Election Day
- If they have not registered to vote before Election Day
- If they are late in paying their taxes
- If they do not have a permanent address
- If they have been convicted of a felony
- If they cannot speak English fluently
- If they have outstanding traffic tickets or utility bills
- If they are not a U.S. citizen
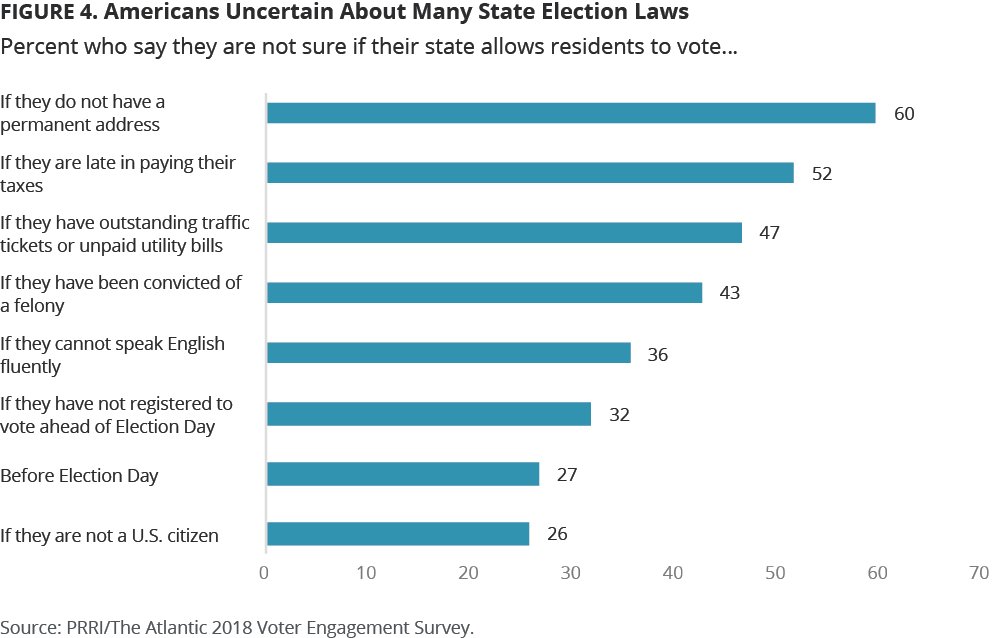
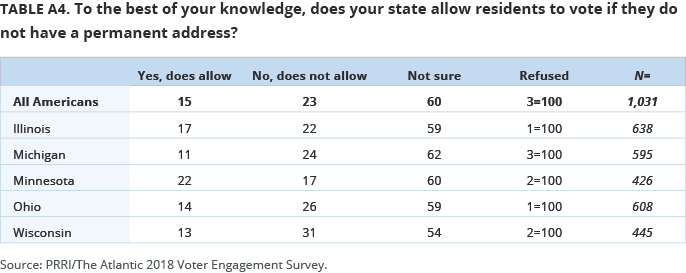
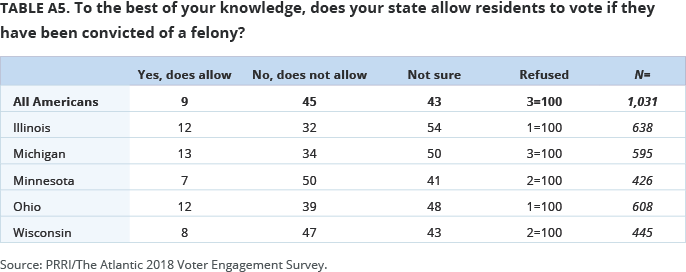
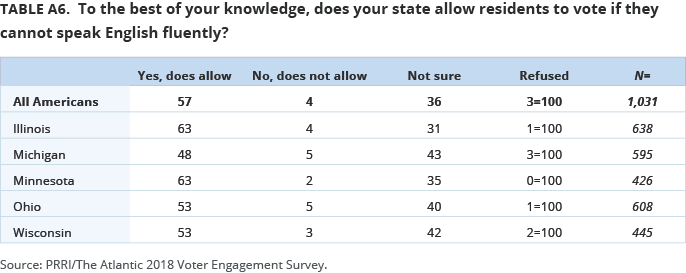
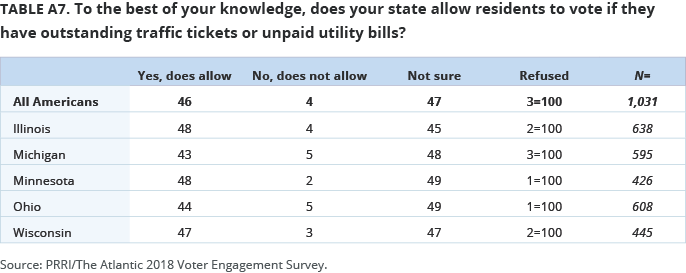
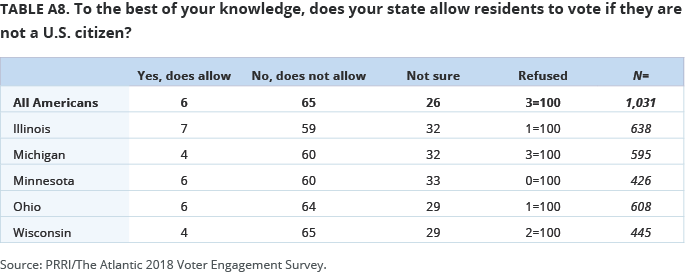
In every case, a substantial number of Americans report being “not sure” if their state allows residents to vote under those conditions. A majority of Americans are uncertain about whether residents of their state can vote if they do not have a permanent address (60%) or if they are late in paying their taxes (52%). More than four in ten Americans do not know for certain whether individuals in their state can vote if they have outstanding traffic tickets or unpaid utility bills (47%) or if they have a felony conviction (43%). Roughly one-third of Americans express uncertainty about whether those in their state are permitted to vote if they cannot speak English fluently (36%) or if they are not registered to vote before Election Day (32%). About one in four Americans say they are not certain if it is possible to vote in their state before Election Day (27%), while a similar number (26%) express uncertainty about whether non-citizens can vote in their state.
Surprisingly, higher levels of education do not necessarily mitigate uncertainty about election laws. For instance, similar numbers of Americans with and without a four-year college degree say they are not sure whether someone in their state can vote without being registered before Election Day (27% vs. 33%). And while nearly four in ten (38%) Americans without a four-year college education report being uncertain about whether a person is eligible to vote without being fluent in English, nearly one-third (30%) of Americans with a college education are also uncertain about whether this is permitted.
There are important differences in Americans’ levels of knowledge by race and ethnicity. White (38%) and black (40%) Americans are more likely than Hispanic Americans (23%) to be uncertain about the ability of voters in their state to cast a ballot if they cannot speak English fluently. Similarly, white (30%) and black (26%) Americans are more likely than Hispanic Americans (13%) to say they’re not sure about the eligibility of non-citizens to vote in their state. Black Americans are more likely to express uncertainty about whether a person is permitted to vote if they are late in paying their taxes. Six in ten (60%) black Americans say they are not sure if this is permitted under their state’s law, compared to about half of white (51%) and Hispanic (48%) Americans who say the same.
Beyond these high levels of uncertainty, many Americans also hold incorrect views about election laws in their state. Using categorizations from the National Conference of State Legislatures, we classified the election laws in all fifty states and the District of Columbia based on the following issues:
- States with and without early voting6
- States with and without same-day registration7
- States with varying levels of felon disenfranchisement8
Of those living in states with early voting9, nearly two-thirds (66%) correctly identify that they can vote before Election Day, while eight percent say they cannot. Among those living in states without early voting10, just 15% correctly say they cannot vote before Election Day, while more than four in ten (44%) incorrectly believe they can vote before Election Day.
Among those living in states with some form of same-day registration11, roughly one-quarter (26%) correctly believe they can vote without being registered before Election Day, while an even greater number (37%) believe this is not allowed. More than half (54%) of Americans living in states without same-day registration correctly say they cannot vote without being registered prior to Election Day, while more than one in ten (12%) incorrectly believe they can vote without being registered prior to Election Day.
Among those living in states with fewer voting restrictions on individuals with felony convictions12, one in ten (10%) say those convicted of a felony can vote, while about four in ten (42%) say they cannot. A majority (54%) of respondents living in states with the strongest restrictions on individuals with felony convictions13 say that those convicted of a felony cannot vote, while only four percent believe they can vote.
Some Americans also mistakenly believe in the veracity of certain election laws that do not exist in any state. About one in twenty Americans believe that non-citizens can vote in their state (6%) and that residents of their state cannot vote if they are late in paying their taxes (5%), have outstanding traffic tickets or unpaid utility bills (4%), or do not speak English fluently (4%).
Election Policies and Politics
Restoring Voting Rights for People with Felony Convictions
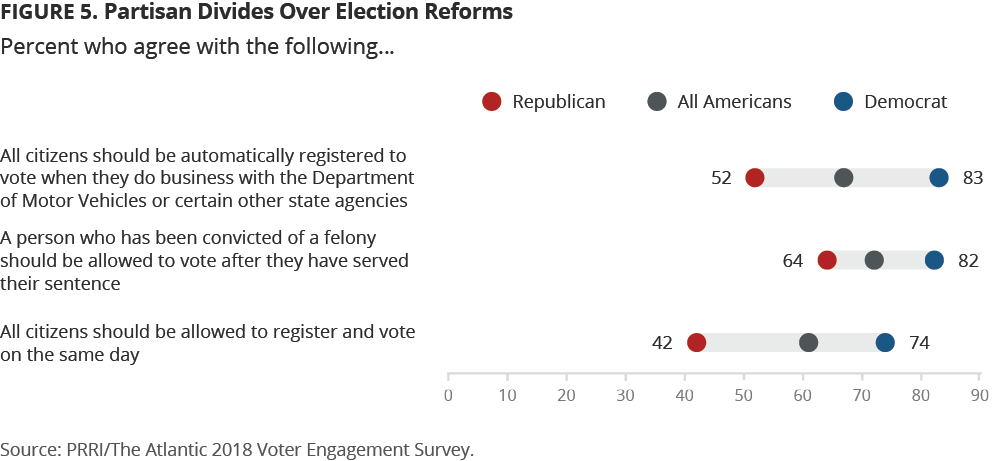
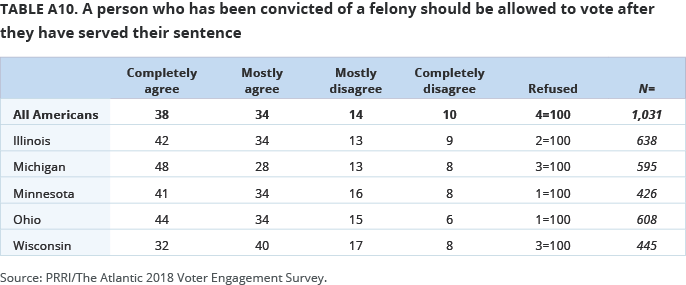
Americans are broadly supportive of allowing people convicted of a felony to vote after they have served their sentence. More than seven in ten (72%) Americans agree that a person who has been convicted of a felony should be allowed to vote after they have served their sentence, while about one-quarter (24%) disagree. Support for allowing people convicted of a felony to vote has remained steady since 2016, when roughly three-quarters (74%) of the public expressed support for this policy.14
There is agreement across party lines about restoring voting rights to individuals with felony convictions, although there is a notable gap in intensity. More than eight in ten (82%) Democrats agree that Americans convicted of a felony should be allowed to vote after they have served their sentence, including more than half (51%) who completelyagree. About two-thirds of independents (68%) and Republicans (64%) also agree that those with felony convictions should regain their right to vote after they have served their sentence. However, only 28% of Republicans strongly support this policy.
The policy is also broadly popular among Americans of different racial and ethnic backgrounds. At least seven in ten white (70%), Hispanic (74%), and black (85%) Americans support allowing those with felony convictions to vote after they have served their sentence. Notably, roughly two-thirds (65%) of black Americans strongly support this policy.
Even among those living in states with the strongest voting restrictions on people with felony convictions15, about two-thirds (66%) agree that a person who has been convicted of a felony should be allowed to vote after serving their sentence. About one-quarter (26%) of those states’ residents disagree.
Automatic Voter Registration
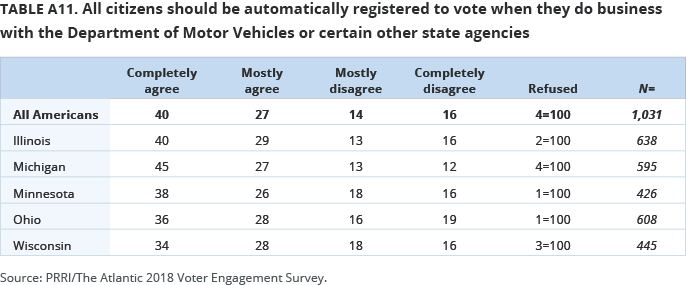
Implementing automatic voter registration when citizens do business at the Department of Motor Vehicles (DMV) or other state agencies is broadly popular. Two-thirds (67%) of Americans agree that all citizens should be automatically registered to vote when they do business with the DMV or certain other state agencies. Only three in ten (30%) Americans oppose this policy.
A majority of Democrats (83%), independents (61%), and Republicans (52%) believe citizens should be automatically registered to vote when they do business with certain state agencies, although levels of support for automatic voter registration varies substantially by party. Close to half (45%) of Republicans oppose automatic voter registration.
Support for automatic voter registration is relatively consistent across racial and ethnic groups. Roughly three-quarters of black (76%) and Hispanic (73%) Americans agree that citizens should be automatically registered to vote when they do business at the DMV or other state agencies, compared to about six in ten (63%) white Americans. There is a modest education gap among white Americans: More than two-thirds (68%) of whites with a four-year college degree, compared to 61% of those without a four-year college education, support automatic voter registration.
Same-Day Voter Registration
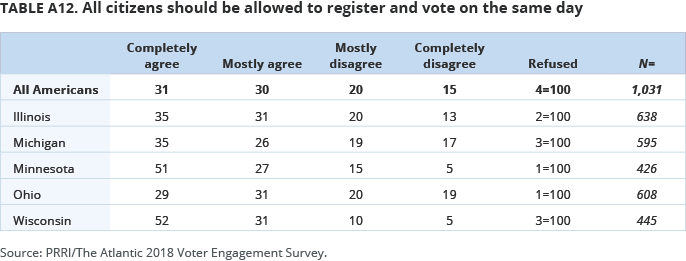
While a majority of Americans support same-day voter registration, this policy has somewhat less support than restoring voting rights to those with felony convictions or automatic voter registration. Roughly six in ten (61%) Americans agree that all citizens should be allowed to register and vote on the same day. About one-third (35%) disagree with this statement.
There is a wide partisan gap in support for same-day voter registration. Nearly three-quarters (74%) of Democrats believe that all citizens should be able to register and vote on the same day, a view shared by only about four in ten (42%) Republicans. The views of political independents generally align with those of the general public.
Hispanic Americans express greater support for same-day registration than black or white Americans. More than seven in ten (71%) Hispanic Americans agree that all citizens should be able to register and vote on the same day, while fewer than six in ten white (58%) and black (59%) Americans share this view.
The Widespread Popularity of the Popular Vote
By roughly a two-to-one margin, Americans say they would prefer if presidential elections were decided by the national popular vote as opposed to the Electoral College. Nearly two-thirds (65%) of Americans believe that presidential elections should be decided based on the national popular vote, while about one-third (32%) believe they should be decided through the Electoral College.
Democrats, who have witnessed two Democratic presidential candidates win the popular vote while losing the Electoral College in the past two decades, overwhelmingly favor electing U.S. presidents by the popular vote. More than eight in ten (81%) Democrats say presidential elections should be decided based on the popular vote, and only 17% say the Electoral College should determine the winner of presidential elections. In contrast, Republicans are split over how presidential elections should be decided: Fewer than half (46%) say they should be decided by the popular vote, while a slim majority (51%) favor the Electoral College. Political independents do not differ appreciably from the public overall.
The popular vote is particularly popular among black Americans. More than eight in ten (85%) black Americans say presidential elections should be decided by the popular vote as opposed to the Electoral College. Close to seven in ten (69%) Hispanic Americans and about six in ten (61%) white Americans also believe presidential elections should be decided by the popular vote rather than the Electoral College.
Which Party Benefits from Greater Political Participation?
Americans are generally more likely to believe that greater political participation would advantage the Democratic Party rather than the GOP. Nearly four in ten (39%) Americans say if all eligible voters participated in national elections, it would benefit the Democratic Party, while only 16% say it would benefit the Republican Party. Nearly three in ten (29%) believe that full electoral participation would benefit both parties equally, and 14% say neither party would benefit.
Democrats are much more likely than Republicans to believe their own party would benefit from full electoral participation. Roughly seven in ten (68%) Democrats say if all eligible voters participated in national elections, the Democratic Party would benefit, while 20% say it would serve the interests of both parties equally, and eight percent say it would not advantage either party. Only two percent of Democrats say this situation would be beneficial to the GOP. In contrast, less than half (41%) of Republicans say full voter participation would benefit their party. More than one-third (35%) believe it would benefit both parties equally, while nine percent say it would benefit neither party. Fourteen percent say this scenario would benefit the Democrats.
There is a stark racial and ethnic divide in views of how greater political participation would affect the fates of the two major political parties. A majority of black (54%) and Hispanic (58%) Americans believe the Democratic Party would benefit from full voter participation, while fewer than one-third (32%) of white Americans agree. Nineteen percent of white Americans say greater political participation would be better for the GOP, and nearly half of white Americans say the situation would help neither party (15%) or help them both equally (31%).
A Look at Middle America: The Great Lakes Region
To better understand how voter experiences, knowledge, and preferences differ between states, this survey included an oversample of states in the Great Lakes region: Illinois, Ohio, Michigan, Minnesota, and Wisconsin. The Great Lakes region has become increasingly important politically, but each state has a distinctive political culture.
Public Knowledge of State Voting Laws
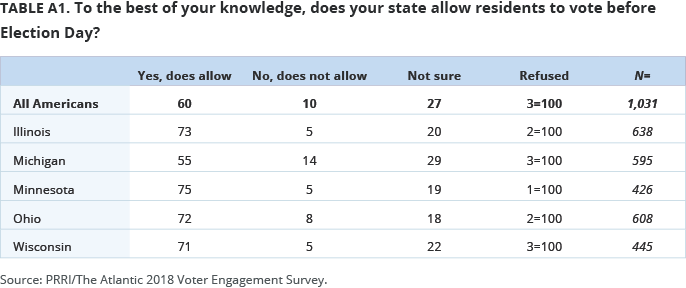
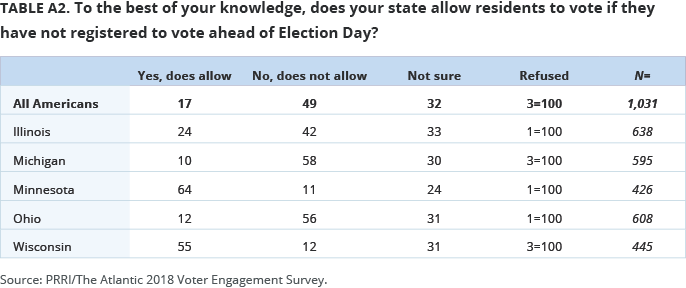
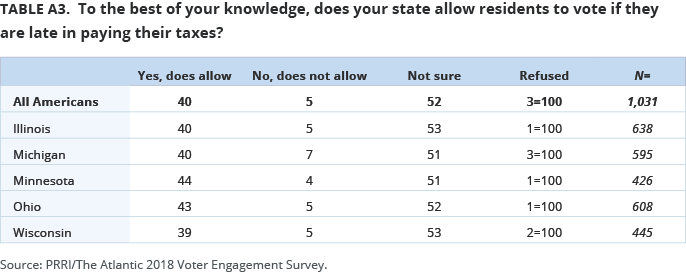
Like voters nationally, Americans in the Great Lakes states express a high level of uncertainty about the content of state election laws. Although levels of certainty vary by state16, a majority of residents in each state are not certain whether people can vote if they do not have a permanent address or if they are late in paying their taxes. More than four in ten respondents in each state are uncertain about whether people can vote if they have been charged with a felony, have outstanding traffic tickets, or have unpaid utility bills. Roughly one-third are uncertain about whether people can vote if they don’t speak English fluently or if they are not U.S. citizens. At least one in five residents in each state don’t know if people can vote without being registered before Election Day, and at least one in six are not sure if their state allows voting before Election Day.
Despite the significant lack of knowledge about state voting requirements overall, levels of knowledge differ appreciably between residents of the Great Lakes states. On the issue of English fluency as a voting prerequisite, there is a stark divide. More than six in ten residents of Illinois (63%) and Minnesota (63%) say their state does allow citizens to vote even if they cannot speak English fluently. In contrast, only slightly more than half of Ohio (53%) and Wisconsin (53%) residents and fewer than half (48%) of Michigan residents say their state’s voting laws allow this. At least four in ten Ohio (40%), Wisconsin (42%), and Michigan (43%) residents express uncertainty about whether their state law mandates this requirement.
At the same time, those living in the Great Lakes region are generally able to correctly identify the content of some state voting laws. More than seven in ten respondents from Minnesota (75%), Illinois (73%), Ohio (72%), and Wisconsin (71%) correctly believe that they can vote before Election Day in their state. In Michigan, however, which does not have early voting, more than half (55%) incorrectly believe they can vote before Election Day. Only 14% of Michigan residents correctly identify that they cannot vote before Election Day in their state.
With the exception of Illinois, a majority of residents in the region are also able to correctly identify their same-day registration laws. A majority of Michigan (58%) and Ohio (56%) residents correctly believe they cannot vote if they are not registered before Election Day. Similarly, a majority of Minnesota (64%) and Wisconsin (55%) residents correctly believe that they can vote under such conditions. In all four states, about one in ten respondents incorrectly identify their state’s laws. In Illinois, which has same-day registration, more than four in ten residents (42%) incorrectly believe they cannot vote if they are not registered before Election Day. About one in four (24%) correctly say they can vote under such conditions, while one-third (33%) say they are not sure.
Voting Experiences
Americans across the Great Lakes region report having experienced challenges during the voting process at roughly similar rates with one notable exception. More than one in ten Ohio residents (13%) and Michigan residents (11%) report they or a family member were unable to take time off work the most recent time they attempted to vote. In contrast, eight percent of Illinois residents, and only six percent of Wisconsin and Minnesota residents, report this experience.
Although there were few differences in the reported voting problems experienced by people across these five states, the racial gap in problematic voting experiences is more pronounced in some states than others. In both Michigan and Illinois, nonwhite residents are more likely than white residents to report having issues when attempting to vote.17 One in ten nonwhite Americans in Illinois (10%) and Michigan (10%) report that they or someone in their household missed the registration deadline the last time they tried to vote, compared to about one in twenty white residents of those states (6% and 4%, respectively). Similarly, about one in ten nonwhite residents of Illinois (11%) and Michigan (9%) report that the last time they or a member of their household tried to vote, their name did not appear on the registration list even though they believed they were registered to vote. Only about one in twenty white residents of Illinois (5%) and Michigan (4%) report that they or a household member had a similar experience. Additionally, while about one in ten nonwhite residents of Michigan (9%) and Illinois (9%) report that they were harassed or bothered the last time they or a member of their household tried to vote, few white residents of Illinois (4%) and Michigan (4%) report this experience. Finally, nonwhite residents of Michigan (8%) are more likely than white residents (2%) to report that they or a member of their household were told they did not have the correct identification the last time they tried to vote. White and nonwhite residents of Illinois are about as likely to report having had this experience. In Ohio, white and nonwhite residents are about equally likely to report these types of issues when trying to vote.
Election Policies and Politics
Americans in the Great Lakes region generally support policies that expand access to voting. A strong majority of Americans living in these states say people with felony convictions should be able to vote after they have served their sentence. Roughly three-quarters of residents in Ohio (78%), Illinois (76%), Michigan (76%), Minnesota (75%), and Wisconsin (72%) agree with this policy.
Similarly, a majority of residents of each state agree that all citizens should be automatically registered to vote when they do business with the Department of Motor Vehicles or other state agencies. More than six in ten residents of Michigan (72%), Illinois (69%), Ohio (64%), Minnesota (64%), and Wisconsin (62%) support this registration policy.
A majority of respondents in each state also support citizens being able to register and vote on the same day, although the intensity of that support varies by state. Roughly eight in ten residents of Wisconsin (83%) and Minnesota (78%) favor this policy, including a majority (52% and 51%, respectively) who strongly endorse it. In contrast, fewer than two-thirds of Illinois (66%), Michigan (61%), and Ohio (60%) residents express support for allowing citizens to register and vote on the same day.
Voter Fraud vs. Disenfranchisement
Across the Great Lakes region, residents are mostly divided over what they consider to be the more pressing problem: people casting votes who are not eligible to vote or eligible voters being denied the right to vote. Residents of Illinois (39% vs. 40%), Michigan (37% vs. 39%), Wisconsin (39% vs. 42%) and Minnesota (42% vs. 40%) are closely divided. Ohio residents, however, are much more likely to say in people casting ineligible votes (45%) rather than eligible voters being denied the right to vote (34%) is the more pressing concern.
A Preference for the Popular Vote
Across the Great Lakes region, Americans say they would prefer presidential elections to be decided by the national popular vote as opposed to the Electoral College. Roughly two-thirds of Ohio (66%), Michigan (66%), and Wisconsin (67%) residents say they prefer the popular vote over the Electoral College. Nearly seven in ten (69%) Minnesota residents and close to three-quarters (73%) of Illinois residents also express a preference for the popular vote.
Illinois Fact Sheet
Michigan Fact Sheet
Minnesota Fact Sheet
Ohio Fact Sheet
Wisconsin Fact Sheet
Appendix: Survey Methodology
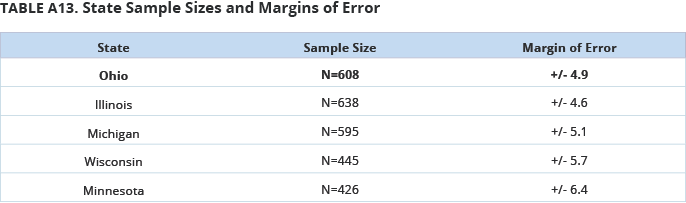
The 2018 Voter Engagement Survey was conducted by PRRI in partnership with The Atlantic among a random sample of adults (age 18 and up) living in the United States and who are part of GfK’s Knowledge Panel. The survey included a national sample (N=1,031) representing all 50 states as well as oversamples of respondents in Illinois (N=638), Ohio (N=608), Michigan (N=595), Minnesota (N=426), and Wisconsin (N=445). Interviews were conducted online in both English and Spanish between June 6 and June 18, 2018. The survey was made possible by generous grants from The Joyce Foundation, The Kresge Foundation, and The McKnight Foundation.
Respondents are recruited to the KnowledgePanel using an addressed-based sampling methodology from the Delivery Sequence File of the USPS – a database with full coverage of all delivery addresses in the U.S. As such, it covers all households regardless of their phone status, providing a representative online sample. Unlike opt-in panels, households are not permitted to “self-select” into the panel; and are generally limited to how many surveys they can take within a given time period.
The initial sample drawn from the KnowledgePanel was adjusted using pre-stratification weights so that it approximates the adult U.S. population defined by the latest Current Population Survey. Next, a probability proportional to size (PPS) sampling scheme was used to select a representative sample. Once assigned to the survey, panel participants received an email notification reminder on June 9th to complete the survey. An additional email reminder was sent out on June 13th of the field period18.
To reduce the effects of any non-response bias, a post-stratification adjustment was applied based on demographic distributions from the most recent Current Population Survey (CPS). The post-stratification weight rebalanced the sample based on the following benchmarks: age, race and ethnicity, gender, Census division, metro area, education, and income. The sample weighting was accomplished using an iterative proportional fitting (IFP) process that simultaneously balances the distributions of all variables. Weights were trimmed to prevent individual interviews from having too much influence on the final results. In addition to an overall national weight, separate weights were computed for each state to ensure that the demographic characteristics of the sample closely approximate the demographic characteristics of the target populations.
The margin of error for the national survey is +/- 3.3 percentage points at the 95% level of confidence. The design effect for the survey is 1.2. Table 1 includes margin of error information for the state samples. In addition to sampling error, surveys may also be subject to error or bias due to question wording, context and order effects.
Endnotes
1 PRRI 2016 American Values Survey.
2 PRRI/Brookings 2014 Religion, Values, and Immigration Reform Panel Call Back Survey.
3 The Voter Engagement Scale was developed through an additive process that combined three variables: frequency of participation in local elections, such as for school board or city council; frequency of participation in congressional midterm elections; and frequency of participation in presidential elections. The three measures were highly correlated along a single dimension, indicating they were appropriate to include in a single scale.
4 The analysis in this section was conducted exclusively among registered voters.
5 Clinton and Trump communities were defined by respondents who self-report that they live in a community that preferred Clinton or Trump in the 2016 election. Only four percent of Americans report that they live in a community that was equally divided between Trump and Clinton supporters.
6 http://www.ncsl.org/research/elections-and-campaigns/absentee-and-early-voting.aspx
7 http://www.ncsl.org/research/elections-and-campaigns/same-day-registration.aspx
8 http://www.ncsl.org/research/elections-and-campaigns/felon-voting-rights.aspx
9 This includes all vote-by-mail states, states with early voting, and states with no-excuse absentee voting.
10 This includes states where there is no early voting and an excuse is required to request an absentee ballot.
11 This includes states that have same-day registration including on Election Day or registration only during an early voting period.
12 This includes states where those with felony convictions never lose the right to vote, only lose the right to vote while incarcerated, or lose the right to vote until they have completed parole or probation.
13 This includes states where voting rights are not automatically restored to those with felony convictions after the completion of their sentence, including parole and probation.
14 PRRI 2016 American Values Survey.
15 This includes states where voting rights are not automatically restored to people with felony convictions after the completion of their sentence, including parole and probation.
16 See tables in the appendix for full state breakouts.
17 Analysis is limited to Michigan, Illinois, and Ohio. Wisconsin and Minnesota samples had an insufficient sample of nonwhite residents for analytical purposes.
18Additional details about the KnowledgePanel can be found on the GfK website: https://www.gfk.com/products-a-z/us/knowledgepanel-united-states/
Recommended citation:
Robert P. Jones, PhD, Daniel Cox, PhD, Rob Griffin, PhD, Molly Fisch-Friedman and Alex Vandermaas-Peeler. “American Democracy in Crisis: The Challenges of Voter Knowledge, Participation, and Polarization.” PRRI. 2018. https://www.prri.org/research/American-democracy-in-crisis-voters-midterms-trump-election-2018


