

The 2018 Election
Views of President Trump
After two years in office, the public’s view of President Trump remains negative. As of late December 2018, when this survey was conducted, only 36% of Americans reported that they held a favorable view of President Trump. Six in ten (60%) of the general public said their view of the president was unfavorable.
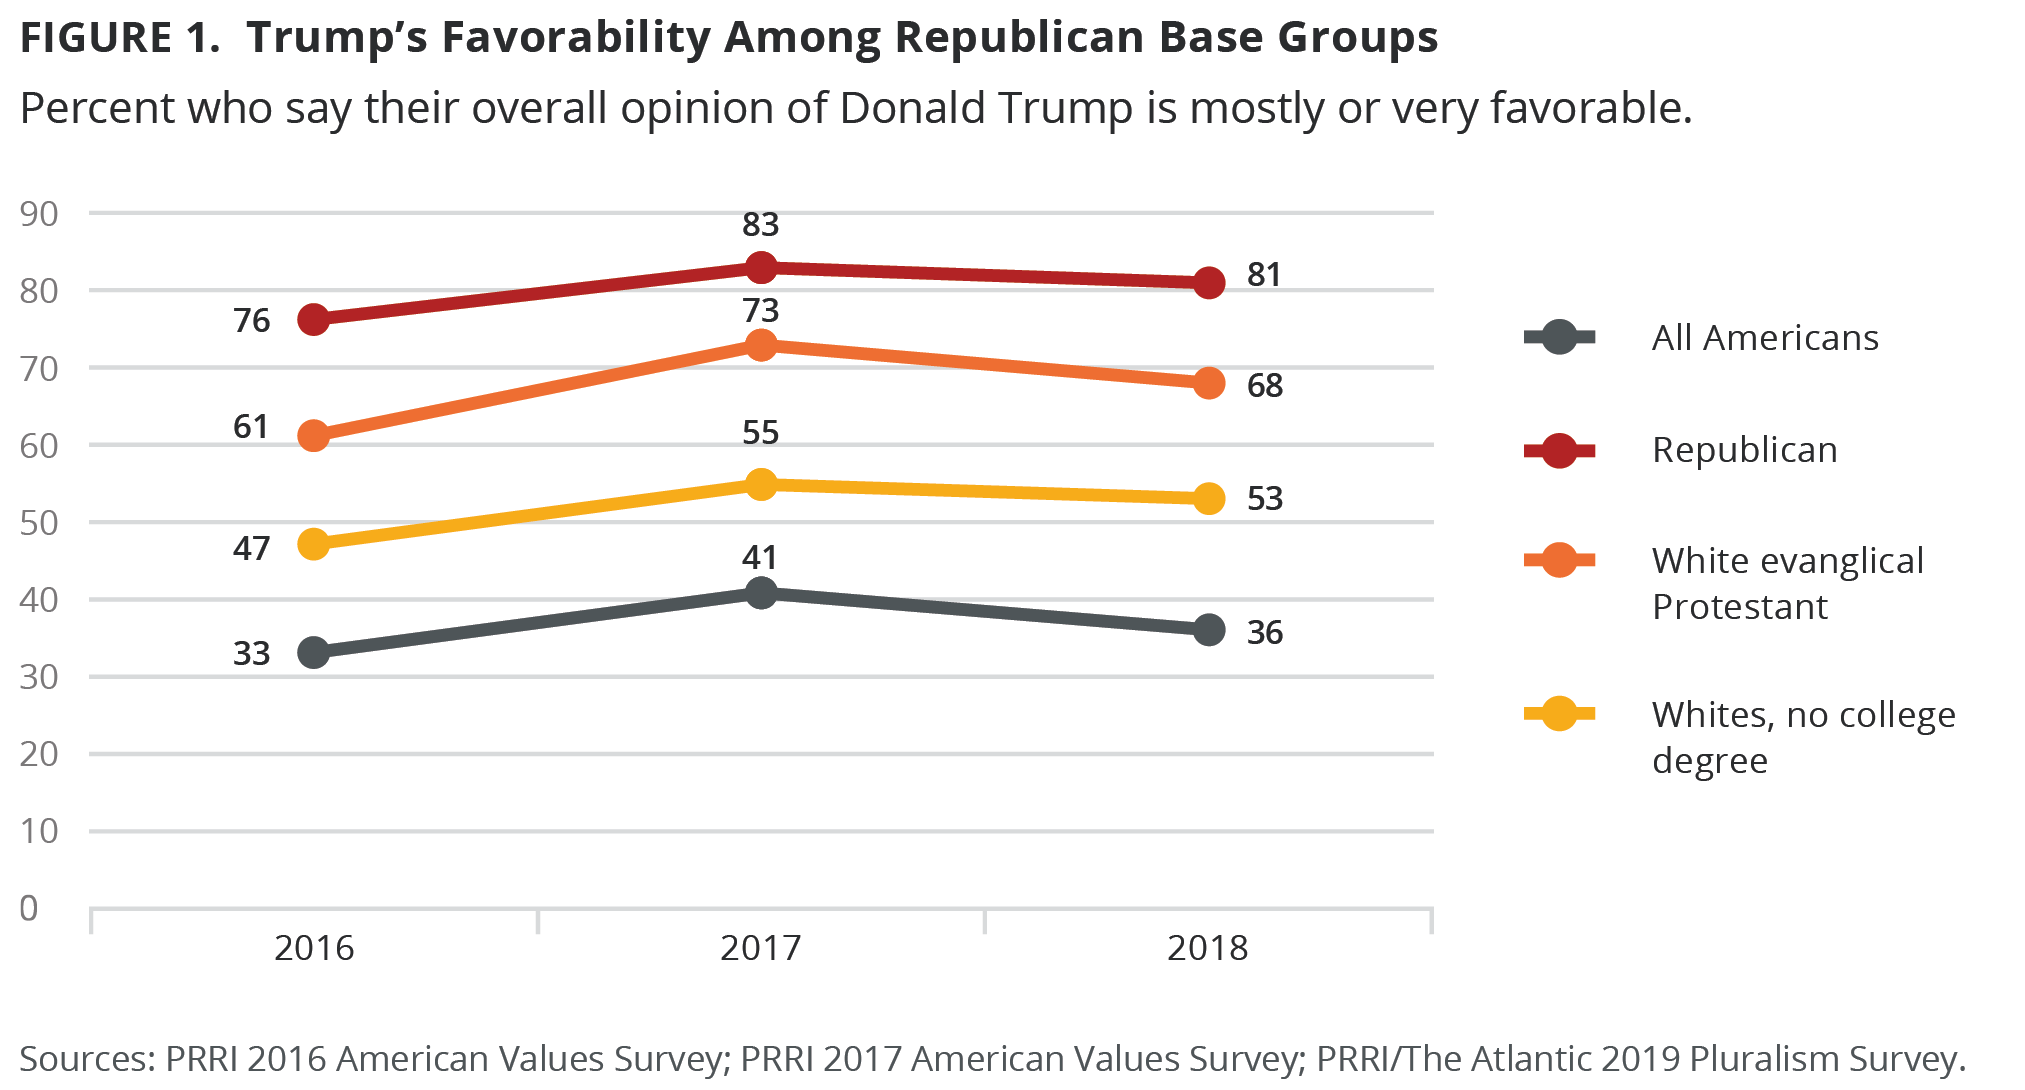
Perspectives on the president are deeply divided by political affiliation. An overwhelming majority (81%) of Republicans have a positive view of Trump, compared to 31% of political independents and only seven percent of Democrats. Republican support for Trump has remained steadfast over the course of Trump’s presidency, and Democratic support has remained low. Just before the 2016 election, 76% of Republicans had a favorable view of Trump, compared to only 6% of Democrats.[1]
Among religious groups, white evangelical Protestants continue to be Trump’s strongest supporters and remain the only major religious group in which a majority holds a favorable view of the president. More than two-thirds (68%) of white evangelical Protestants have a favorable opinion of the president, compared to 48% of white mainline Protestants, 35% of Catholics (and 47% of white non-Hispanic Catholics), 21% of nonwhite Protestants, and 21% of religiously unaffiliated Americans. Support for Trump among white evangelical Protestants has risen since September 2016 (61%), when he still was a presidential candidate. Over the course of Trump’s presidency, support from white evangelical Protestants has remained consistently high, with roughly two-thirds to three-quarters of white evangelicals holding a favorable view of Trump.
White Americans are, overall, more likely than nonwhite Americans to have a favorable view of Trump. Nearly half (47%) of white Americans have a positive view of Trump, compared to 22% of Hispanic Americans and only seven percent of black Americans. However, there are some noteworthy divisions in views of the president among whites. White Americans without a college degree have a higher opinion of the president than white Americans with a four-year college education: half (53%) of whites without a college education have a favorable opinion of Trump, compared to 35% of whites with a college degree. These levels of support among whites without a college degree have largely remained steady since September 2016, when 47% of white working-class Americans had a positive view of then-candidate Trump.
Problems Voting in the 2018 Midterm Election
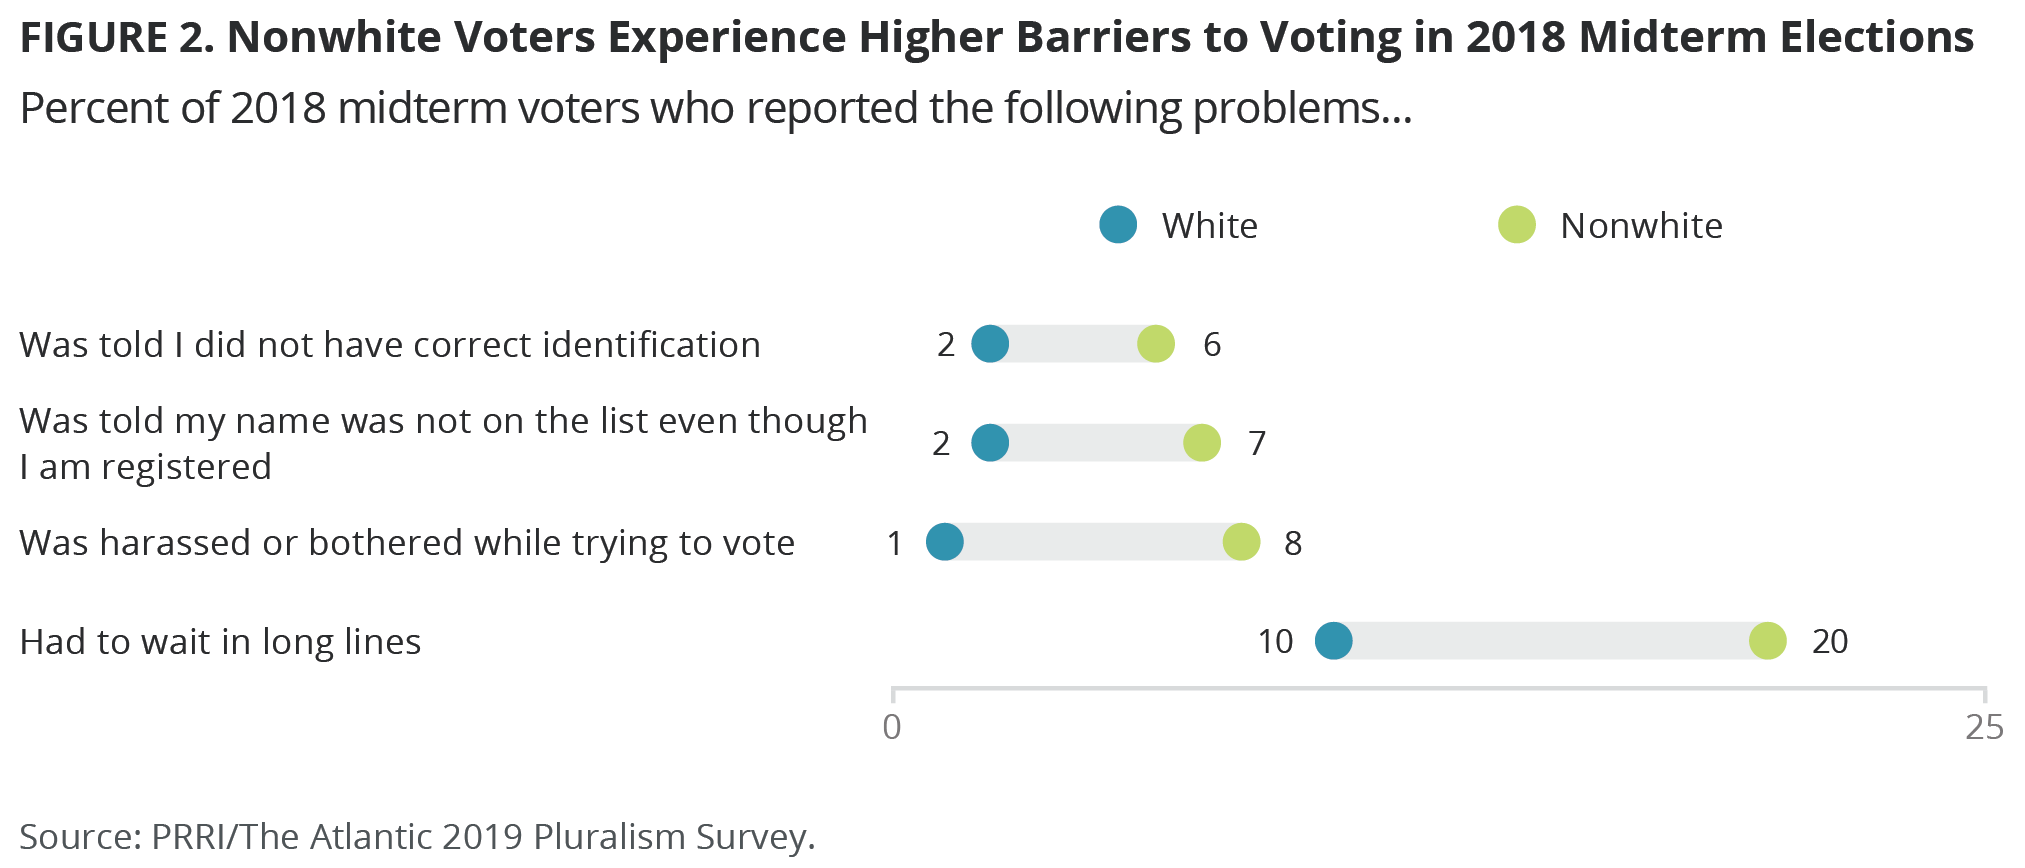
When asked about their experiences voting in the 2018 midterm elections, few Americans reported encountering problems at the polls. However, consistent with PRRI’s previous findings, nonwhite voters were significantly more likely to report that they encountered barriers to voting.
Barriers Experienced by Voters in the 2018 Midterm Elections
Among Americans who voted in 2018,[2] only three percent report that they or someone in their household was told they did not have the correct form of identification when they attempted to vote. However, nonwhite Americans are significantly more likely than white Americans (six percent vs. two percent) to report that this happened to them or someone else in their household when they tried to vote in the midterm elections.
Relatively few voters (three percent) say that they or a household member were harassed or bothered when they tried to vote in the 2018 midterm elections. However, while this experience was nearly nonexistent among white voters (one percent), nearly one in ten (eight percent) nonwhite voters reported being harassed or bothered while voting in 2018.
Only two percent of 2018 voters overall say that they or someone in their household was told their name was not on the list even though they were registered. However, nonwhite Americans are more likely to report this problem than white Americans (seven percent vs. two percent).
Two of the more common problems experienced by voters in 2018 included having to stand in long lines (13%) and finding the ballot confusing (nine percent). In both cases, nonwhite Americans are still more likely to say they or someone in their house experienced this problem. One in five (20%) nonwhite voters report they had to wait in a long line when they tried to vote in the 2018 midterm elections, compared to only ten percent of white Americans. Similarly, 15% of nonwhite voters say they found the ballot confusing, compared to six percent of white Americans.
Younger voters (under the age of 40) are also twice as likely as older voters (ages 40 and older) to say they had to wait in long lines when they tried to vote (20% vs. 10%) or that they found the ballot confusing (13% vs. seven percent).
Barriers Experienced by Americans that Prevented Them from Voting
Similarly, while only three percent of Americans say that they or someone in their household were unable to find the correct polling place when they last tried to vote, black (9%) and Hispanic (9%) Americans are substantially more likely than white Americans (1%) to say this happened to them or someone in their household.
Only three percent of Americans report that they missed the registration deadline when they tried to vote most recently. However, black (5%) and Hispanic (6%) Americans are much likelier than white Americans (2%) to report that they or someone else in their household encountered this problem.
Four percent of Americans say they or someone in their household could not get off work to vote when polls were open when they tried to vote most recently. Black (8%) and Hispanic (10%) Americans are likelier to report this experience than white Americans (2%).
There were also several voting-related problems that are more commonly experienced by young Americans (ages 18-29) than seniors (ages 65 and older). Around one in ten young Americans say they or someone in their household missed the registration deadline when they last tried to vote (six percent) or that they could not take time off work to vote when the polls were open (10%), while almost no seniors report having either experience.
Measuring A Changing Population: Asking About Citizenship Status on the 2020 Census
Impact of Citizenship Question on the Accuracy of the Census
As the legal battle unfolds over a proposed addition to the 2020 Census that would ask respondents if they are U.S. citizens, an overwhelming number of Americans agree that such a question would undermine the accuracy of the Census count.
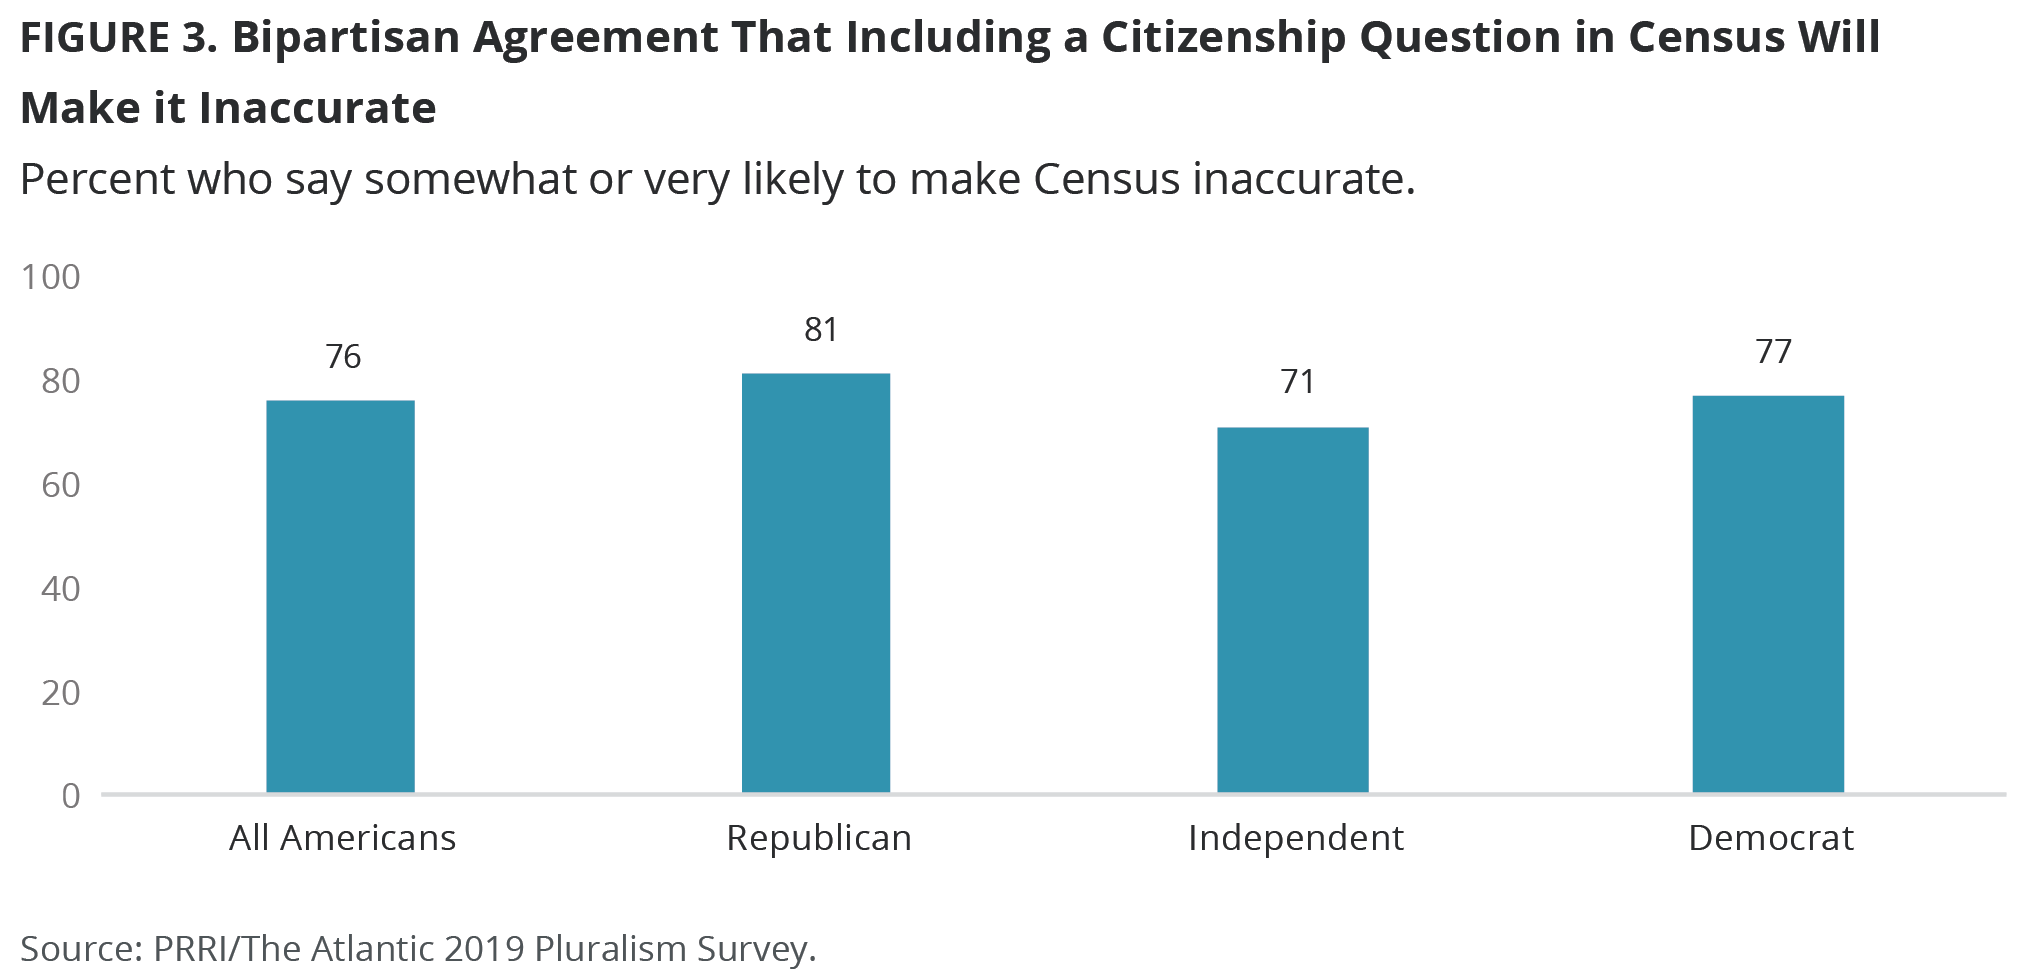
Approximately three-quarters (76%) of Americans say it is at least somewhat likely that the Census will not get an accurate count because some people will be worried about answering this question, including a majority (53%) of Americans who say this is very likely. Only 10% say it is somewhat or very unlikely that the Census count will be inaccurate because of this question, while 14% say they don’t know or refused to answer the question.
Notably, there is a strong bipartisan consensus that the proposed citizenship question is at least somewhat likely to result in an inaccurate Census count. More than three-quarters of Republicans (81%) and Democrats (77%) and approximately seven in ten independents (71%) agree that it is at least somewhat likely that the Census will not get an accurate count because of this question. There are some intensity differences between partisans, with 60% of Democrats but only 48% of Republicans, saying that it is very likely that including a question about citizenship status will hinder an accurate Census count.
Among racial groups, white (82%) and Hispanic (75%) Americans are likelier than black Americans (55%) to say that the addition of a citizenship question would threaten the accuracy of the Census count because some people will be worried about responding.
Concerns about How the Government Might Use a Citizenship Question on the Census
Despite relatively uniform views about the effect of the citizenship question on the accuracy of the Census count, however, Americans are more divided about how they believe the question will be used. One-third (33%) say the government will use the question to check on an individual’s immigration status, while 26% say the question will only be used for counting the population, and a plurality (41%) say they don’t know how it will be used or refused to answer the question.
Democrats (49%) and independents (30%) are substantially more likely than Republicans (19%) to believe that the question will be used to investigate an individual’s immigration status. In contrast, a plurality (43%) of Republicans say the question will only be used to count the population, compared to 23% of independents and 18% of Democrats. Overall, partisans are likelier to have a firm opinion about how they believe the question will be used: independents (48%) are likelier than both Republicans (38%) and Democrats (32%) to say they don’t know or refuse to answer.
There are smaller but still notable divisions among racial groups. Hispanic Americans (40%) are slightly more likely than white Americans (31%) to say the question will be used to check immigration status, while black Americans (35%) fall in between. White Americans (30%), meanwhile, are likelier than Hispanic (23%) or black (17%) to say the question will only be used for the population count.
Experiences With Diversity
Frequency of Interactions With Diversity
Overall, Americans report that they frequently interact with people who are different than them in various ways. Approximately six-in-ten Americans say they interact at least once a week with someone who does not share their race or ethnicity (62%), someone who does not share their religion (60%), or someone who does not share their political party (57%). Americans are less likely to say that they interact at least once a week with someone who does not share their sexual orientation (41%).
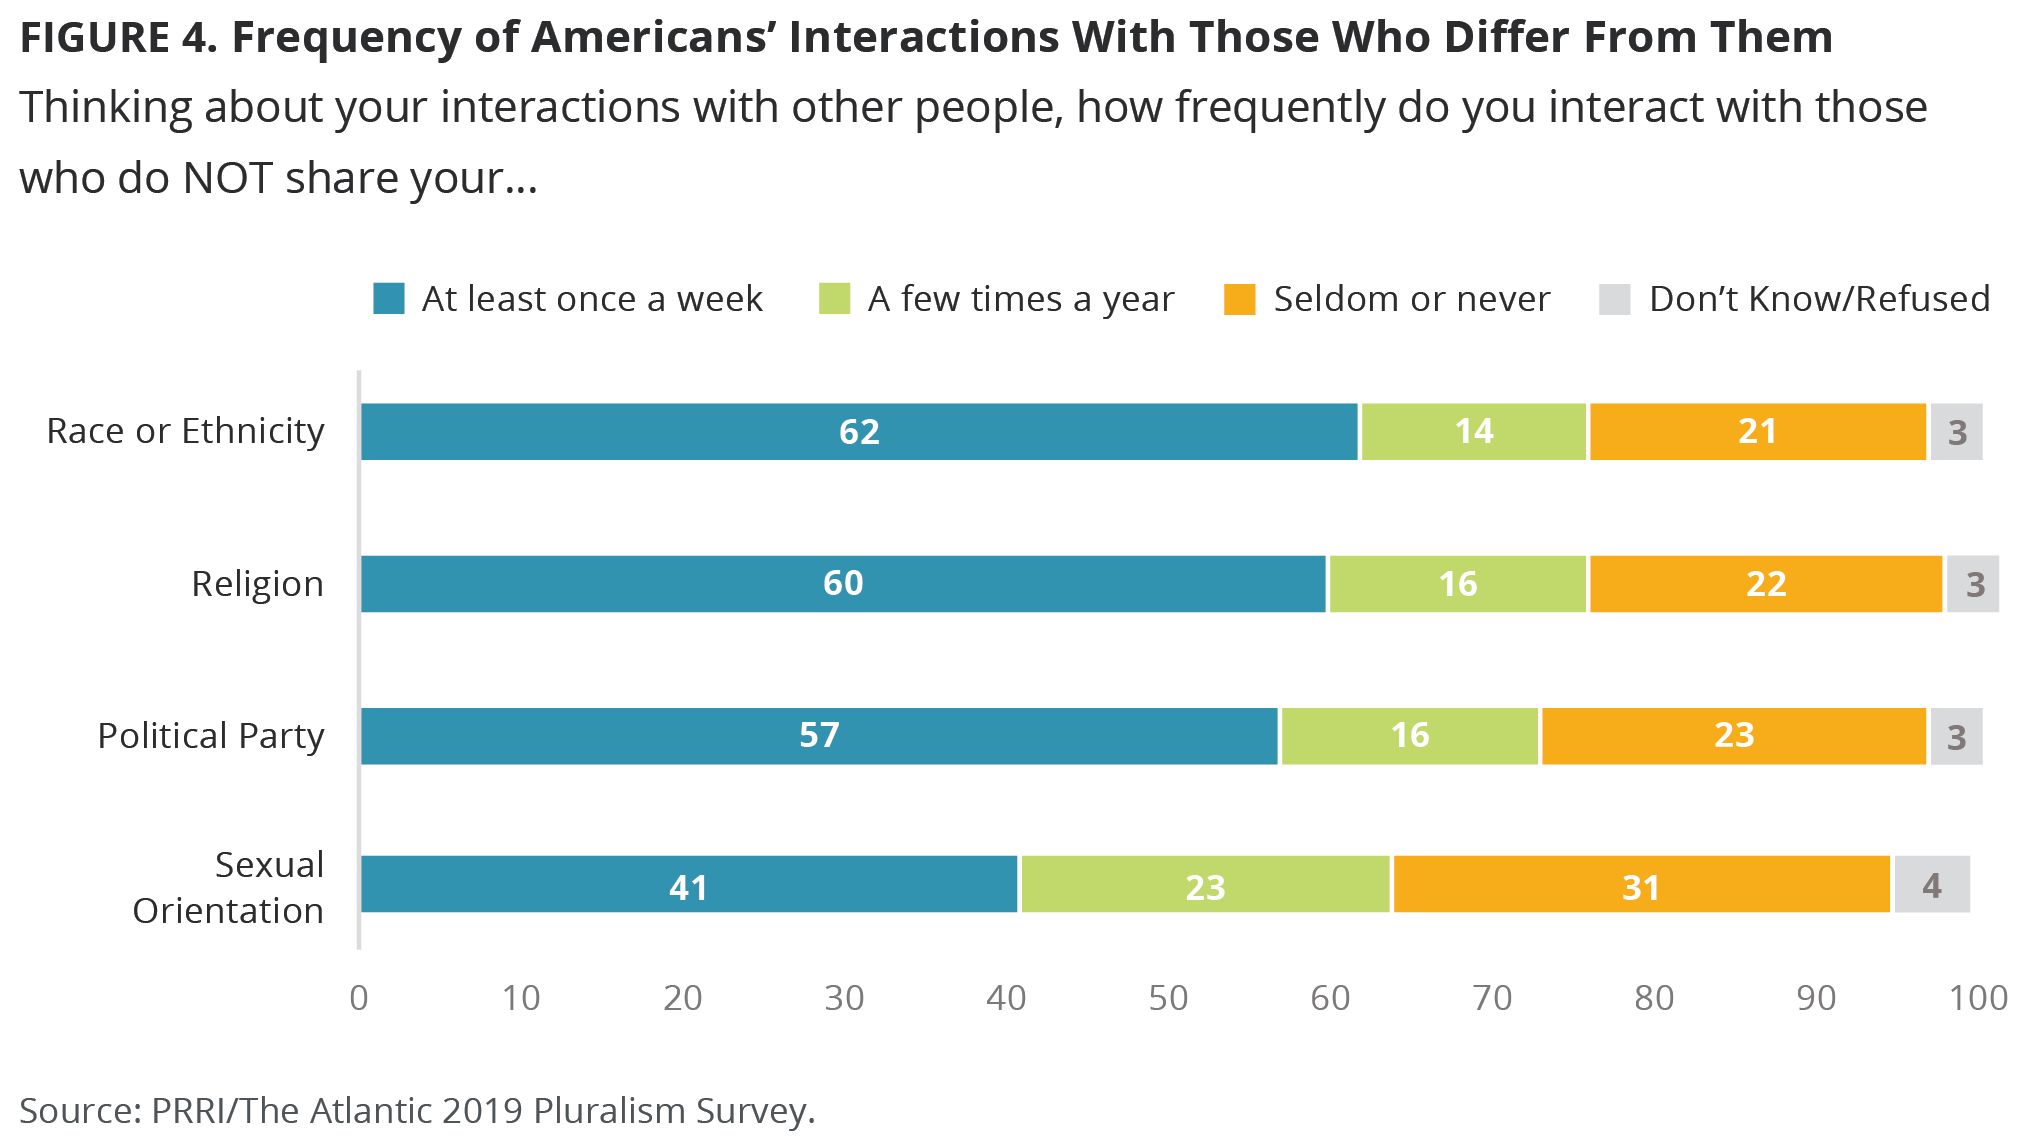
A substantial minority of Americans, however, report less frequent interactions with people who are different than they are. About one in five Americans say they seldom or never interact with someone who does not share their race or ethnicity (21%) or religion (22%), nearly one quarter (23%) say they seldom or never interact with someone who does not share their political party, and nearly one third (31%) say they seldom or never interact with someone who does not share their sexual orientation. Slightly smaller numbers of Americans fall between the two extremes, saying they interact with people who do not share their sexual orientation (23%), religion (16%), political party (16%), or race (14%) at least a few times a year.
There are noteworthy differences between various demographic groups in terms of the frequency with which they interact with people of different racial and ethnic backgrounds. Among racial groups, white (64%), black (63%), and Hispanic (60%) Americans are about equally likely to say they interact at least once a week with someone who does not share their race or ethnicity. However, higher proportions of Hispanic (25%) and white (21%) Americans than black Americans (14%) say they seldom or never interact with someone who does not share their race or ethnicity.
Among white Americans, whites with a college degree (78%) are substantially likelier than whites without a college degree (56%) to say they interact with someone who does not share their race or ethnicity at least once a week. Only 10% of whites with a college degree say they seldom or never interact with someone who does not share their race or ethnicity, compared to more than one-quarter (26%) of whites without a college degree.
Young Americans (ages 18-29) are somewhat more likely than seniors (ages 65 and older) to say they frequently interact with people who do not share their racial or ethnic background. More than six in ten (62%) young Americans say they interact at least once a week with someone who does not share their race or ethnicity, compared to only half (50%) of seniors. Fully 30% of seniors say they seldom or never interact with someone who does not share their race or ethnicity, compared to 19% of young Americans.
There are also divisions on this question by partisan affiliation. Seven in ten (70%) Democrats say they interact at least once a week with people who have a different racial or ethnic background, compared to 60% of Republicans and 57% of independents. More than one in five Republicans (21%), compared to 13% of Democrats, say they seldom or never interact with someone of a different race.
The frequency with which Americans interact with people who do not share their sexual orientation varies most substantially by age. Young Americans (49%) are nearly twice as likely as seniors (27%) to say they interact at least once a week with someone who does not share their sexual orientation. Religiously unaffiliated Americans (57%) are also likelier than white mainline Protestants (47%), Catholics (37%), nonwhite Protestants (35%), and white evangelical Protestants (32%) to say they interact at least once a week with someone who does not share their sexual orientation. Democrats (50%) and independents (42%) are also more likely than Republicans (28%) to say they interact with someone who has a different sexual orientation at least once a week.
Americans are, overall, relatively consistent in how frequently they report interacting with someone of a different political party. There are few substantial divisions by party affiliation or age on this question. However, white Americans (63%) are more likely than black (45%) or Hispanic (47%) Americans to say they interact with someone of a different political party at least once a week.
Across the board, there are also relatively few differences in how frequently Americans say they interact with people from different religious backgrounds. There are few substantial divisions among religious groups on this question. Young Americans (57%) are, however, more likely than seniors (47%) to say they interact at least once a week with someone who does not share their religion. White Americans (63%) are also slightly likelier than black (54%) and Hispanic (57%) Americans to say they interact at least once a week with someone of a different religious background.
Location of Interactions With Diversity
Among Americans who say they have at least some interactions with people of different backgrounds, these interactions are likelier, overall, to happen in the workplace and in friendship circles, rather than within families, in school settings, at religious services, or in local civic gatherings.[3]
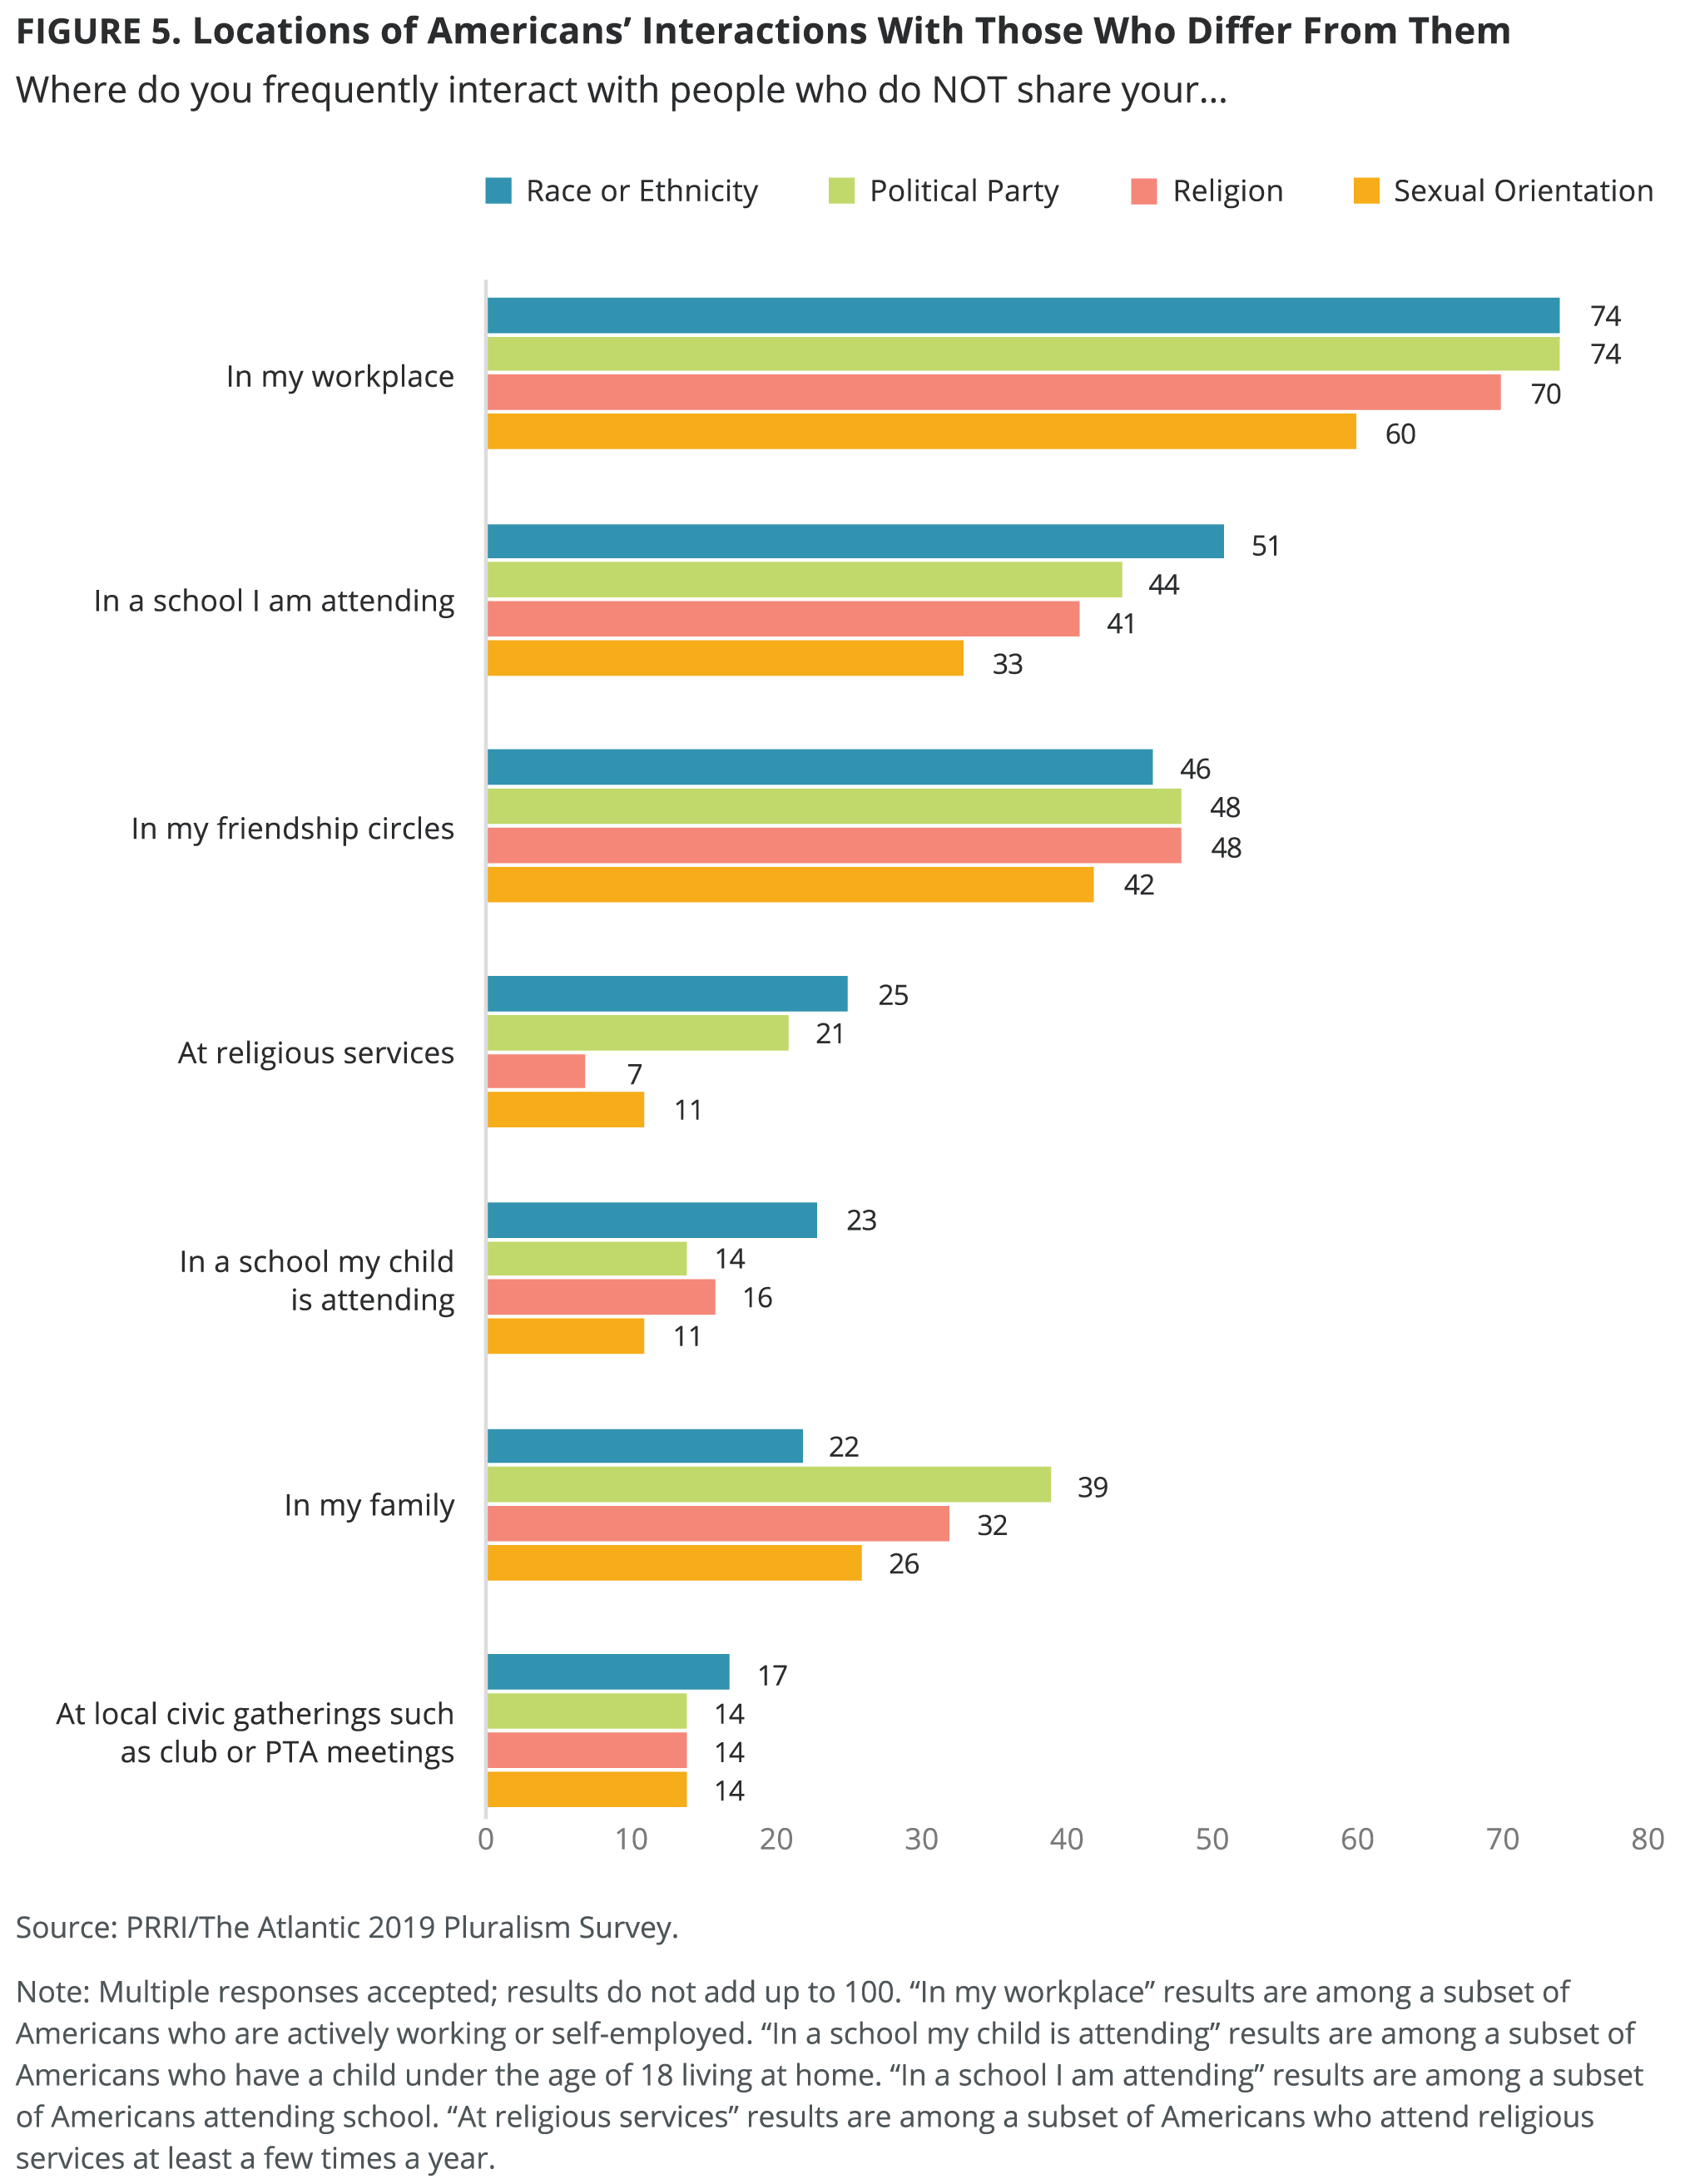
Nearly three-quarters (74%) of Americans who have at least some interactions with people of different racial and ethnic backgrounds say they have these interactions in the workplace[4], and 46% say they have them in friendship circles. Smaller numbers say they have these interactions at a school their child is attending (23%)[5], within their family (22%), at local civic gatherings such as club or PTA meetings (17%), at religious services (14%), or at a school they are attending (7%).
The setting where Americans say they interact with people of different racial and ethnic groups varies across several demographic groups, particularly when it comes to whether these interactions happen in family settings. More than one-third (34%) of Hispanic Americans who have some interactions with people of different races and ethnic backgrounds say these interactions happen in family settings, compared to 27% of black Americans and only 18% of white Americans. Among religious groups, nonwhite Protestants (30%), white mainline Protestants (26%), and Catholics (25%) are likelier than white evangelical Protestants (13%) to say they interact with people who do not share their race or ethnicity within their family. Seniors (55%) are also substantially more likely than young Americans (38%) to say they interact with people of different racial and ethnic backgrounds within their friendship circles.
Similarly, Americans who have at least some interactions with people who do not share their sexual orientation are likeliest to say these interactions occur in the workplace (60%) or in friendship circles (42%). Approximately one-quarter (26%) say these interactions happen within their family, while less than one in five say these interactions happen at local civic gatherings (14%), at a school their child is attending (11%), at religious services (7%), or at a school they are attending (5%). In general, the setting where Americans interact with people who do not share their sexual orientation does not vary substantially across demographic subgroups. One exception to this is among different religious traditions. Among religiously unaffiliated Americans who have at least some interactions with people who do not share their sexual orientation, over half (54%) say these interactions happen frequently within their friendship circles, compared to less than half of white mainline Protestants (43%), nonwhite Protestants (41%), Catholics (38%) and white evangelical Protestants (31%) who report the same.
Compared to other interactions with diversity, Americans are more likely to report interacting with people of different political parties or religious backgrounds within their family, although these interactions are still most common in the workplace or among friends. Nearly three-quarters of Americans who have some interactions with people of different political backgrounds say these interactions occur in the workplace (74%), while less than half say these interactions occur in friendship circles (48%) or within their family (39%). They are less likely to report interacting with people who have different political affiliations at a school their child is attending (15%), at civic gatherings (14%), religious services (12%), or at a school, they are attending (5%).
When asked where they interact with people who have different political affiliations, black and Hispanic Americans are less likely than white Americans to say these interactions happen in their family (22% and 34% vs. 44%) or their friendship circles (40% and 40% vs. 51%). Young Americans (38%) are also less likely than seniors (57%) to say that they interact with people of different political backgrounds in their friendship circles. There are, notably, no substantial divisions among partisans in terms of where their interactions with people who have different political affiliations occur.
Along the same lines, Americans who have at least some interactions with people of different religious backgrounds are likeliest to say these interactions happen in the workplace (70%), in friendship circles (48%), or in their family (32%). Interactions with people of different religious backgrounds are less likely to happen at a school their child (16%) is attending, in civic gatherings (14%), at religious services (5%), or at a school they are attending (5%).
There are a few noteworthy differences in where various groups interact with people who do not share their religious faith. Fully half (50%) of religiously unaffiliated Americans say they interact with people who do not share their religious affiliation within their family, compared to 32% of white mainline Protestants, 30% of Catholics, 26% of nonwhite Protestants, and 25% of white evangelical Protestants. Seniors (60%) are also much likelier than young Americans (37%) to say they have interactions within their friendship circles with people who do not share their religious affiliation.
Tenor of Interactions With Diversity
When asked about the tenor of their interactions with people of different backgrounds, Americans are generally likely to say these interactions are least somewhat positive, or neither positive nor negative. With the exception of political background, relatively few Americans characterize their interactions with people who are different than they are as negative.
For example, 59% of Americans say their interactions with people who do not share their race or ethnicity are somewhat or mostly positive, while 30% say these interactions are neither positive nor negative and only six percent say they are somewhat or mostly negative. Similarly, 55% of Americans say their interactions with people who do not share their sexual orientation are somewhat or mostly positive, while 33% say they are neither positive nor negative, and seven percent say they are somewhat or mostly negative. A majority (54%) of Americans also say their interactions with people who do not share their religious background are somewhat or mostly positive, while 35% say they are neither positive nor negative, and eight percent say they are somewhat or mostly negative.
Notably, Americans are more likely to view their interactions with people who do not share their political affiliation in a negative light. Only 40% of Americans say their interactions with people of a different political persuasion are mostly or somewhat positive, 36% say they are neither positive nor negative, and almost one in five (19%) say these interactions are somewhat or mostly negative. Notably, there are no significant differences between partisans on this question.
There are relatively few divisions among demographic subgroups in how they characterize the tenor of people who do not share their political affiliation or religion. White evangelical Protestants are the only religious group with less than a majority (47%) reporting that their interactions with people of different sexual orientation are positive. Majorities of Catholics (55%), nonwhite Protestants (55%), white mainline Protestants (59%), and the religiously unaffiliated (66%) all report that their interactions with people who do not share their sexual orientation are positive.
There are also significant differences in experiences among racial subgroups. Nonwhite Americans are more likely than white Americans to say they have negative interactions with people who do not share their race or ethnicity. More than one in ten black (12%) and Hispanic (11%) Americans report that their interactions with people of different races are at least somewhat negative, compared to only four percent of white Americans. There are also notable divisions among white Americans in terms of how positively they view their interactions with people who do not share their race or ethnicity: more than three-quarters (77%) of whites with a college degree say their interactions with people of different racial and ethnic backgrounds are positive, compared to 58% of whites without a college degree.
Concerns About a Son or Daughter Marrying Someone From a Different Background
When asked about a more personal form of interaction – having a son or daughter marrying someone who is a different racial or religious background, a different political affiliation, the same gender, or who identifies as transgender– there is a striking amount of variation in Americans’ levels of comfort. Overall, Americans tend to have neutral or happy feelings about the prospect of their child marrying someone of a different race, religious group, or various political backgrounds. However, members of demographic subgroups differ significantly in the intensity of feelings of happiness or unhappiness.
Overall, Americans are more likely to say they would be happy (32%) than unhappy (13%) if their son or daughter married someone of a different race or ethnicity, but a majority (52%) say they feel neutral. Similarly, a majority (56%) of Americans report neutral feelings about the prospect of their child marrying someone from a different religious background, while 25% say they would be happy with this situation, and 16% say they would be unhappy.
Americans are slightly more likely to say they would be happy with the idea of their child marrying someone who identifies as a Democrat, rather than a Republican, but there are few differences overall. Similar numbers of Americans say they would be somewhat or very happy if their child married a supporter of the Democratic Party (37%) or the Republican Party (32%), while the same number (45%) say they would be neither happy nor unhappy if their child married a Republican or Democratic supporter, and roughly similar numbers say they would be somewhat or very unhappy if their child married a Democrat (14%) or a Republican (21%).
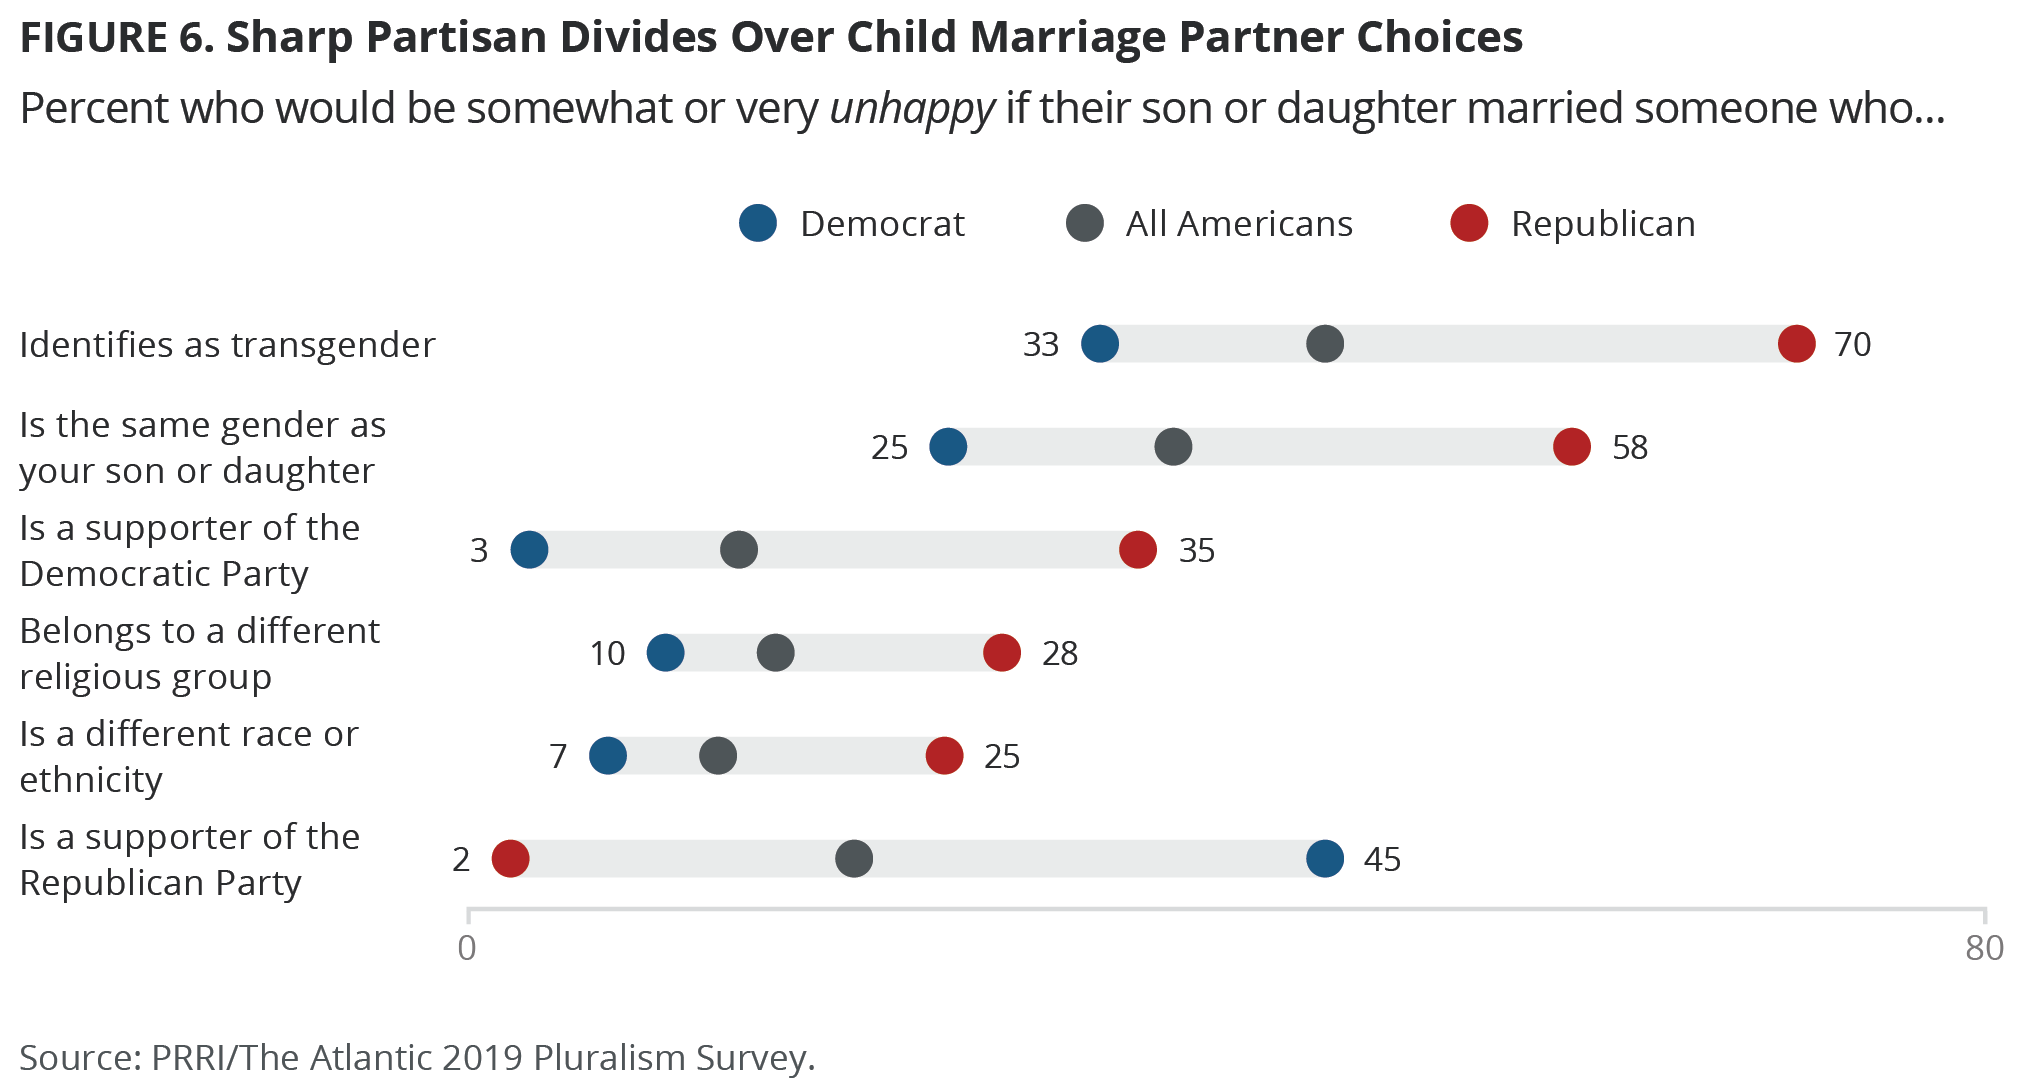
However, Americans are substantially likelier to report negative feelings about their child marrying someone of the same gender or someone who is transgender. Almost one-quarter (24%) of Americans say they would be very or somewhat happy if their child married someone of the same gender, while 36% say they would be neither happy nor unhappy. Notably, more than one-third (37%) of Americans say they would be somewhat or very unhappy if their son or daughter married someone of the same gender. And while 18% of Americans say they would be very or somewhat happy if their child married someone who identifies as transgender, 34% say they would be neither happy nor unhappy, and a plurality (45%) say they would be very or somewhat unhappy.
There are noteworthy political divisions in Americans’ feelings about the prospect of their son or daughter marrying a person of another race. Republicans are roughly three times as likely as Independents or Democrats to say they would be somewhat or very unhappy if their child married someone who is a different race or ethnicity (25% vs. 9% and 7%). Seniors (ages 65 and older) are also roughly twice as likely as young Americans (ages 18-29) to say they would be unhappy with the prospect of their child marrying someone of a different race (21% vs. 11%). Among religious groups, white evangelical Protestants (19%) are likeliest to say they would be unhappy if their child married someone of a different race, compared to 13% of white mainline Protestants, 12% of Catholics, ten percent of religiously unaffiliated Americans, and eight percent of nonwhite Protestants.
Republicans (28%) are also nearly three times as likely as independents (12%) and Democrats (10%) to say they would be unhappy if their child married someone of a different religious background. White evangelical Protestants also stand out among religious groups among this question: by a significant margin, they are likeliest (34%) to say they would be unhappy if their child married someone of a different religious background, compared to 18% of nonwhite Protestants, 11% of Catholics, seven percent of white mainline Protestants, and seven percent of religiously unaffiliated Americans.
When faced with the prospect of their child marrying someone who identifies with the opposite political party, Democrats are likelier than Republicans to say they would be unhappy. A plurality (45%) of Democrats say they would be unhappy if their child married a Republican, while 35% of Republicans say they would be unhappy if their child married a Democrat. This is a stark difference from 1960 when fewer than one in ten Republicans (4%) or Democrats (4%) said they would be displeased if their son or daughter married someone of the opposite party.[6]
Once again, white evangelical Protestants stand out on this question: nearly three in ten (29%) say they would be unhappy if their son or daughter married a Democrat, compared to 14% of Catholics, 13% of white mainline Protestants, and 10% each of religiously unaffiliated Americans and nonwhite Protestants. Religiously unaffiliated Americans, meanwhile, are disproportionately likely to say they would be unhappy if their child married a Republican: one-third (33%) say they would be somewhat or very unhappy in this situation, compared to 23% of nonwhite Protestants, 20% of Catholics, 17% of white mainline Protestants, and five percent of white evangelical Protestants.
Perhaps the most significant divisions among demographic subgroups, however, are over the prospect of a child marrying someone of the same gender or someone who is transgender. There are substantial divides on these two questions by political affiliation, religion, and age, with Republicans, white evangelical Protestants, and seniors expressing the strongest feelings of unhappiness.
Nearly six in ten (58%) Republicans report that they would be at least somewhat unhappy if their son or daughter married someone of the same gender, compared to 32% of independents and 25% of Democrats. Similarly, two-thirds (66%) of white evangelical Protestants, compared to 43% of nonwhite Protestants, 34% of Catholics, 29% of white mainline Protestants, and 22% of religiously unaffiliated Americans, say they would be unhappy if their child married someone of the same gender. Nearly half (49%) of seniors say they would be unhappy if their child married someone of the same gender, compared to about one-third (34%) of young Americans.
The same pattern holds when respondents are asked how they feel about their child marrying someone who is transgender. Republicans (70%) are substantially more likely than independents (39%) or Democrats (33%) to say they would be unhappy if their child married someone who is transgender. Meanwhile, three-quarters (75%) of white evangelical Protestants say they would be unhappy if their child married someone who is transgender, compared to less than half of nonwhite Protestants (46%), Catholics (41%), white mainline Protestants (41%), and religiously unaffiliated Americans (31%).
Support for Pluralism as a Desired Goal
Preferences for Religious Diversity
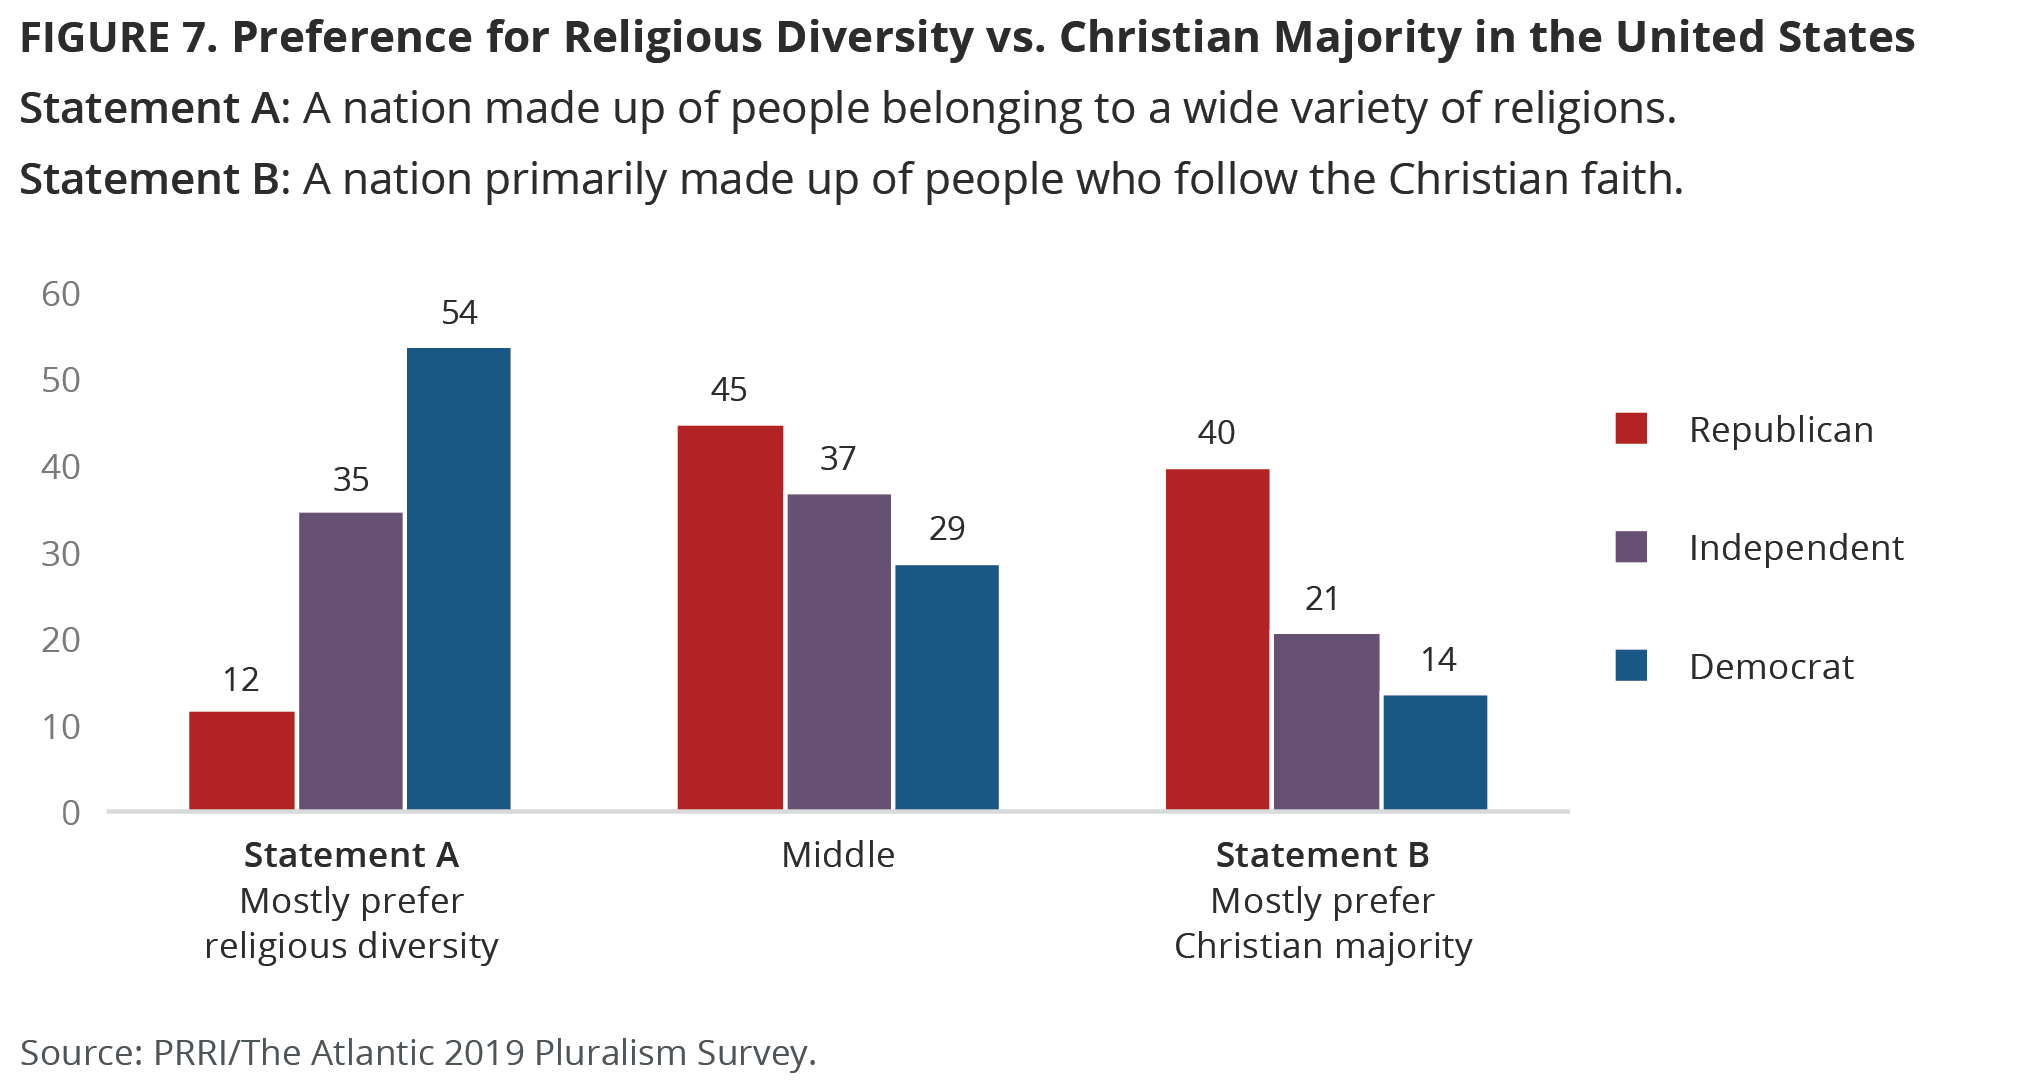
When asked to put themselves on a scale, where one end is the statement, “I would prefer the U.S. to be made up of people belonging to a wide variety of religions,” and the other end is the statement, “I would prefer the U.S. to be a nation primarily made up of people who follow the Christian faith,” Americans are likelier to prefer religious diversity, although a significant number are divided. About one-third (34%) mostly agree with the first statement, while approximately one-quarter (24%) mostly agree with the second statement and 37% position themselves in the middle of the scale.[7]
There are striking political divisions on this issue. Over half (54%) of Democrats, compared to only one in ten (12%) Republicans, mostly prefer religious diversity. By contrast, four in ten (40%) Republicans state a preference for a Christian majority, compared to only 14% of Democrats. A plurality (45%) of Republicans and nearly one in three (29%) Democrats place themselves in the middle of this scale. Independents closely resemble Americans in general on this question.
There are surprisingly few divisions among young Americans (ages 18-29) and seniors (ages 65 and older) on the value of religious diversity, although seniors are slightly more likely than young Americans to place a premium on a country made up primarily of Christians. Approximately three in ten young Americans (31%) and seniors (30%) mostly agree with the first statement, while 22% of young Americans and 30% of seniors mostly agree with the second statement. About four in ten young Americans (39%) and seniors (37%) fall in the middle.
However, religious groups are extremely divided on the value of religious pluralism. Religiously unaffiliated Americans (66%) are far more likely than any religious group, including Catholics (36%), white mainline Protestants (35%), nonwhite Protestants (17%), and white evangelical Protestants (8%), to mostly agree with the first statement. White evangelical Protestants, meanwhile, stand out among religious groups because of their support for a primarily Christian country. Six in ten (60%) white evangelical Protestants mostly agree with the second statement, compared to 35% of nonwhite Protestants, 22% of white mainline Protestants, 17% of Catholics, and five percent of religiously unaffiliated Americans. A plurality of nonwhite Protestants (46%), Catholics (44%), and white mainline Protestants (41%) position themselves in the middle of the two statements.
Preferences for Racial and Ethnic Diversity
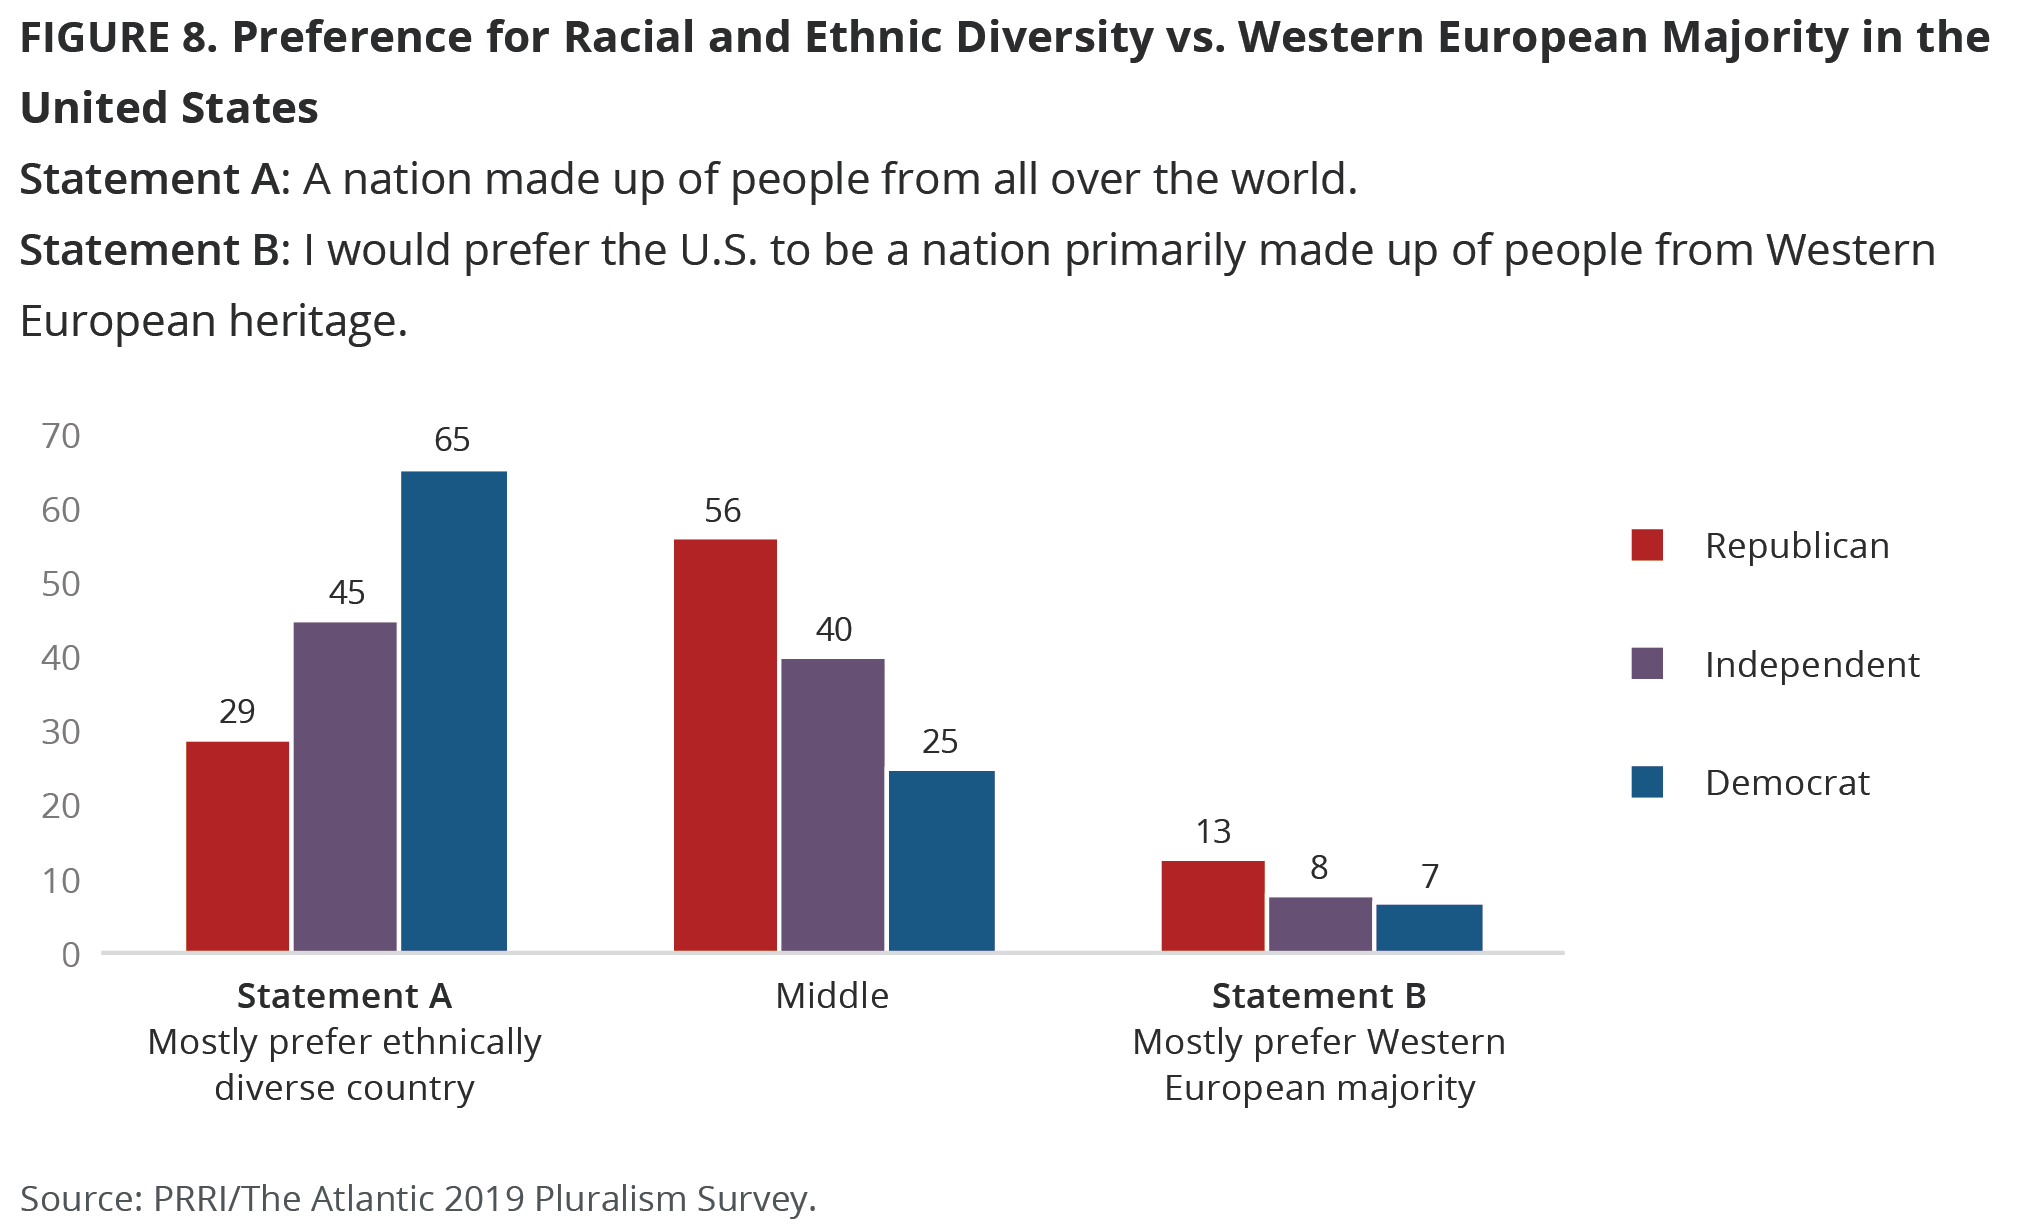
Overall, nearly half of Americans generally support a racially and ethnically diverse vision of the United States, although there are moderate divisions by race. When asked to put themselves on a scale, where one end is the statement, “I would prefer the U.S. to be a nation made up of people from all over the world,” and the other end is the statement, “I would prefer the U.S. to be a nation primarily made up of people from Western European heritage,” 47% of Americans mostly agree with the first statement, while less than one in ten (9%) Americans mostly agree with the second statement, and 39% place themselves in the middle of the scale.
There are also stark political divisions on this issue. Nearly two-thirds (65%) of Democrats, compared to only three in ten (29%) Republicans, mostly prefer a country with racial and ethnic diversity. Republicans are nearly twice as likely as Democrats to state a preference for a Western European majority in the country (13% vs. 7%). Additionally, over half (56%) of Republicans place themselves somewhere in the middle on this issue, compared to one-quarter (25%) of Democrats. Independents closely resemble Americans in general on this question.
There are notable divisions by race on this question. Majorities of black (52%) and Hispanic (51%) Americans mostly agree with the first statement, compared to slightly fewer white Americans (44%). Roughly similar numbers of Hispanic (11%), white (9%), and black (6%) Americans agree with the second statement, while 42% of white Americans, 36% of black Americans, and 32% of Hispanic Americans are divided.
Perceptions of Diversity as a Strength for the Country
Overall, a majority (62%) of Americans agree that the country’s diverse population, with people of many different races, ethnicities, religions, and backgrounds, makes the country stronger. About one-quarter (23%) say this diversity makes the country neither stronger nor weaker, and only 13% say it makes the country weaker.
There are moderate divisions on this question by race. Hispanic Americans are likelier than members of other racial and ethnic groups to agree that the U.S.’s diversity makes the country stronger. Approximately seven in ten (71%) Hispanic Americans agree with this statement, compared to 59% of white Americans and 57% of black Americans.
Among political groups, Democrats are likeliest to say that the U.S.’s diversity makes the country stronger. More than three-quarters (77%) of Democrats say that the country’s diverse population makes it stronger, while only 55% of independents and 51% of Republicans agree. Notably, one in five (20%) Republicans say that the U.S.’s diverse population makes it weaker.
Traits Tied to Being “Truly American”
When asked how important certain characteristics or beliefs are to being “truly American,” Americans overwhelmingly agree that a few characteristics are fundamental to being American, but are more divided on others. The vast majority of Americans agree that believing in individual freedoms, such as freedom of speech (91%), respecting American political institutions and laws (90%), accepting people of diverse racial and religious backgrounds (86%), and being able to speak English (83%) are somewhat or very important to being American.
Americans are more divided on other characteristics. A majority (56%) of Americans agree that believing that capitalism is the best economic system is somewhat or very important for being truly American, while 38% say this is not too important or not at all important. A slim majority (52%) of Americans agree that believing in God is somewhat or very important for being American. However, only 39% say that being a Christian is somewhat or very important for being truly American, while a majority (56%) say it is not too important or not at all important.
Half (50%) of Americans say that being born in America is somewhat or very important for being truly American, while 46% say this is not too important or not at all important. However, Americans decisively reject the notion that Western heritage is fundamental to a truly American identity: only 17% say that being of Western heritage is somewhat or very important for being American, while most (78%) agree that this is not very important or not at all important.
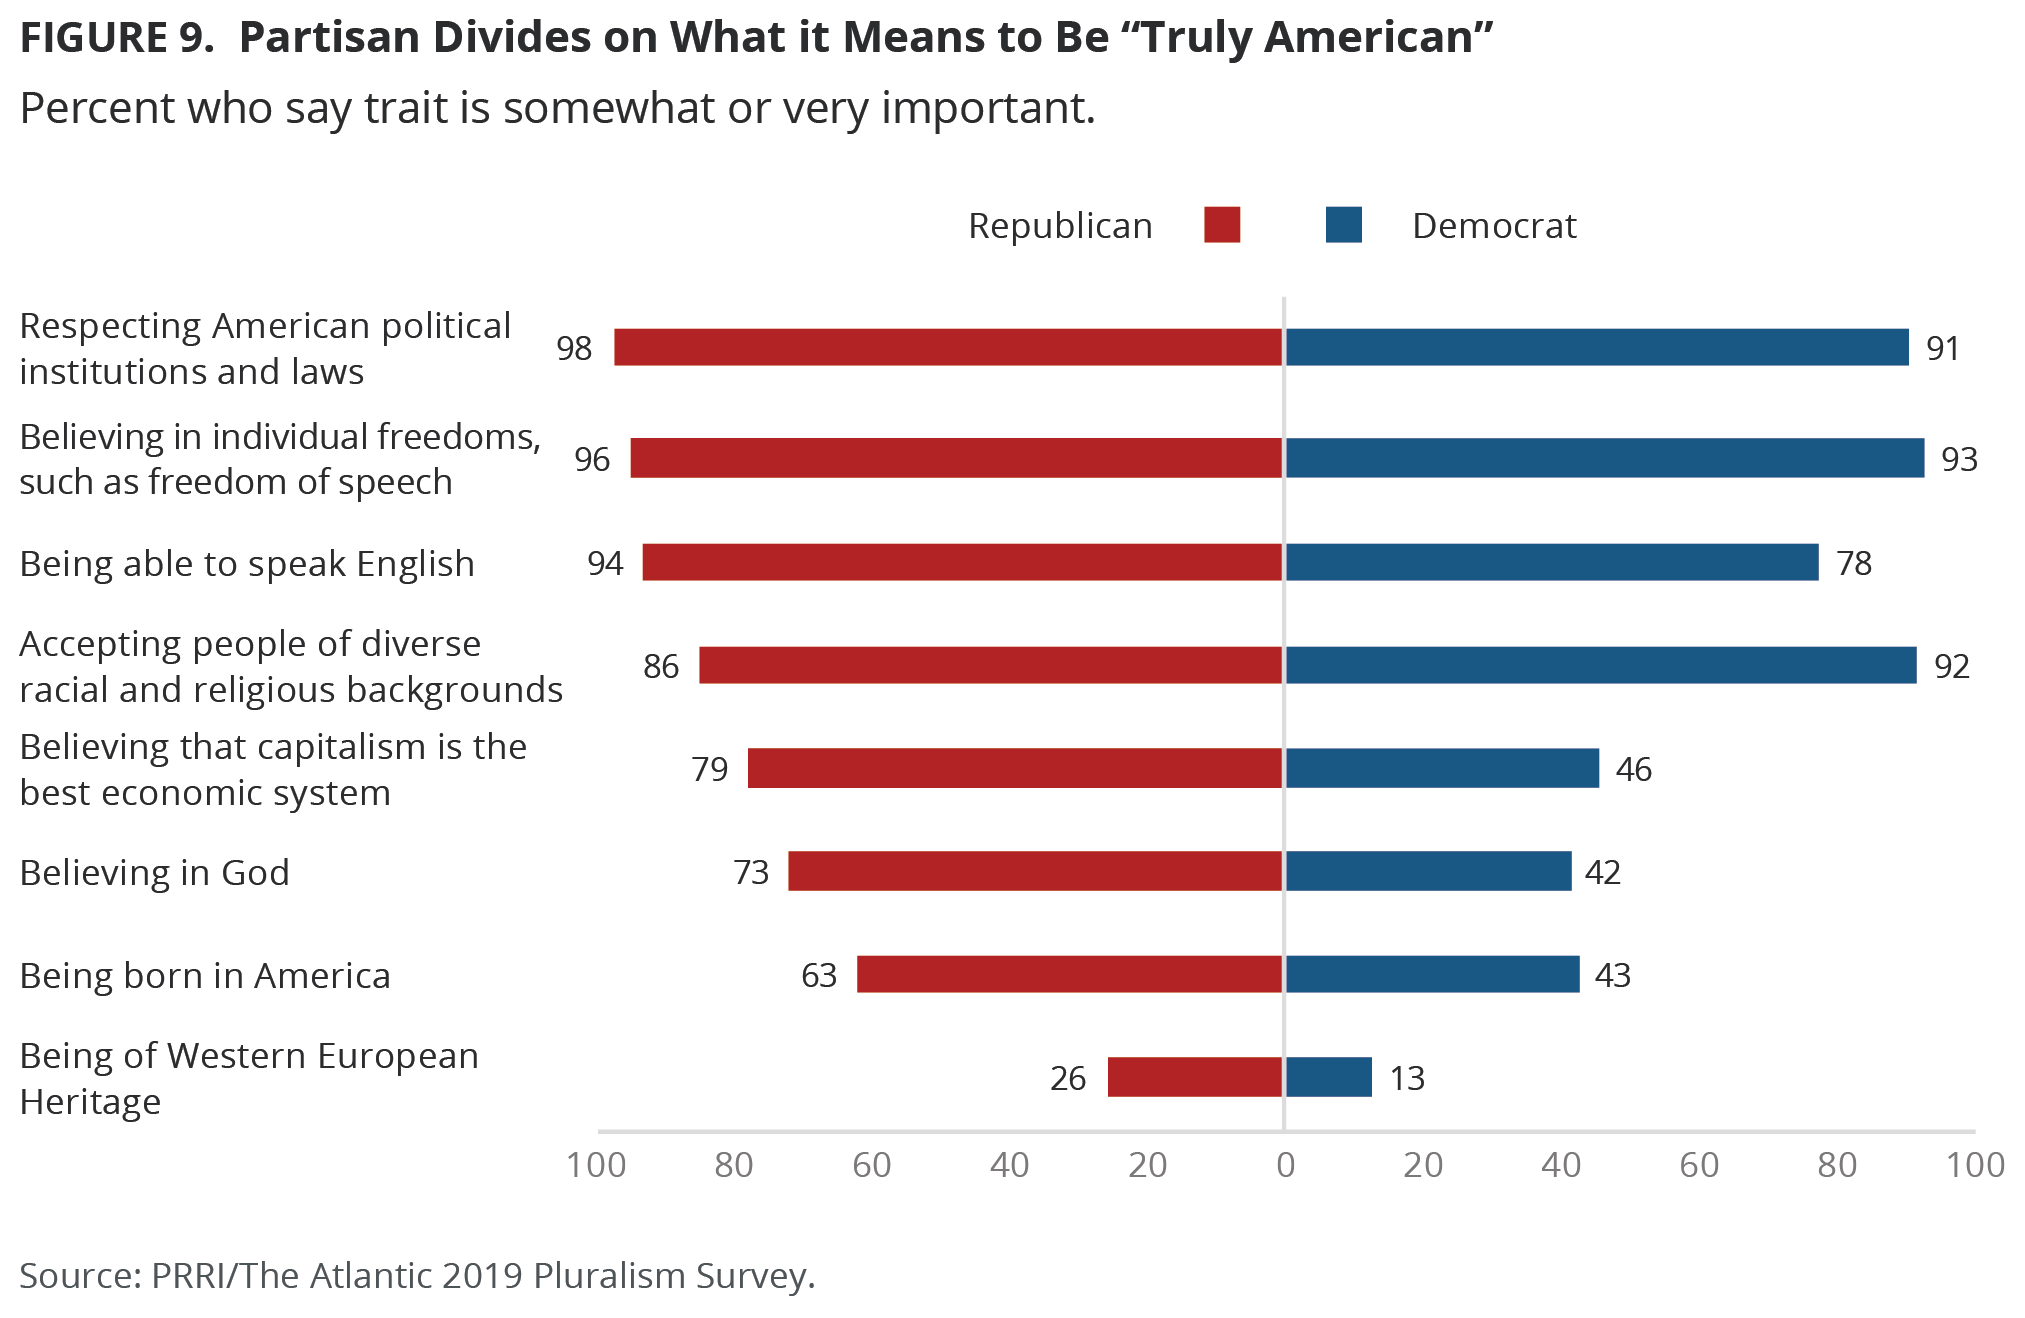
There are three traits that Americans across the political spectrum agree are fundamental to a truly American identity. Overwhelming majorities of Republicans, independents, and Democrats agree that respecting American political institutions and laws (98%, 85%, 91%, respectively), believing in individual freedoms such as freedom of speech (96%, 88%, 93%, respectively), and accepting people of diverse racial and religious backgrounds (86%, 82%, 92%, respectively), are somewhat or very important for being truly American.
However, there are significant divisions among partisans in terms of the relative weight given to other qualities. After the three traits identified above, Republicans are most likely to say that believing capitalism is the best economic system (79%) and believing in God (73%) are somewhat or very important for being truly American. By contrast, Democrats are most likely to say that being able to speak English (78%) is somewhat or very important for being truly American. Democrats’ are much less likely to say that any other trait is somewhat or very important for being truly American; less than half say that believing capitalism is the best economic system (46%), believing in God (42%), or being born in America (43%) are somewhat or very important for being American.
Division and Solidarity in the Country
Race, Politics, and Religion: How Divided are Americans?
The vast majority (83%) of Americans agree that the country is somewhat or very divided by race and ethnicity. There are few overall divisions on this question by race and socioeconomic class, but Hispanic Americans (92%) are somewhat more likely than black (82%) and white (83%) Americans to agree with this statement. There are also notable differences in intensity. For example, while half (50%) of black Americans and 41% of Hispanic Americans believe that the country is very divided over race and ethnicity, less than one-third (31%) of white Americans agree.
Americans are nearly unanimous in their belief that the country is divided over politics (91%), with 74% of Americans saying that the country is very divided. Supporters of both political parties, as well as political independents, all agree that Americans are divided over politics: Republicans (96%), Democrats (91%), and independents (89%) all agree with this statement. However, Republicans and Democrats are slightly more likely than independents to say that the country is very divided over politics (79%, 77%, and 69%, respectively).
About three-quarters (77%) of the general public agrees that Americans are divided over religion. There are no substantial divisions among religious groups on this question.
Race, Religion, and Politics: Can Americans Come Together to Address Problems?
Overall, most Americans are optimistic about the country’s ability to come together across racial divides. Two-thirds (66%) of Americans say they feel optimistic that people who belong to different racial and ethnic groups can still come together and solve the country’s problems, while 30% say they feel pessimistic that Americans can do this now. Strikingly, there are few differences across racial and ethnic groups on this question: strong majorities of white (69%), Hispanic (64%), and black (61%) Americans all say they feel optimistic about the prospect of Americans of different races and ethnicities coming together to solve the country’s problems.
Americans are similarly confident about the ability of people who belong to different religious groups to come together to solve the country’s problems. Two-thirds (66%) of Americans say they feel optimistic that this can still happen, while 30% say they feel pessimistic. Notably, religious Americans are more likely than nonreligious Americans to say they feel optimistic about religious groups’ ability to come together and solve problems: approximately seven in ten Catholics (73%), white mainline Protestants (72%), white evangelical Protestants (71%), and nonwhite Protestants (67%) feel optimistic about this, compared to 58% of religiously unaffiliated Americans. Notably, young adults (ages 18 to 29) are less optimistic than seniors (age 65 and older) that Americans can come together across religious lines to solve problems (58% vs. 72%).
Americans are substantially more pessimistic about the country’s ability to heal its political divisions. Nearly six in ten (59%) Americans say they feel pessimistic about whether Americans who hold different political views can come together and solve the country’s problems, while 38% feel optimistic that this can still happen. Americans across the political spectrum are united in their skepticism that Americans who hold different political beliefs can still work together to solve important problems: 63% of Republicans, 58% of Democrats, and 57% of independents report feeling pessimistic about whether Americans can still do this.
Are Institutions Pushing Us Apart or Pulling Us Together?
Overall, Americans believe that a wide range of institutions, including public schools, community organizations and nonprofits, and the military, are doing more to pull the country together than to pull it apart. However, there are several institutions – specifically, the media and political parties – that Americans believe are doing more to push the country apart.
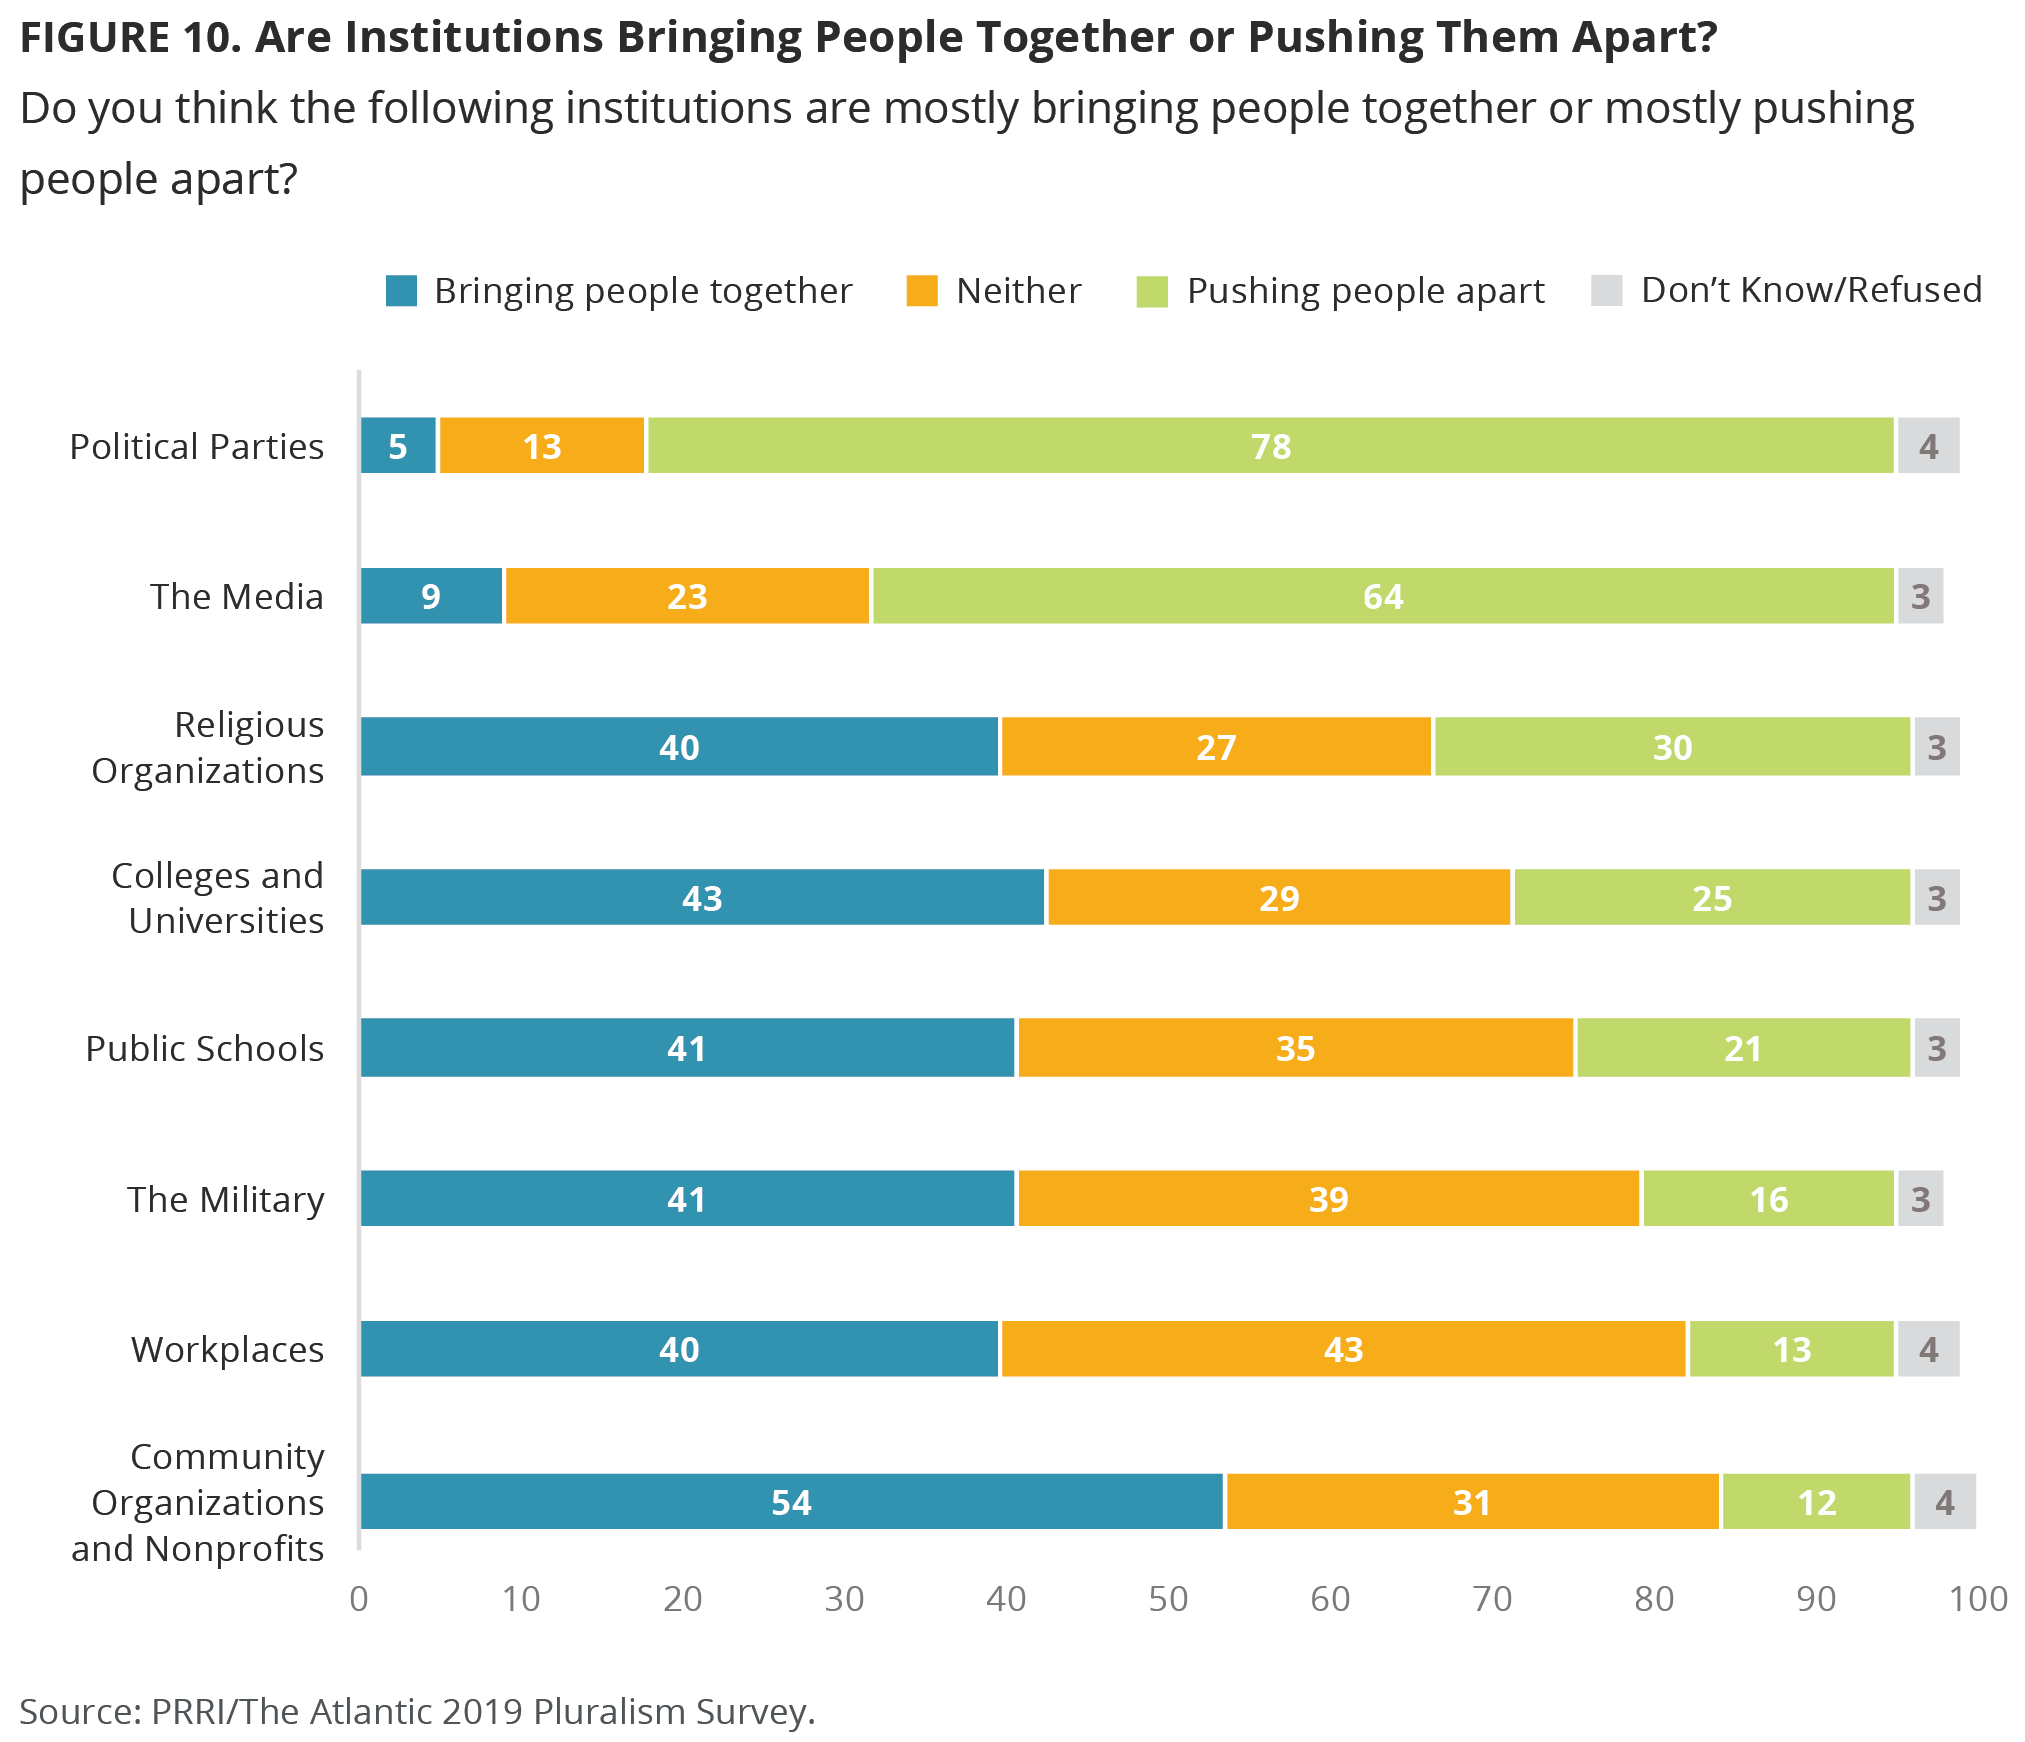
When asked if particular institutions are doing more to push Americans apart or pull them together, more Americans than not agree that community organizations and nonprofits (54%), colleges and universities (43%), public schools (41%), the military (41%), and workplaces (40%) are doing more to bring people together than pull them apart. However, majorities of Americans agree that political parties (78%) and the media (64%) are doing more to push people apart than bring people together.
There are substantial divisions on the role of these institutions by political party, with Republicans expressing more skepticism than Democrats about several institutions, including public schools, the media, and colleges and universities. A majority of Democrats (57%) agree that public schools are bringing Americans together, while only 37% of independents and 27% of Republicans hold a similar view. Similar numbers of Republicans believe that public schools are pushing people apart (35%) or doing neither (36%). Similarly, nearly six in ten (58%) of Democrats believe that colleges and universities are bringing people together, compared to 40% of independents and 28% of Republicans. Nearly half (49%) of Republicans agree that colleges and universities are pushing people apart. And although majorities of all political groups say that the media is pushing people apart, there are sizable differences in intensity: 85% of Republicans believe that the media is pushing people apart, compared to 60% of independents and 54% of Democrats.
Democrats, by contrast, are more skeptical about the positive role of the military and religious institutions in bringing people together. A majority (53%) of Republicans say that the military is mostly bringing people together, while only 39% of Democrats and 34% of independents agree. Similarly, a majority (55%) of Republicans – compared to 37% of Democrats and 32% of independents – believe that religious institutions are mostly bringing people together. Democrats (37%) and independents (32%) are equally likely to say that religious institutions are pushing people apart.
Overall, there are fewer divisions between age groups over the role of various institutions. However, young Americans (ages 18-29) are likelier than seniors (ages 65 and older) to say that colleges and universities are bringing people together (49% vs. 31%). By contrast, seniors (53%) are more likely than young Americans (30%) to agree that the military is mostly bringing people together. Only seven percent of seniors believe that the military is mostly pushing people apart, compared to 24% of young Americans.
Racial differences are most pronounced when it comes to perceptions of the media and political parties. Almost three-quarters (73%) of white Americans agree that the media is mostly pushing people apart, compared to less than half of Hispanic (49%) and black (45%) Americans. Nonwhite Americans’ negative views of the political parties are also less strong than white Americans’ perspectives. The vast majority (83%) of white Americans believe that political parties are mostly pushing people apart, while about three-quarters (73%) of Hispanic Americans and 62% of black Americans hold the same view.
How Divided are Americans on Specific Issues?
Although Americans are divided on a wide range of political and policy issues, there are still a number of issues where there is widespread agreement about the best course forward.
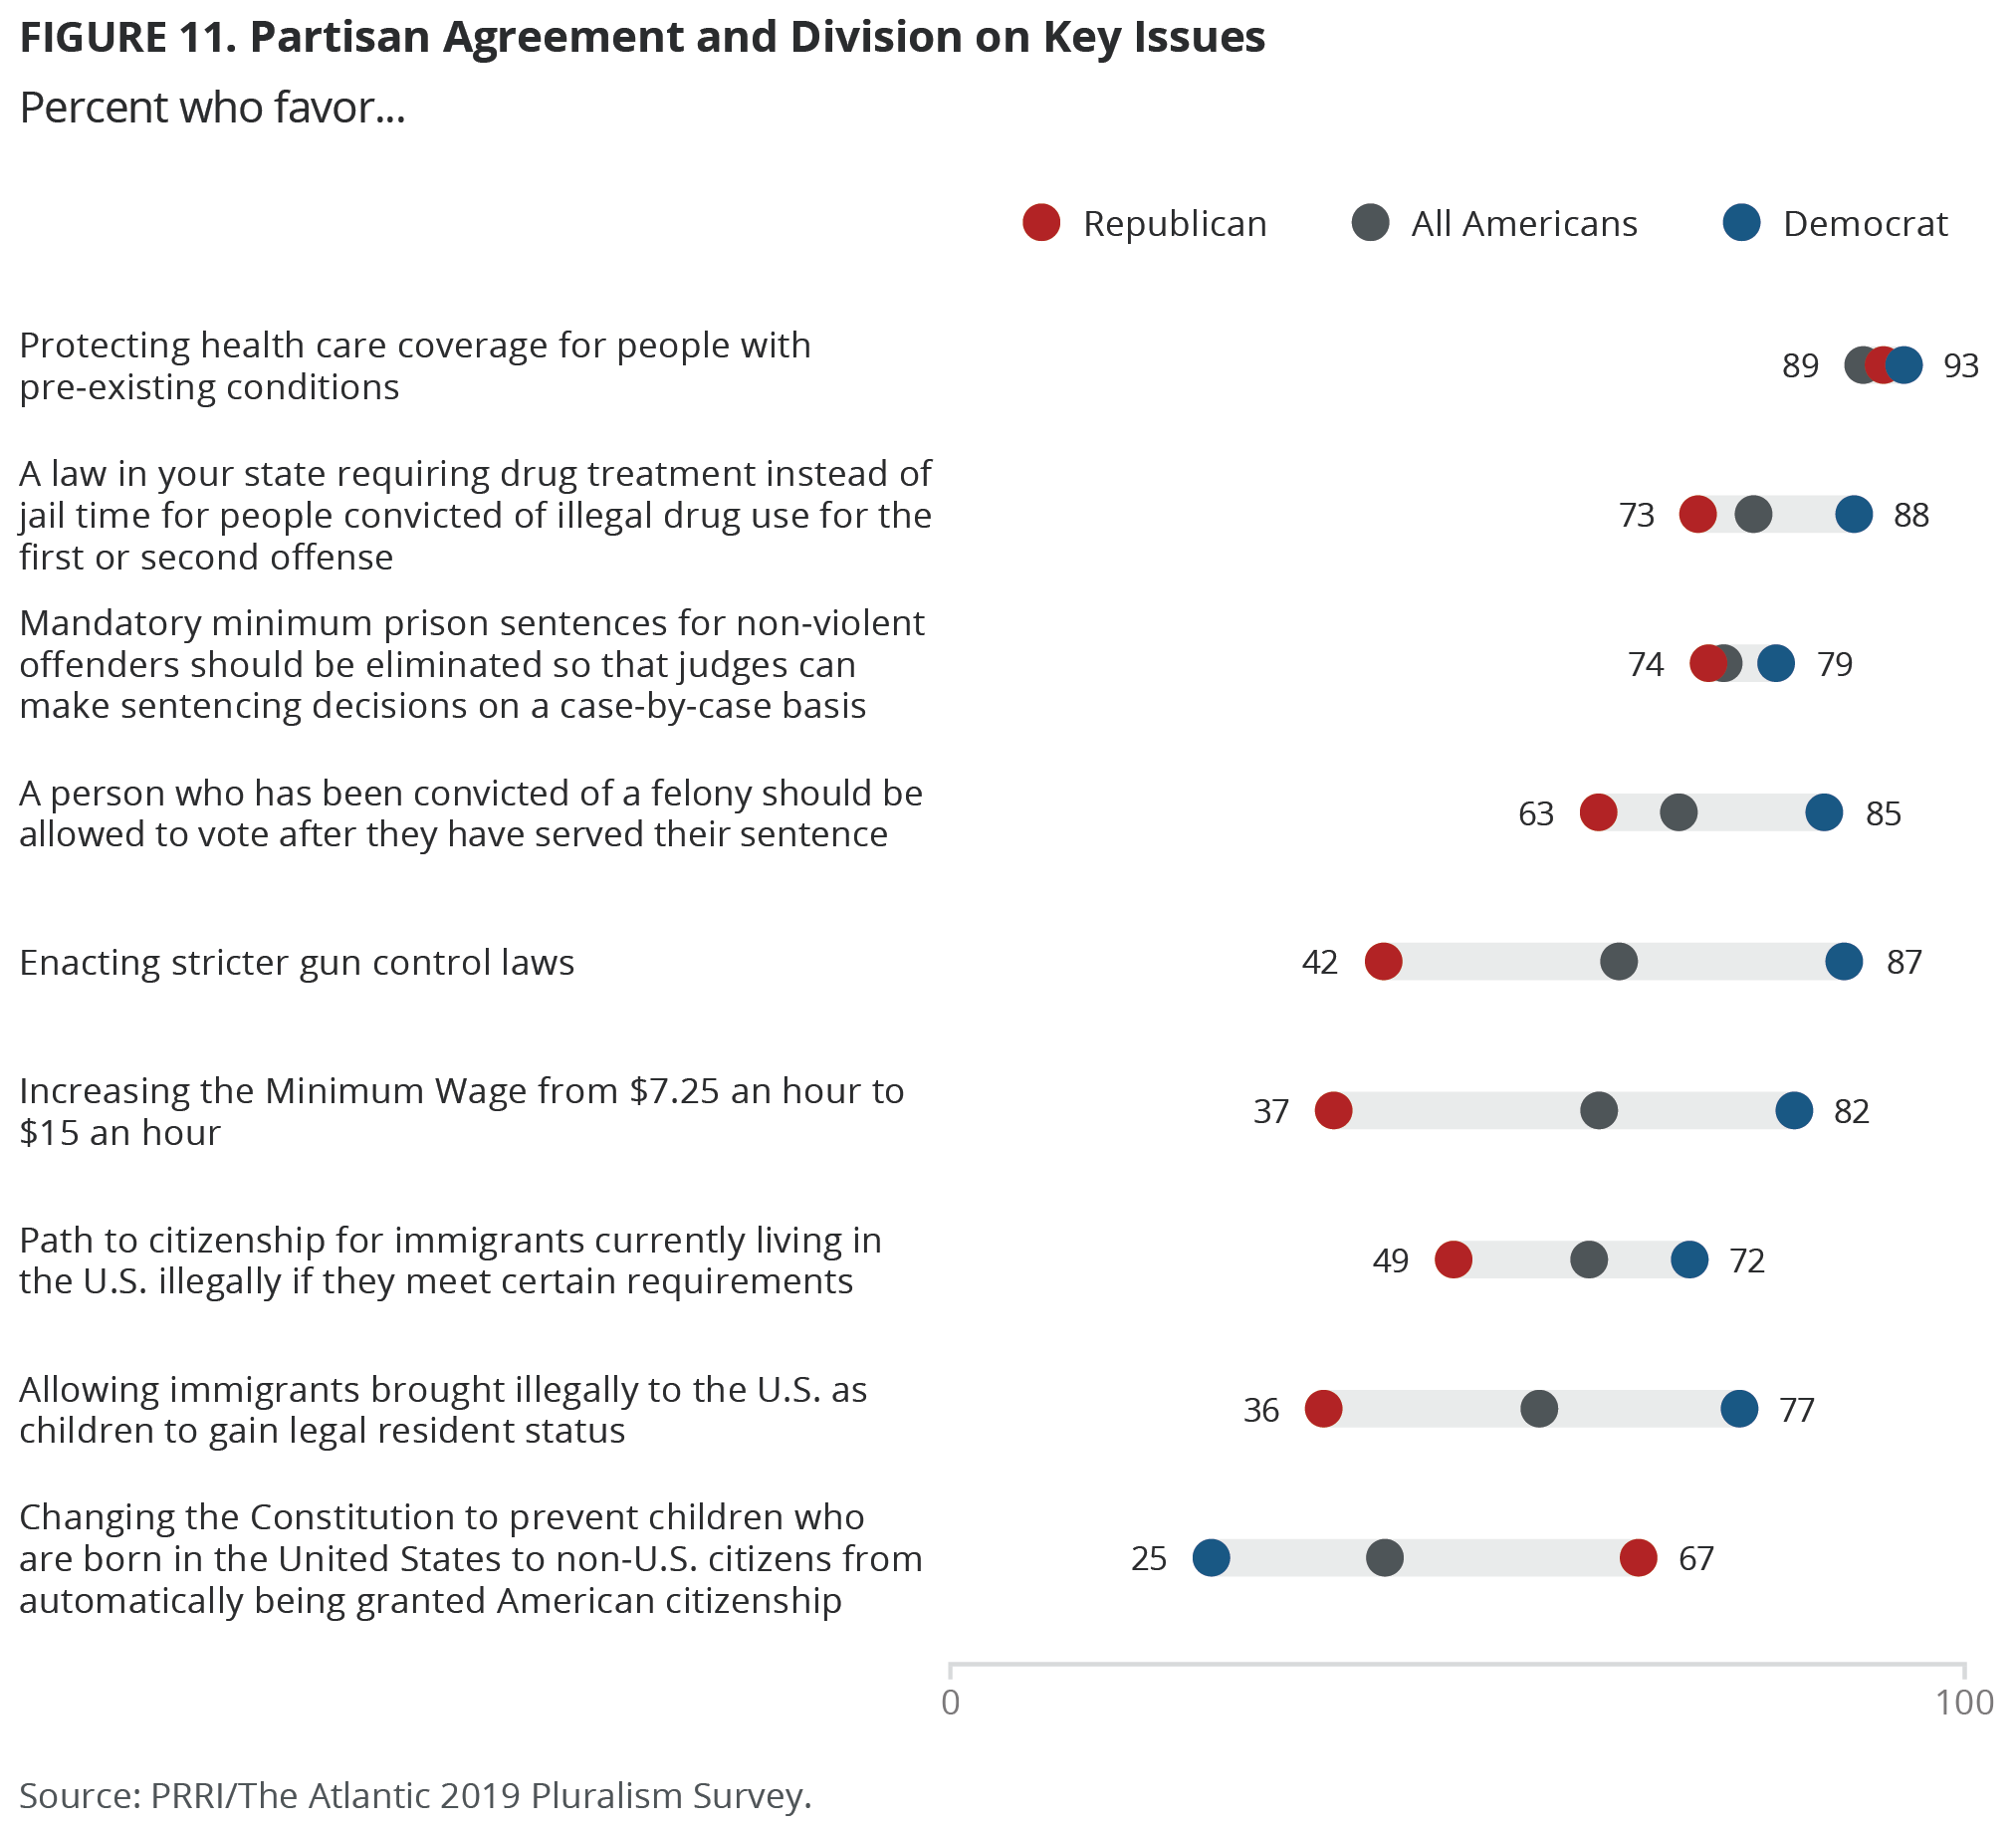
Areas of Agreement: Criminal Justice Reform and Health Care Coverage
Notably, Americans of different political stripes all generally support less punitive criminal justice measures. More than three-quarters (78%) of Americans support a law in their state requiring drug treatment instead of jail time for people convicted of illegal drug use for the first or second offense, including 88% of Democrats, 75% of independents, and 73% of Republicans. Similarly, three-quarters (75%) of Americans support eliminating mandatory minimum prison sentences so that judges can make sentencing decisions on a case-by-case basis, including 79% of Democrats, 74% of Republicans, and 71% of independents. Seven in ten (71%) Americans also favor allowing a person who has been convicted of a felony to vote after he or she has completed his or her sentence, including 85% of Democrats, 66% of independents, and 63% of Republicans.
Americans are also united in their support for health care coverage protections for people with preexisting conditions. Nearly nine in ten (89%) Americans, including 93% of Democrats, 91% of Republicans, and 85% of independents, favor such protections.
Areas of Disagreement: Immigration, Minimum Wage, and Gun Control
However, certain issues – including questions related to immigration, the minimum wage, and gun control – remain politically divisive.
A majority (62%) of Americans agree that the immigration system should allow immigrants who are currently in the country illegally to become citizens provided they meet certain requirements. Smaller numbers of Americans believe that instead, immigrants who are in the country illegally should be allowed to become permanent legal residents, but not citizens (16%), or that these immigrants should be identified and deported (18%). Although a plurality (49%) of Republicans support a path to citizenship for immigrants who are currently in the country illegally and 15% believe they should be allowed to have permanent legal resident status, more than one-third (35%) believe these immigrants should be identified and deported, a view that is at odds with independents and Democrats. Nearly three-quarters (72%) of Democrats and 61% of independents agree that a path to citizenship should be available to immigrants who are currently in the country illegally. And 18% of independents and 17% of Democrats believe they should be allowed to become permanent legal residents. Only 17% of independents and seven percent of Democrats believe these immigrants should be identified and deported.
Democrats and independents are also much likelier than Republicans to support allowing immigrants brought to the U.S. illegally as children to gain legal resident status. A majority (57%) of Americans overall support this policy, including 77% of Democrats and 56% of independents. In contrast, only 36% of Republicans support this policy, while 61% are opposed.
On the question of birthright citizenship, a majority (54%) of the general public oppose changing the Constitution to prevent the children of non-citizens from automatically being given American citizenship. However, there are deep divides by party affiliation. Seven in ten (70%) Democrats and a majority (56%) of independents oppose such a change, compared to only 32% of Republicans; two-thirds (67%) of Republicans favor abolishing birthright citizenship.
There are also political divisions on whether the minimum wage should be raised. Over six in ten (63%) Americans support raising the minimum wage from $7.25 per hour to $15.00 per hour, including 82% of Democrats and 64% of independents. Only 37% of Republicans agree, however, and 61% oppose this minimum wage hike.
Republicans are opposed to enacting stricter gun control laws, while independents and Democrats are generally in favor. Approximately two-thirds (66%) of Americans overall support stricter gun control laws, including 87% of Democrats, 65% of independents, and 42% of Republicans. A majority (57%) of Republicans, by contrast, oppose stricter gun control laws.
Spotlight on the Great Lakes States
The 2018 Election
Views of President Trump
Like Americans as a whole, residents of states in the Great Lakes region have an unfavorable view of the president overall.[8] Less than four in ten (37%) Great Lakes residents have a favorable view of the president, while more than six in ten (60%) view the president unfavorably. Similarly, 36% of Americans overall have a favorable view of the president, and 59% have an unfavorable view.
However, there are some notable distinctions between Americans overall and residents of various Great Lakes states. In Ohio, for example, opinions about Trump are somewhat rosier than among the national population. Nearly half (47%) of Ohio residents have a favorable view of Trump, while 51% have an unfavorable view. By contrast, Illinois residents are less likely to have a positive perspective on the president: only 28% have a favorable view of Trump, while 68% have an unfavorable view. Other Great Lakes states track more closely with Trump’s overall favorability numbers.
Problems Voting in the 2018 Midterm Election
Compared to Americans nationally, Great Lakes residents are generally about equally likely to say they have encountered a range of problems when they last tried to vote. However, there is one voting-related issue where residents of Great Lakes states differ from the general population. Great Lakes residents (87%) are likelier than Americans overall (82%) to say that they did not find the ballot confusing when they last tried to vote. Among the states, Wisconsin (90%) and Minnesota (93%) residents are likeliest to say that they did not find the ballot confusing.
Experiences with Diversity
Frequency of Interactions With Diversity
When asked how often they interact with people who are a different race or ethnicity, sexual orientation, or religion, Great Lakes residents do not differ significantly from the general population overall. However, the residents of Great Lakes states (65%) are significantly more likely than the general population (57%) to say that they interact with people who do not share their political party at least once a week.
Residents of specific Great Lakes states also stand out from the general population for how frequently they interact with people who do not share their race or ethnicity, political party, and religion. Illinois residents (61%) are more likely than Americans overall (52%) to say they interact with people of a different race or ethnicity more than once a week. By contrast, Wisconsin residents (43%) are less likely than Americans overall (52%) to say they interact with someone who does not share their race or ethnicity more than once a week.
Ohio (59%) and Minnesota (57%) residents are also more likely than Americans overall (48%) to say they interact with someone who does not share their political party more than once a week. Illinois residents (58%), meanwhile, are more likely than Americans overall (50%) to say they interact with someone who does not share their religion more than once a week.
Location of Interactions With Diversity
Residents of Great Lakes states do not differ substantially from Americans overall in terms of where they interact with people who do not share their race or ethnicity, sexual orientation, political party, or religion, although they do report somewhat more diverse interactions within their own families. Great Lakes residents (46%) are slightly more likely than Americans overall (39%) to say they interact with people from a different political party within their family. Similarly, Great Lakes residents (38%) are also more likely than Americans overall (32%) to say they interact with people who do not share their religion within their family.
On several questions, there are also noteworthy differences between Great Lakes states. Ohio (39%) and Minnesota (39%) residents are less likely than Michigan residents (48%) to say they interact with people who do not share their race or ethnicity within their friendship circles. Michigan (17%), Minnesota (17%), and Wisconsin (16%) residents are also likelier than Ohio residents (10%) to say they interact with people of a different racial or ethnic background at religious services. Illinois residents (13%), meanwhile, are likelier than Michigan residents (7%) to say they interact with people who do not share their race or ethnicity via a school their child is attending.
When it comes to interactions with people of a different political party and religion, there are also some distinctions between states. Minnesota residents (17%) are likelier than Illinois (11%), Wisconsin (10%), and Ohio (9%) residents to say they interact with people who do not share their political party at religious services. Ohio residents, meanwhile, stand out as the least likely to say they interact with people who do not share their religion in their friendship circles. Forty-one percent of Ohioans report these interactions, compared to 48% of Illinois residents, 50% of Minnesota and Michigan residents, and 55% of Wisconsin residents.
Concerns About a Son or Daughter Marrying Someone From a Different Background
Residents of Great Lakes states do not differ substantially from Americans overall when asked how they would feel if their son or daughter married someone of a different race, ethnicity, or religious group; someone of the same gender; someone who identifies as transgender; or someone who identifies with the Democratic or Republican Party. However, Wisconsin residents (33%) are more likely than Americans overall (23%) to say they would be very happy if their son or daughter married someone of a different race or ethnicity.
There are also noteworthy variations between some Great Lakes residents on the question of how they would feel if their son or daughter married a supporter of the Republican Party. About four in ten (41%) Ohio residents say they would be somewhat or very happy if this happened, compared to 30% of Minnesota and Michigan residents and 23% of Illinois residents.
Support for Pluralism as a Desired Goal
Great Lakes residents don’t differ substantially from Americans overall on most questions related to diversity and support for pluralism. However, Illinois residents (69%) are likelier than Americans as a whole (62%) to say that the U.S.’s diverse population makes the country stronger.
Division and Solidarity in the Country
Great Lakes residents (70%) are more likely than Americans overall (64%) to believe that the media is pushing people apart, with Wisconsin (76%) and Ohio (75%) residents particularly likely to believe that this is true.
However, residents of Great Lakes states (58%) are also likelier than the general public (54%) to agree that community organizations and nonprofits are bringing people together. And Michigan residents (74%) are likelier than Americans overall (66%) to say they feel optimistic that Americans who belong to different religious groups can still come together and solve the country’s problems.
There are also a few differences between some residents of Great Lakes states on the effect various institutions are having on the country as a whole. Illinois (47%) and Minnesota (46%) residents are likelier than Ohio residents (38%) to say that public schools are mostly bringing people together. Illinois residents (64%) are also less likely than Wisconsin (76%) and Ohio (75%) residents to agree that the media is mostly pushing people apart.
How Divided are Americans on Specific Issues?
In general, residents of Great Lakes states have similar attitudes to the general population on various policy issues, although they are more likely than Americans overall to support certain policies. For example, residents of Great Lakes states (59%) are likelier than Americans overall (54%) to oppose changing the Constitution to prevent children who are born in the U.S. to non-citizens from automatically being granted U.S. citizenship. Great Lakes residents (93%) are also somewhat more likely than Americans overall (89%) to say they support protecting health care coverage for people with preexisting conditions, with Illinois residents especially likely to strongly favor protections for people with preexisting conditions compared to the general public (69% vs. 61%).
There are also some noteworthy differences between the states. Great Lakes residents (79%) do not differ from the general population in their support for a law in their state requiring drug treatment rather than jail time for people convicted of drug use for their first or second offense. However, Ohio residents (66%) are less likely than Americans overall (78%) to support such a law, while Michigan residents are more supportive (86%).
Although Great Lakes residents’ perspective on raising the minimum wage from $7.25 per hour to $15 per hour is not substantially different from the opinions of Americans overall, Ohio residents (54%) are less likely than the general public (63%) to favor this minimum wage hike.
While there is solid majority support for enacting stricter gun control laws across all Great Lakes residents, there is a significant difference in levels of support between the attitudes of residents of Illinois and Ohio. More than seven in ten (71%) Illinois residents favor enacting stricter gun control laws, compared to only six in ten (60%) Ohio residents
Similar to the general population, more than six in ten (65%) residents of all Great Lakes state favor a policy that would allow immigrants who are living in the country illegally to become citizens. However, more than one-quarter (26%) of Ohio residents say these immigrants should be identified and deported, compared to only 19% of Michigan residents, 17% of Minnesota residents, and 14% of Illinois residents. About one in five (18%) Americans overall support this approach.
Survey Methodology
 The PRRI/The Atlantic 2018 Pluralism Survey was conducted by PRRI in partnership with The Atlantic among a random sample of adults (age 18 and up) living in the United States and who are part of Ipsos’s Knowledge Panel. The survey included a national sample (N=1,073) representing all 50 states. The survey also over-sampled those living in Ohio (338), Illinois (356), Michigan (354), Wisconsin (338), and Minnesota (360). Interviews were conducted online in both English and Spanish between December 17 and 23, 2018. The survey was made possible by generous grants from The Joyce Foundation, The Kresge Foundation, and McKnight Foundation.
Respondents are recruited to the KnowledgePanel using an addressed-based sampling methodology from the Delivery Sequence File of the USPS a database with full coverage of all delivery addresses in the U.S. As such, it covers all households regardless of their phone status, providing a representative online sample. Unlike opt-in panels, households are not permitted to “self-select” into the panel; and are generally limited to how many surveys they can take within a given time period.
The initial sample drawn from the KnowledgePanel was adjusted using pre-stratification weights so that it approximates the adult U.S. population defined by the latest March supplement of the Current Population Survey. Next, a probability proportional to size (PPS) sampling scheme was used to select a representative sample. Once assigned to the survey, panel participants received additional email notification reminders on December 19 and December 23 to complete the survey.
To reduce the effects of any non-response bias, a post-stratification adjustment was applied based on demographic distributions from the most recent American Community Survey (ACS). The post-stratification weight rebalanced the sample based on the following benchmarks: age, race and ethnicity, gender, Census division, metro area, education, and income. The sample weighting was accomplished using an iterative proportional fitting (IFP) process that simultaneously balances the distributions of all variables. Weights were trimmed to prevent individual interviews from having too much influence on the final results. In addition to an overall national weight, separate weights were computed for each state to ensure that the demographic characteristics of the sample closely approximate the demographic characteristics of the target populations. The state-level post-stratification weights rebalanced the sample based on the following benchmarks: age, race and ethnicity, gender, education, and income.
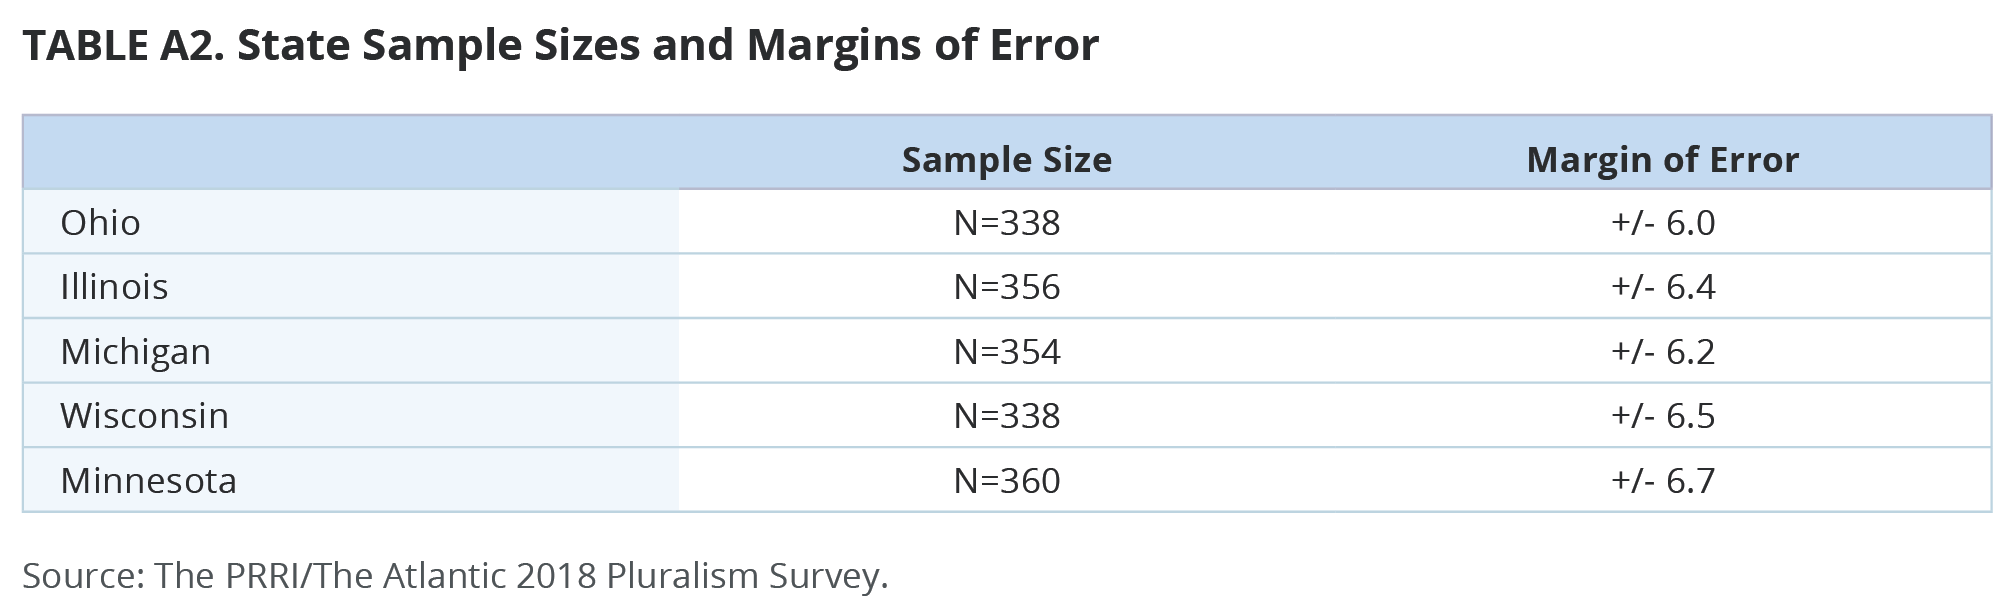
The margin of error for the national survey is +/- 3.3 percentage points at the 95% level of confidence. The design effect for the survey is 1.2. Table 1 includes margin of error information for the state samples. In addition to sampling error, surveys may also be subject to error or bias due to question wording, context, and order effects.
Endnotes
[1] PRRI 2016 American Values Survey.
[2] Analysis in this section is limited to a subset of respondents who report that they voted in the 2018 midterm elections.
[3] Throughout this section, responses are screened on those who report having at least some interactions with people of different backgrounds. The subset of black American respondents who fit this definition is less than 100 cases (N=94) and should be interpreted with caution. Also, note that multiple responses were accepted for locations of interactions with diversity, so totals may add up to more than 100.
[4] “In my workplace” results are among a subset of Americans who are actively working or self-employed.
[5] “In a school my child is attending” results are among a subset of Americans who have a child under the age of 18 living at home.
[6] Source: Almond and Verba 1960 Civic Culture Survey.
[7] For the purposes of analysis, positions 1-3 on the scale are categorized as “mostly agree with the first statement,” positions 8-10 on the scale are characterized as “mostly agree with the second statement,” and positions 4-7 on the scale are categorized as in the middle.
[8] For the purpose of this analysis, the “Great Lakes region” includes the following five state: Illinois, Michigan, Minnesota, Ohio, and Wisconsin.
Recommended citation:
Robert P. Jones and Maxine Najle. “American Democracy in Crisis: The Fate of Pluralism in a Divided Nation.” PRRI (February 22, 2019). https://www.prri.org/research/american-democracy-in-crisis-the-fate-of-pluralism-in-a-divided-nation/.


