To view a PDF of slides presented during PRRI’s April 29, 2025, webinar on this report, please click here. For a replay of the PRRI webinar via YouTube, please click here.
Executive Summary
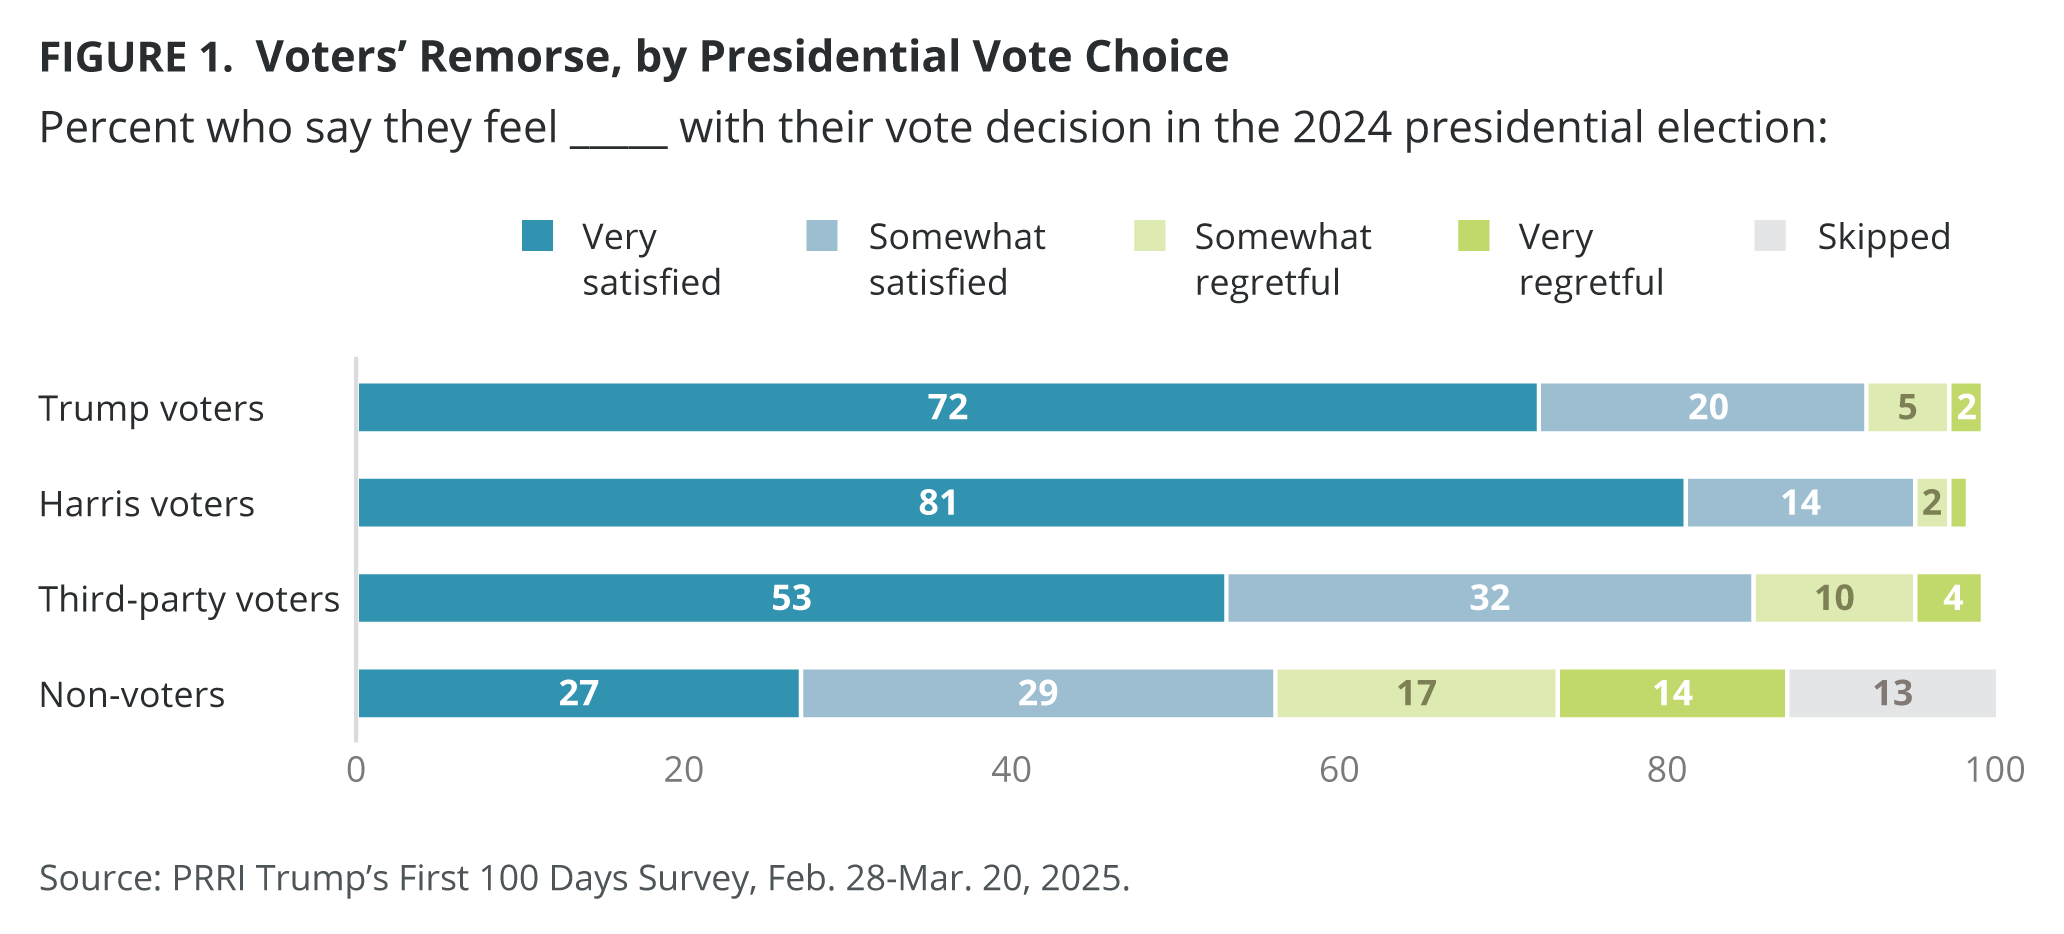
Relatively few voters regret their decision in November; however, three in ten non-voters regret not turning out to vote last fall.
- Nearly all Americans who voted for Kamala Harris (95%) and Donald Trump (92%) are satisfied with their decision to vote or how they voted, as well as 85% of those who voted for another candidate.
- Thirty-one percent of non-voting Americans say they regret their decision not to vote, compared with 56% who say they are satisfied.
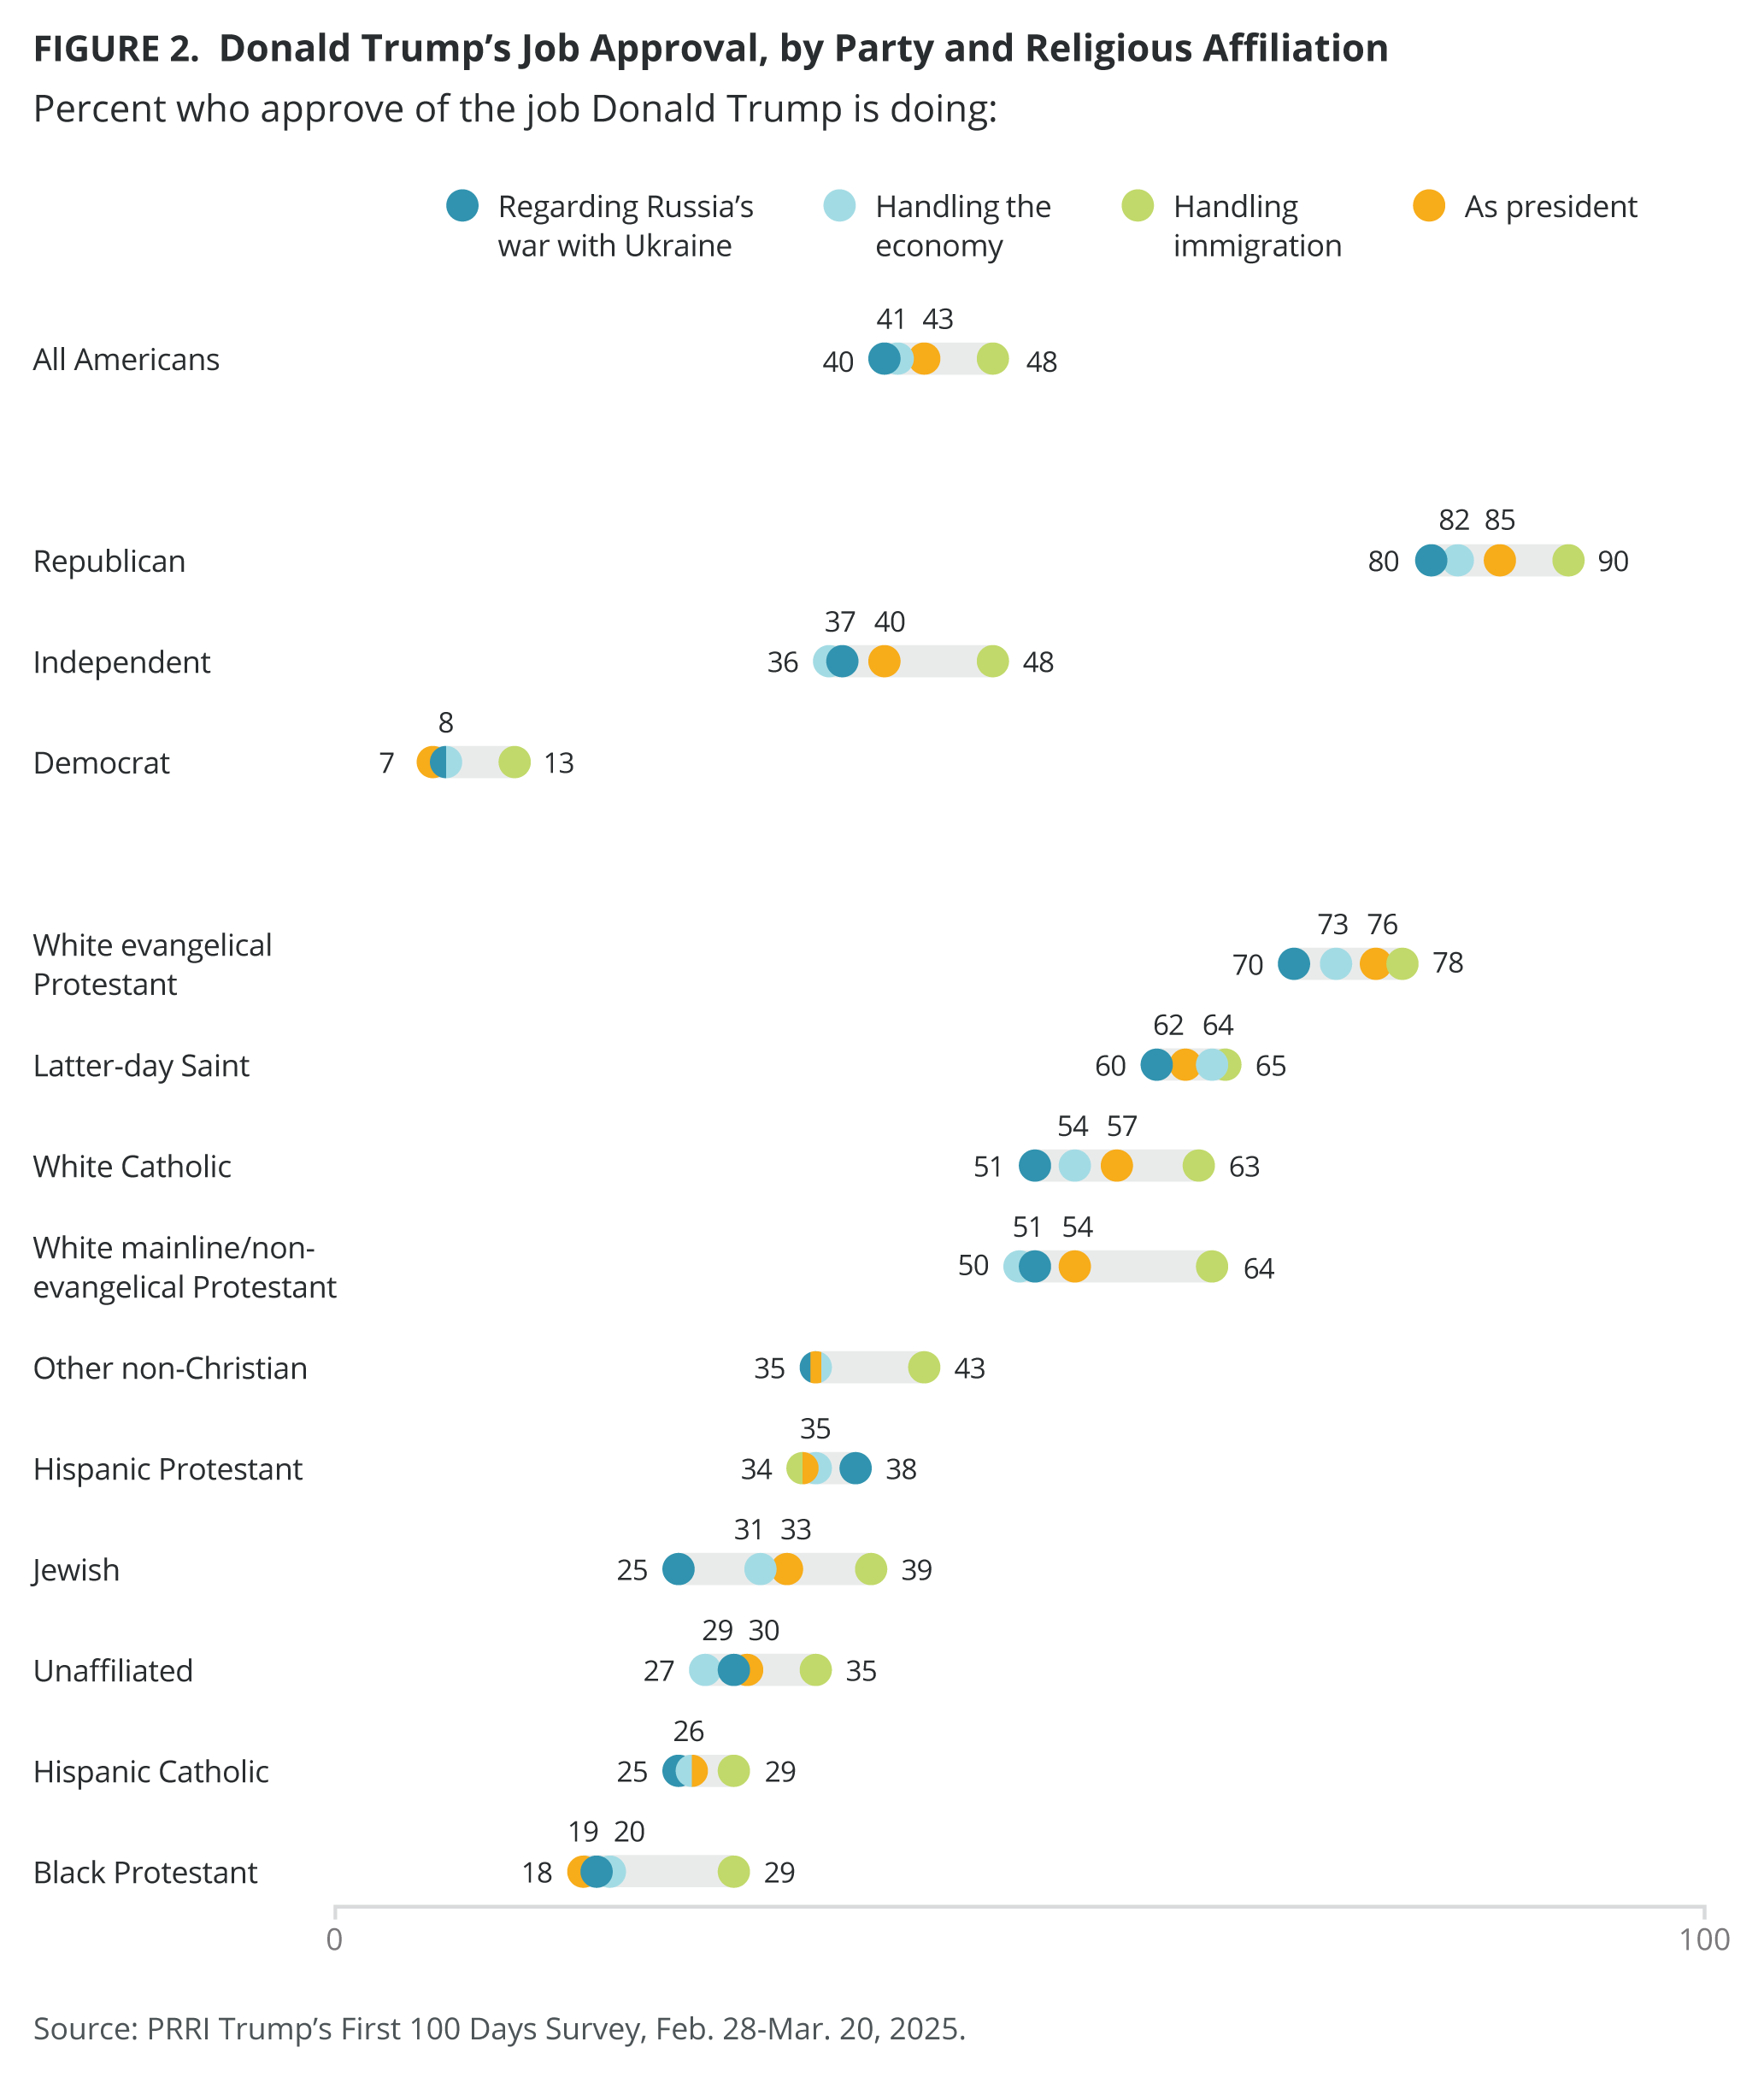
Just around four in ten Americans (43%) approve of the job that Trump is doing as president.
- Roughly four in ten Americans (43%) approve of the job that Trump is doing as president, while a majority (54%) disapprove.
- White Christian groups are the most likely to approve of the job that Trump is doing as president, including three in four white evangelical Protestants (76%), compared with one-third or fewer of other religious Americans.
- While Trump gets slightly higher marks for his handling of immigration (48% of Americans approve), just four in ten approve of his handling of the economy (41%) and Russia’s war with Ukraine (40%).
- White Christian groups are significantly more likely than Christians of color, non-Christians, and unaffiliated Americans to approve of the job that Trump is doing handling immigration, including most white evangelical Protestants (78%), Latter-day Saints (65%), white mainline/non-evangelical Protestants (64%), and white Catholics (63%).
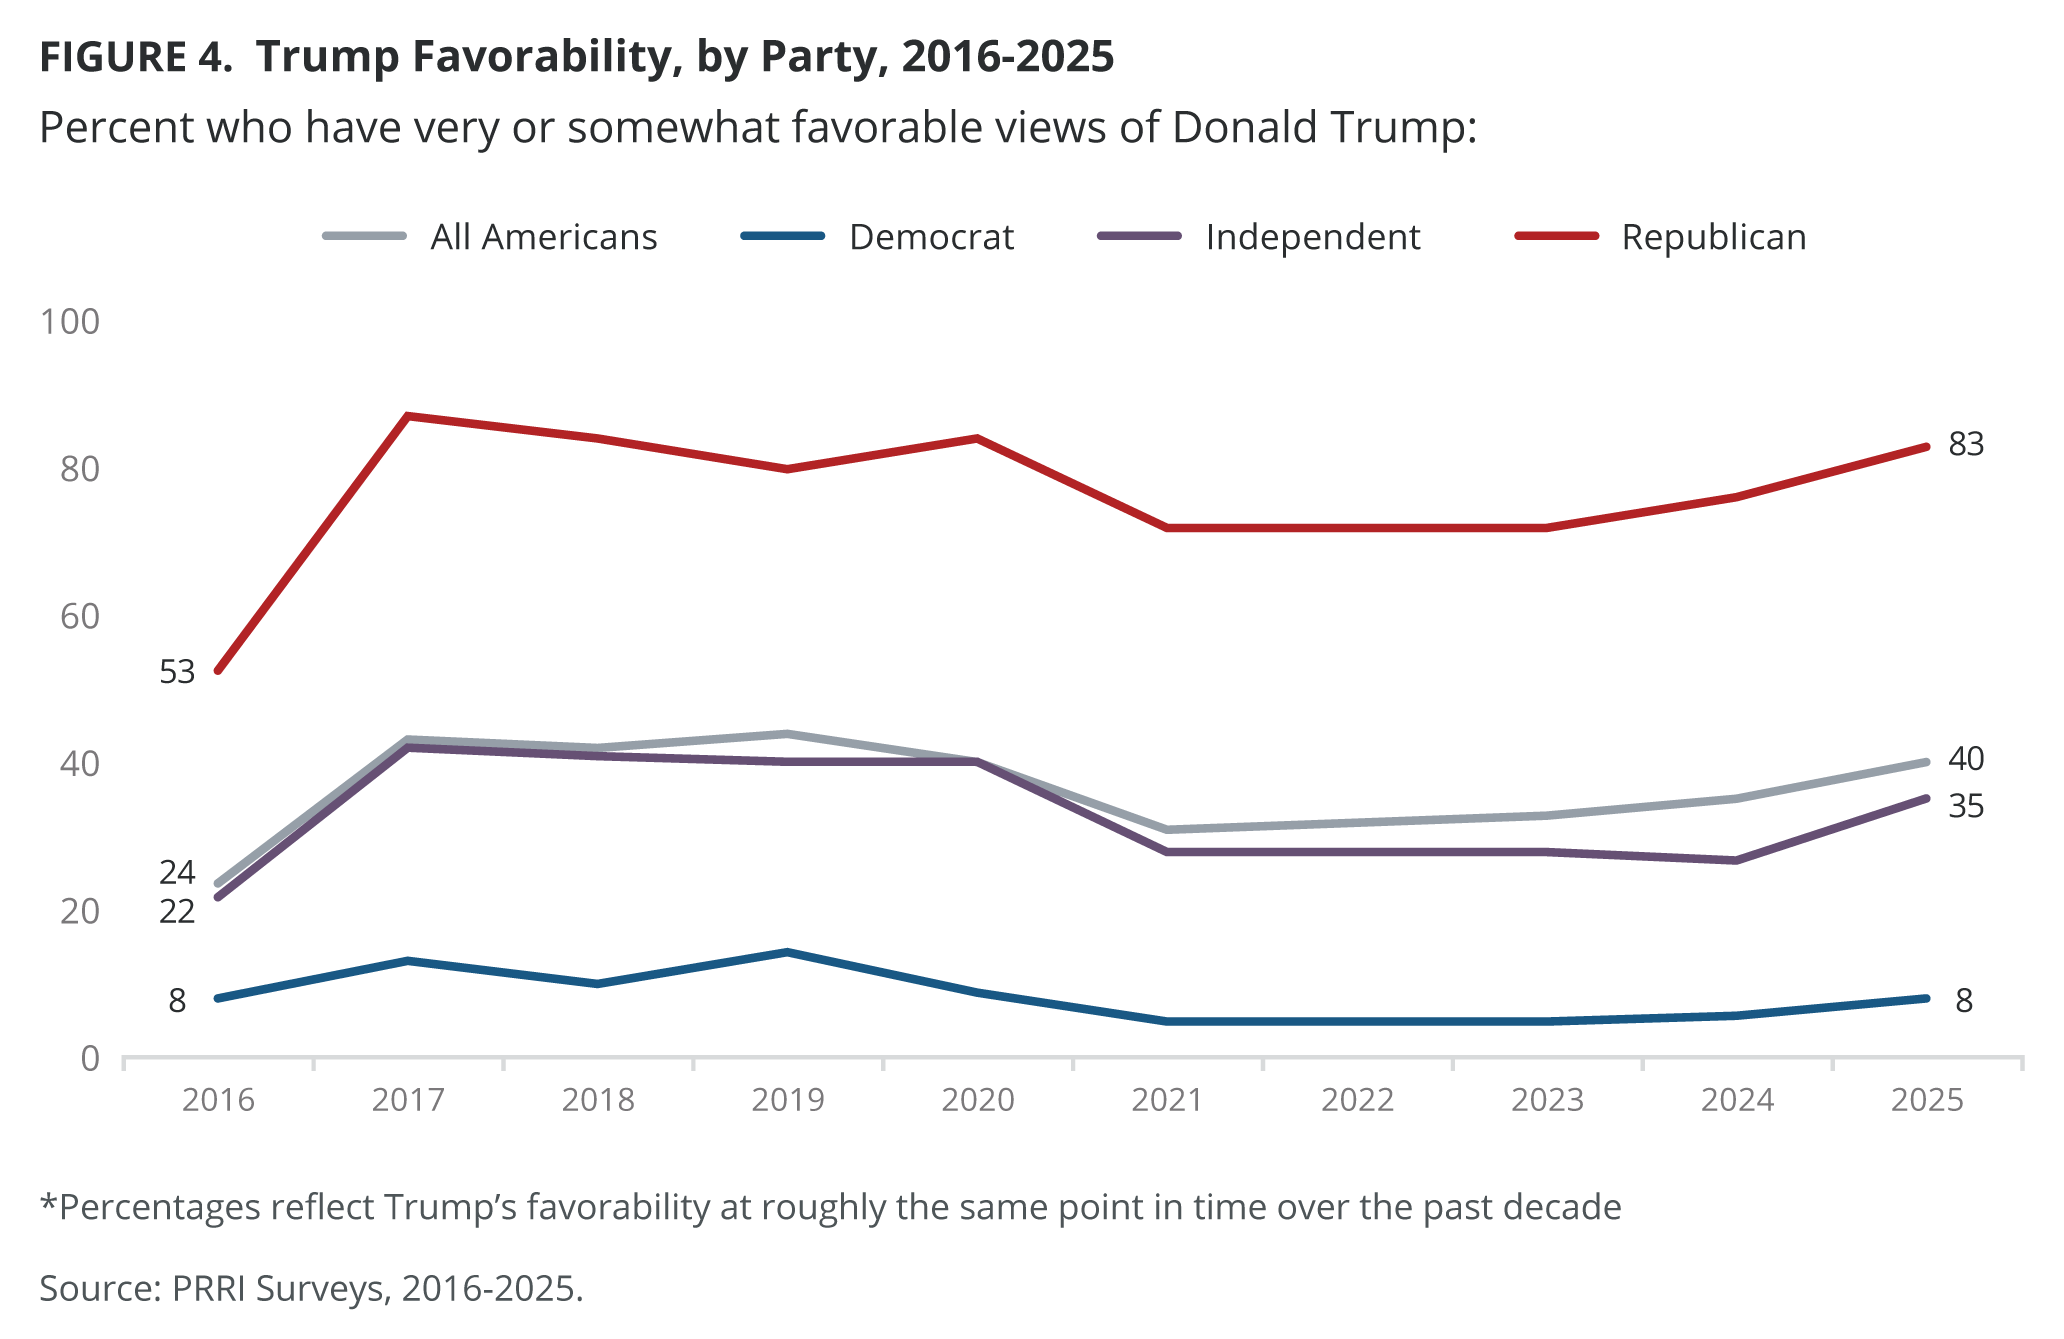
While just four in ten Americans have favorable views of Trump, fewer view either Vice President JD Vance or presidential advisor Elon Musk favorably.
- Four in ten Americans (40%) express favorable views of Trump, including 83% of Republicans, 35% of independents, and 8% of Democrats.
- White Americans, men, older generations, and those who do not have a four-year degree hold significantly more favorable views of Trump than non-white Americans, women, millennials, Gen Zers, and those who are college-educated.
- Roughly one-third of Americans have a favorable view of Vance (35%), compared with half of those who hold an unfavorable opinion (50%).
- Most Americans (58%) view Musk unfavorably. Musk holds less favorable views among Republicans than Trump, 71% vs. 83%.
Americans are more likely to view Trump as a dangerous dictator than a strong leader restoring America’s greatness, although such views are polarized along partisan and religious lines.
- A majority of Americans agree that “President Trump is a dangerous dictator whose power should be limited before he destroys American democracy” (52%), compared with 44% who agree that “President Trump is a strong leader who should be given the power he needs to restore America’s greatness.”
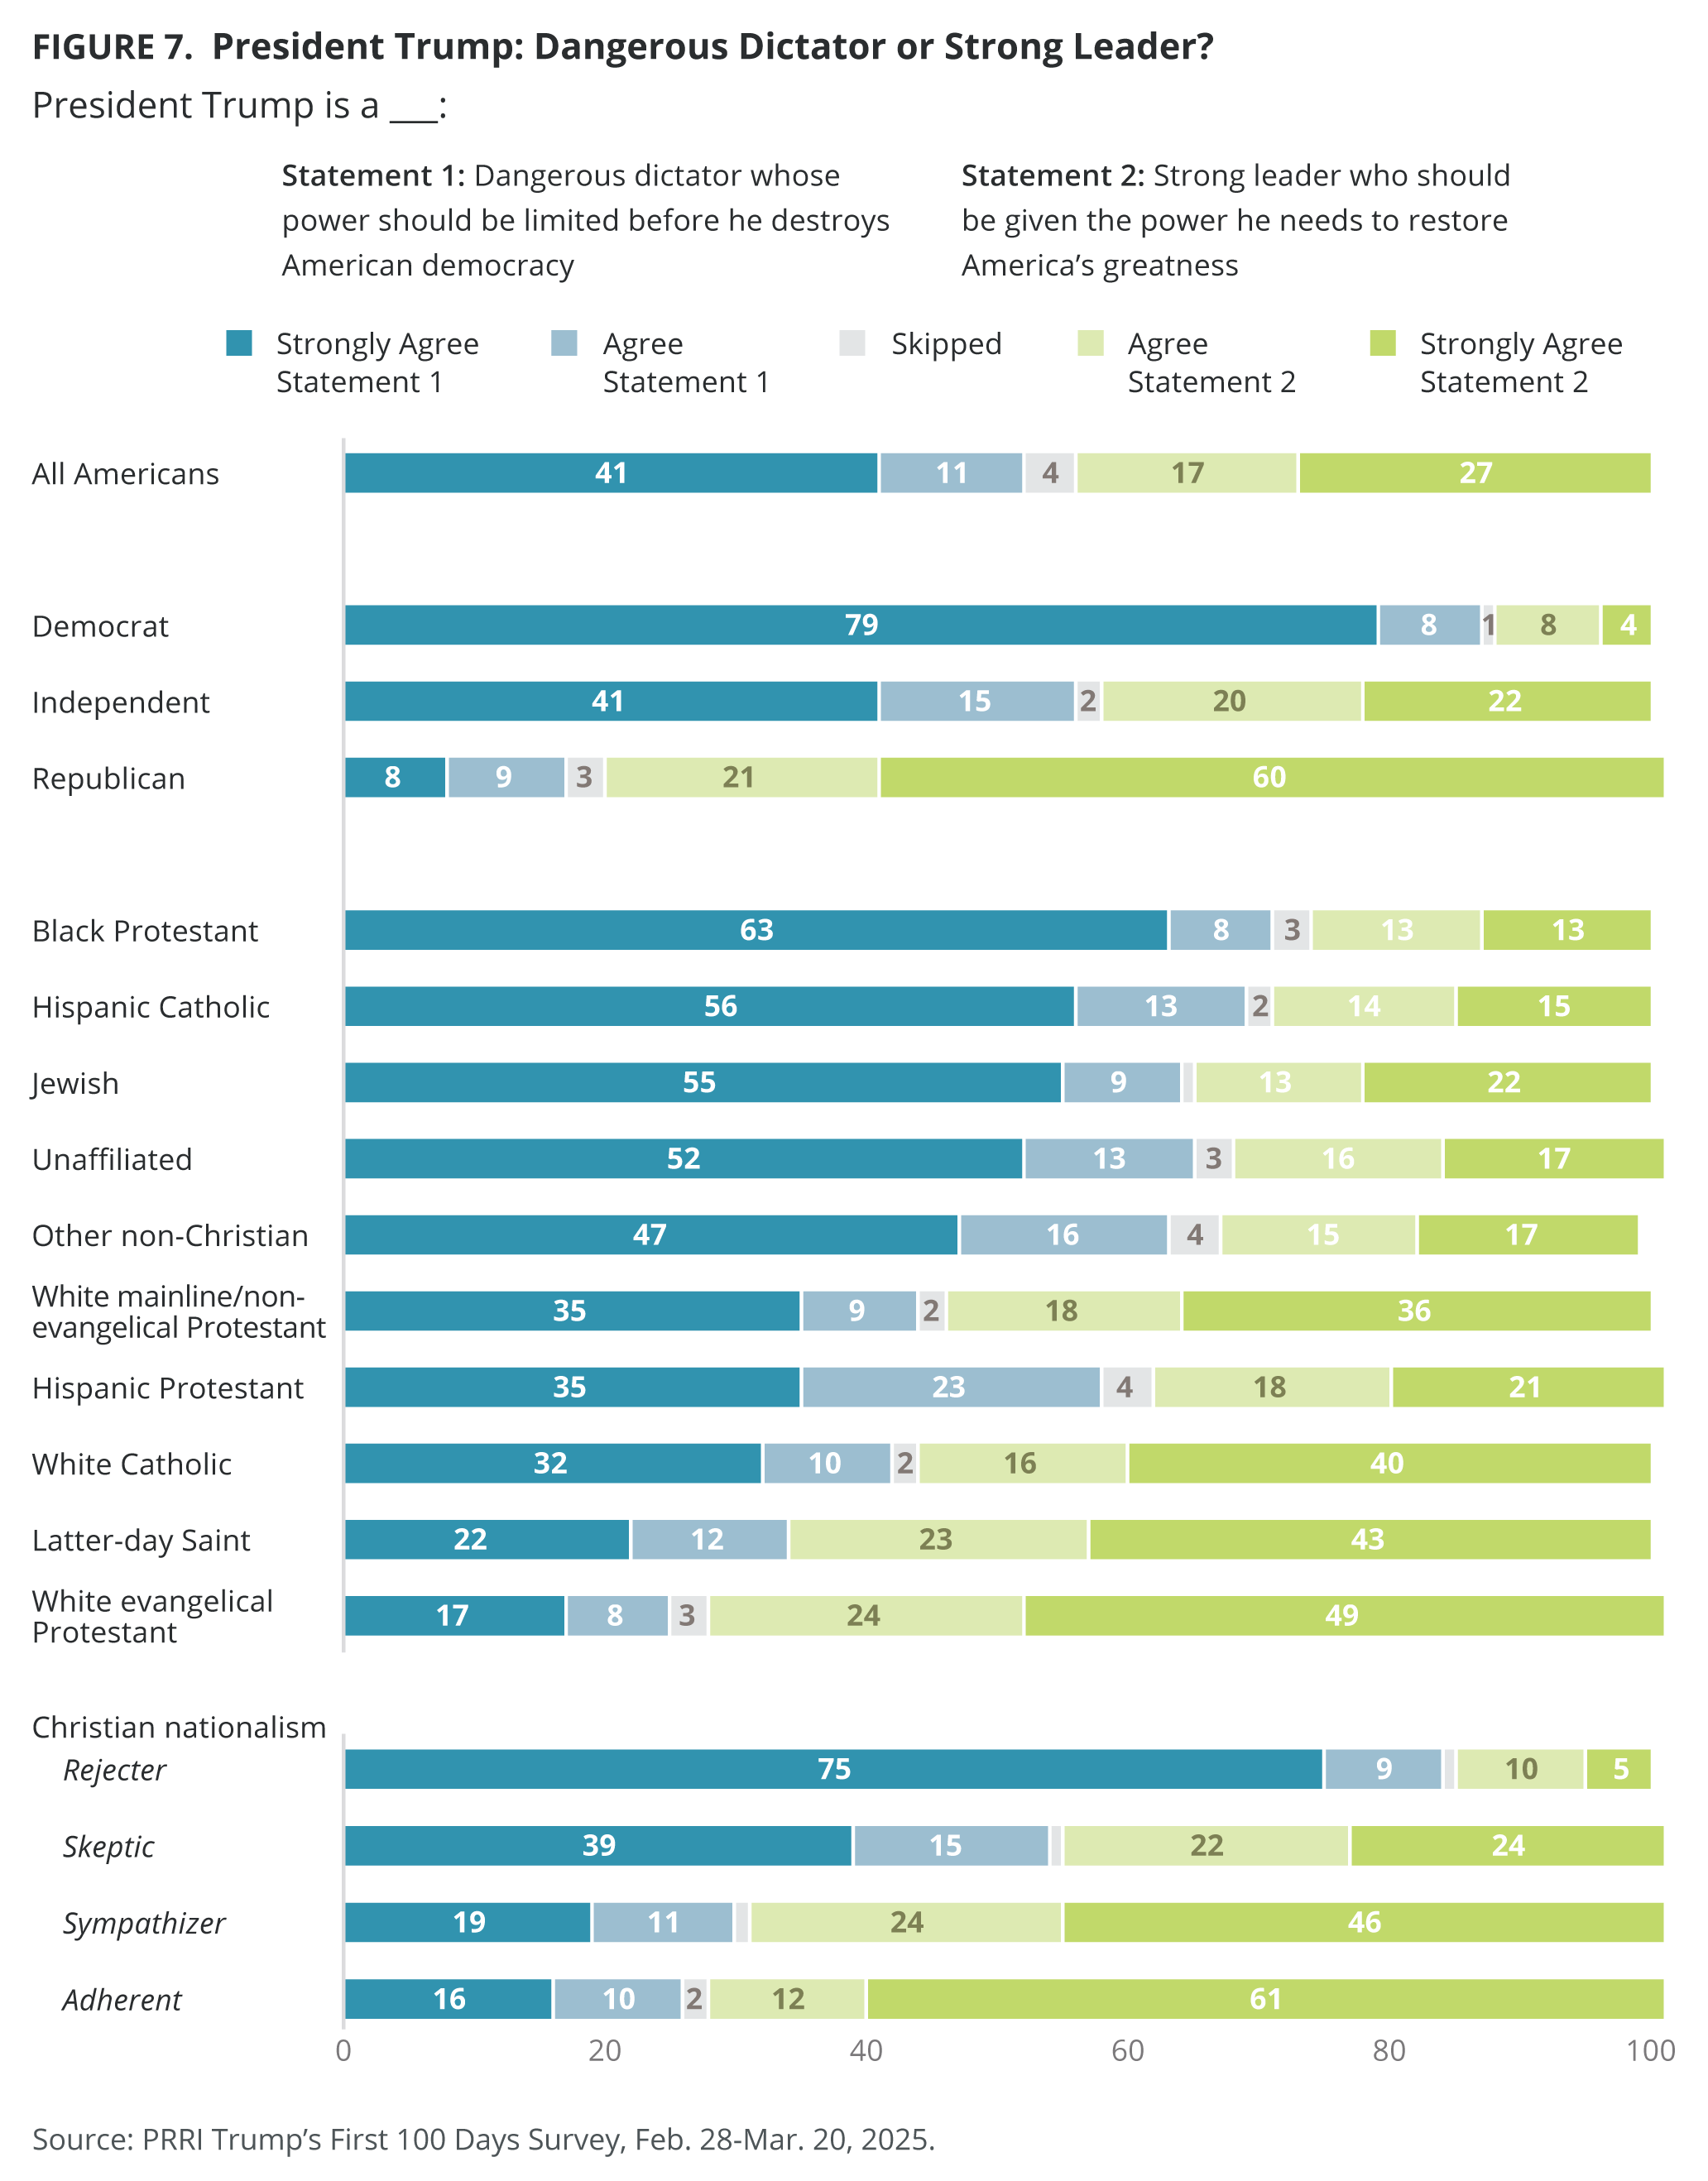
- Most Democrats (87%) agree with the first statement, while most Republicans (81%) agree with the second statement.
- Around seven in ten Christian nationalism Adherents (73%) and Sympathizers (70%) view Trump as a strong leader who should be given the power to restore America’s greatness, compared with 46% of Christian nationalism Skeptics and just 15% of Rejecters.
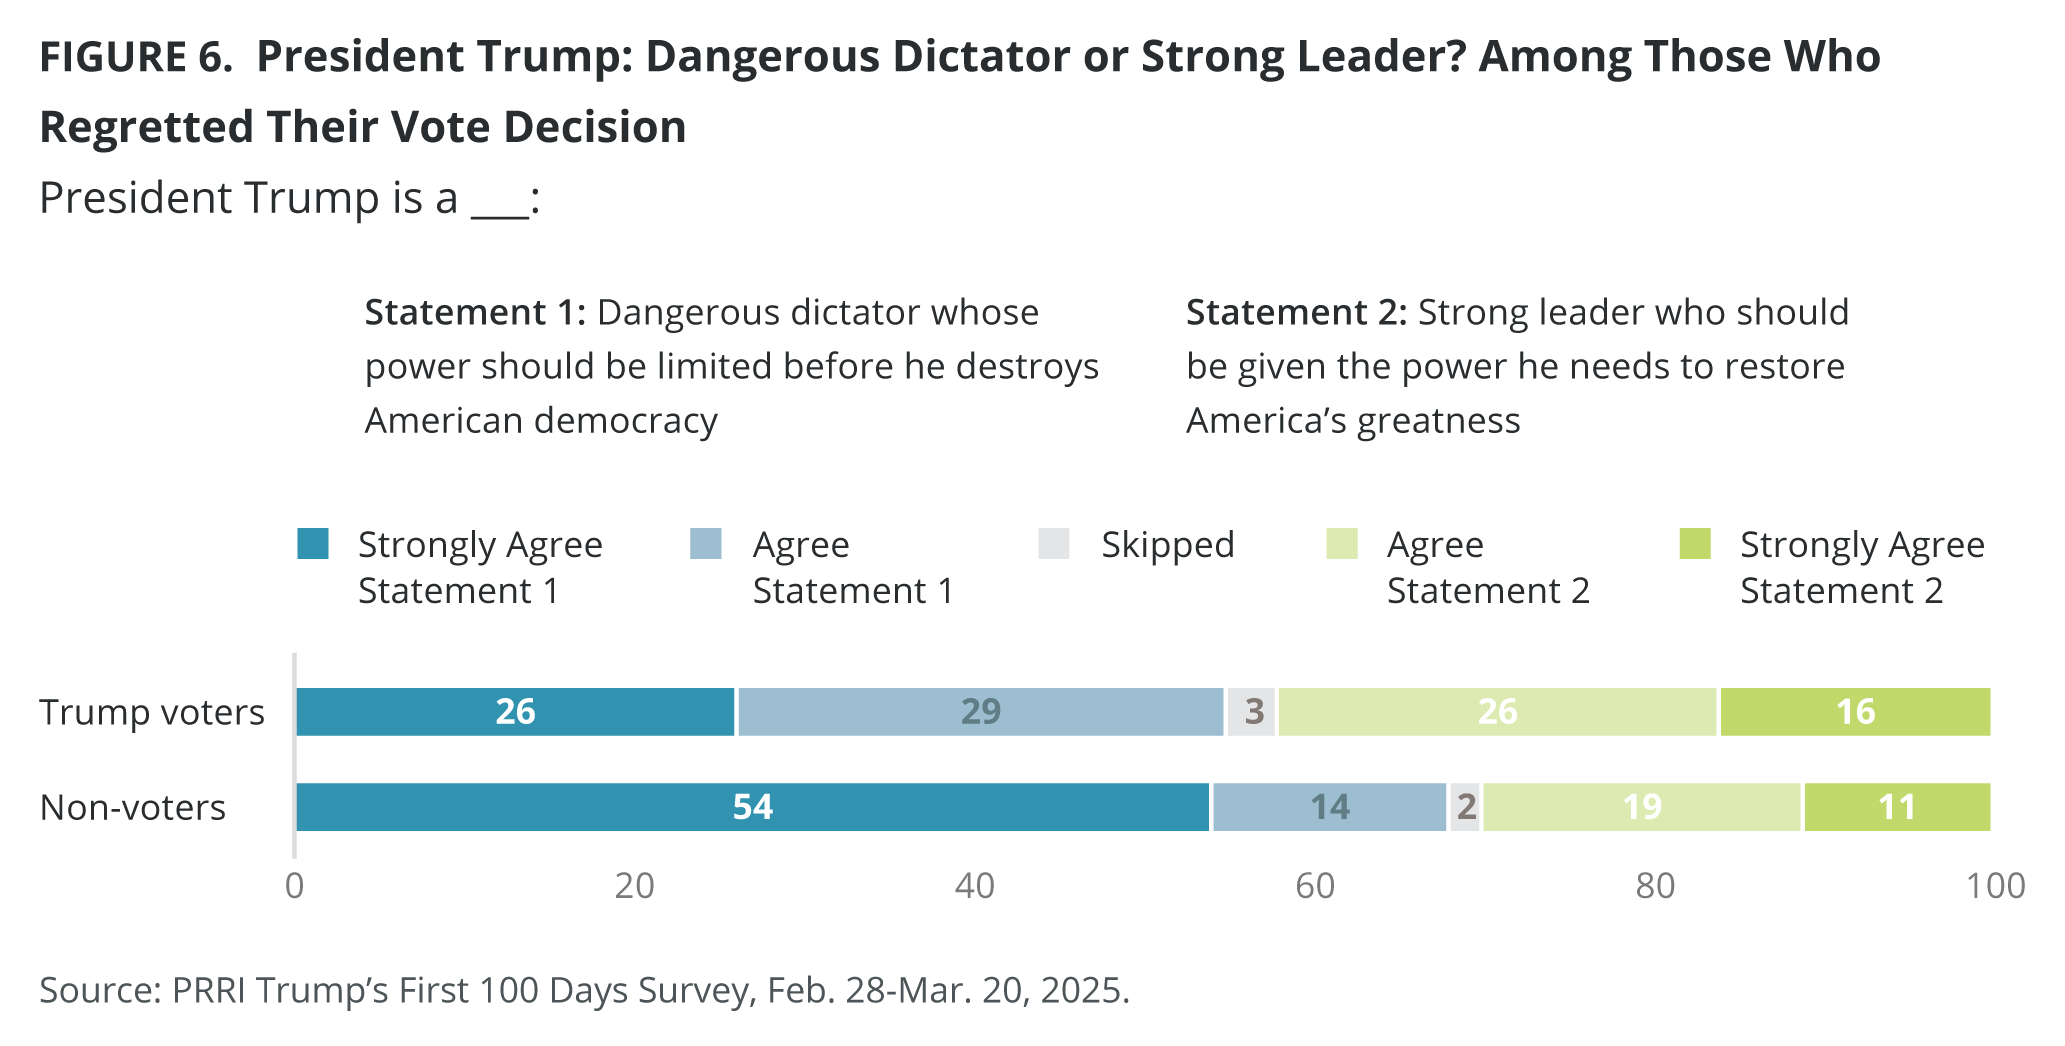
- Among Americans who voted for Trump and regret their decision, 55% agree that Trump is a dangerous dictator; agreement that Trump is a dangerous dictator is even higher among non-voters who regret their decision not to vote (68%).
Very few Americans endorse expanding the scope of executive power, whether that includes suspending congressional elections or allowing presidents to serve more than two terms; few Americans think that presidents should be above the law.
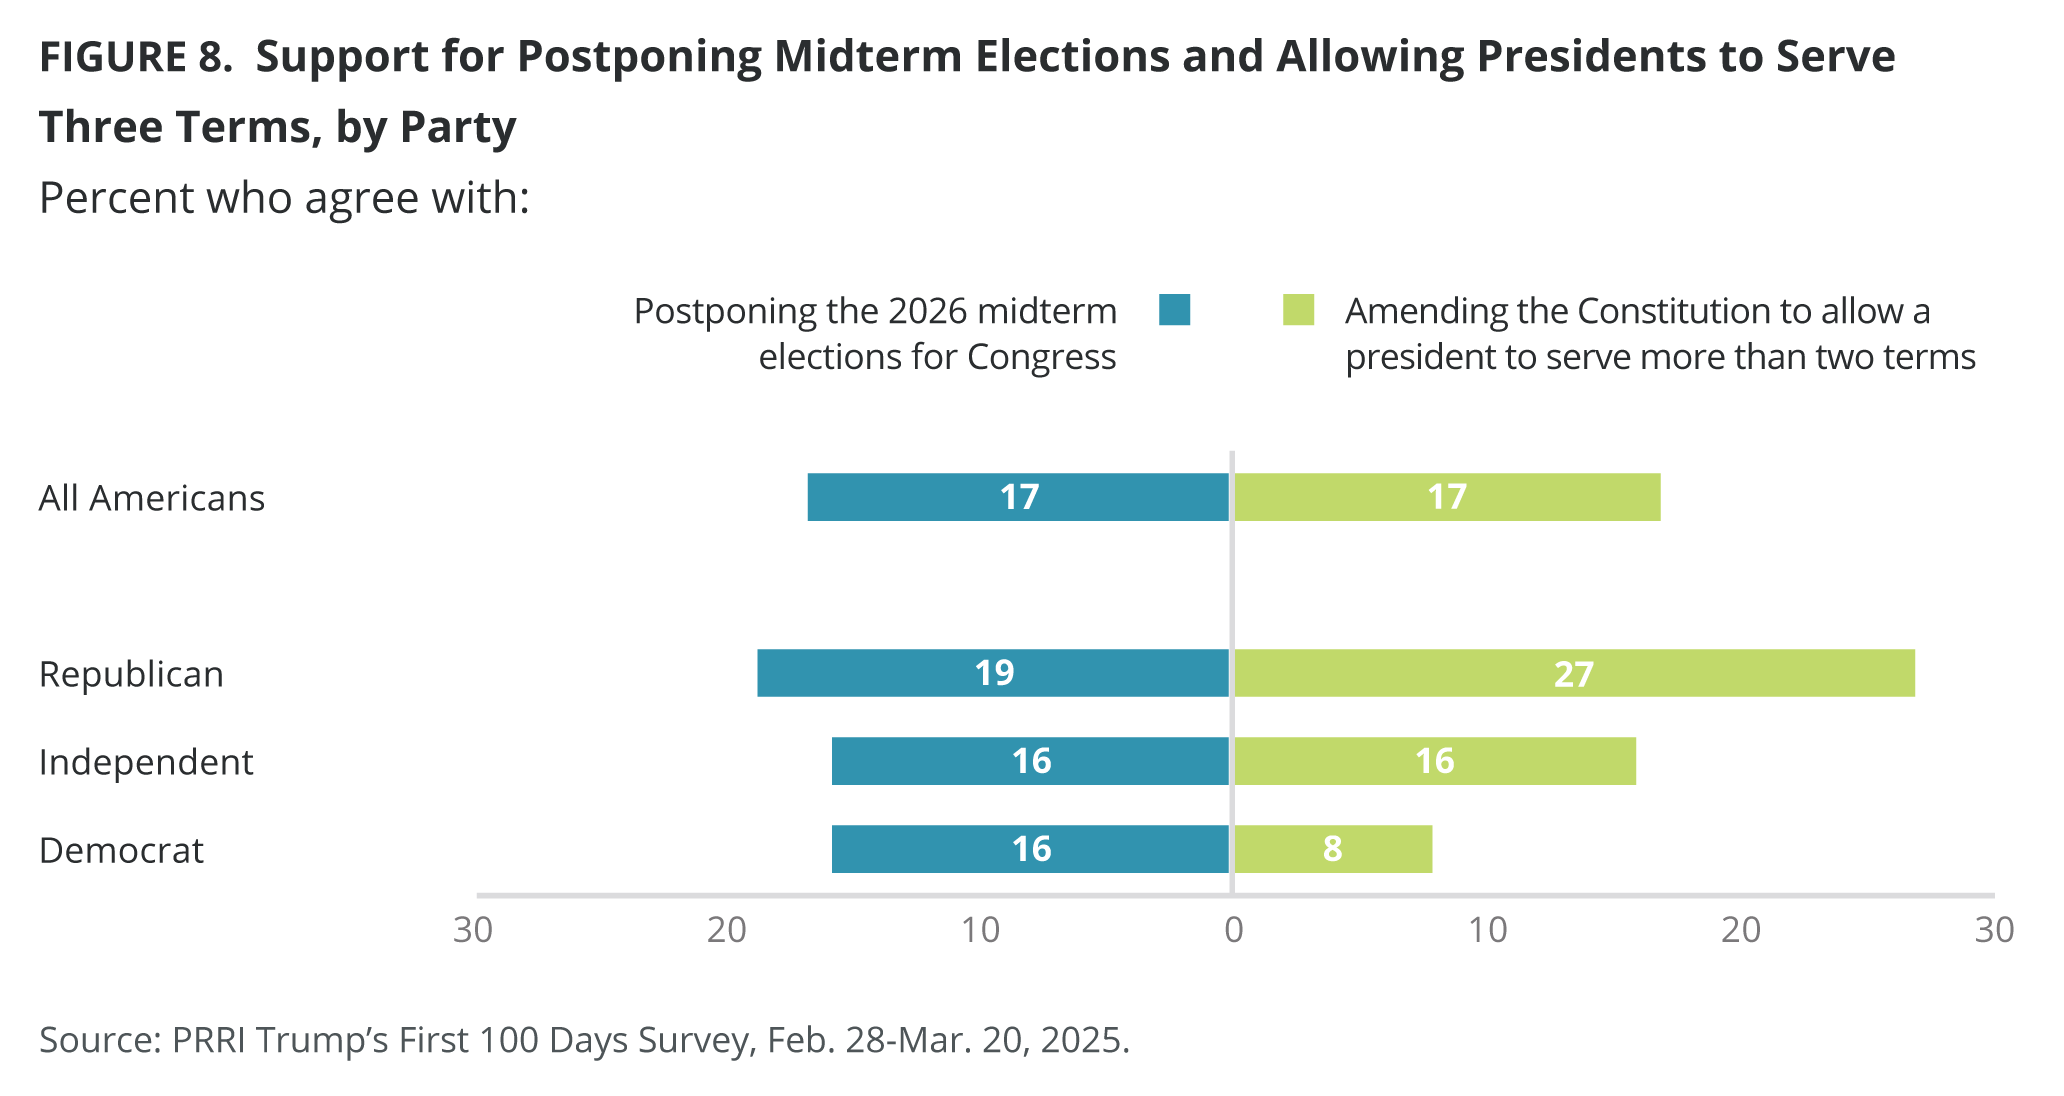
- Just 17% of Americans agree that if Trump cannot get our country out of crisis in the next year, he should postpone the 2026 midterm elections for Congress or the U.S. Constitution should be amended to allow presidents to serve more than two terms in office, although Republicans are three times as likely as Democrats to agree with the second statement (27% vs. 8%).
- Nine in ten Americans (89%) agree that no elected official, including the president, should be above the law.
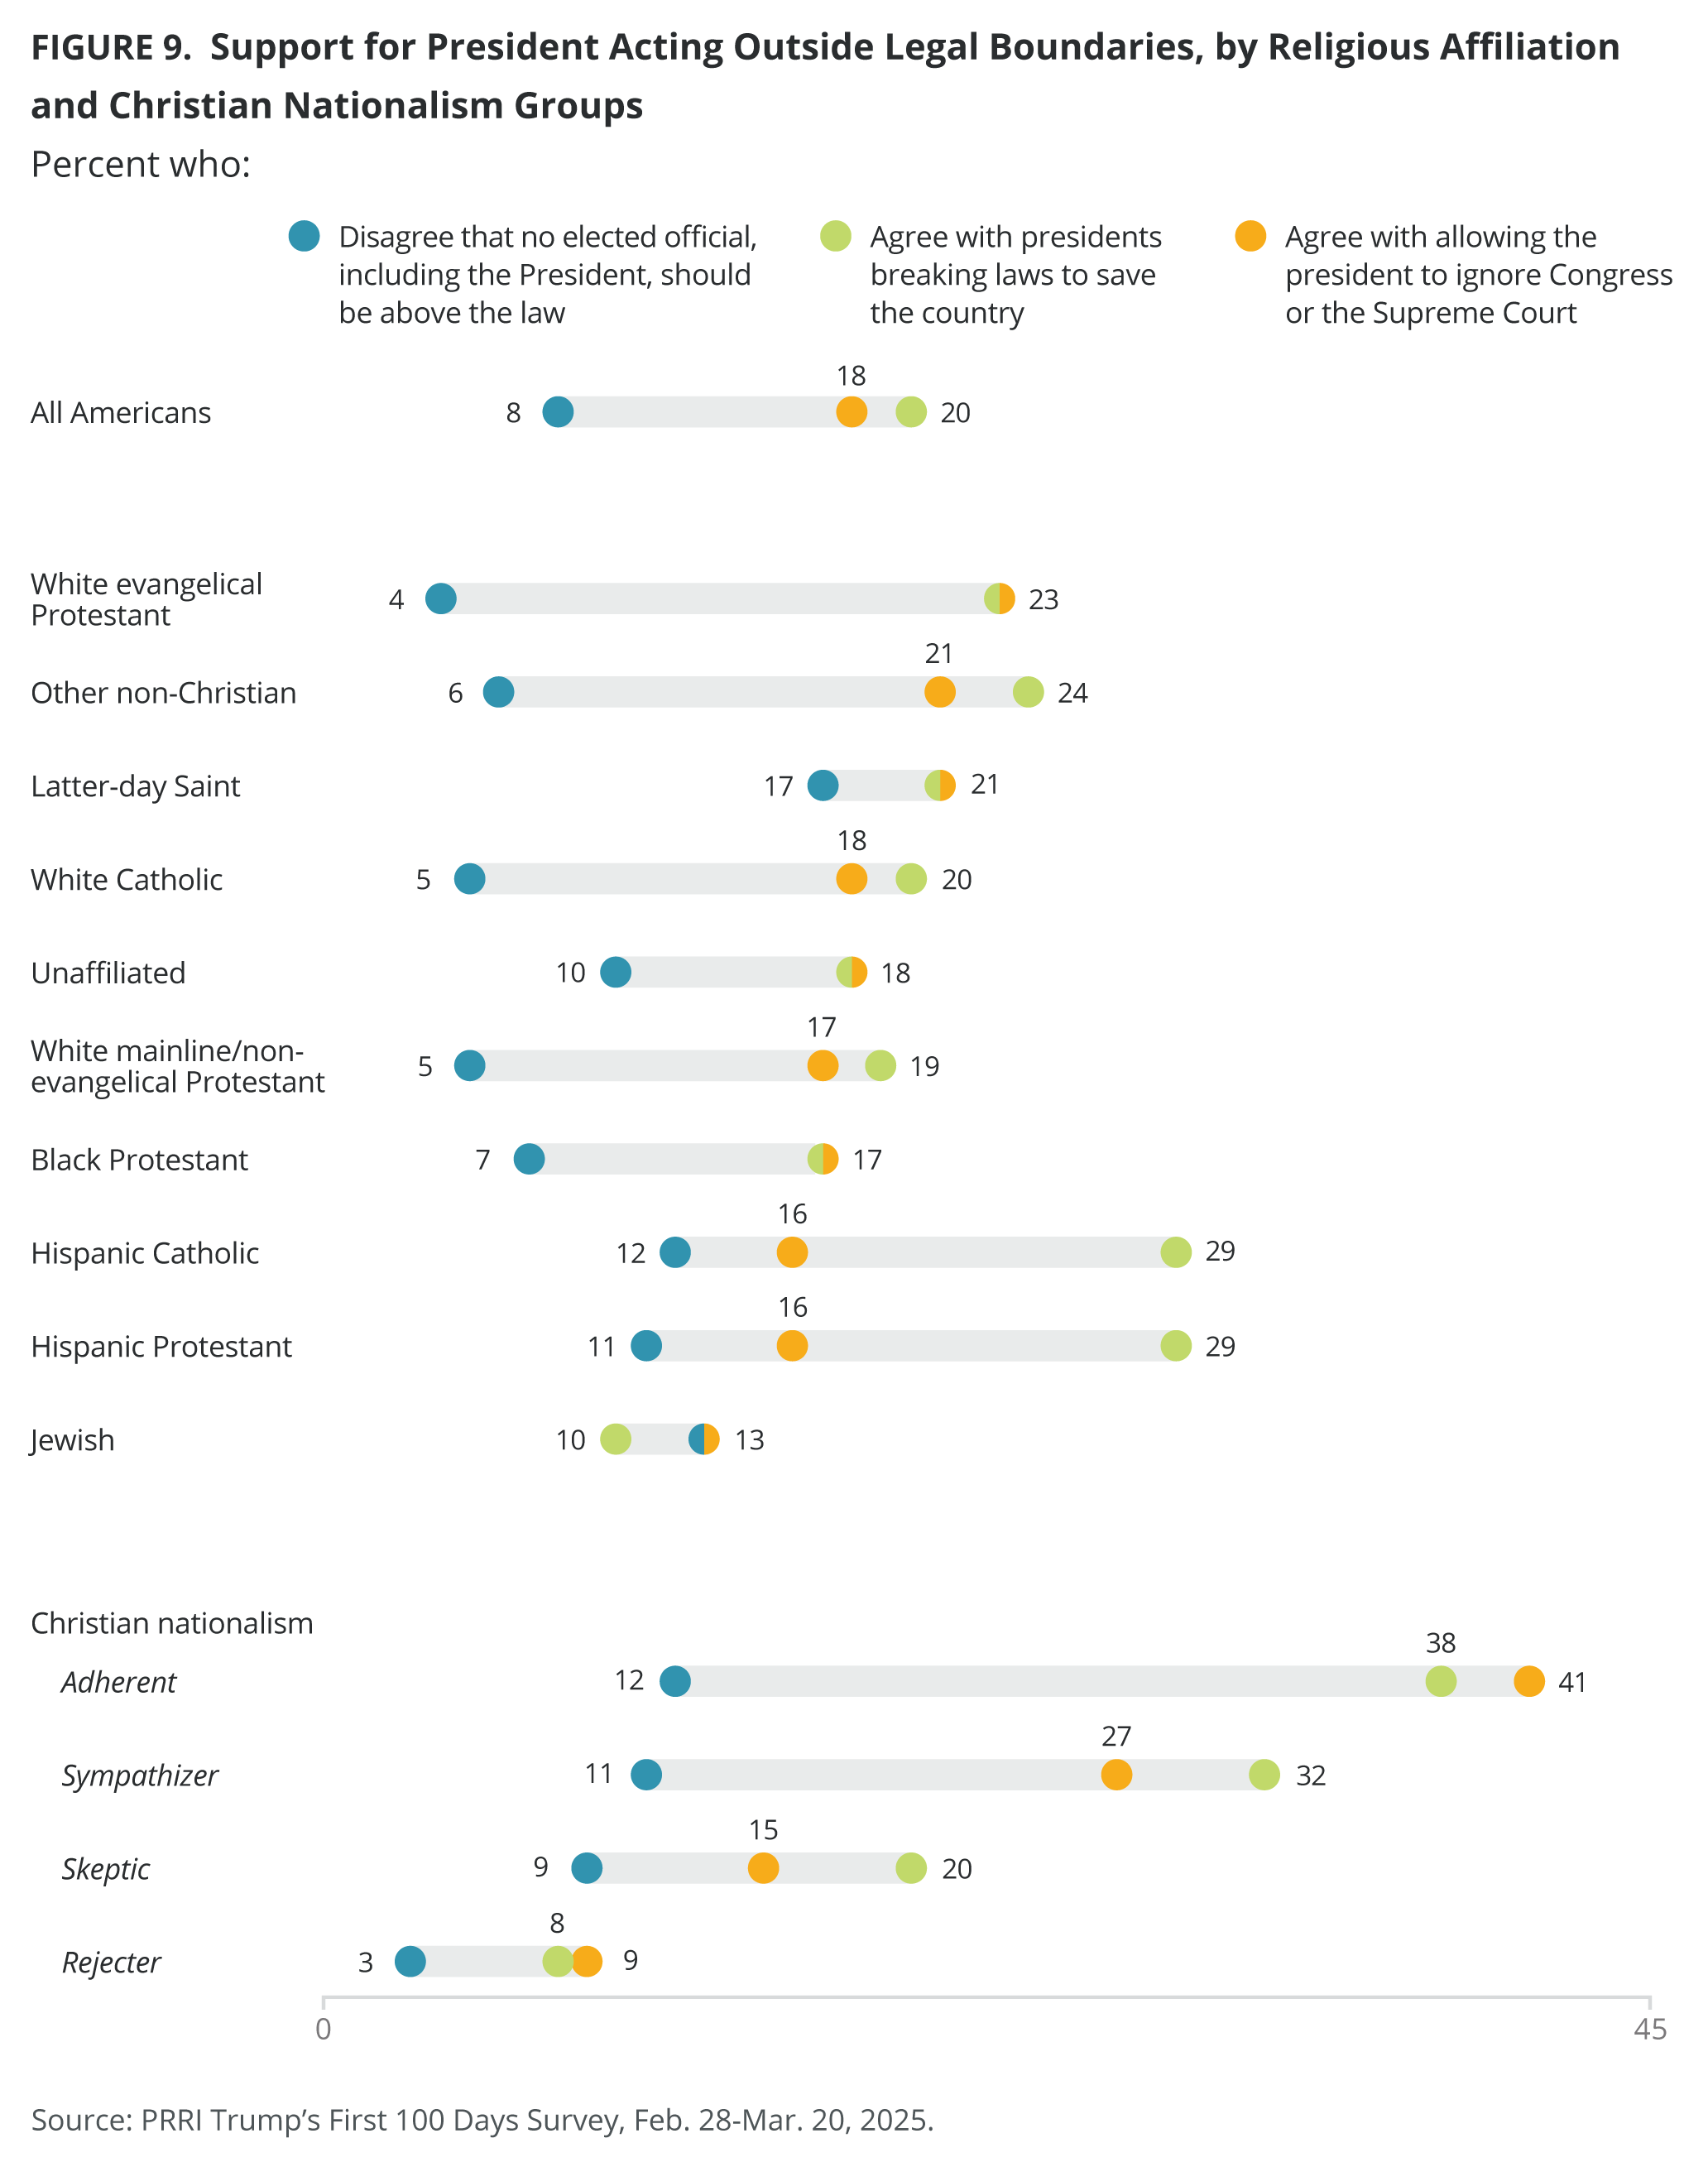
- At the same time, two in ten Americans (20%) agree that “because things have gotten so far off track, we need a president who is willing to break some laws if that’s what it takes to save the country;” around three in ten Americans who most trust Fox News (32%) and far-right news sources (30%) agree.
Americans remain strongly committed to our system of checks and balances, strongly disagreeing that the president should ignore the actions of Congress or the Supreme Court.
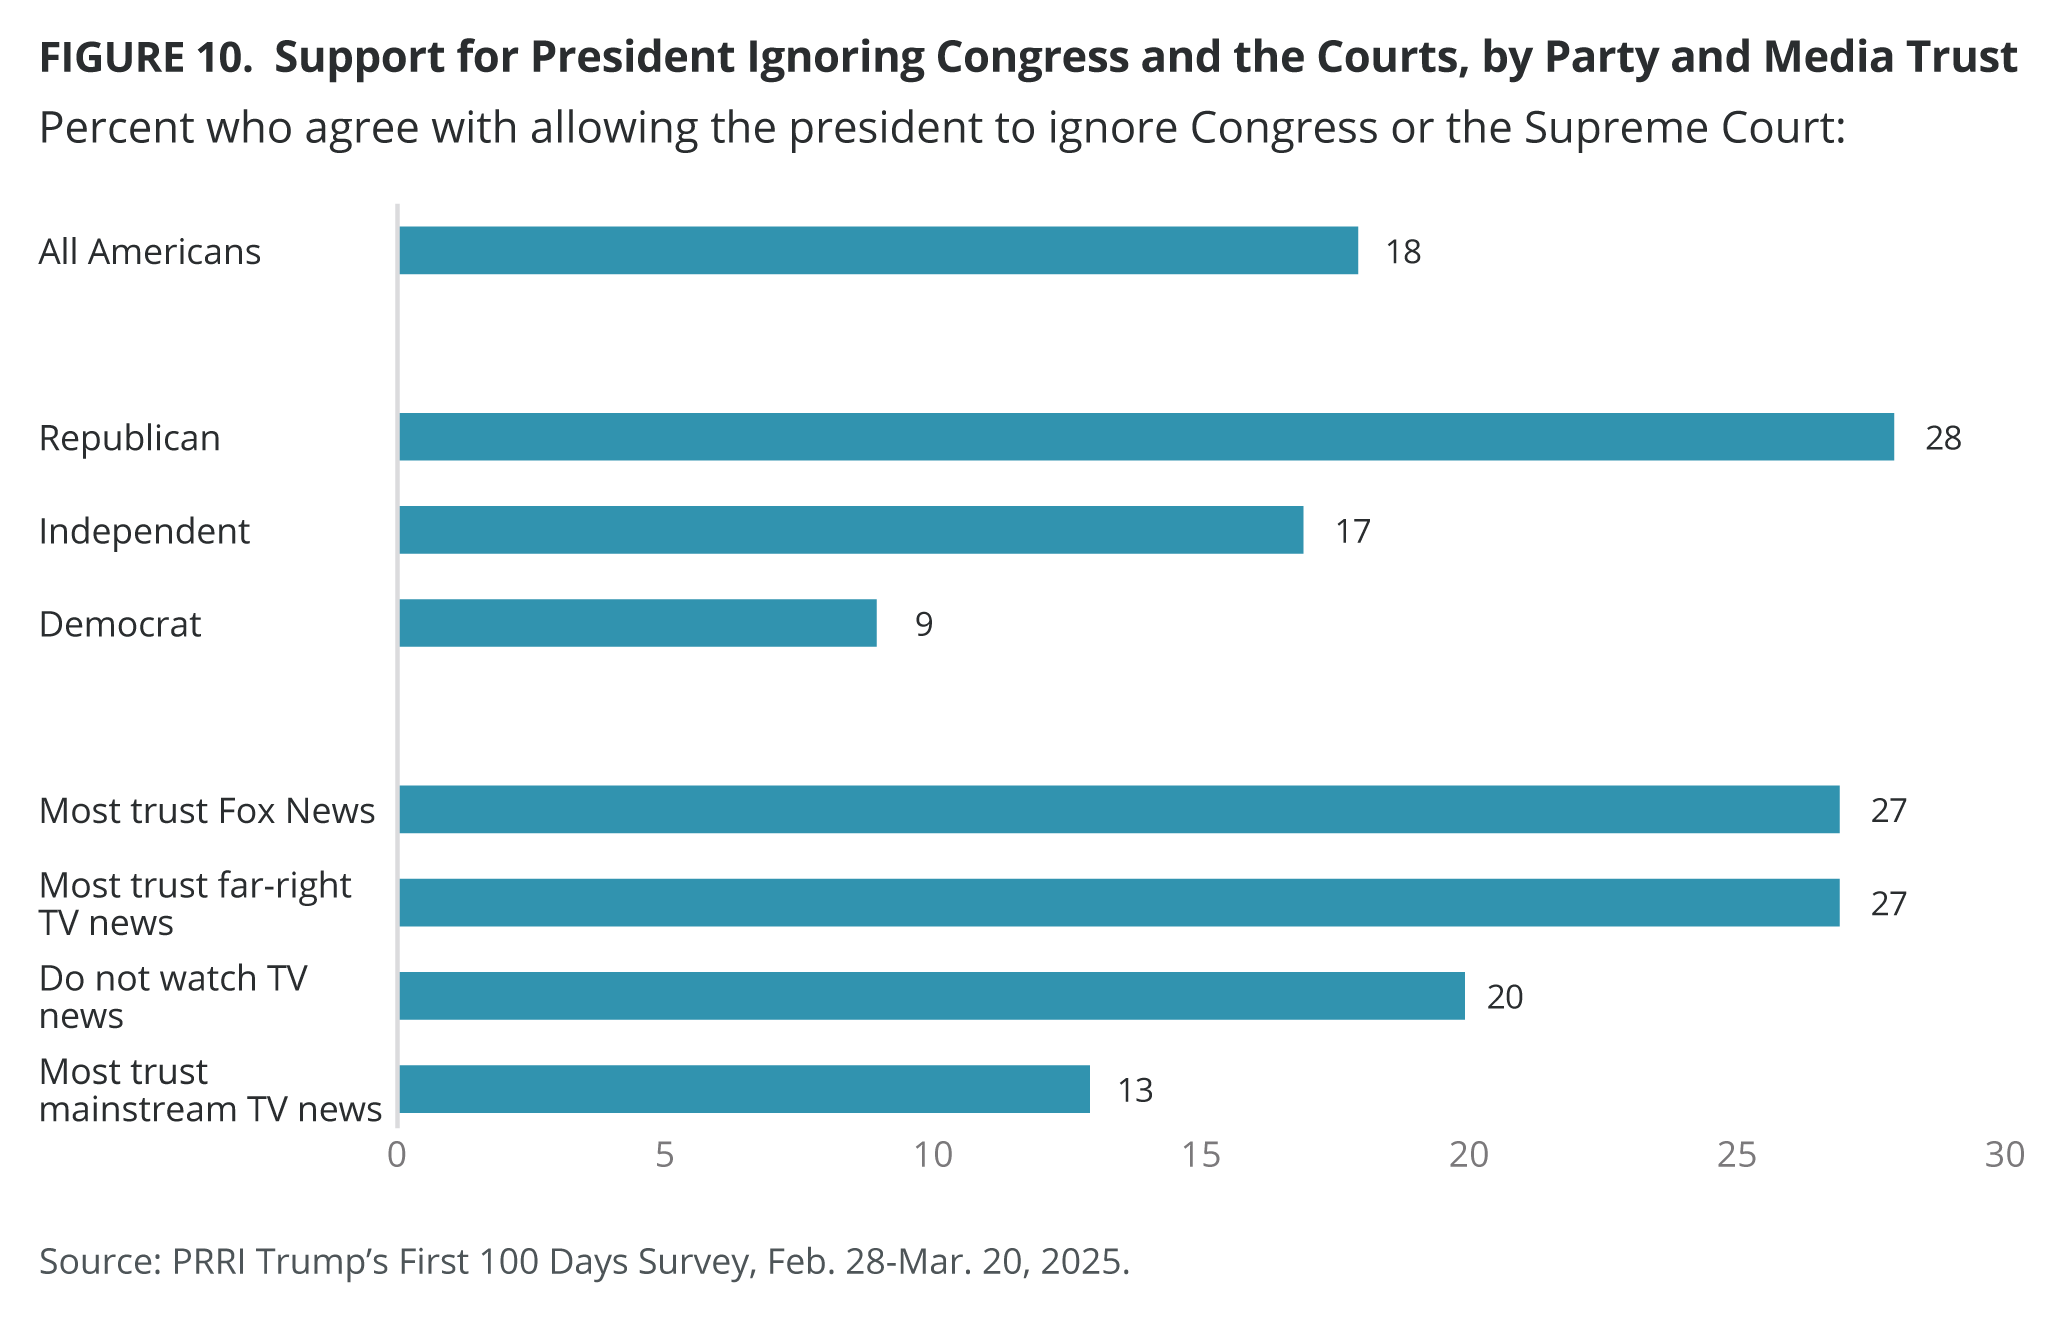
- Nearly eight in ten Americans (78%) disagree with the statement “When decisions by Congress or the Supreme Court hold our country back, the president should be able to ignore them,” compared with only 18% who agree; Republicans are more than three times as likely as Democrats to agree (28% vs. 9%).
- Christian nationalism Adherents (41%) are more likely than Christian nationalism Sympathizers (27%), Skeptics (15%), and Rejecters (9%) to agree that if the country is being held back by decisions of Congress or the Supreme Court, the president should be able to ignore them.
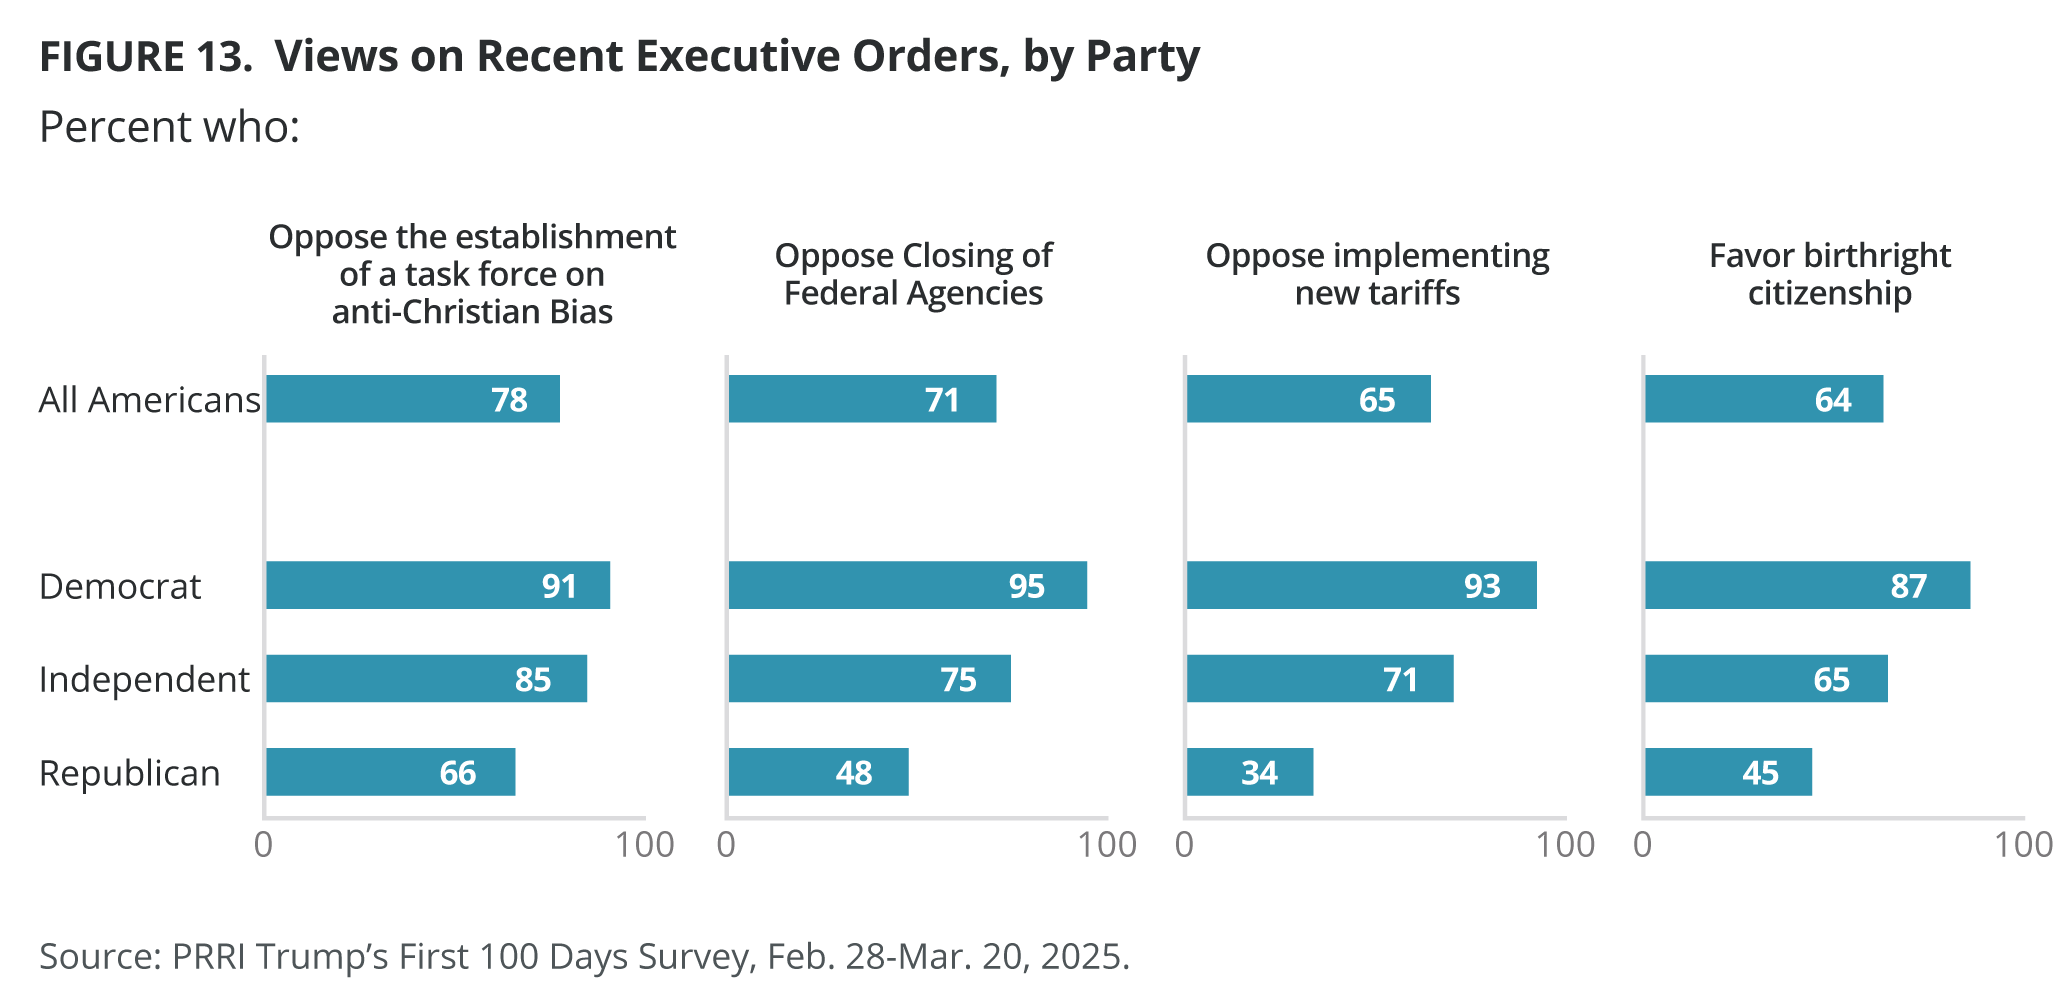
Many of Trump’s early executive orders — including the implementation of tariffs — are broadly opposed by the American public, especially among Democrats.
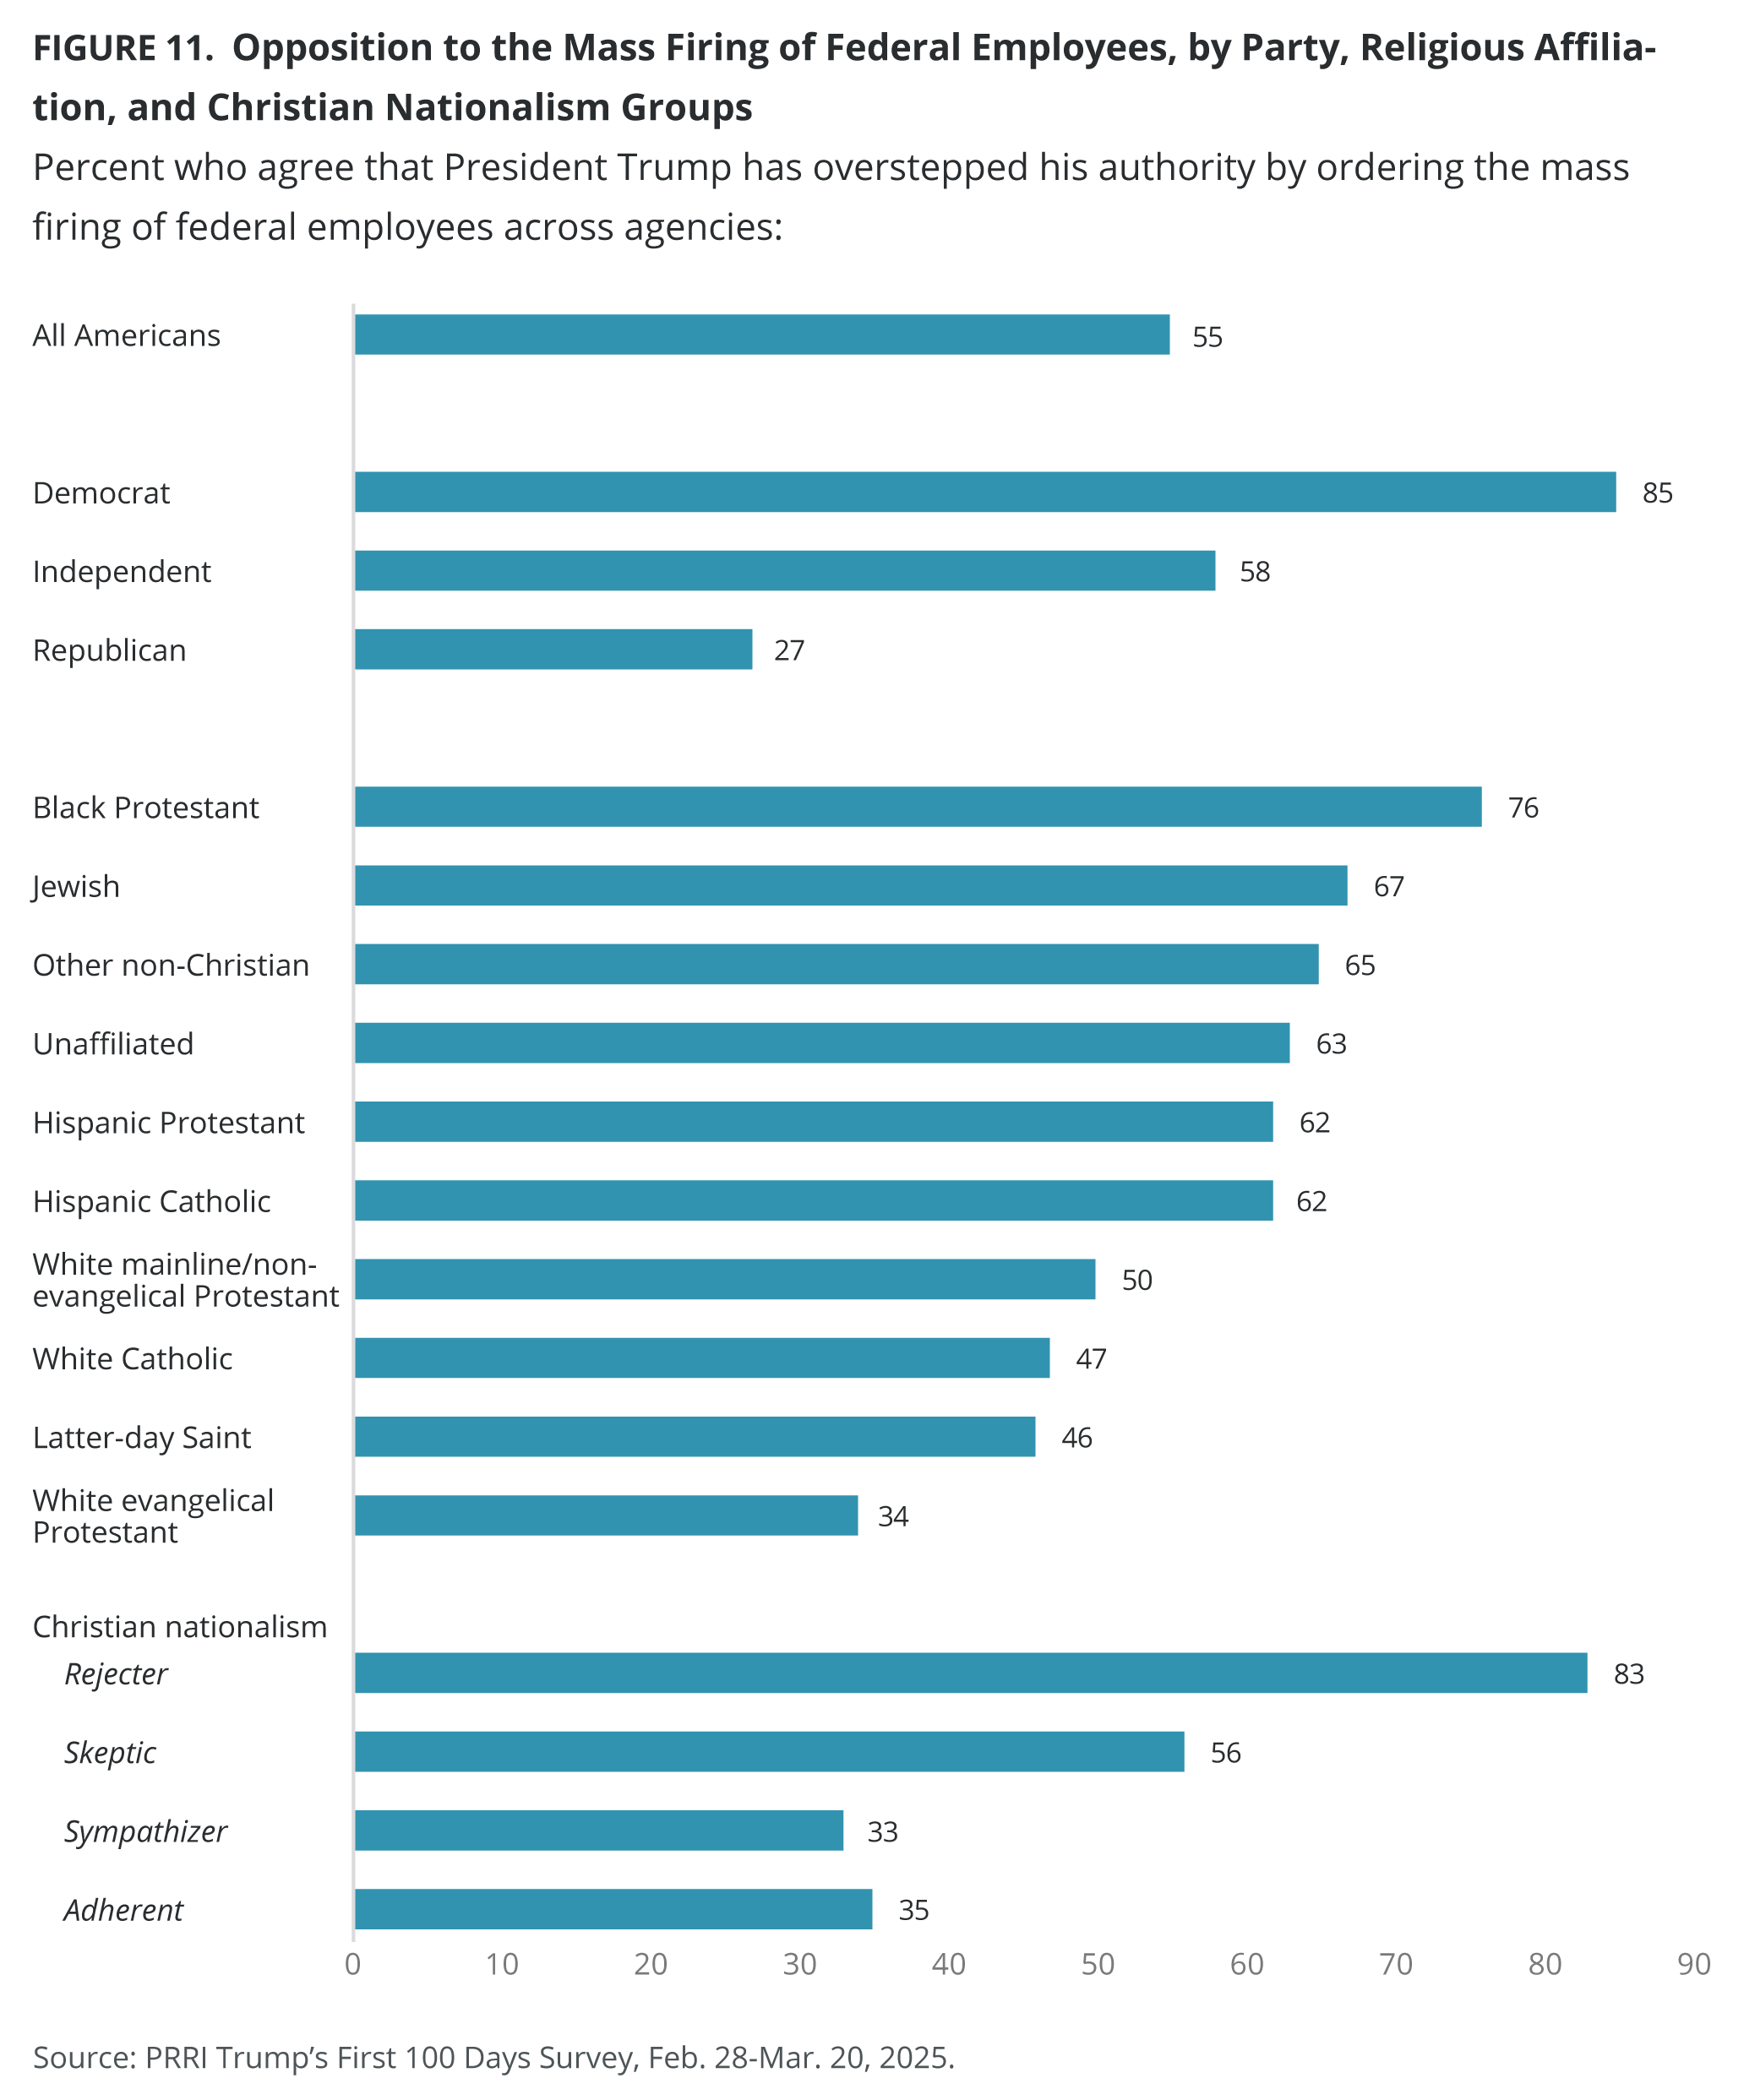
- A majority of Americans (55%) — 85% of Democrats vs. 27% of Republicans — agree that “President Trump has overstepped his authority by ordering the mass firing of federal employees across multiple agencies,” while 41% disagree.
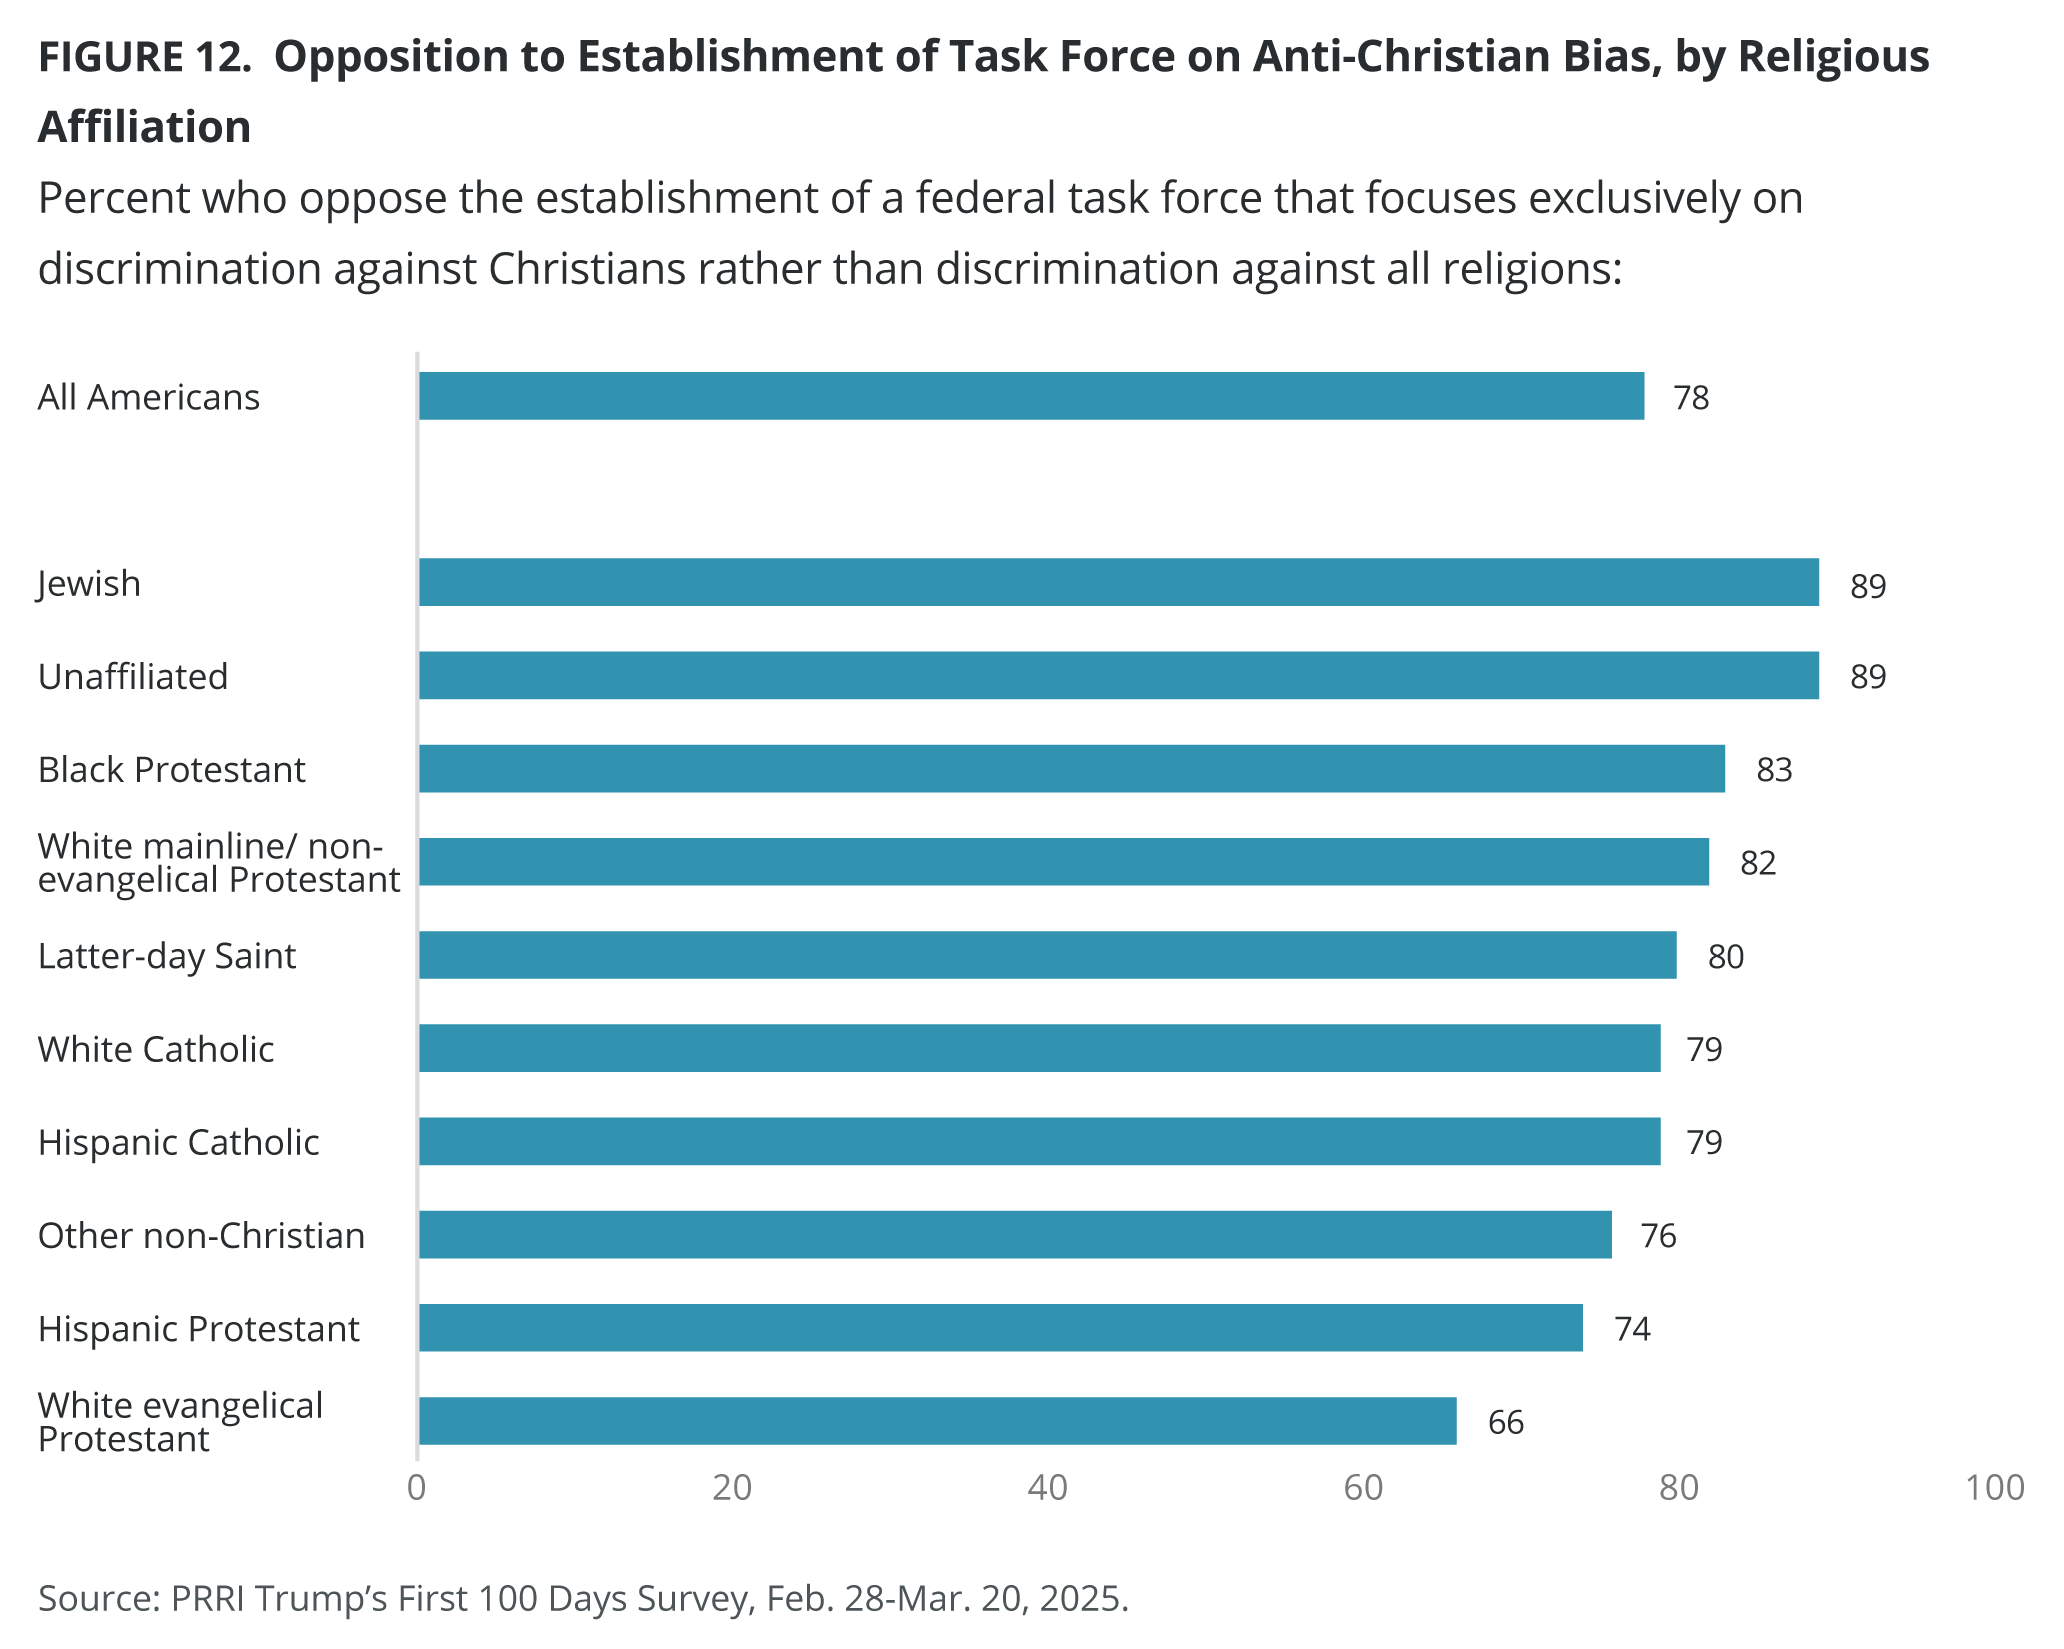
- Most Americans (78%) — 91% of Democrats vs. 66% of Republicans — oppose the establishment of a federal task force that focuses on anti-Christian bias.
- Most Americans (71%) — 95% of Democrats vs. 48% of Republicans — oppose closing or drastically shrinking all major federal agencies, even if it means things like airline travel, medicine, and water may be less safe.
- Two-thirds of Americans (65%) — 93% of Democrats vs. 34% of Republicans — oppose the implementation of new tariffs, or taxes, on imported goods from other countries, even if it raises prices for American customers, while 31% favor tariffs.
- About two-thirds of Americans (64%) — 87% of Democrats vs. 45% of Republicans — favor automatic U.S. citizenship for all children who are born in the United States, regardless of their parents’ citizenship status, while 32% oppose birthright citizenship.
Musk’s work with the Department of Government Efficiency is very unpopular, as most Americans are concerned about his access to citizens’ private data and a majority think his efforts at combatting waste and fraud are harmful.
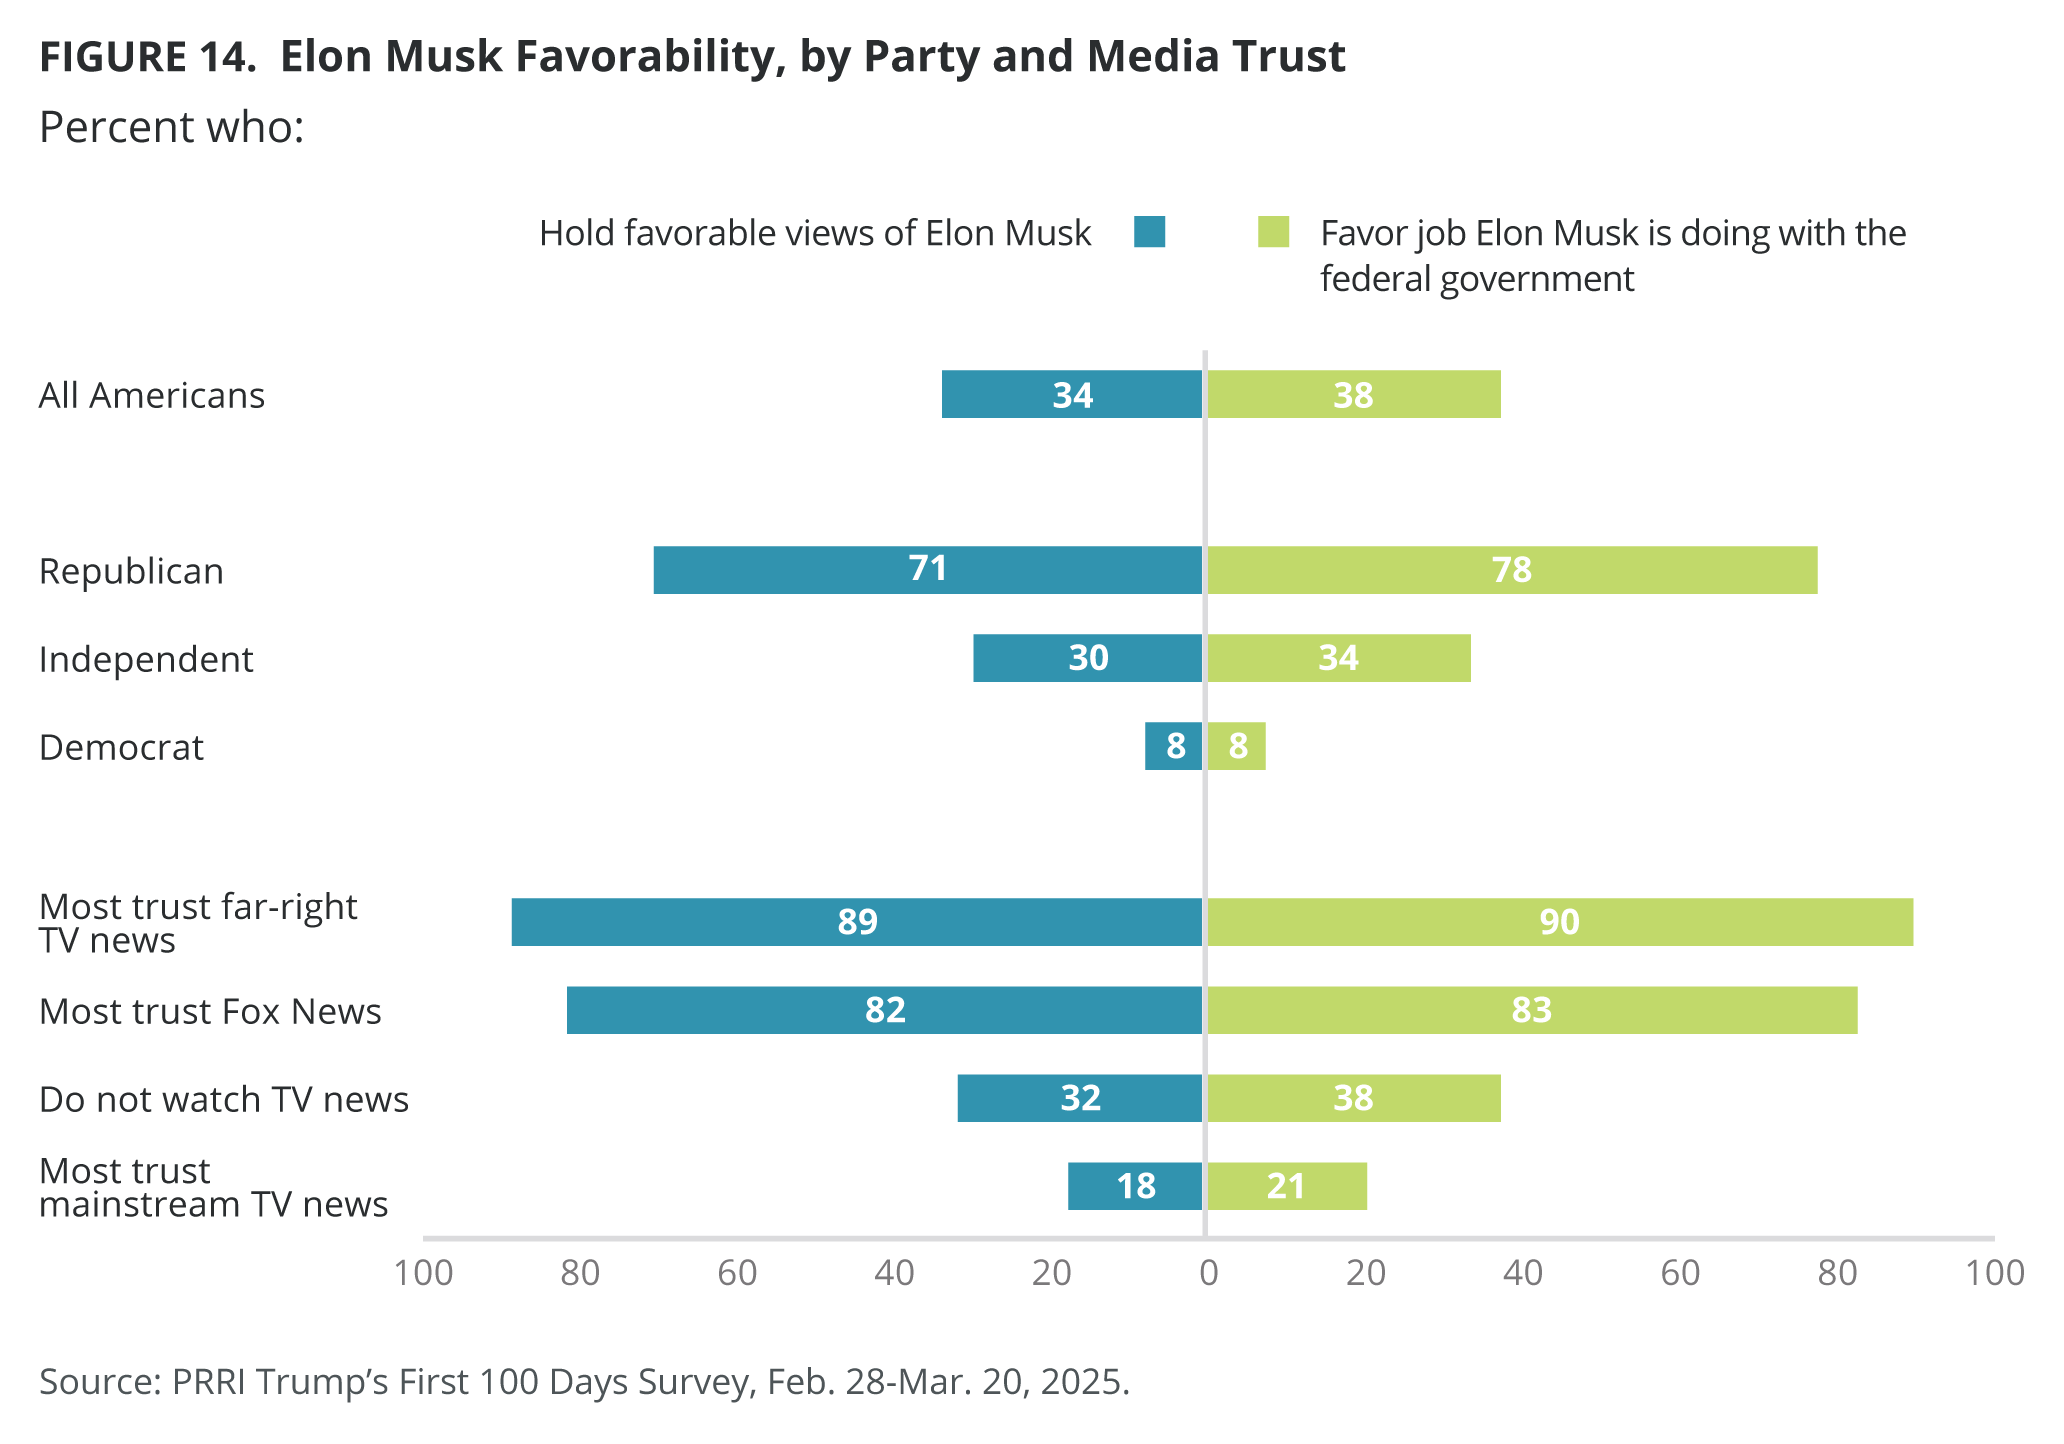
- Just 38% of Americans approve of the job Musk is doing within the federal government — though his work is most approved by Republicans (78%) and Americans who watch Fox News (83%) or far-right TV news sources (90%).
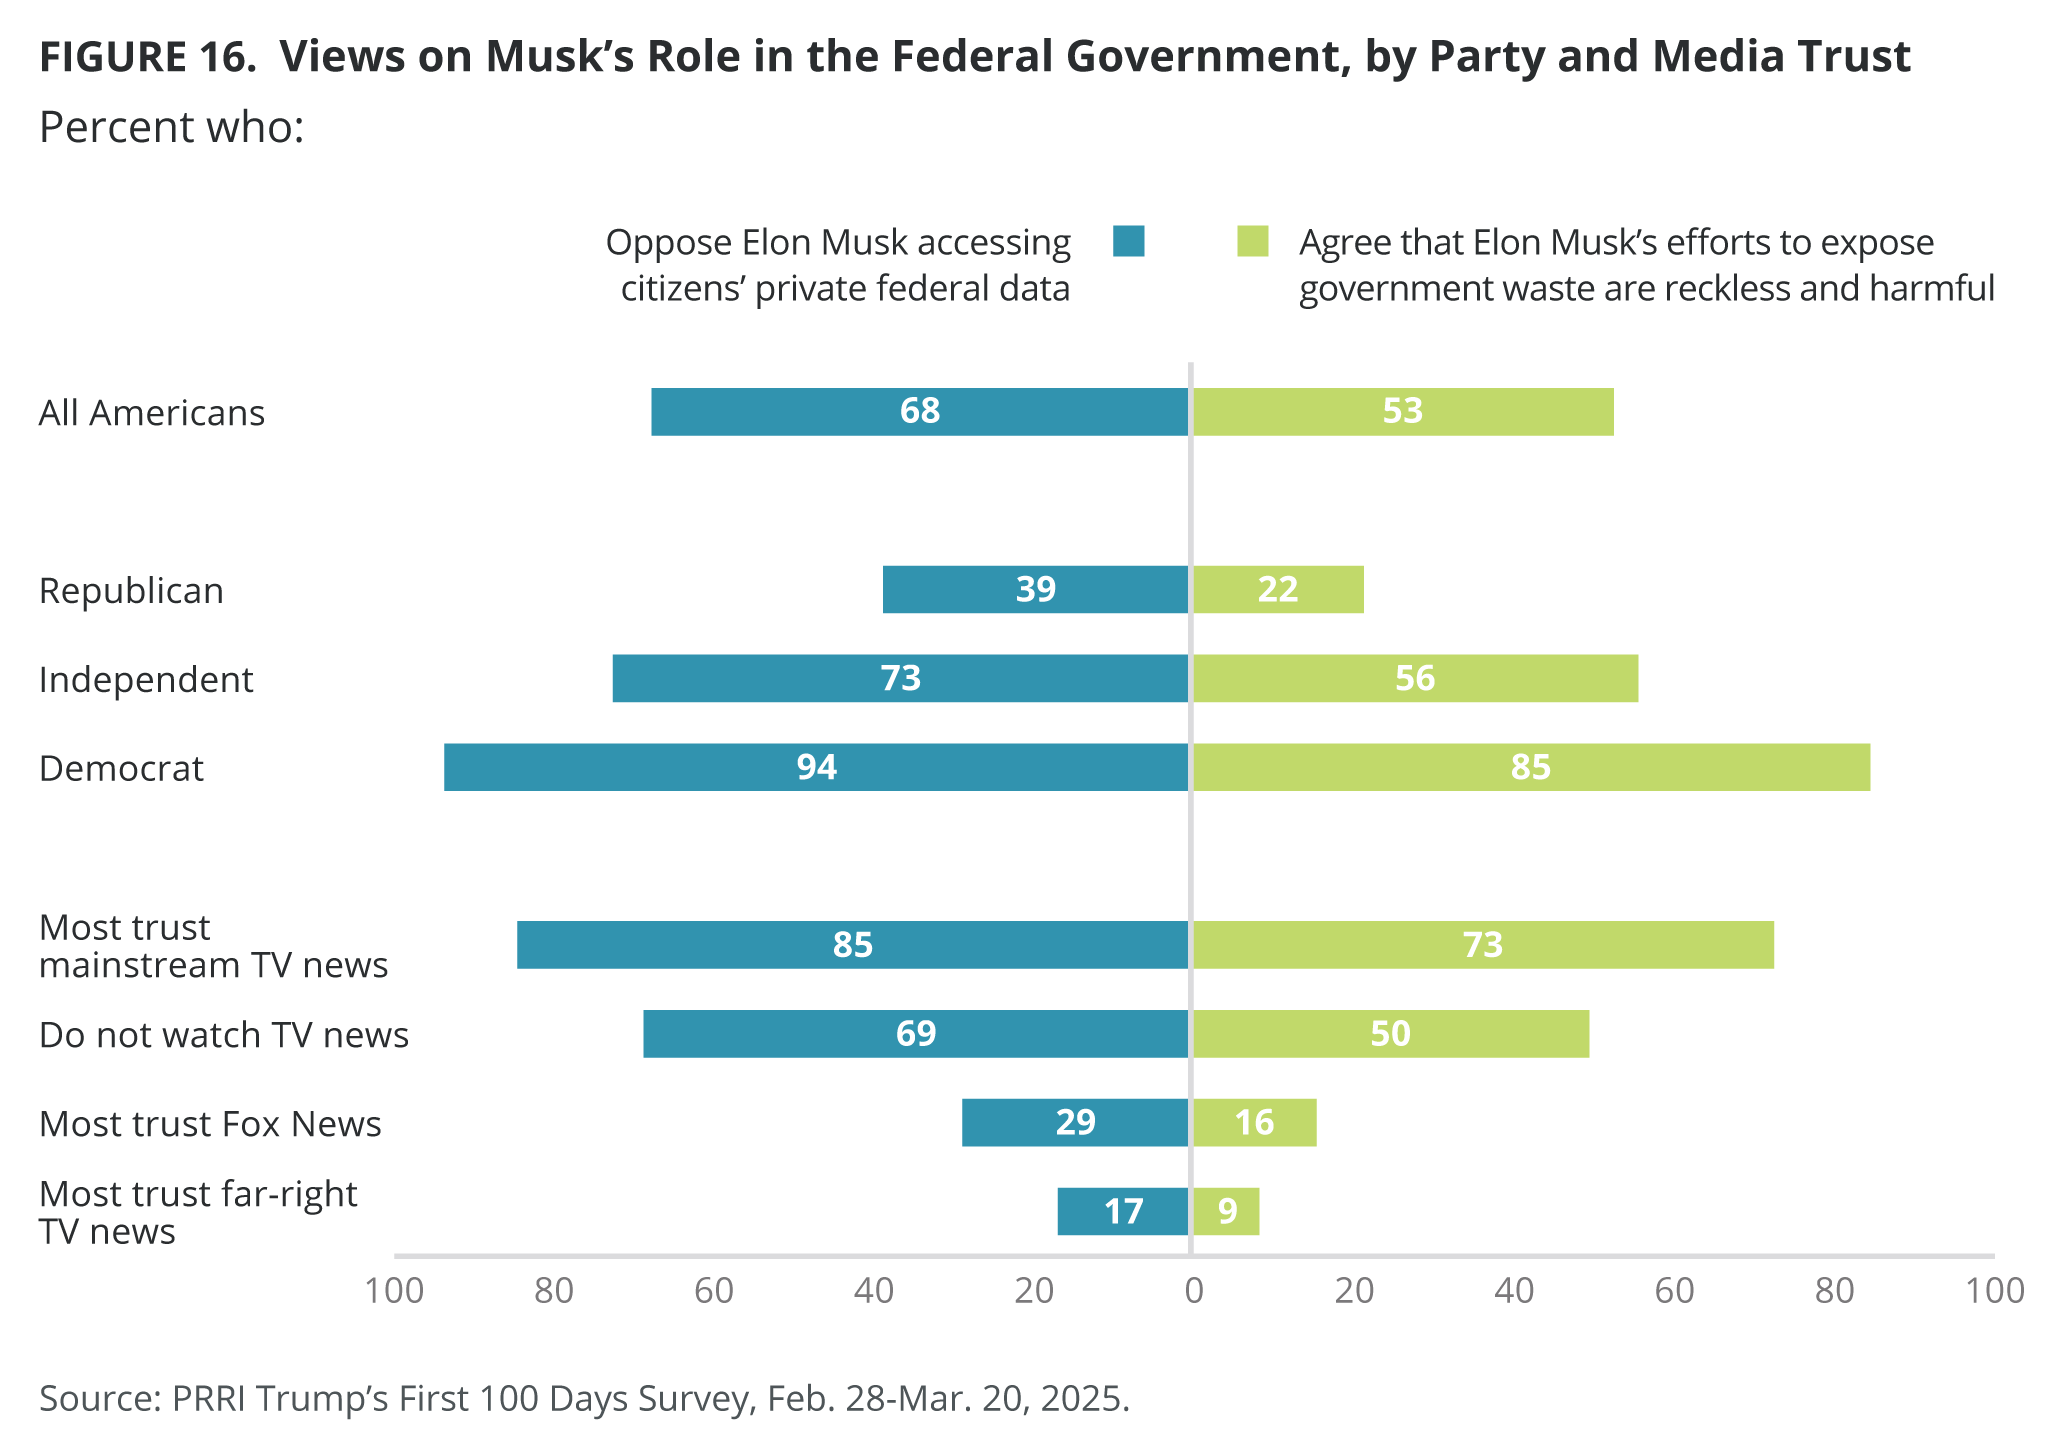
- Most Americans oppose allowing Musk to access private data about American citizens at federal government agencies such as the IRS or the Social Security Administration (68% vs. 28%).
- A majority of Americans (53%) agree that Musk’s attempts to find waste and fraud in federal government agencies are reckless and doing more harm than good; Democrats (85%) are almost four times as likely as Republicans to agree (22%).
Support for political violence has declined slightly from its peak in September 2023; few Americans hold favorable views of Christian nationalism.
- Most Americans (81%) disagree that “because things have gotten so far off track, true American patriots may have to resort to violence in order to save our country,” compared with 14% of those who agree. Agreement that patriots might have to resort to violence peaked in September 2023 at 23%.
- Support for Christian nationalism is associated with increased support for political violence in order to save the country: 28% of Americans who qualify as Adherents agree, followed closely by 22% of Sympathizers. Skeptics (12%) and Rejecters (8%) are less likely to support political violence.
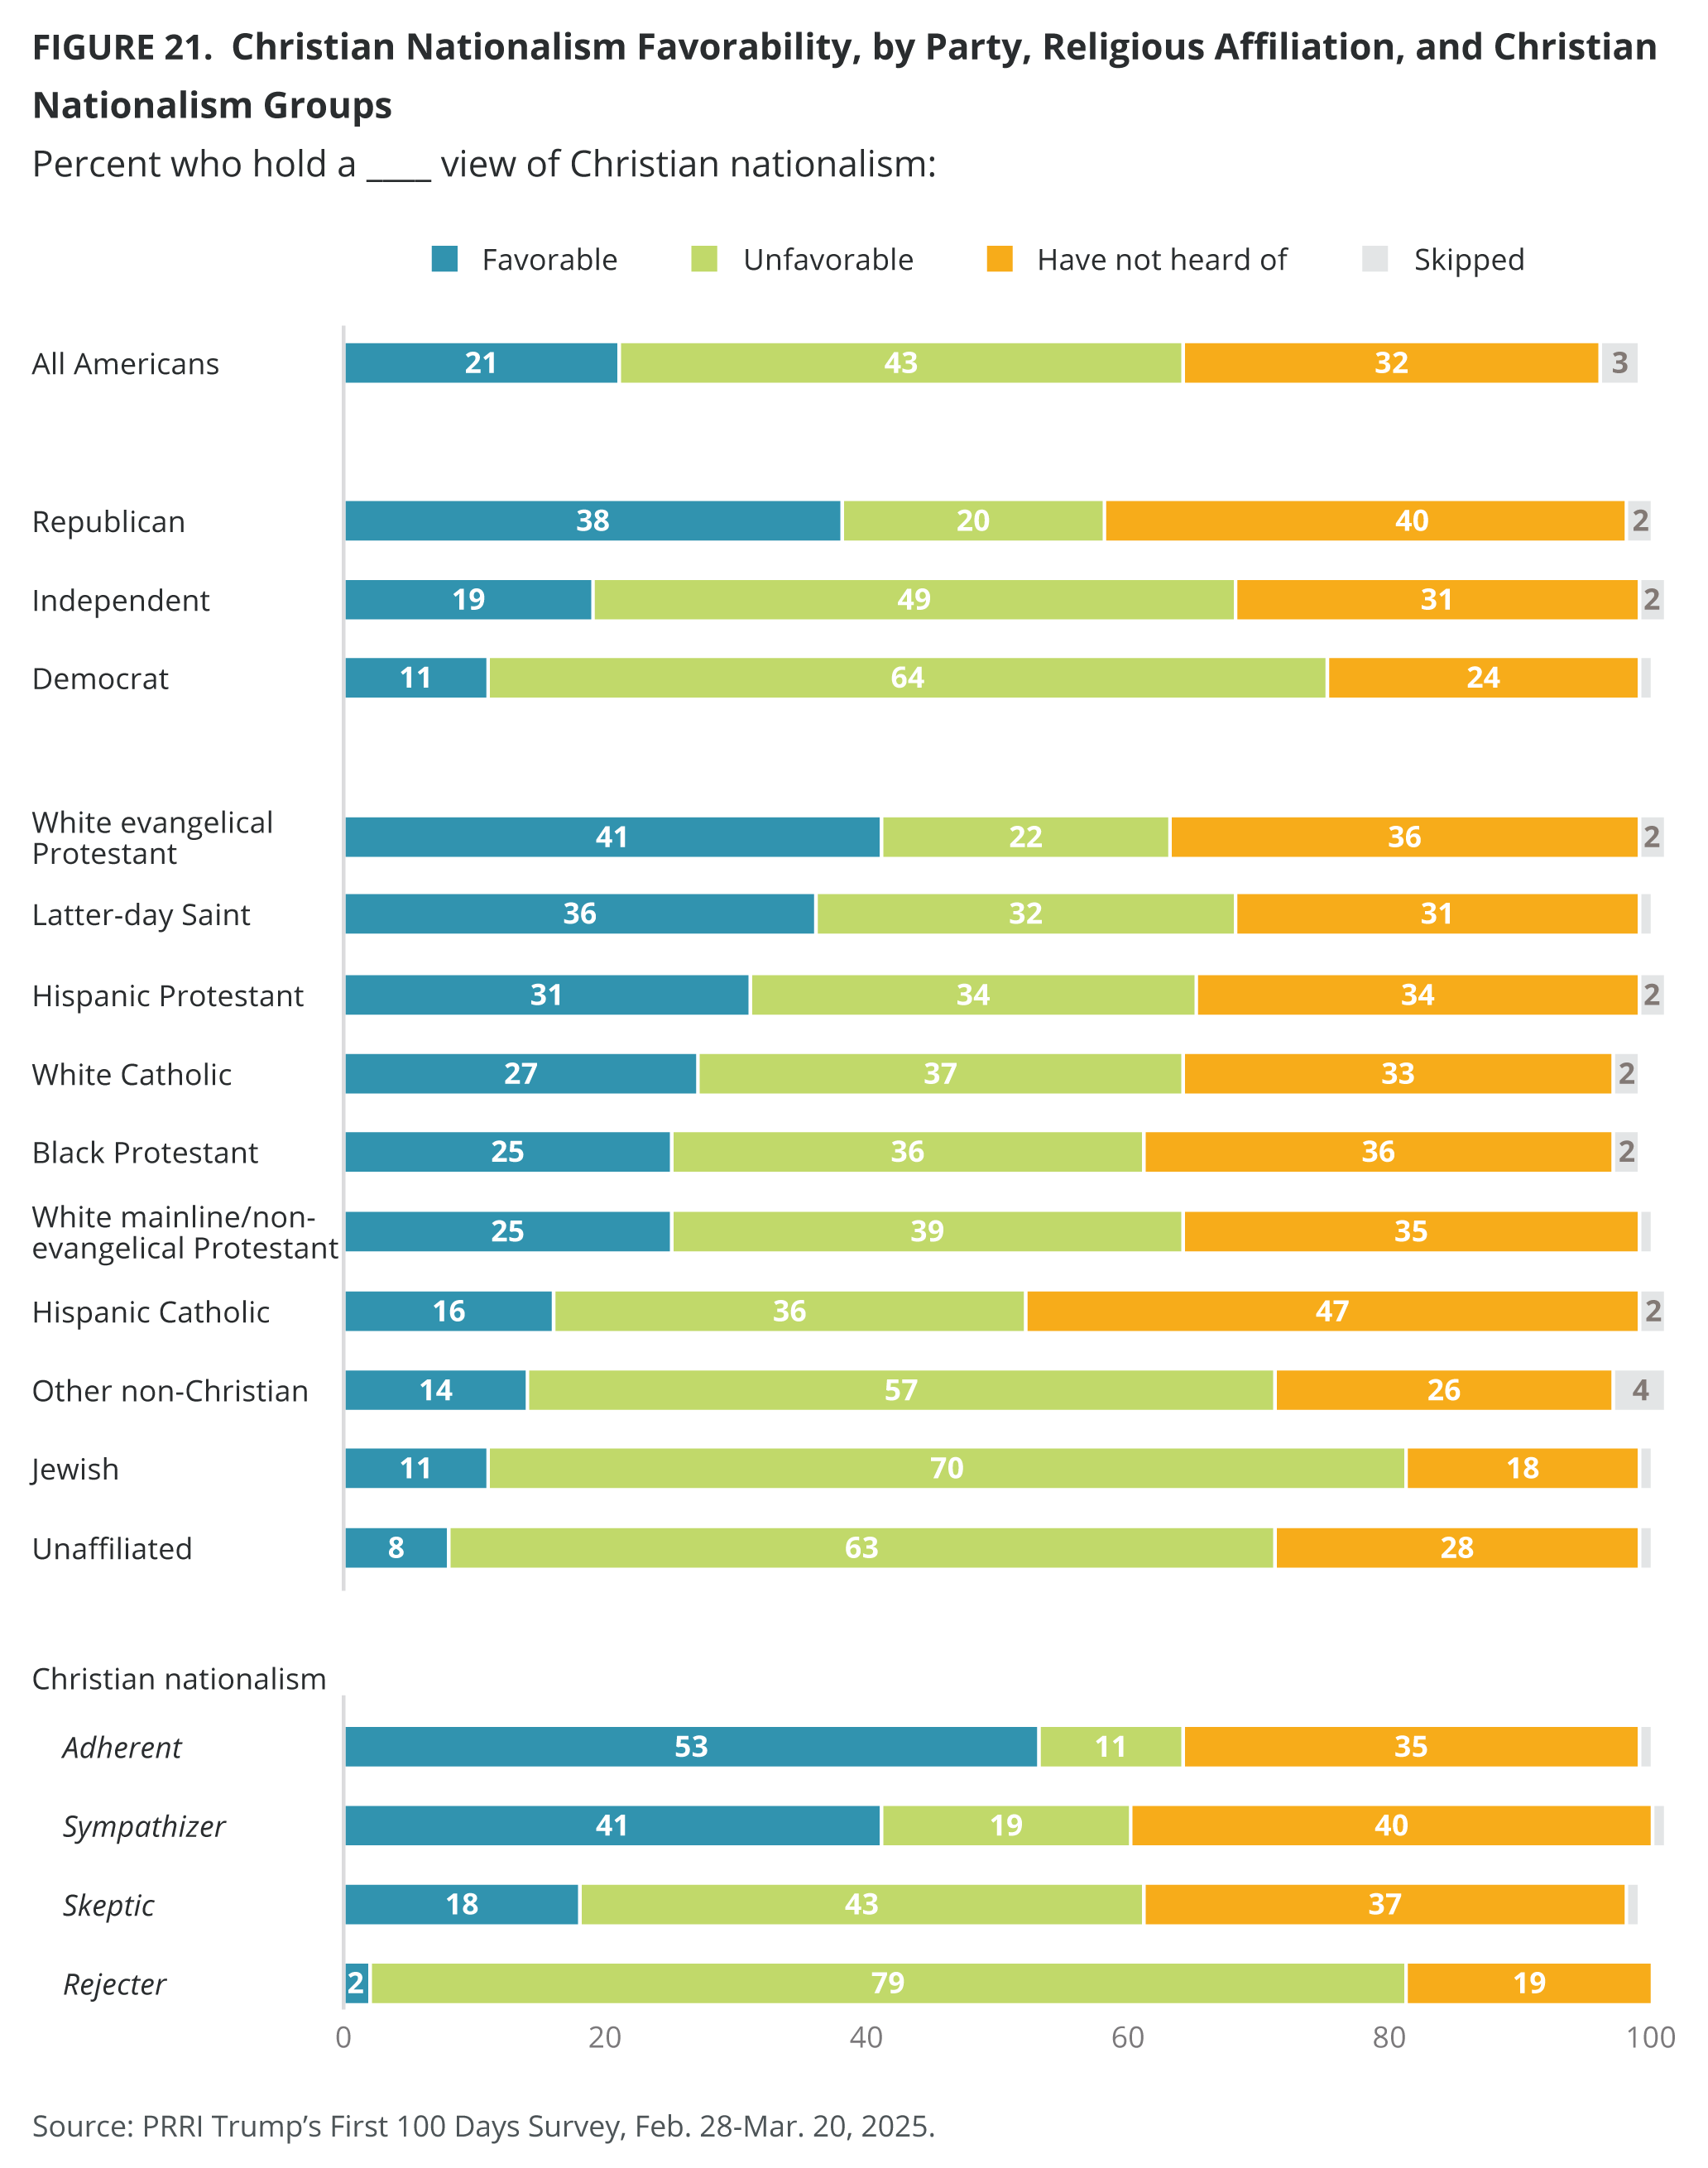
- Around two in ten Americans (21%) say they hold a favorable view of Christian nationalism, compared with over four in ten who hold an unfavorable view (43%) and nearly one-third who have not heard of the term (32%).
Most Americans reject the idea that discrimination against Christians or white Americans has become as big a problem versus other groups.
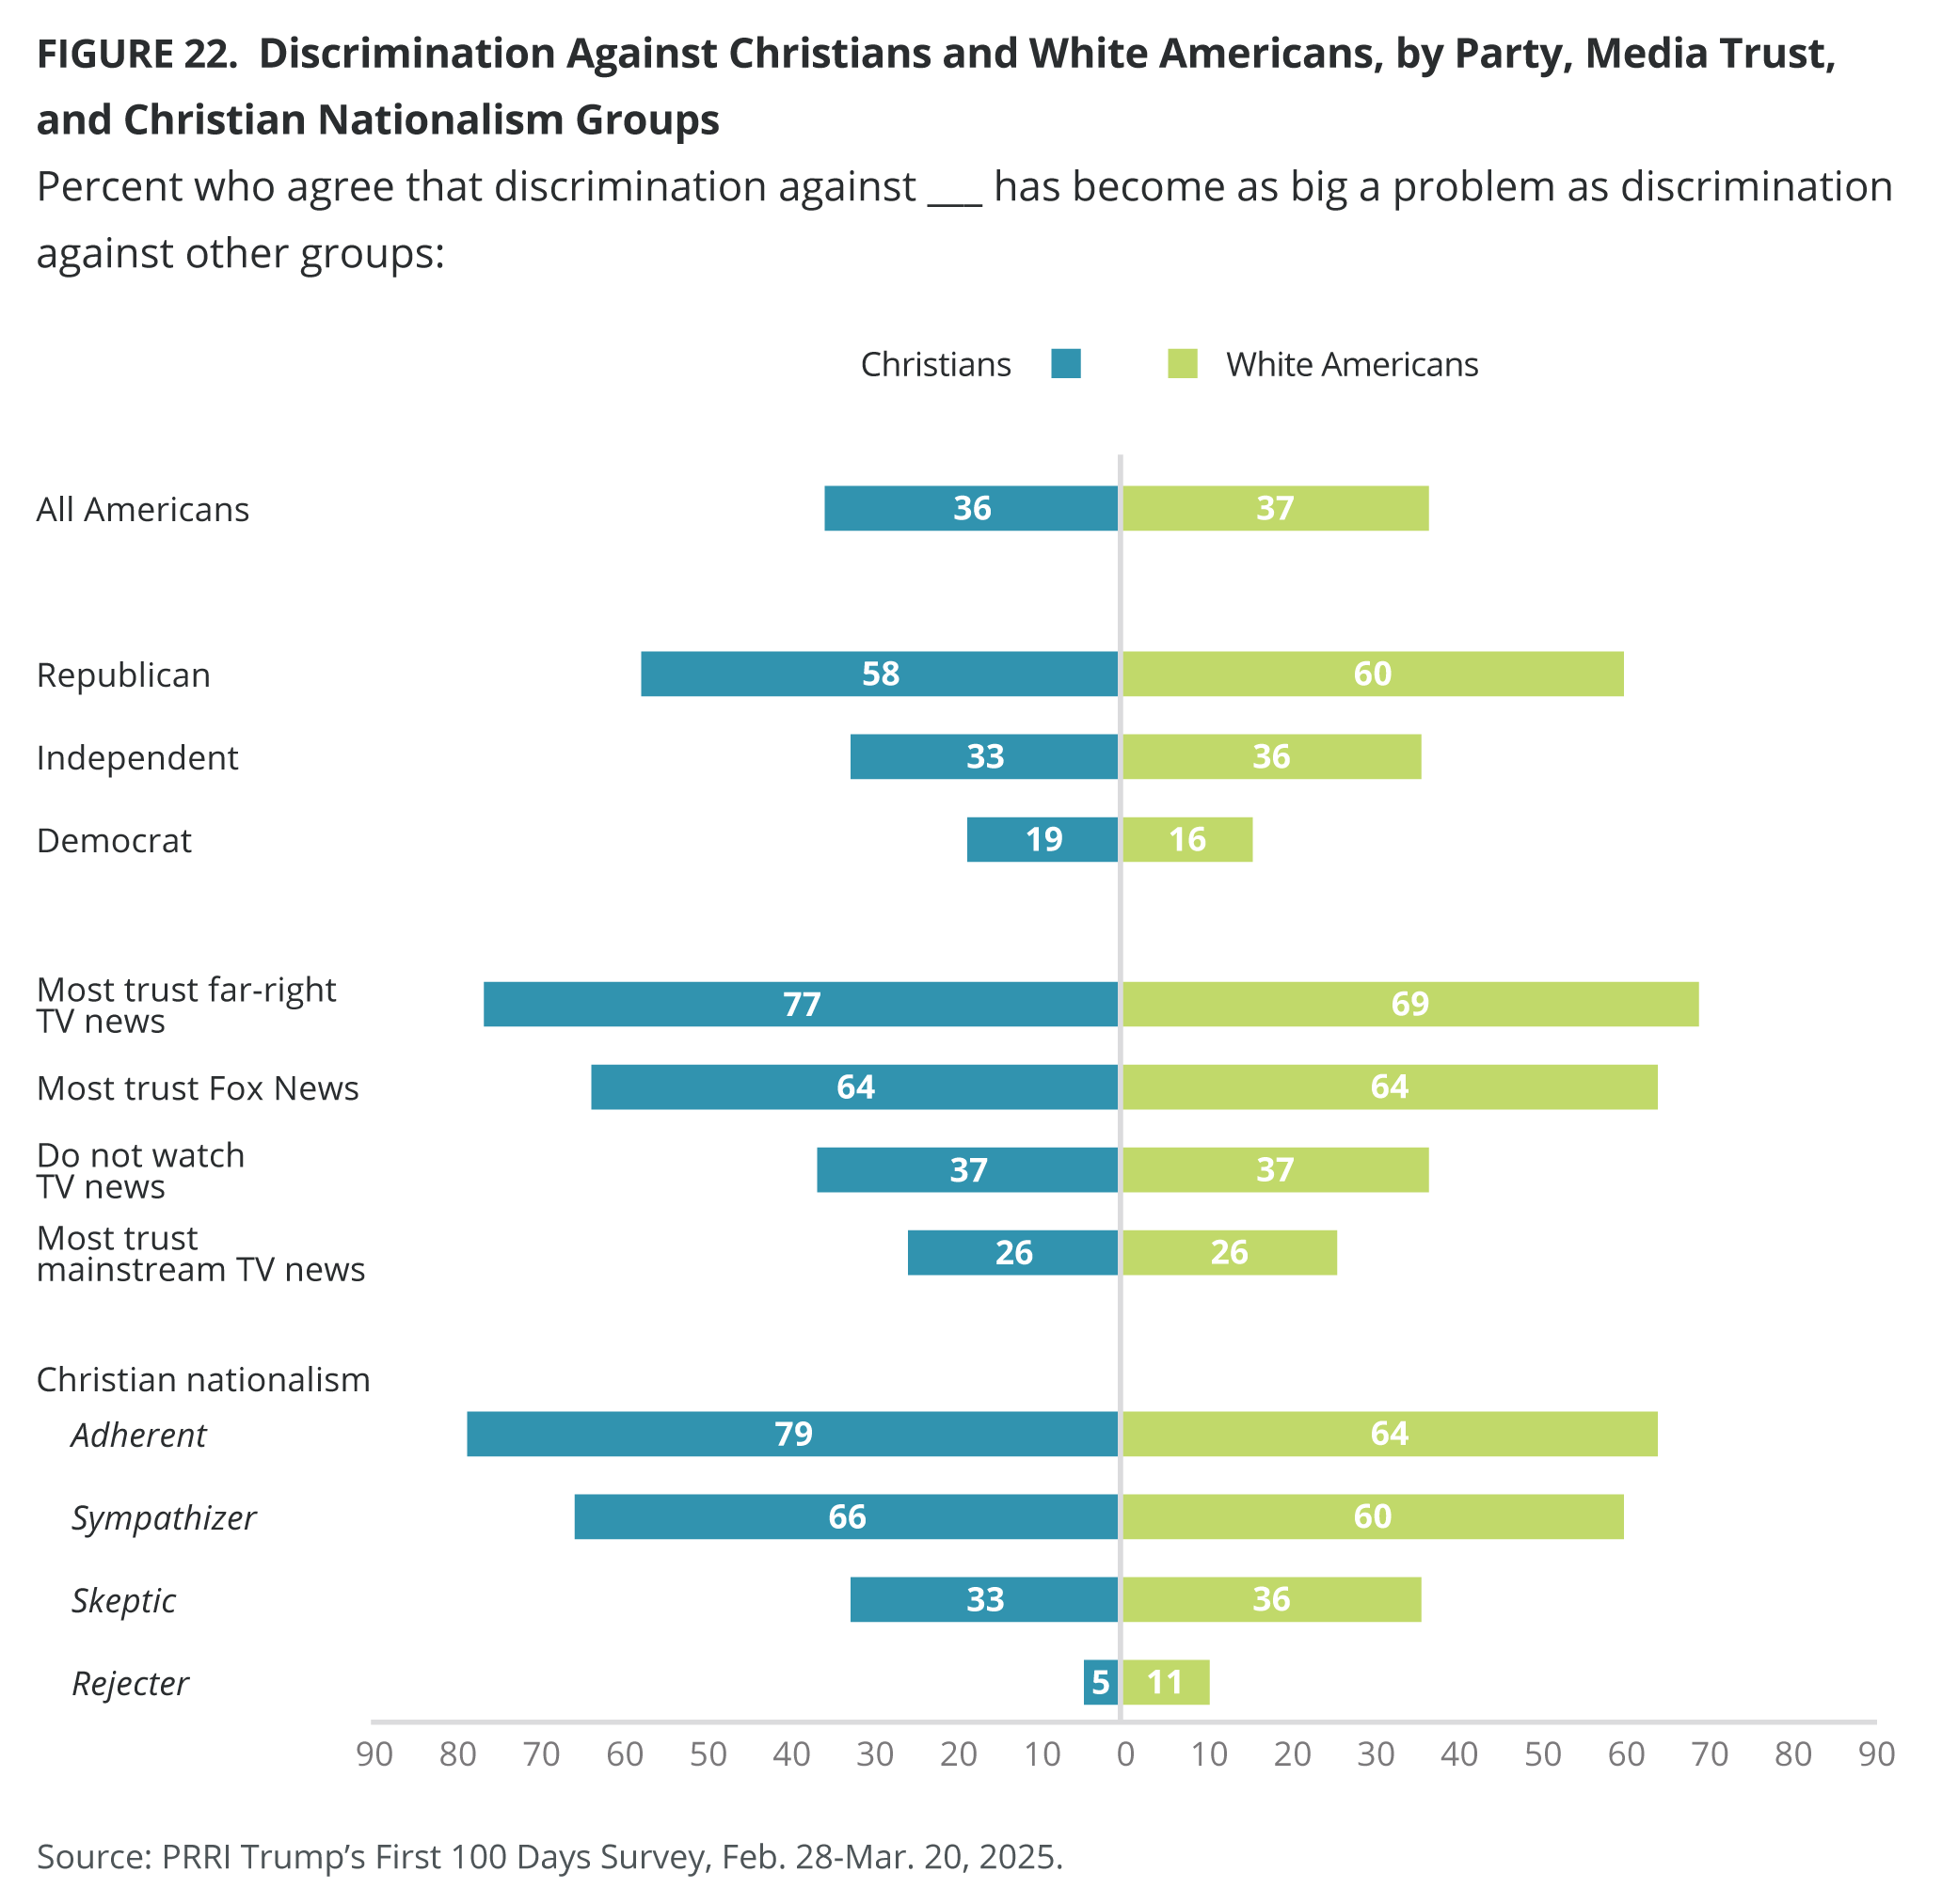
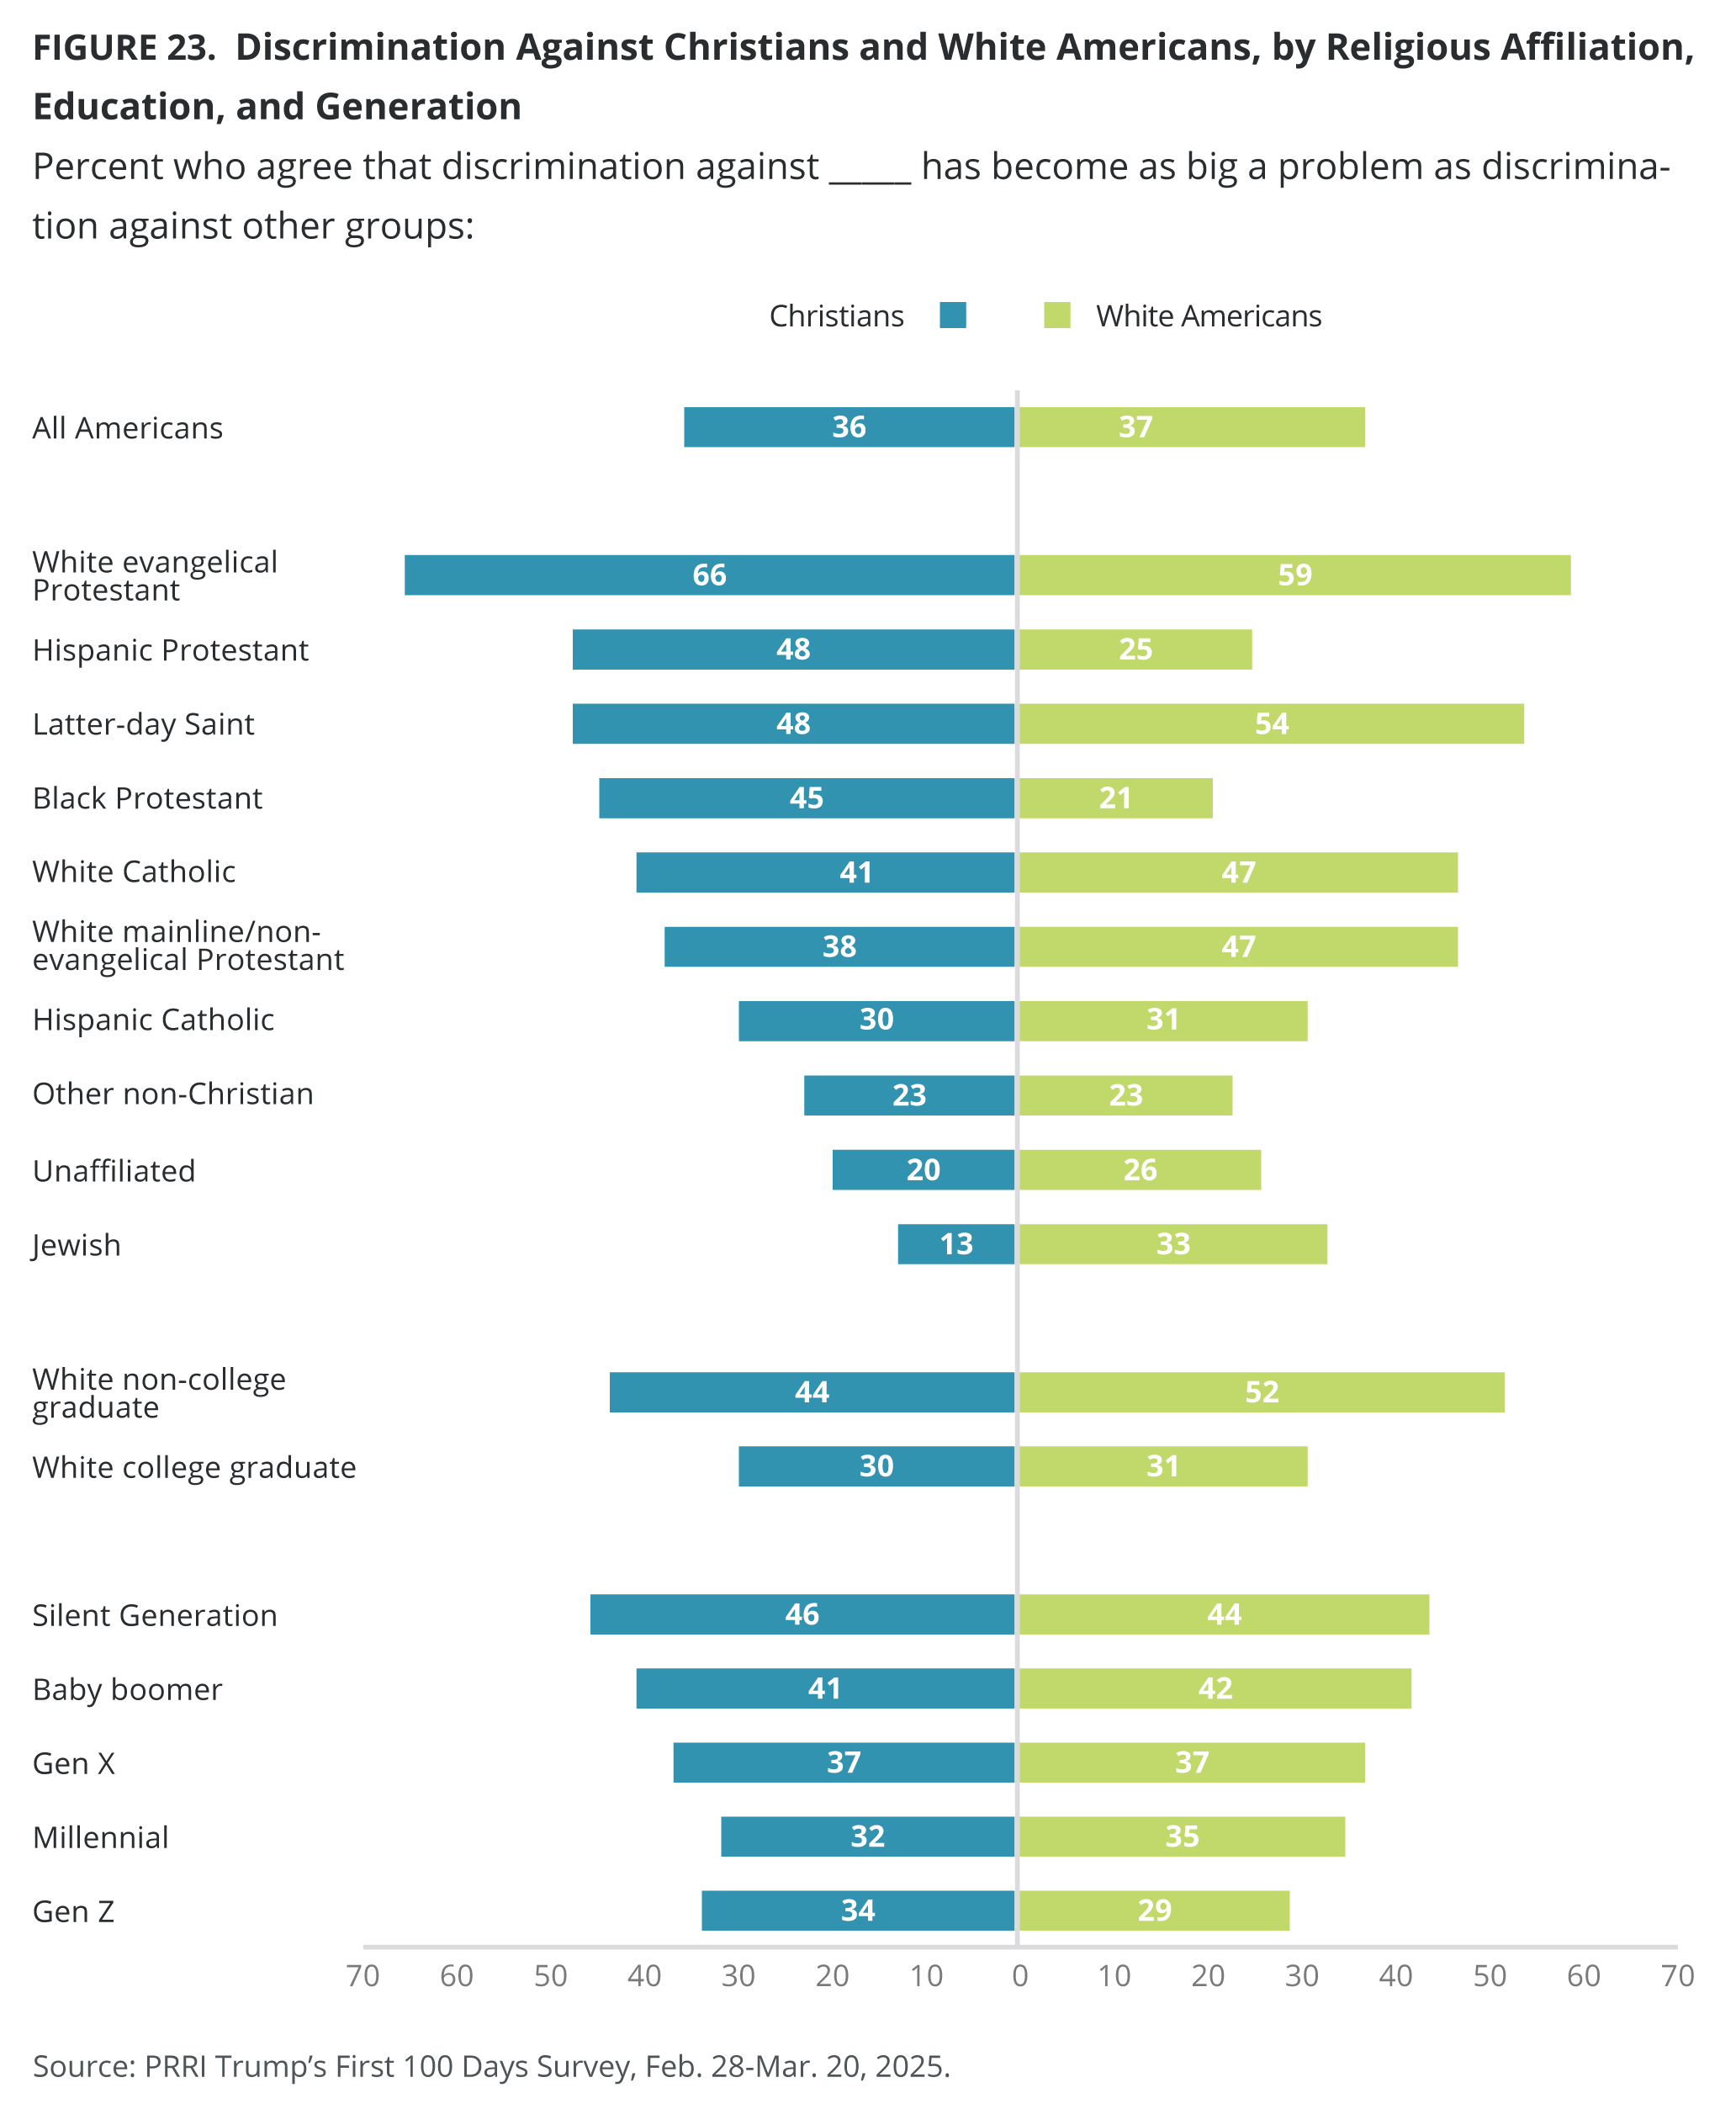
- Six in ten Americans disagree that discrimination against Christians (60%) and white Americans (60%) has become as big a problem as discrimination against other groups, while roughly six in ten Republicans agree (58% and 60%, respectively). White evangelical Protestants (66%) are the only religious group where the majority believe discrimination against Christians has become as big a problem as discrimination against other groups and 59% say the same about white Americans.
- Most Americans who qualify as Christian nationalism Adherents (79% and 64%) and Sympathizers (66% and 60%) agree that discrimination against Christians and white Americans is as big an issue as discrimination against other groups.
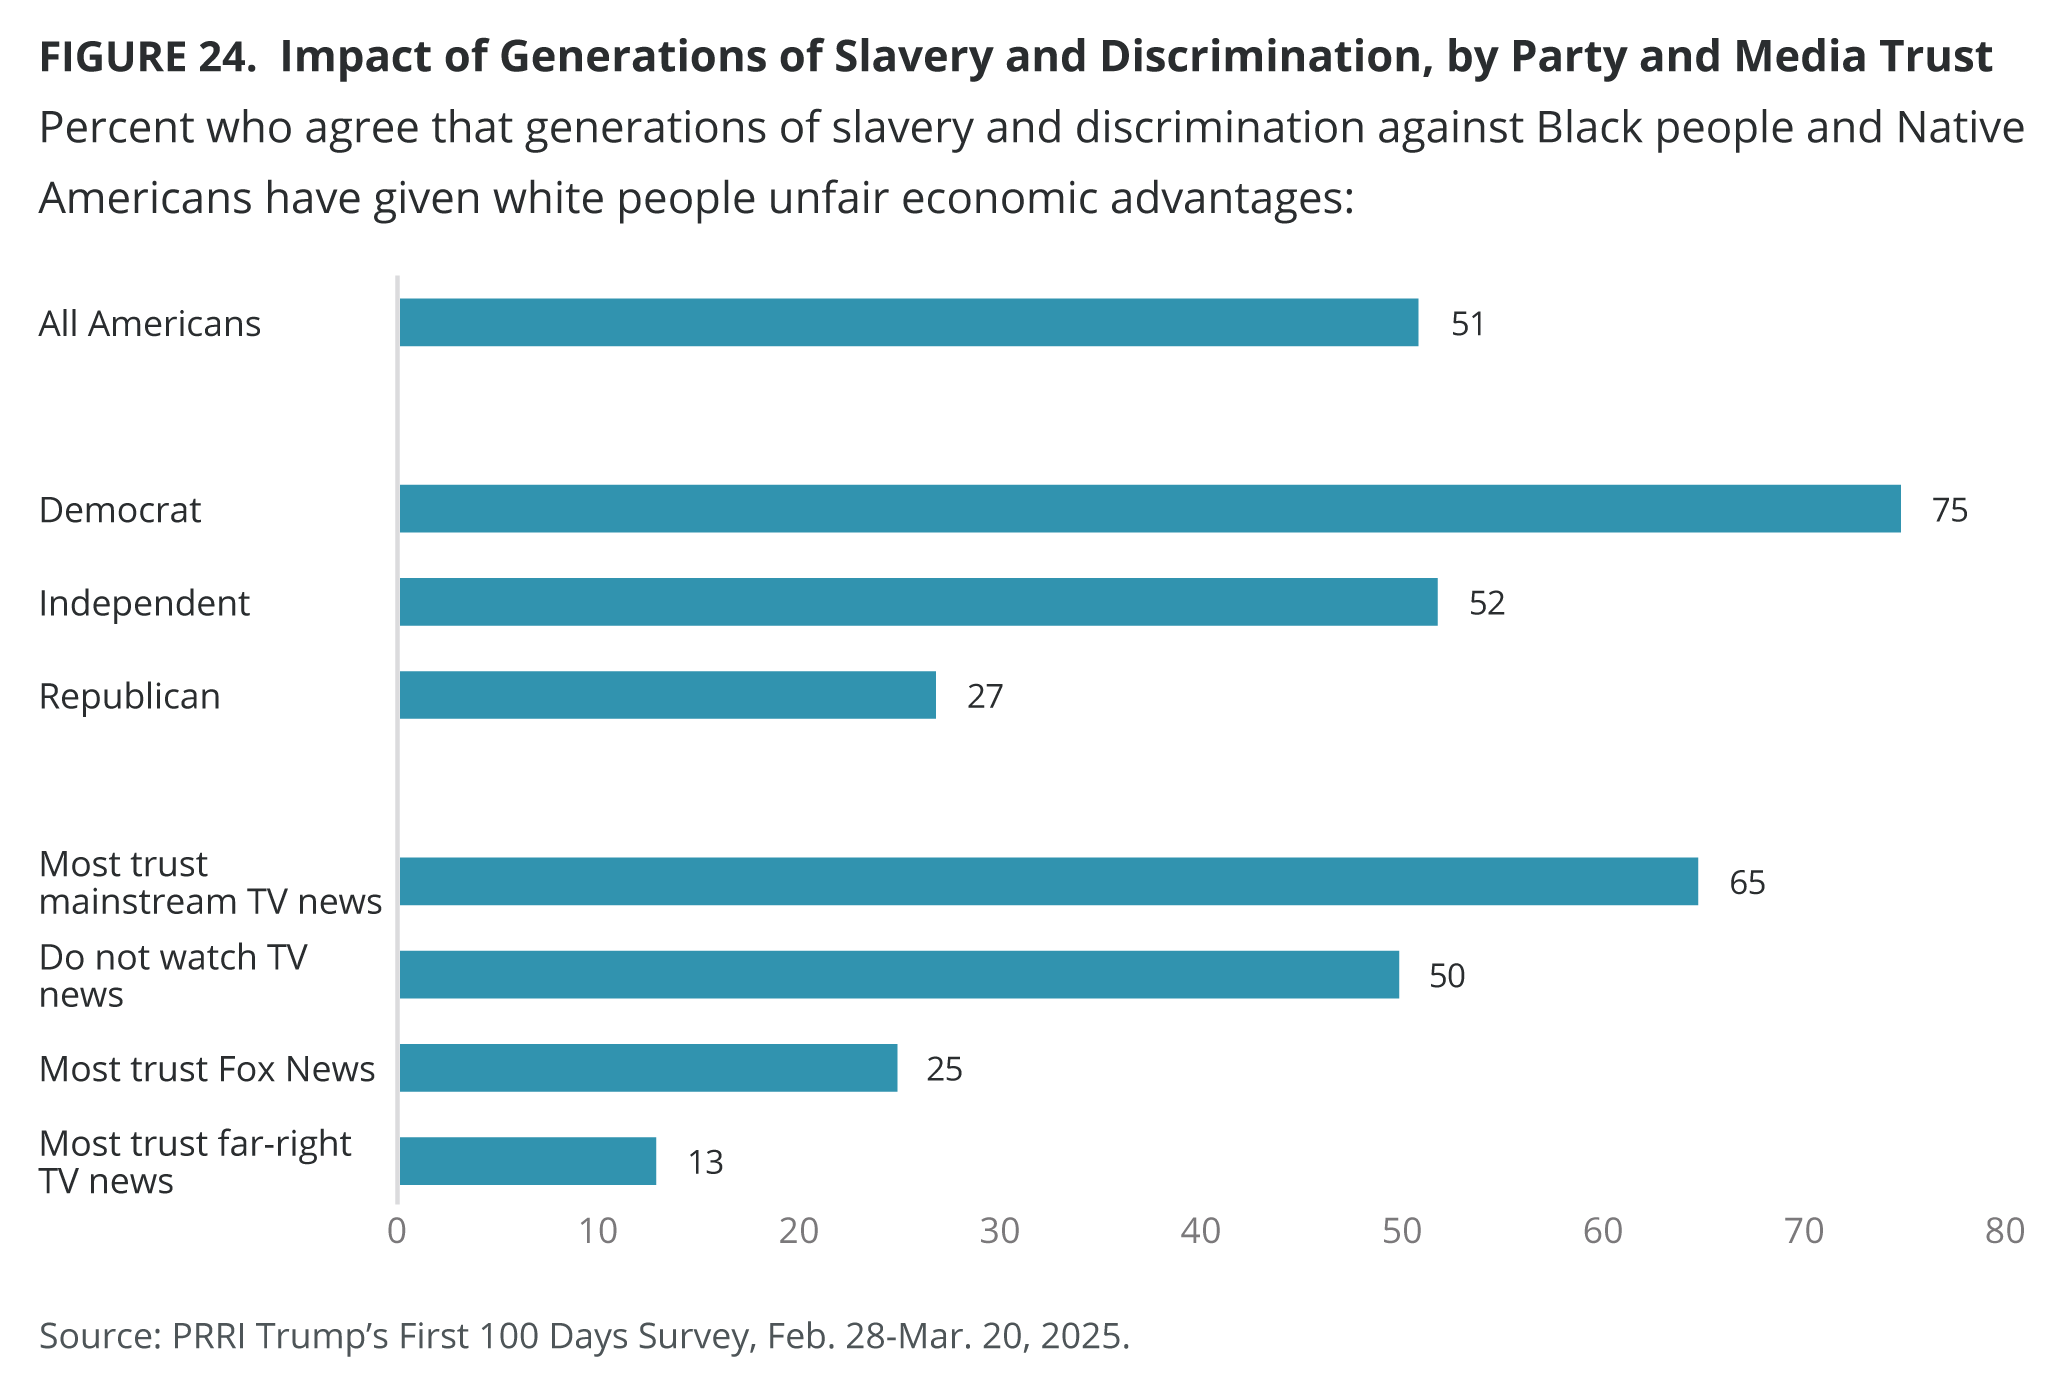
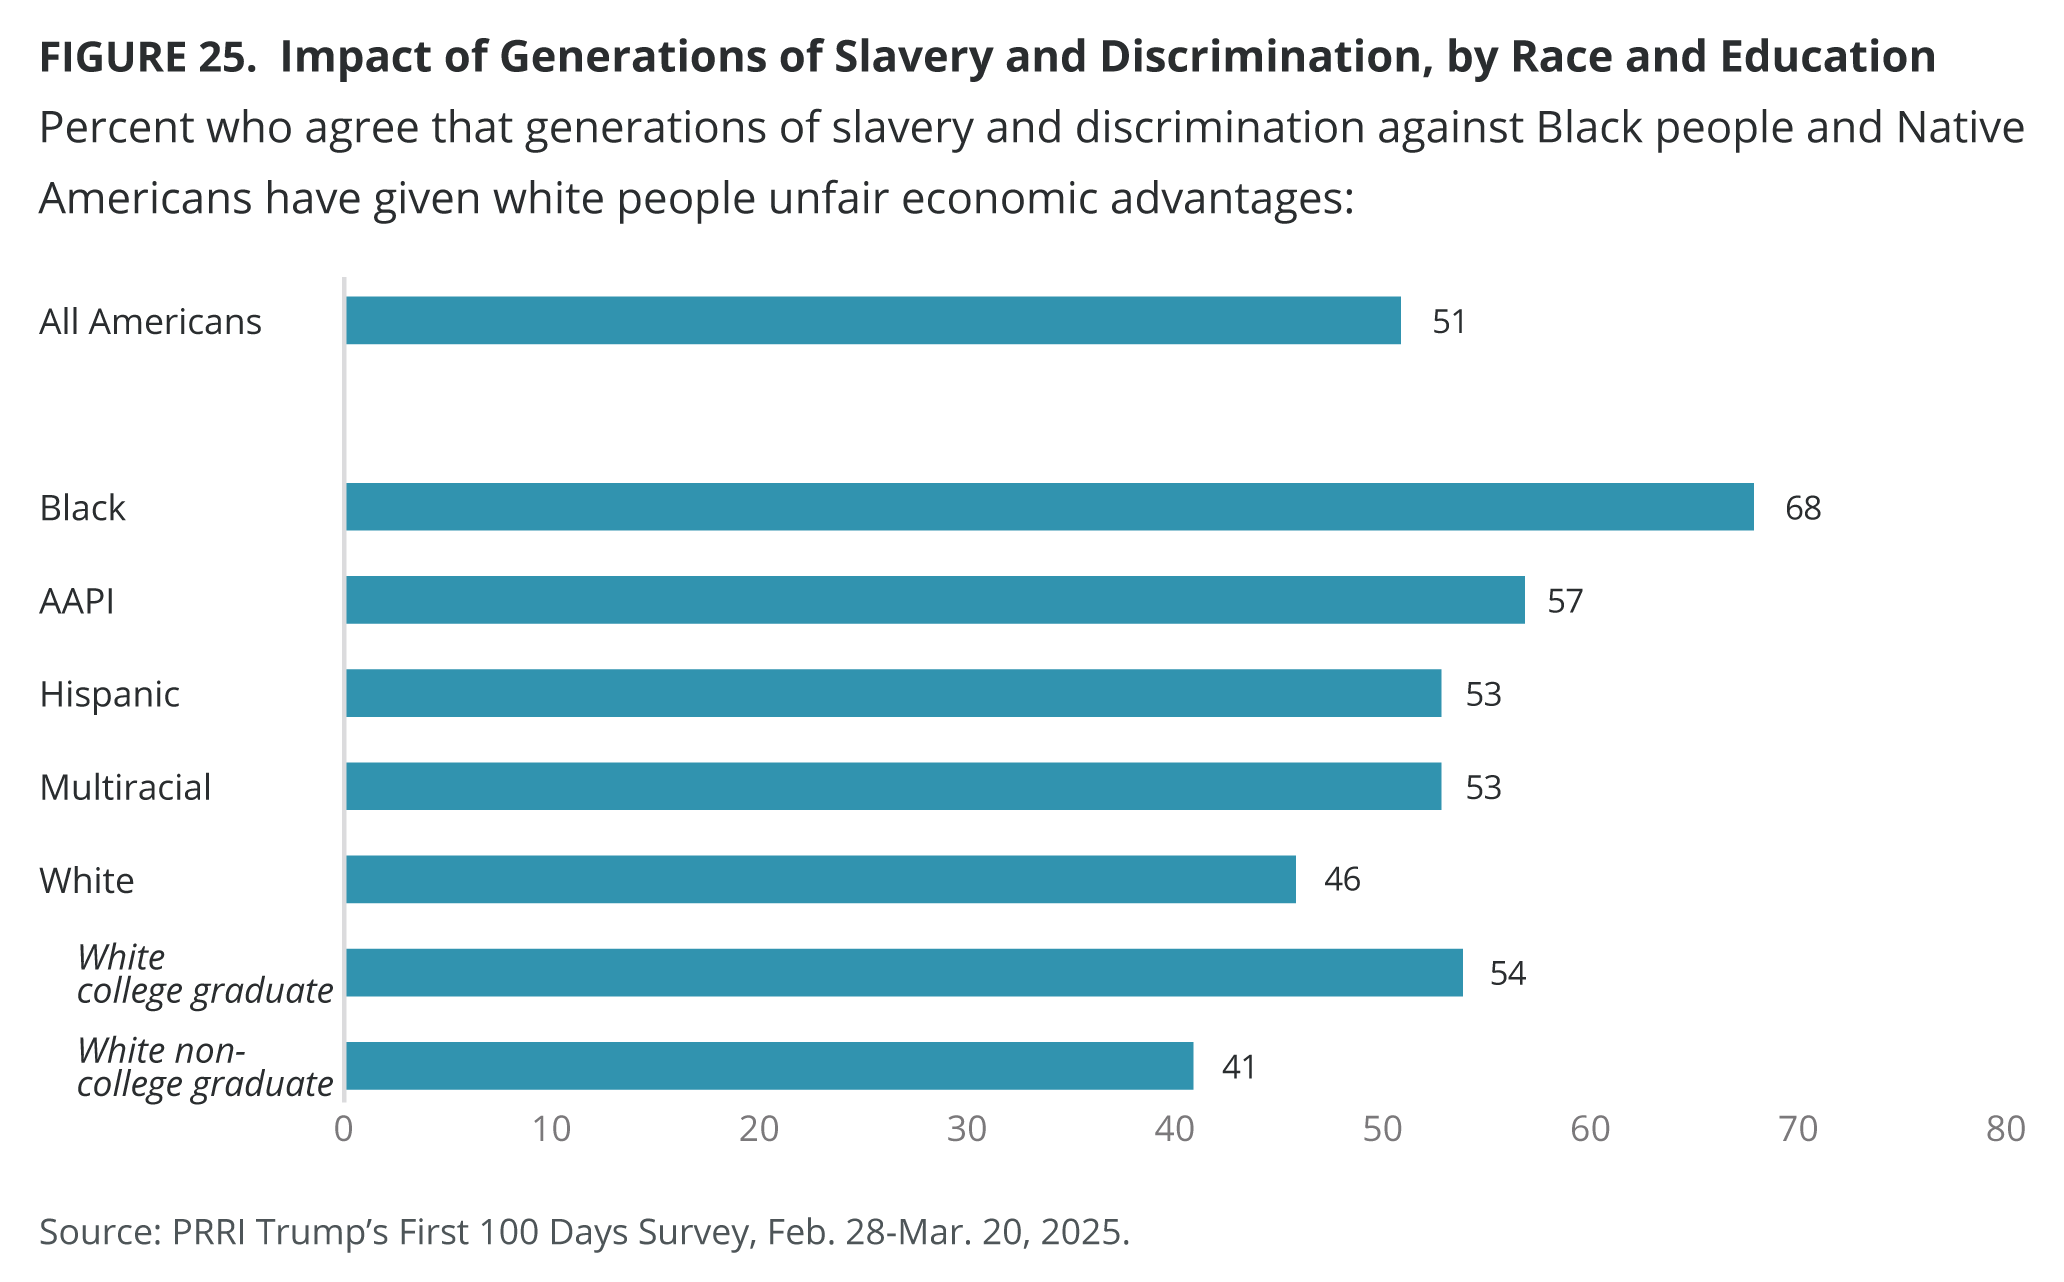
- Over half of Americans (51%) — 75% of Democrats vs. 27% of Republicans — agree with the idea that generations of slavery and discrimination against Black people and Native Americans have given white people unfair economic advantages, compared with 45% who disagree.
- Americans (86%) are far more likely to agree with the statement “We should teach American history that includes both our best achievements and our worst mistakes” than the statement “We should teach American history that only focuses on what makes this country exceptional and great” (10%).
Most Americans generally support efforts to increase diversity in the workplace; at the same time, strong majorities of Americans are committed to a vision of America that is racially and religious diverse.
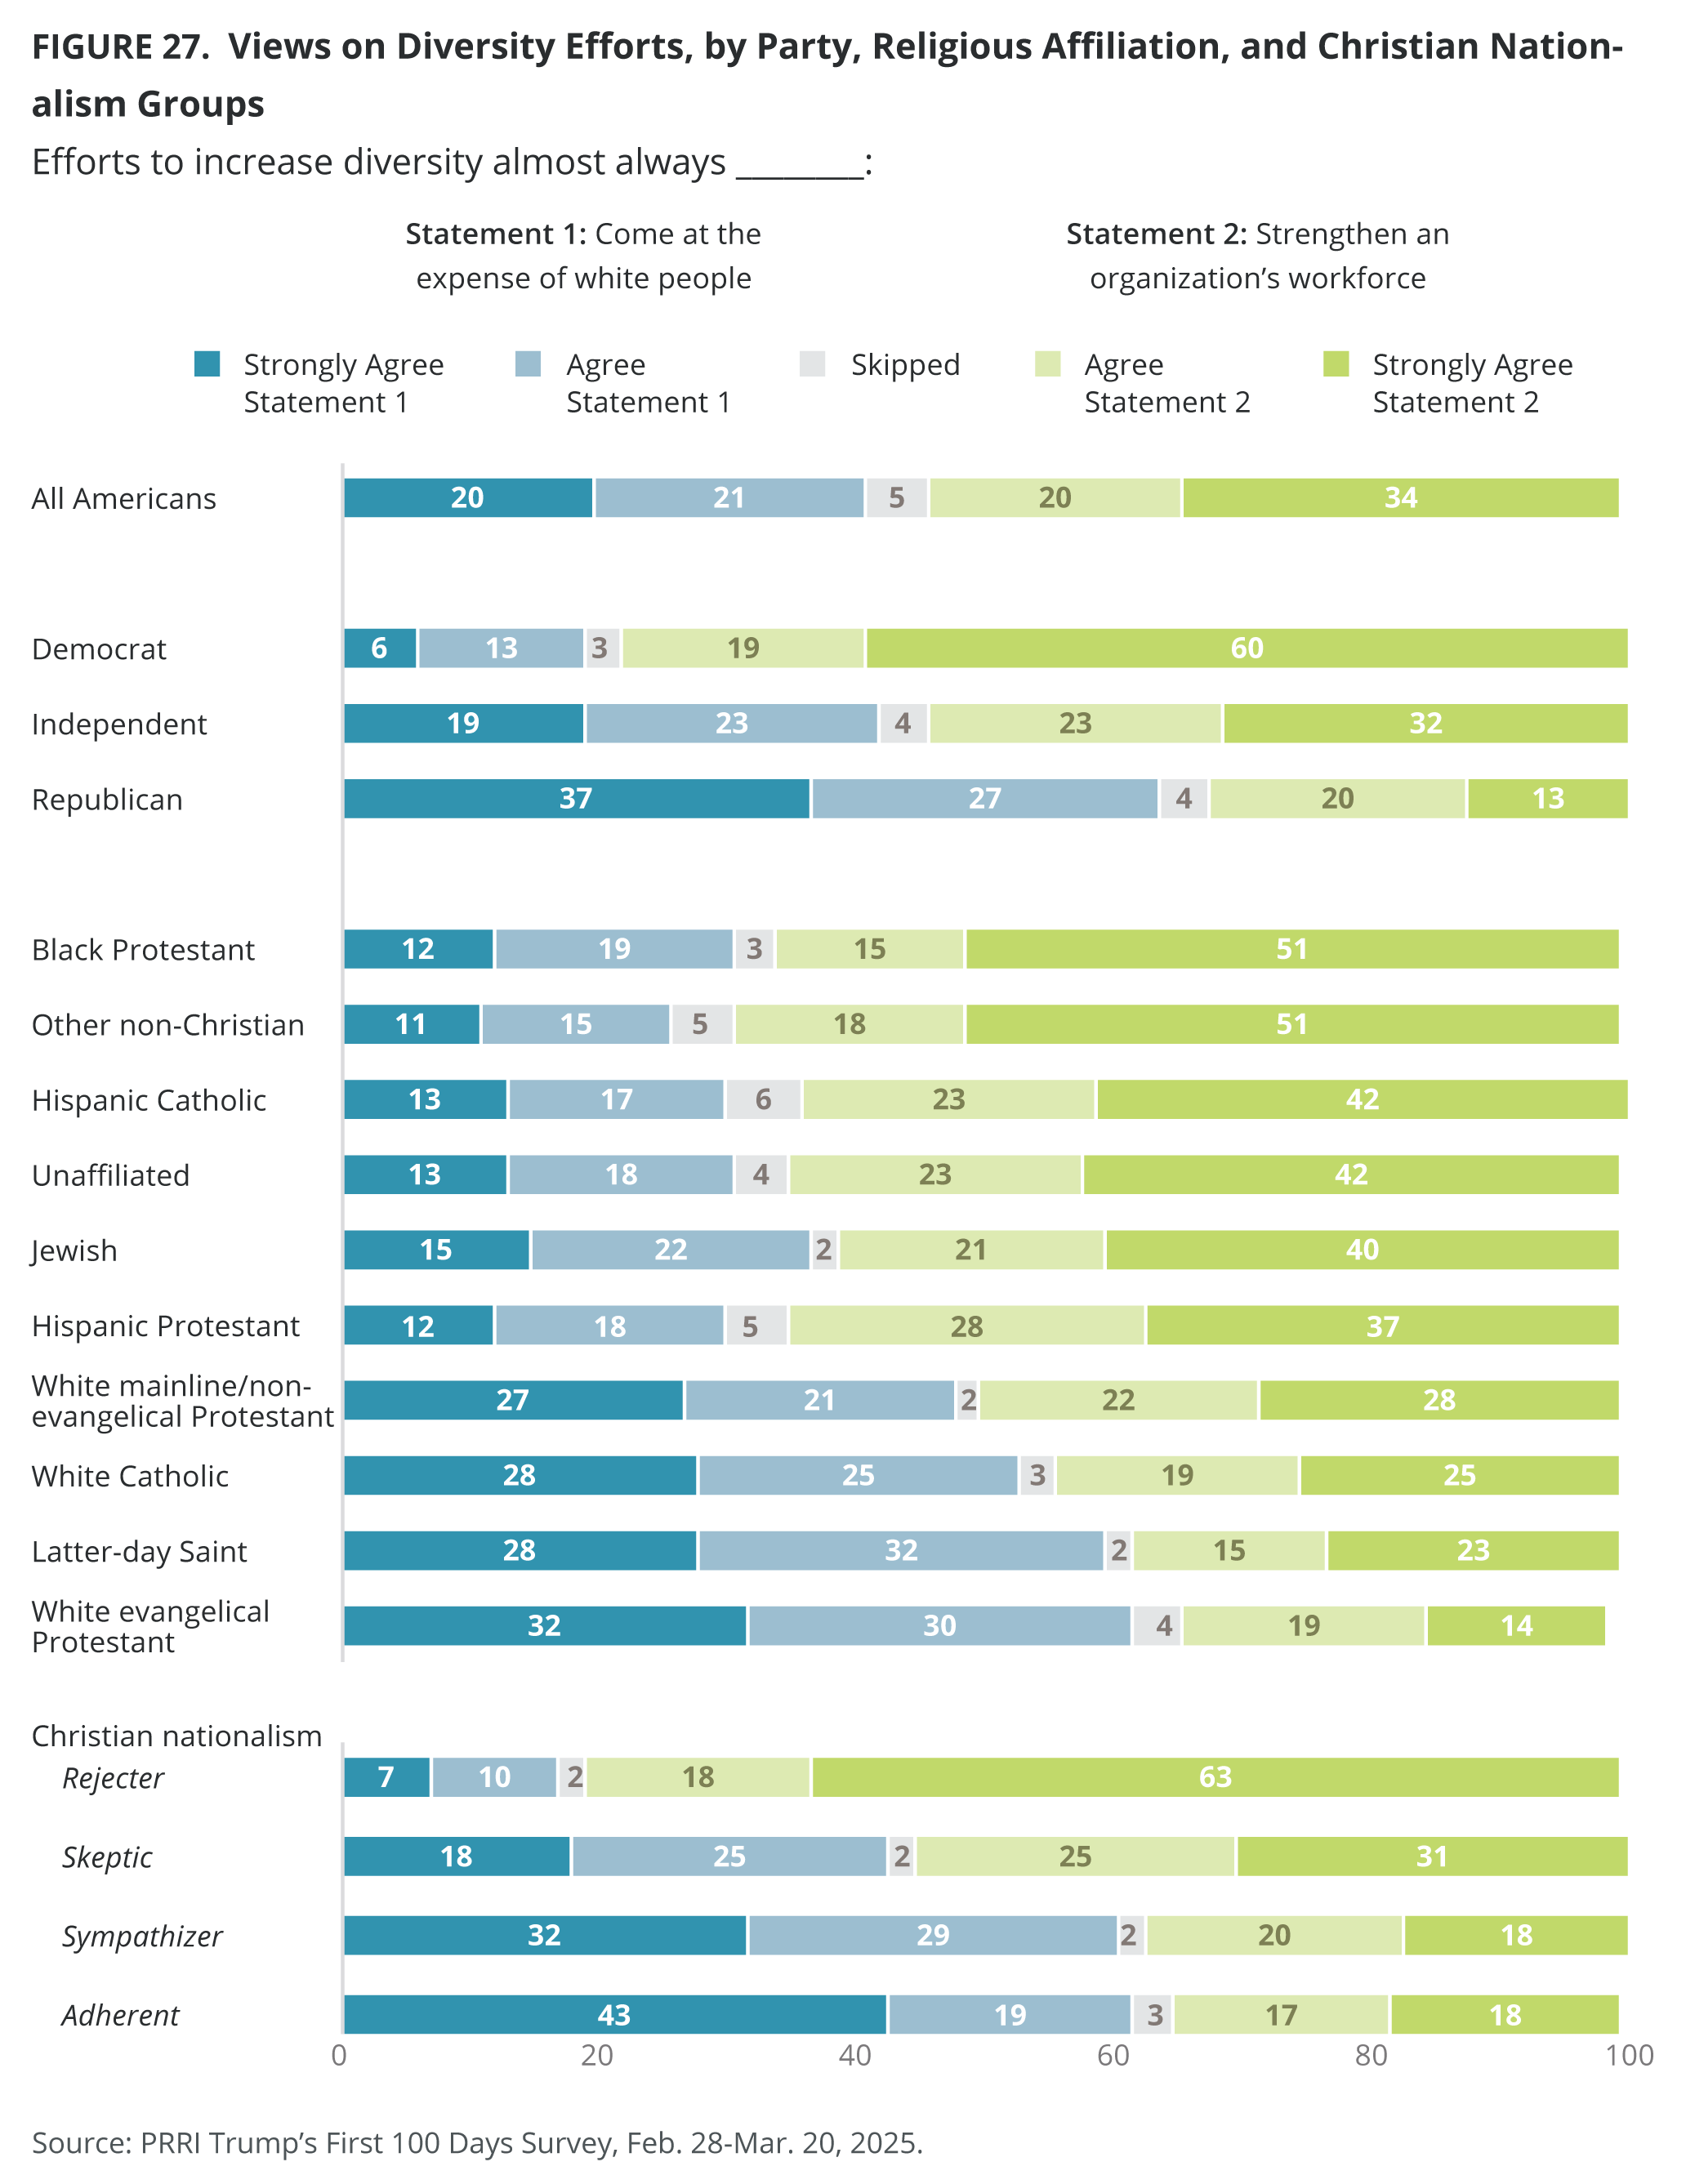
- A majority of Americans (54%) agree with the statement “Efforts to increase diversity almost always strengthen an organization’s workforce” than with the statement “Efforts to increase diversity always come at the expense of white people” (41%).
- Except for members of the Silent Generation (42%), the majority of each generation agree that diversity strengthens an organization.
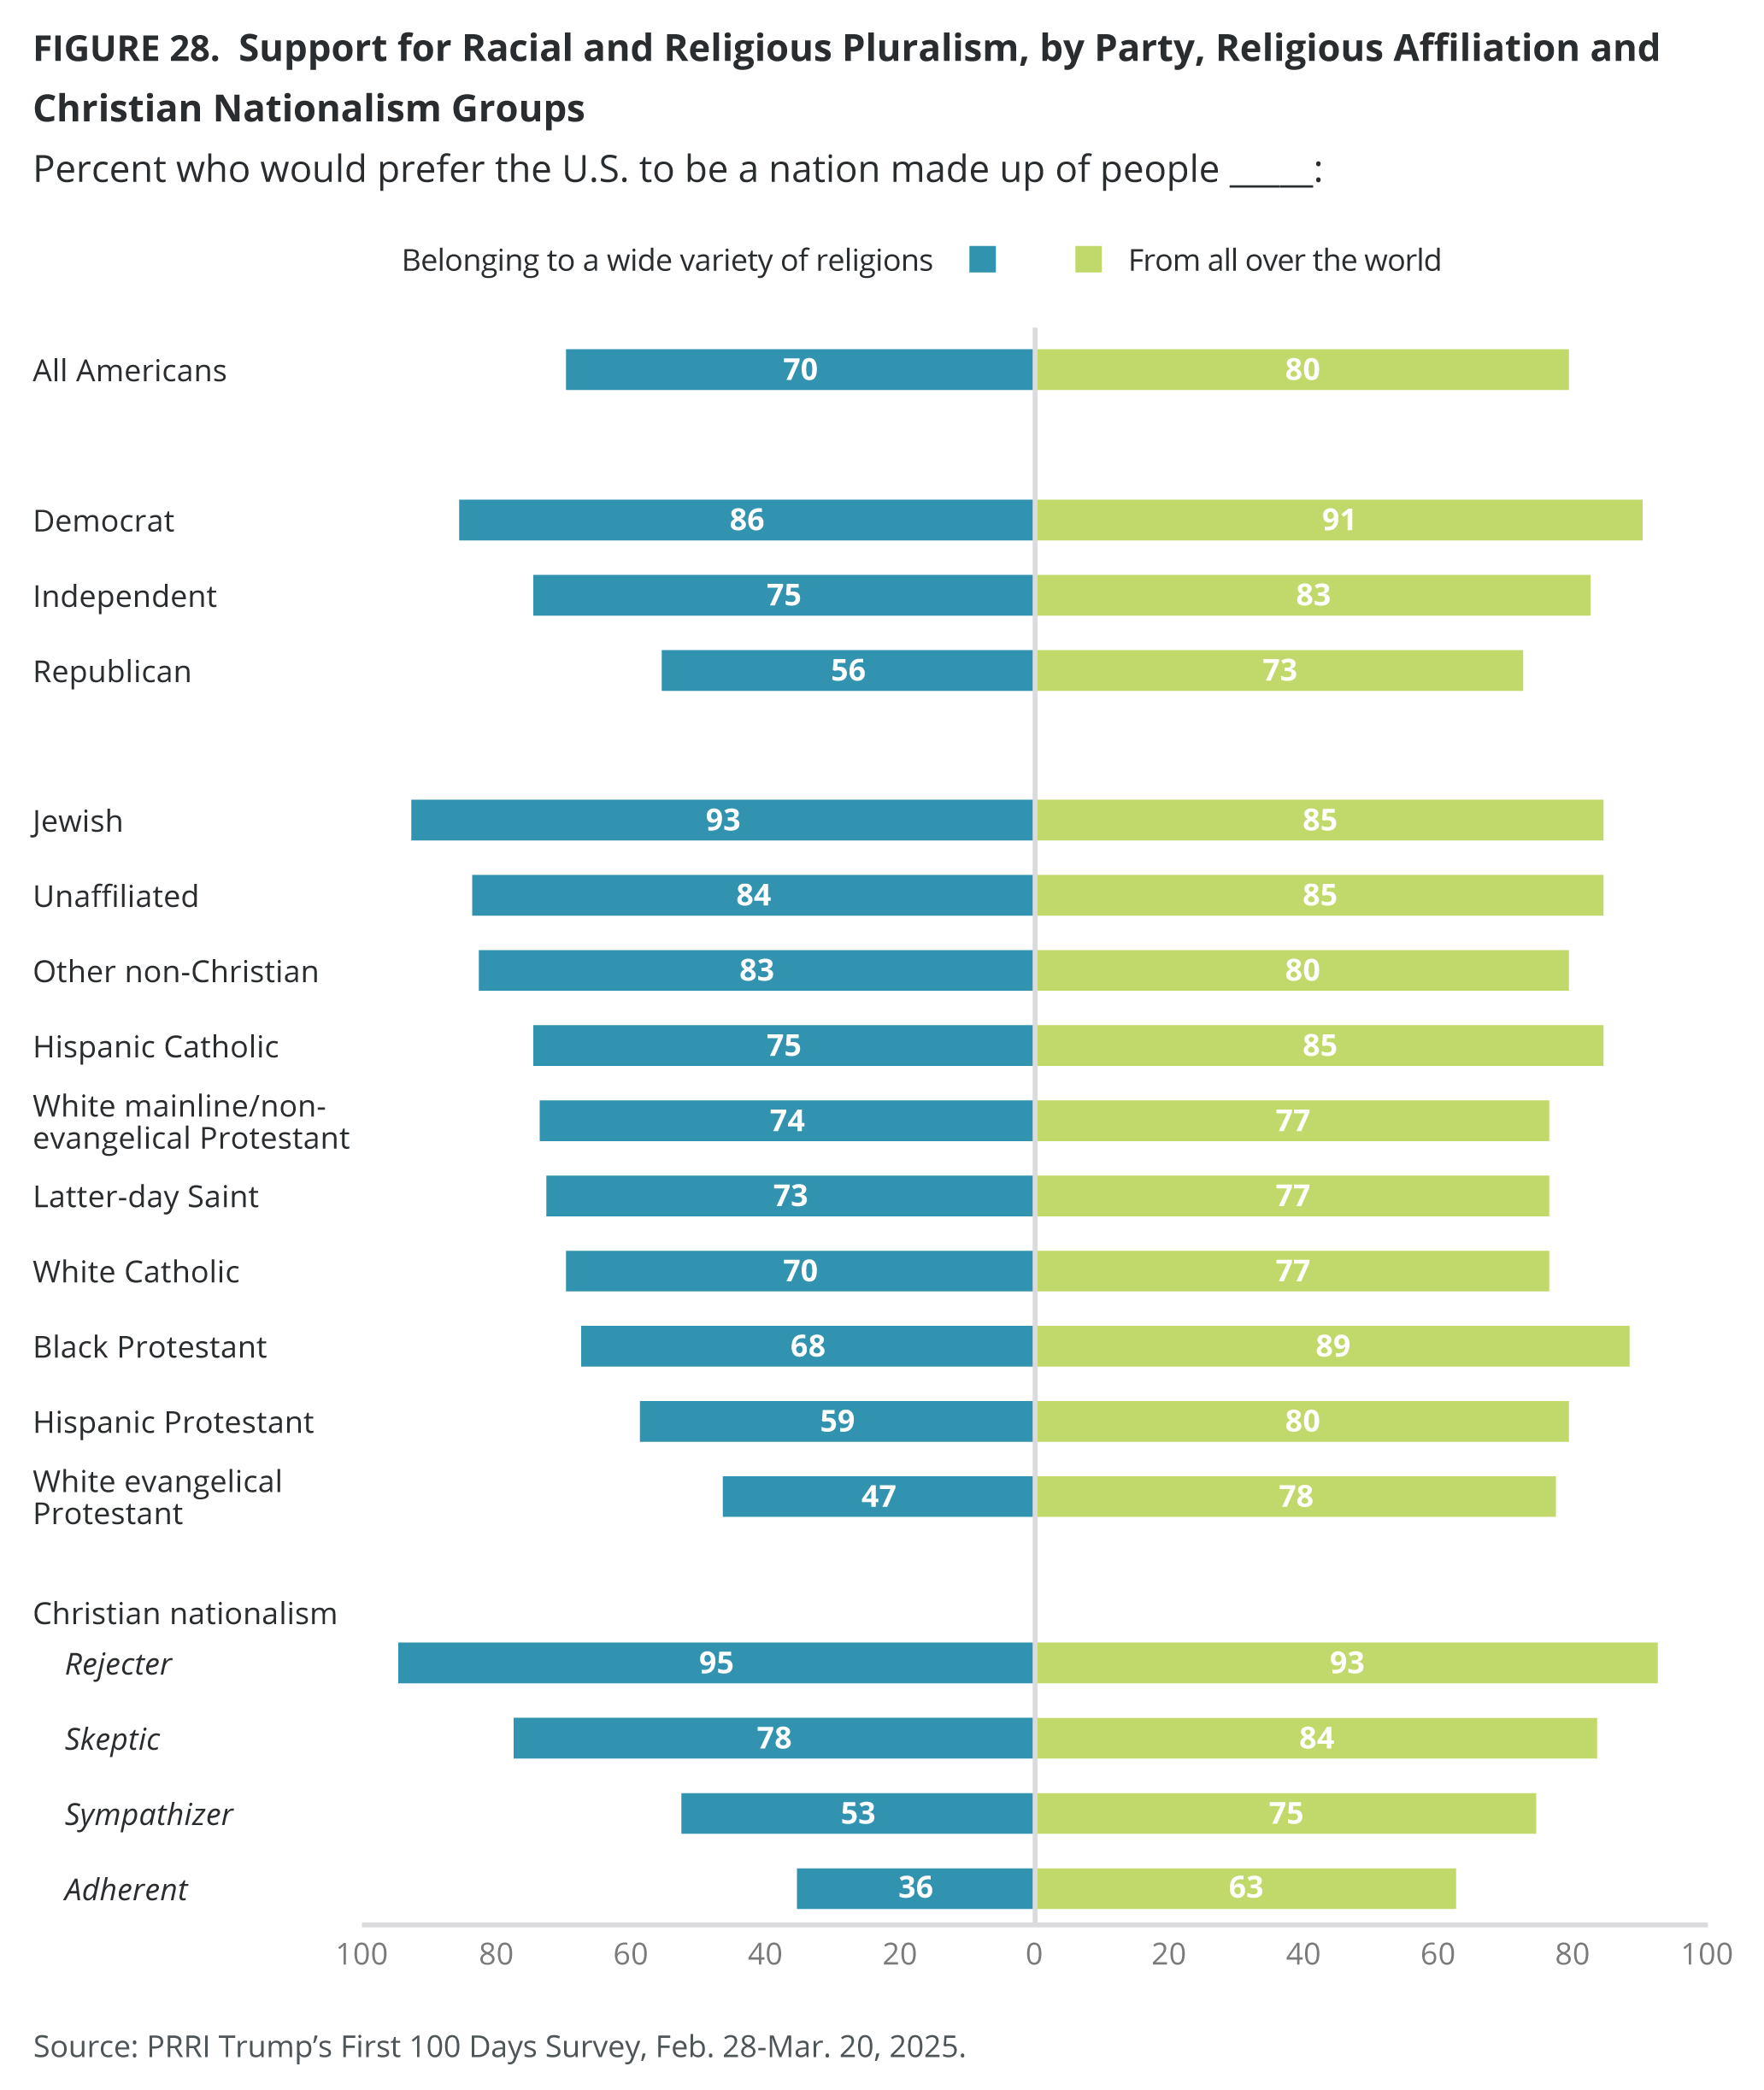
- Eight in ten Americans (80%), including 91% of Democrats, 83% of independents, and 73% of Republicans, say they would prefer the U.S. to be a nation made up of people from all over the world, while just 15% say they would prefer the U.S. to be a nation primarily made up of people of western European heritage.
- Seven in ten Americans (70%) say they would prefer the U.S. to be a nation made up of people belonging to a wide variety of religions, compared with 25% of Americans who say they would prefer a nation primarily made up of people who follow the Christian faith.
Most Americans do not subscribe to the Great Replacement Theory nor do they support efforts to put immigrants in the country illegally into internment camps guarded by the military.
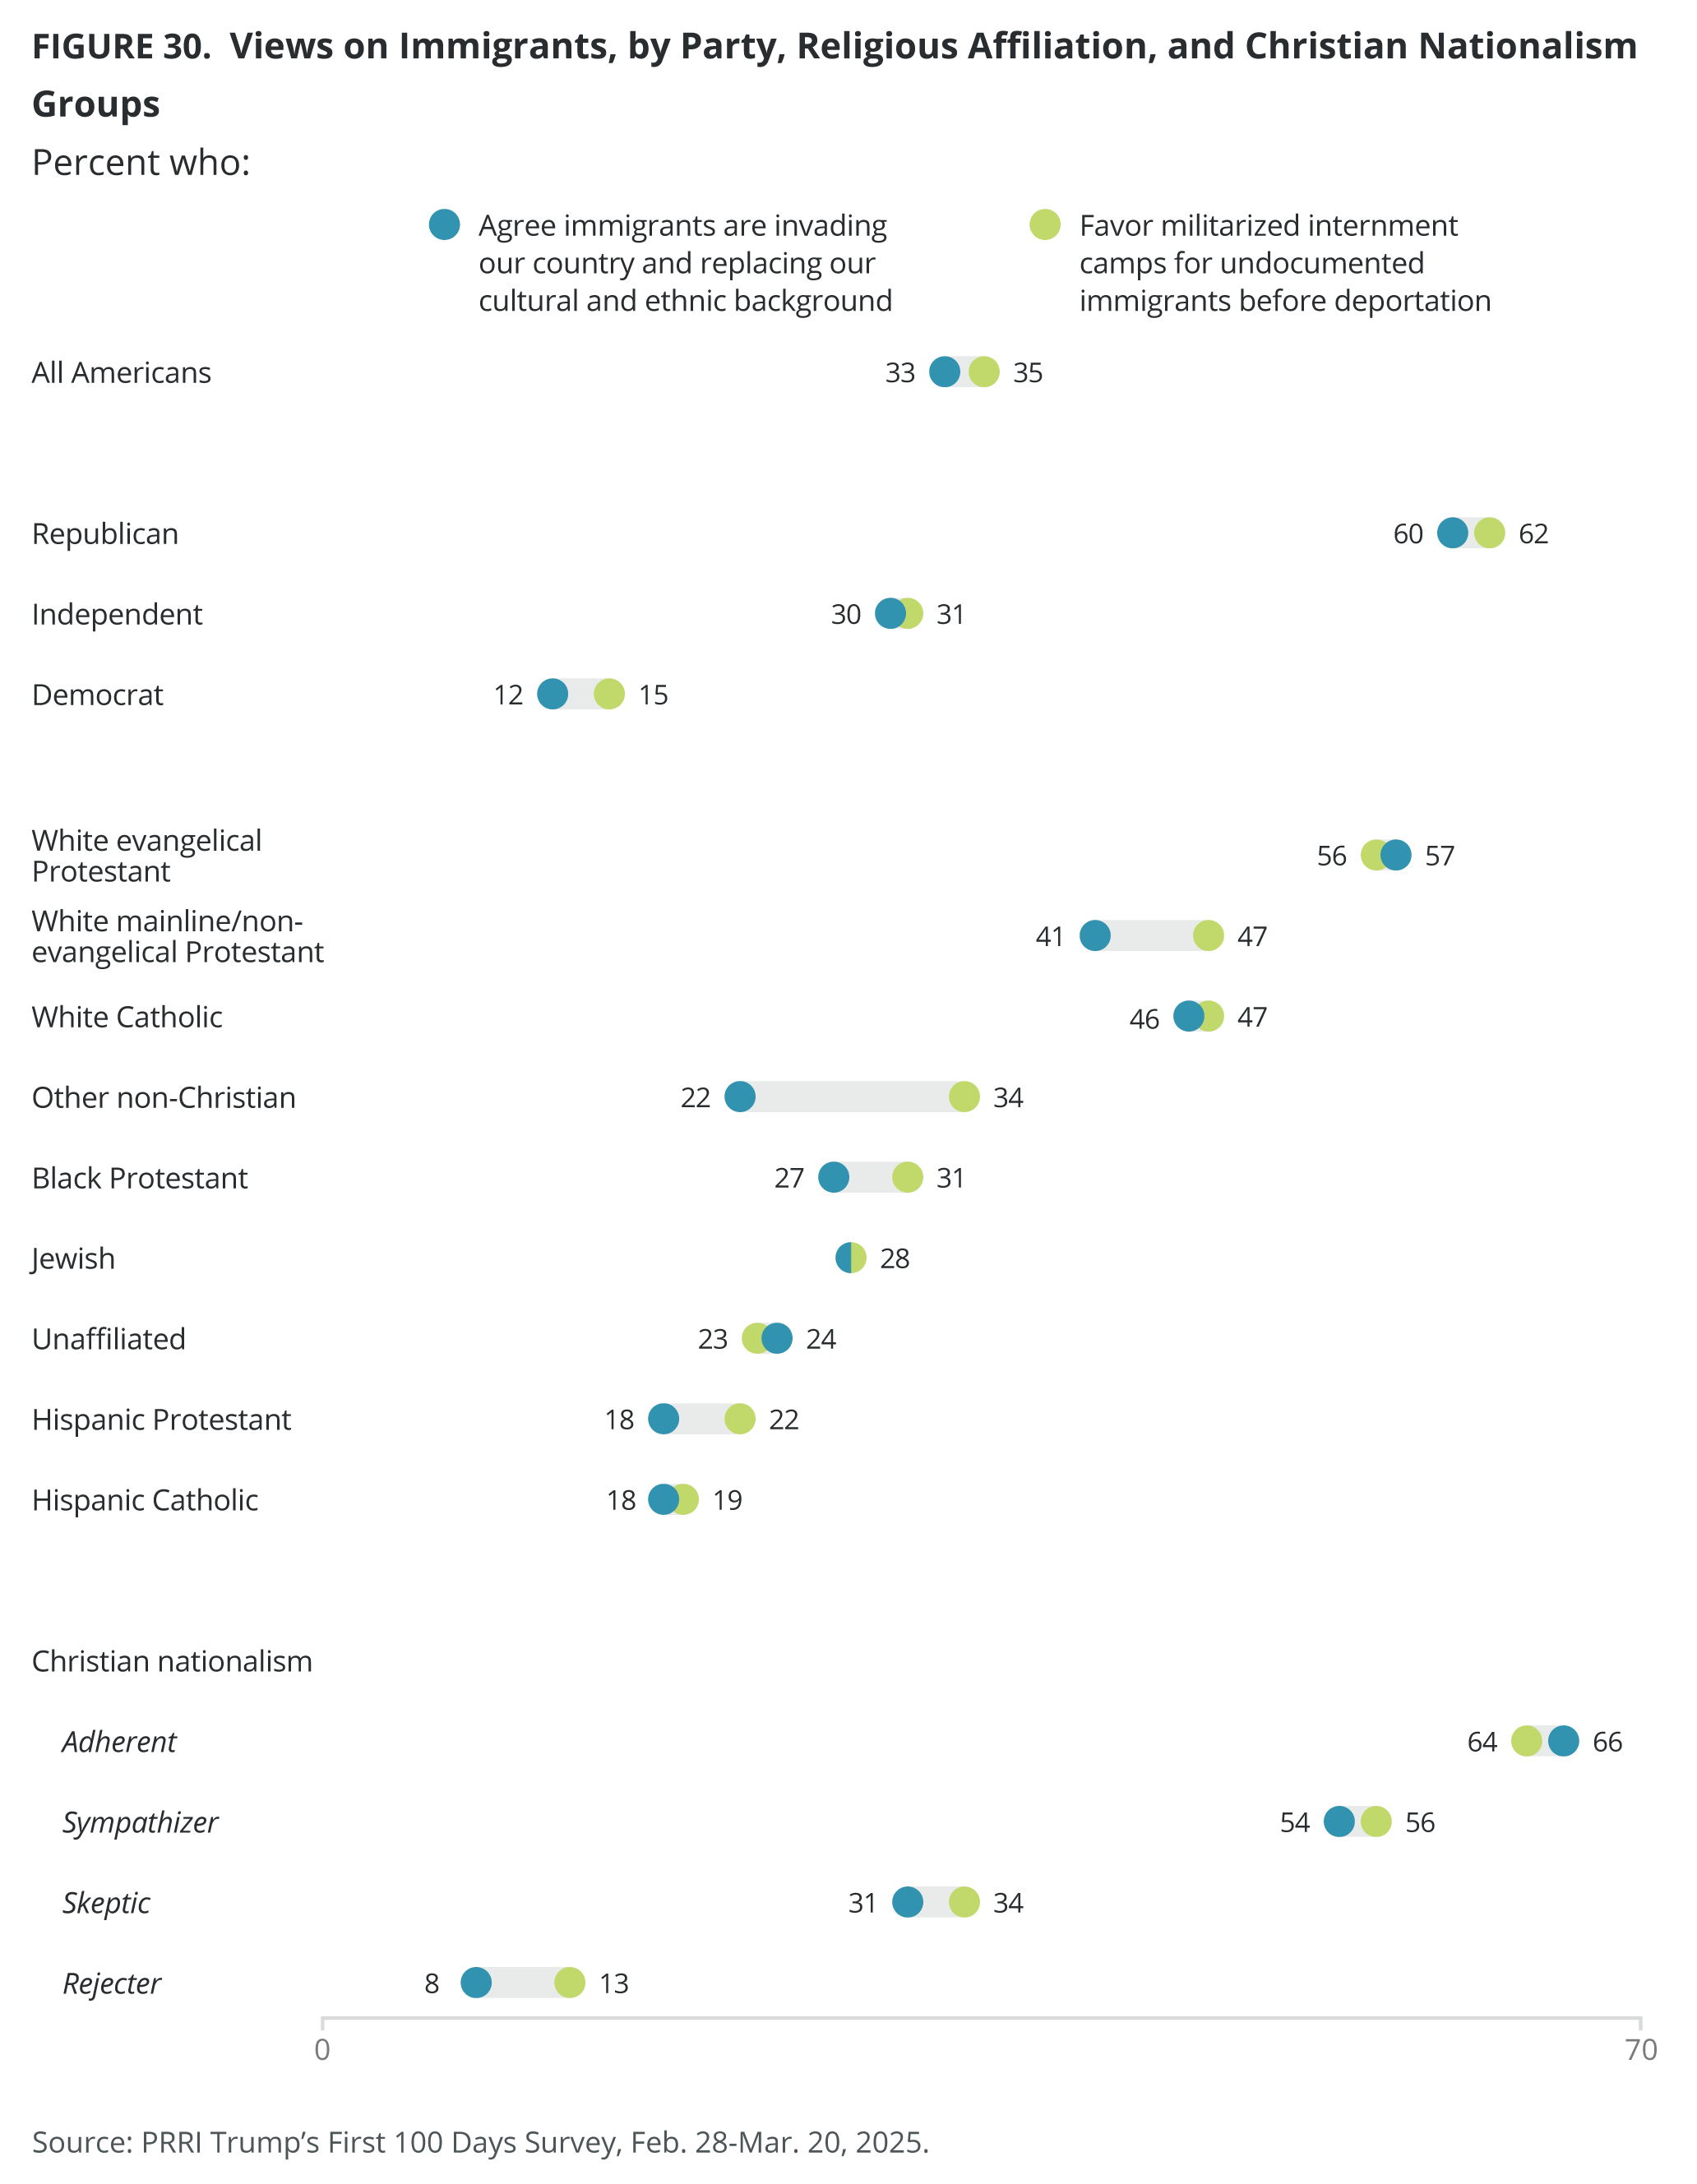
- The majority of Americans (64%) disagree with the statement “Immigrants are invading our country and replacing our cultural and ethnic background,” compared with 33% who agree. Republicans (60%) are more likely than independents (30%) and Democrats (12%) to agree.
- Most Americans (61%) disagree that the federal government should place immigrants who are in the country illegally in internment camps guarded by the U.S. military until they can be deported, while over just one-third agree (35%). Republicans (62%) are far more likely to agree with this policy than independents (31%) or Democrats (15%).
While views on gender traditionalism have held steady in recent years among most Americans, Republicans have trended more conservative in the past decade.
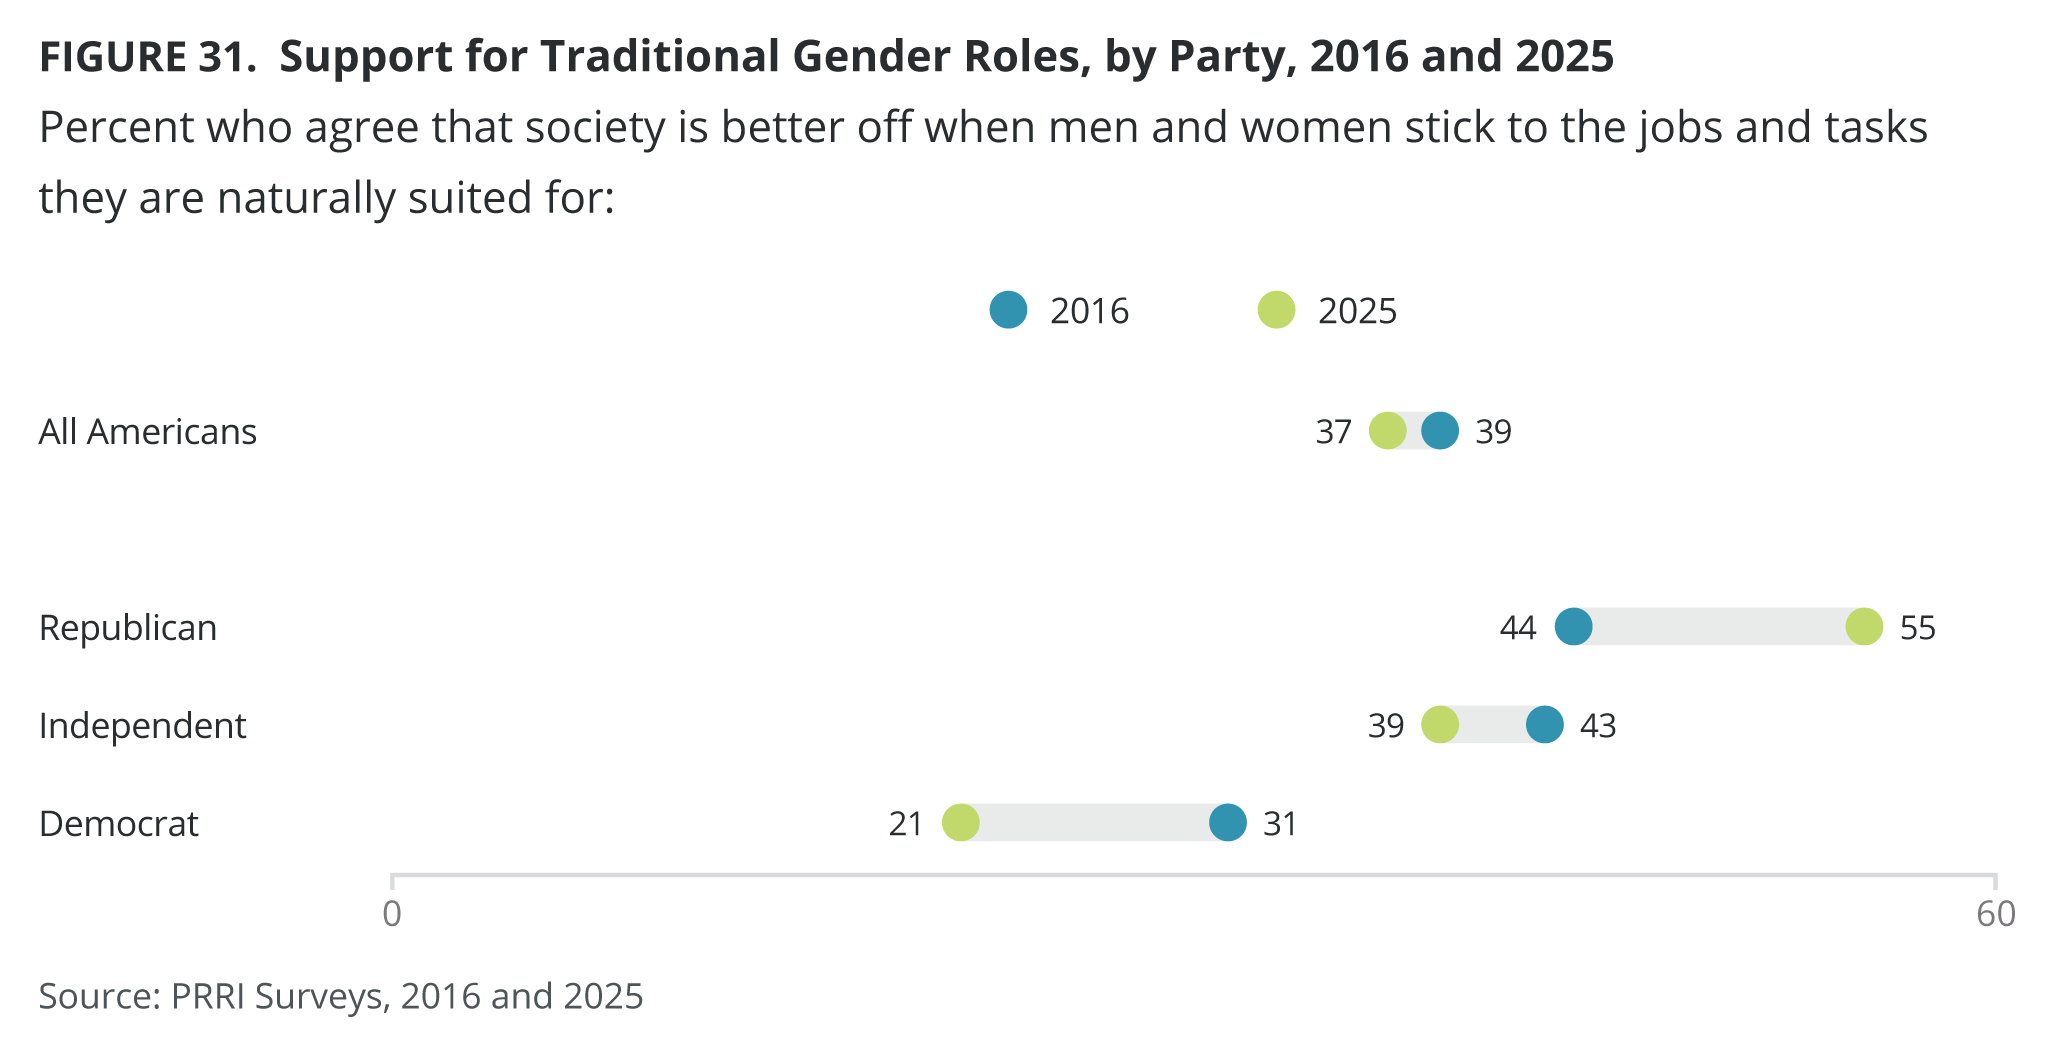
- While a majority of Americans (58%) disagree that society is better off when men and women stick to the jobs and tasks they are naturally suited for, a majority of Republicans agree (55%), an 11-percentage-point increase from 44% in 2016. Just 37% of all Americans agree.
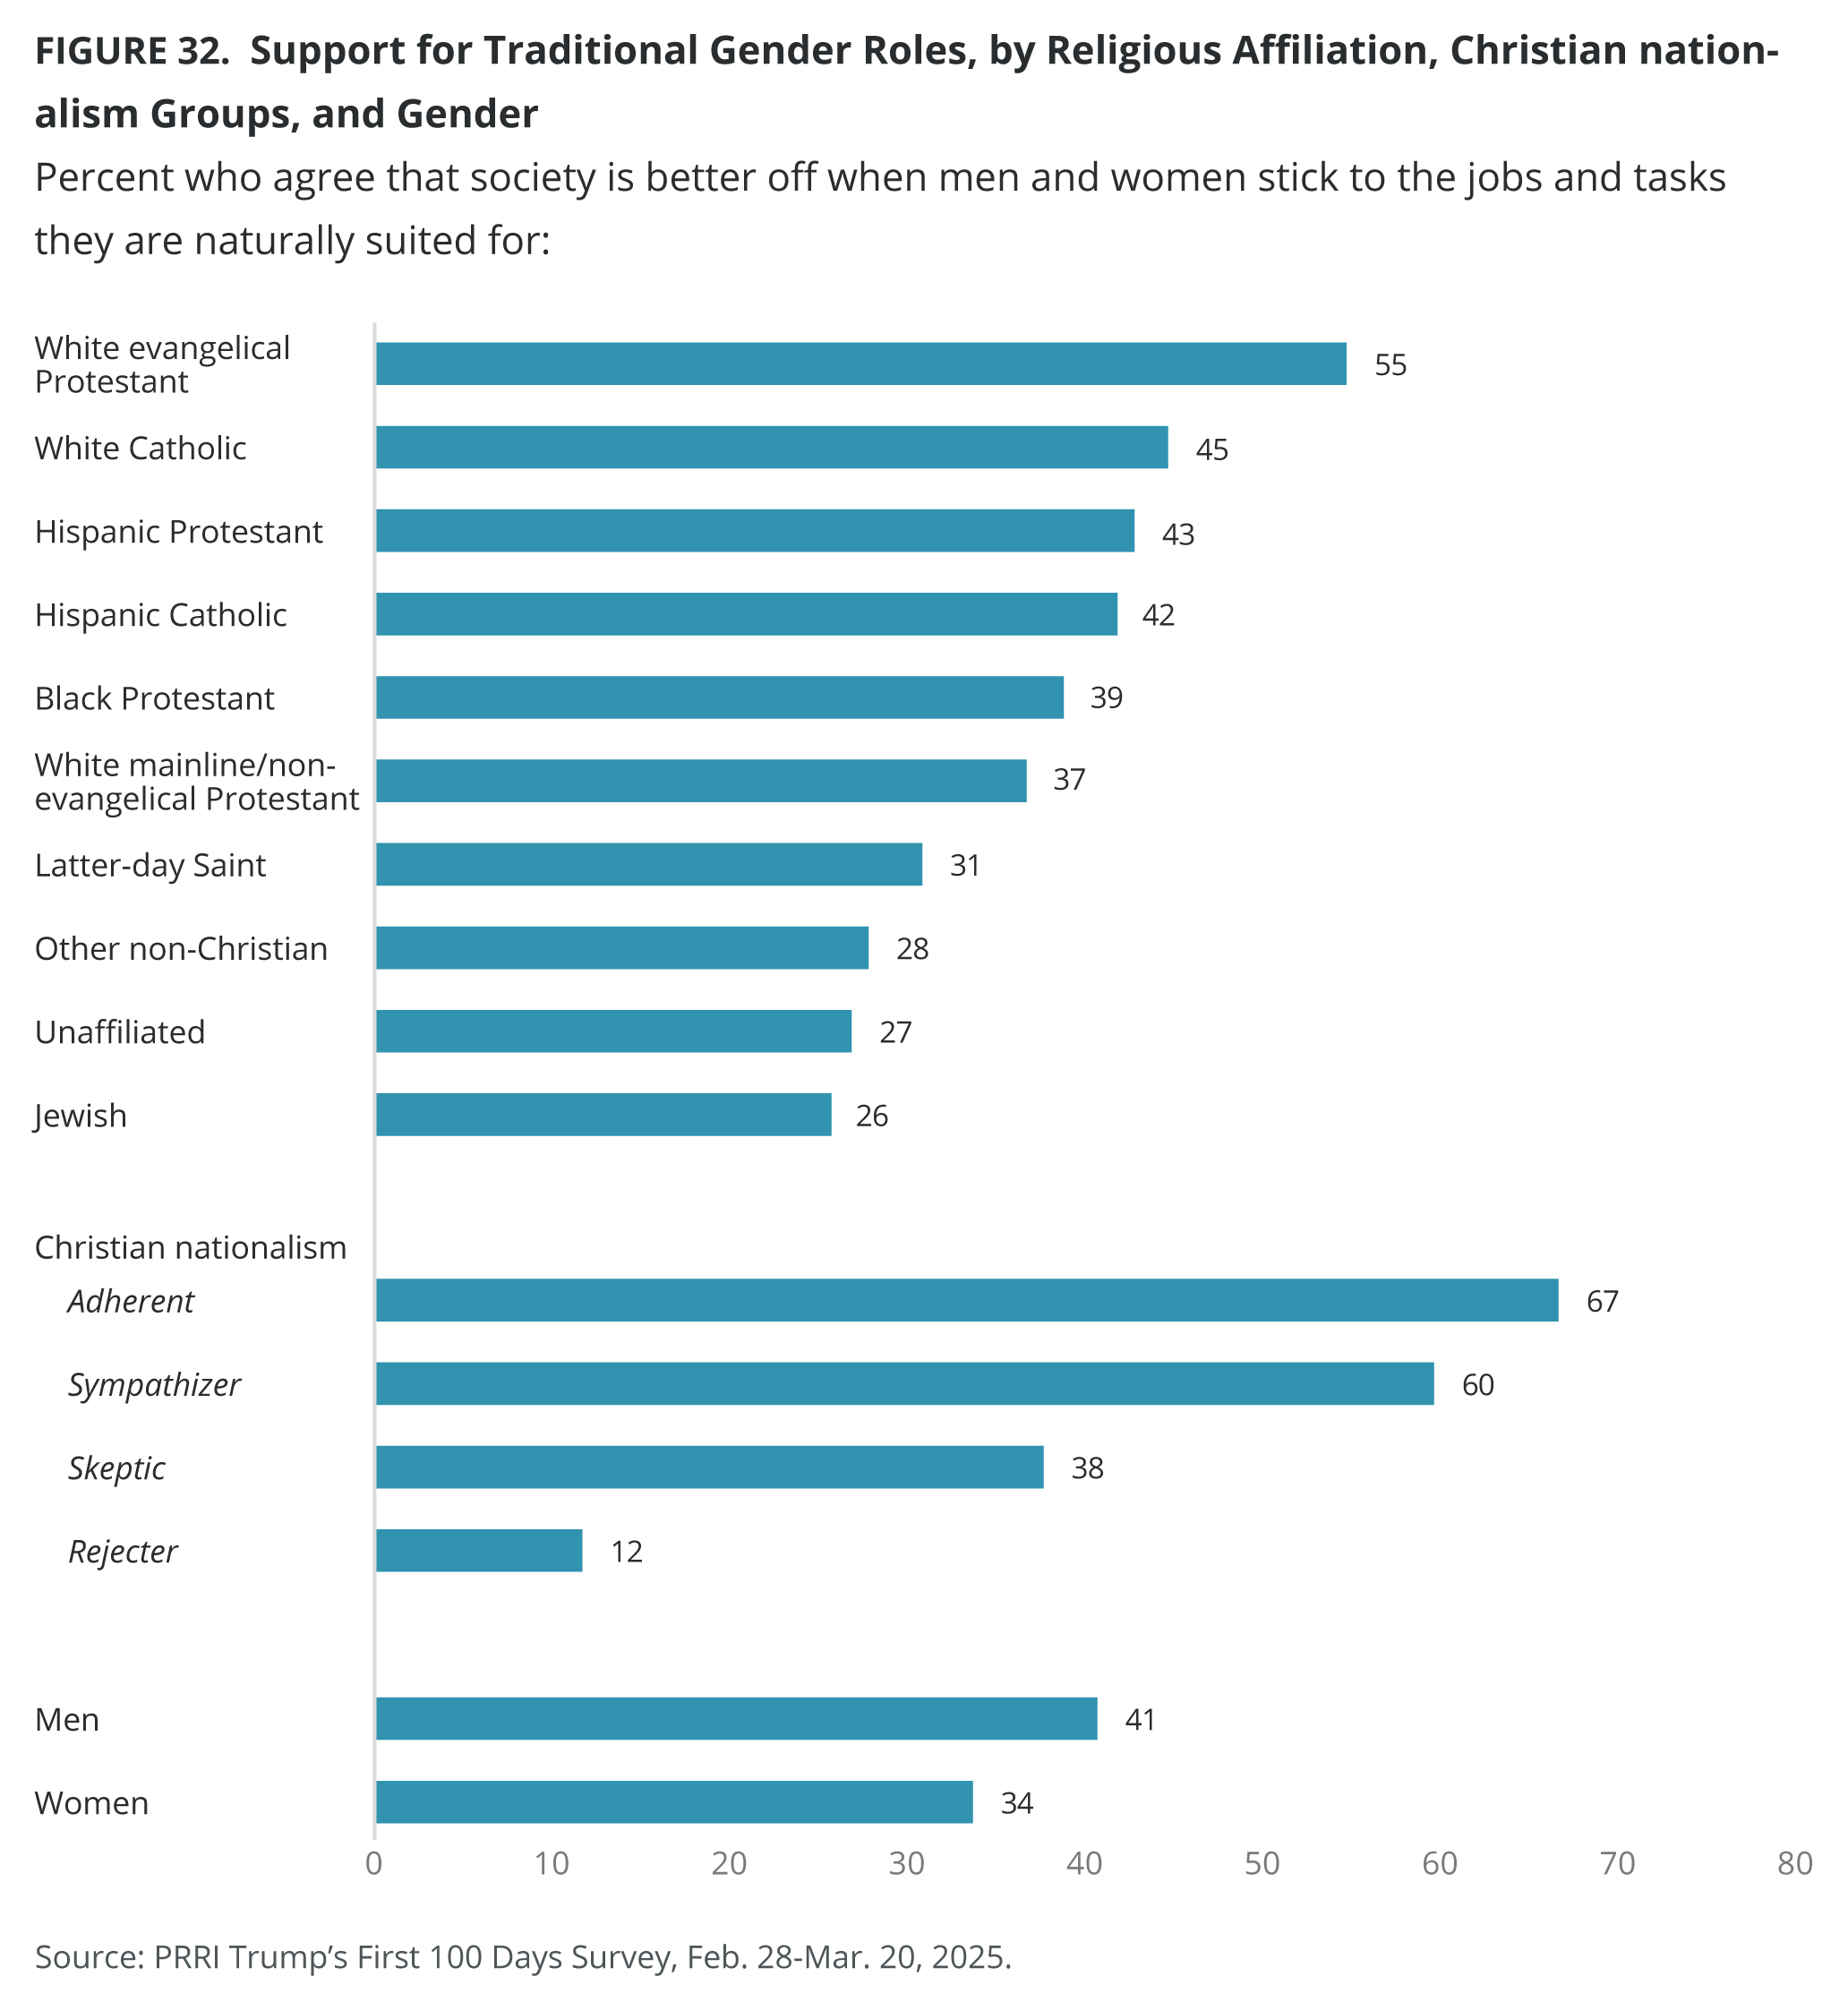
- Among religious groups, only white evangelical Protestants (55%) show majority agreement with the idea that men and women should stick to tasks they are better suited for.
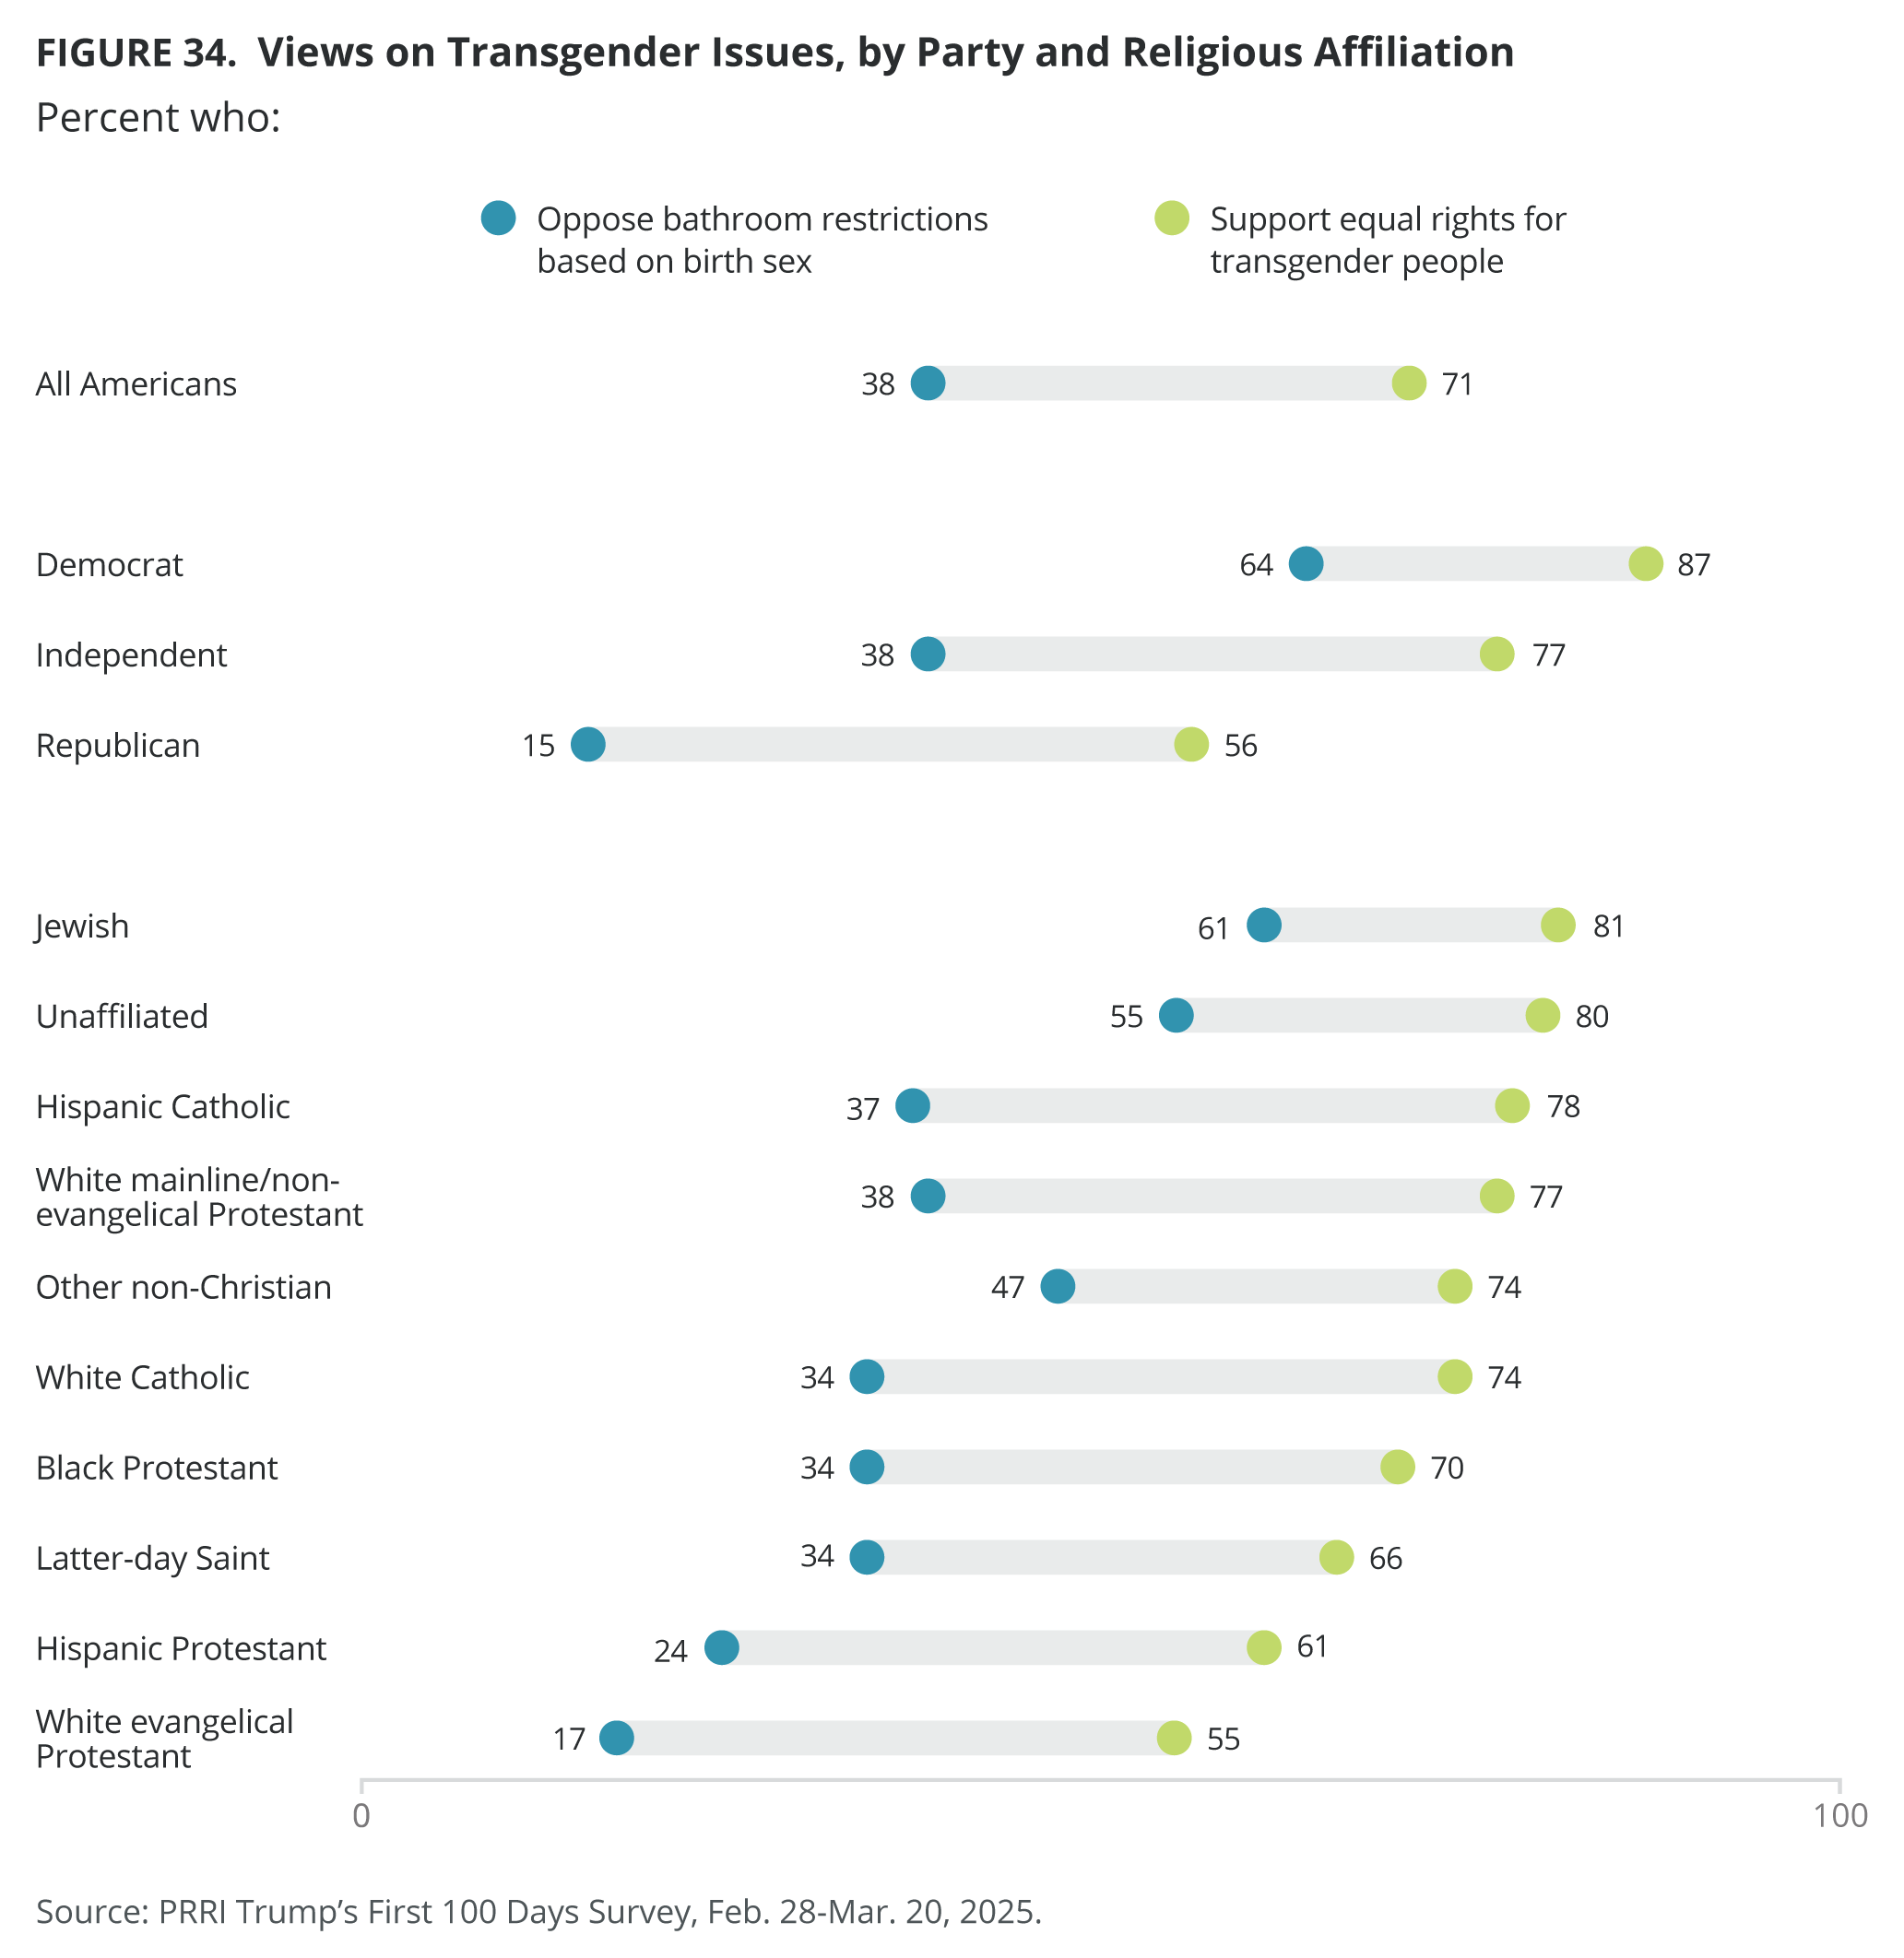
- Seven in ten Americans (71%) agree that transgender people deserve the same rights and protections as other Americans; only one-quarter of Americans disagree (24%). A majority in each political party agrees, including 87% of Democrats, 77% of independents, and 56% of Republicans.
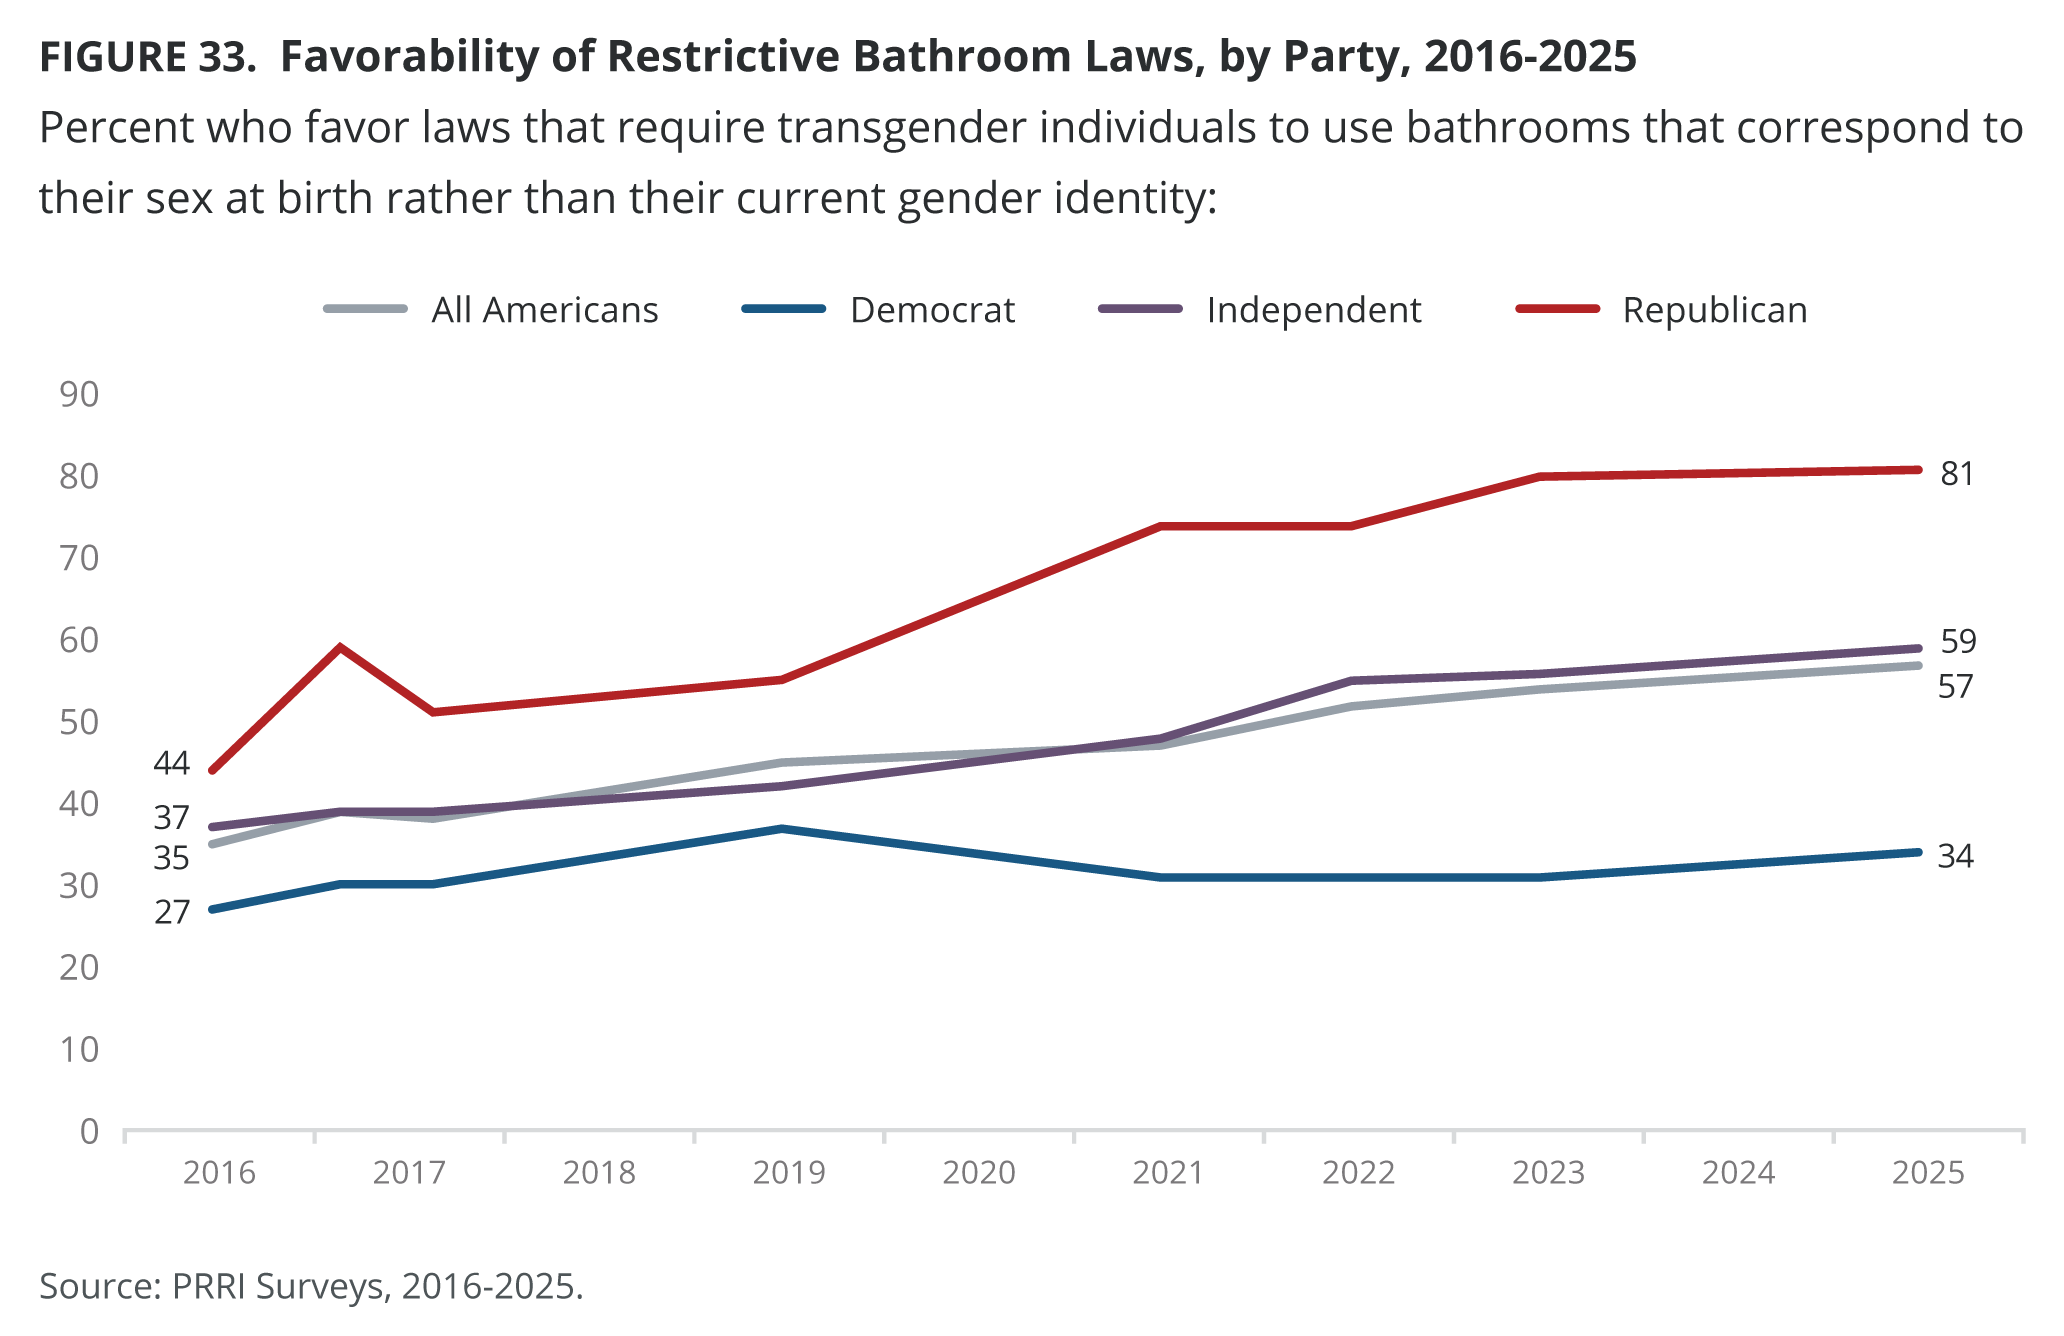
- At the same time, a majority support laws that require transgender individuals to use bathrooms that correspond to their sex at birth (57%), up from 35% who supported such laws in 2016.
Strong majorities of Americans believe mandatory vaccines for children should be legal in all or most cases.
- Nearly three-quarters of Americans (73%) believe mandatory vaccines for children should be legal in all or most cases, compared with one-quarter of Americans (24%) who believe they should be illegal in all or most cases.
- Nine in ten Democrats (90%), three-quarters of independents (73%), and six in ten Republicans (63%) say mandatory vaccines for children should be legal in all or most cases.
Introduction
PRRI interviewed more than 5,000 adults to assess Americans’ views on President Donald Trump’s first 100 days in office. The study explores voter satisfaction and regret, Trump’s job approval and favorability ratings, as well as public perceptions of other prominent figures like Vice President JD Vance and presidential advisor Elon Musk. It examines opinion on Trump’s leadership style, the expansion of executive power, and recent executive actions. The survey also explores attitudes toward political violence, Christian nationalism, perceived discrimination, and support for racial and religious pluralism. It concludes with public views on immigration, gender roles, transgender rights, and mandatory childhood vaccines.
Voter Remorse, Trump’s 2024 Approval, and Favorability Ratings
Voter Remorse
Three in ten Americans voted for Trump (30%) and a similar share voted for Kamala Harris (29%), while four in ten Americans did not vote in the 2024 presidential election (40%). Just 1% say they voted for another candidate.
Nearly all Harris (95%) and Trump voters (92%) are satisfied with their vote, as are 85% of those who voted for another candidate. Among those who did not vote in the 2024 presidential election, 56% say they are satisfied with their decision, while 31% express regret.
Solid majorities of voters in all religious groups are satisfied with their vote choice, including nearly all white evangelical Protestants (96%), white mainline Protestants (96%), religiously unaffiliated Americans (96%), white Catholics (94%), Jewish Americans (94%), Black Protestants (92%), Hispanic Catholics (92%), Latter-day Saints (91%), Hispanic Protestants (87%), and members of other Christian religions (87%).[1]
Majorities of voters across gender (94% of both men and women) and generations also express satisfaction with their 2024 vote choice, including 91% of Gen Zers, 93% of millennials, 94% of Gen Xers, 96% of baby boomers, and 96% of members of the Silent Generation.
Views of the Trump Administration
Trump’s Job Performance
As President
Over four in ten Americans (43%) strongly or somewhat approve of the job that Trump is doing as president, while a majority (54%) disapprove, including 41% who strongly disapprove. Trump’s approval has hovered around 40% since the question was first asked in October 2017. While 85% of Republicans approve of Trump’s job performance as president, just 40% of independents and 7% of Democrats do.
White Christian groups are the most likely to approve of the job that Trump is doing as president. Three in four white evangelical Protestants (76%), along with 62% of Latter-day Saints, 57% of white Catholics, and 54% of white mainline/non-evangelical Protestants, approve of the job that Trump is doing. Roughly one-third of other non-Christians (35%), Hispanic Protestants (34%), Jewish Americans (33%), and religiously unaffiliated Americans (30%) approve of the job Trump is doing as president. Hispanic Catholics (26%) and Black Protestants (18%) are the least likely to approve of Trump’s performance as president.
Strong majorities of Christian nationalism Adherents (78%) and Sympathizers (67%) approve of the job Trump is doing as president. Comparatively, 43% of Christian nationalism Skeptics and 12% of Rejecters approve.
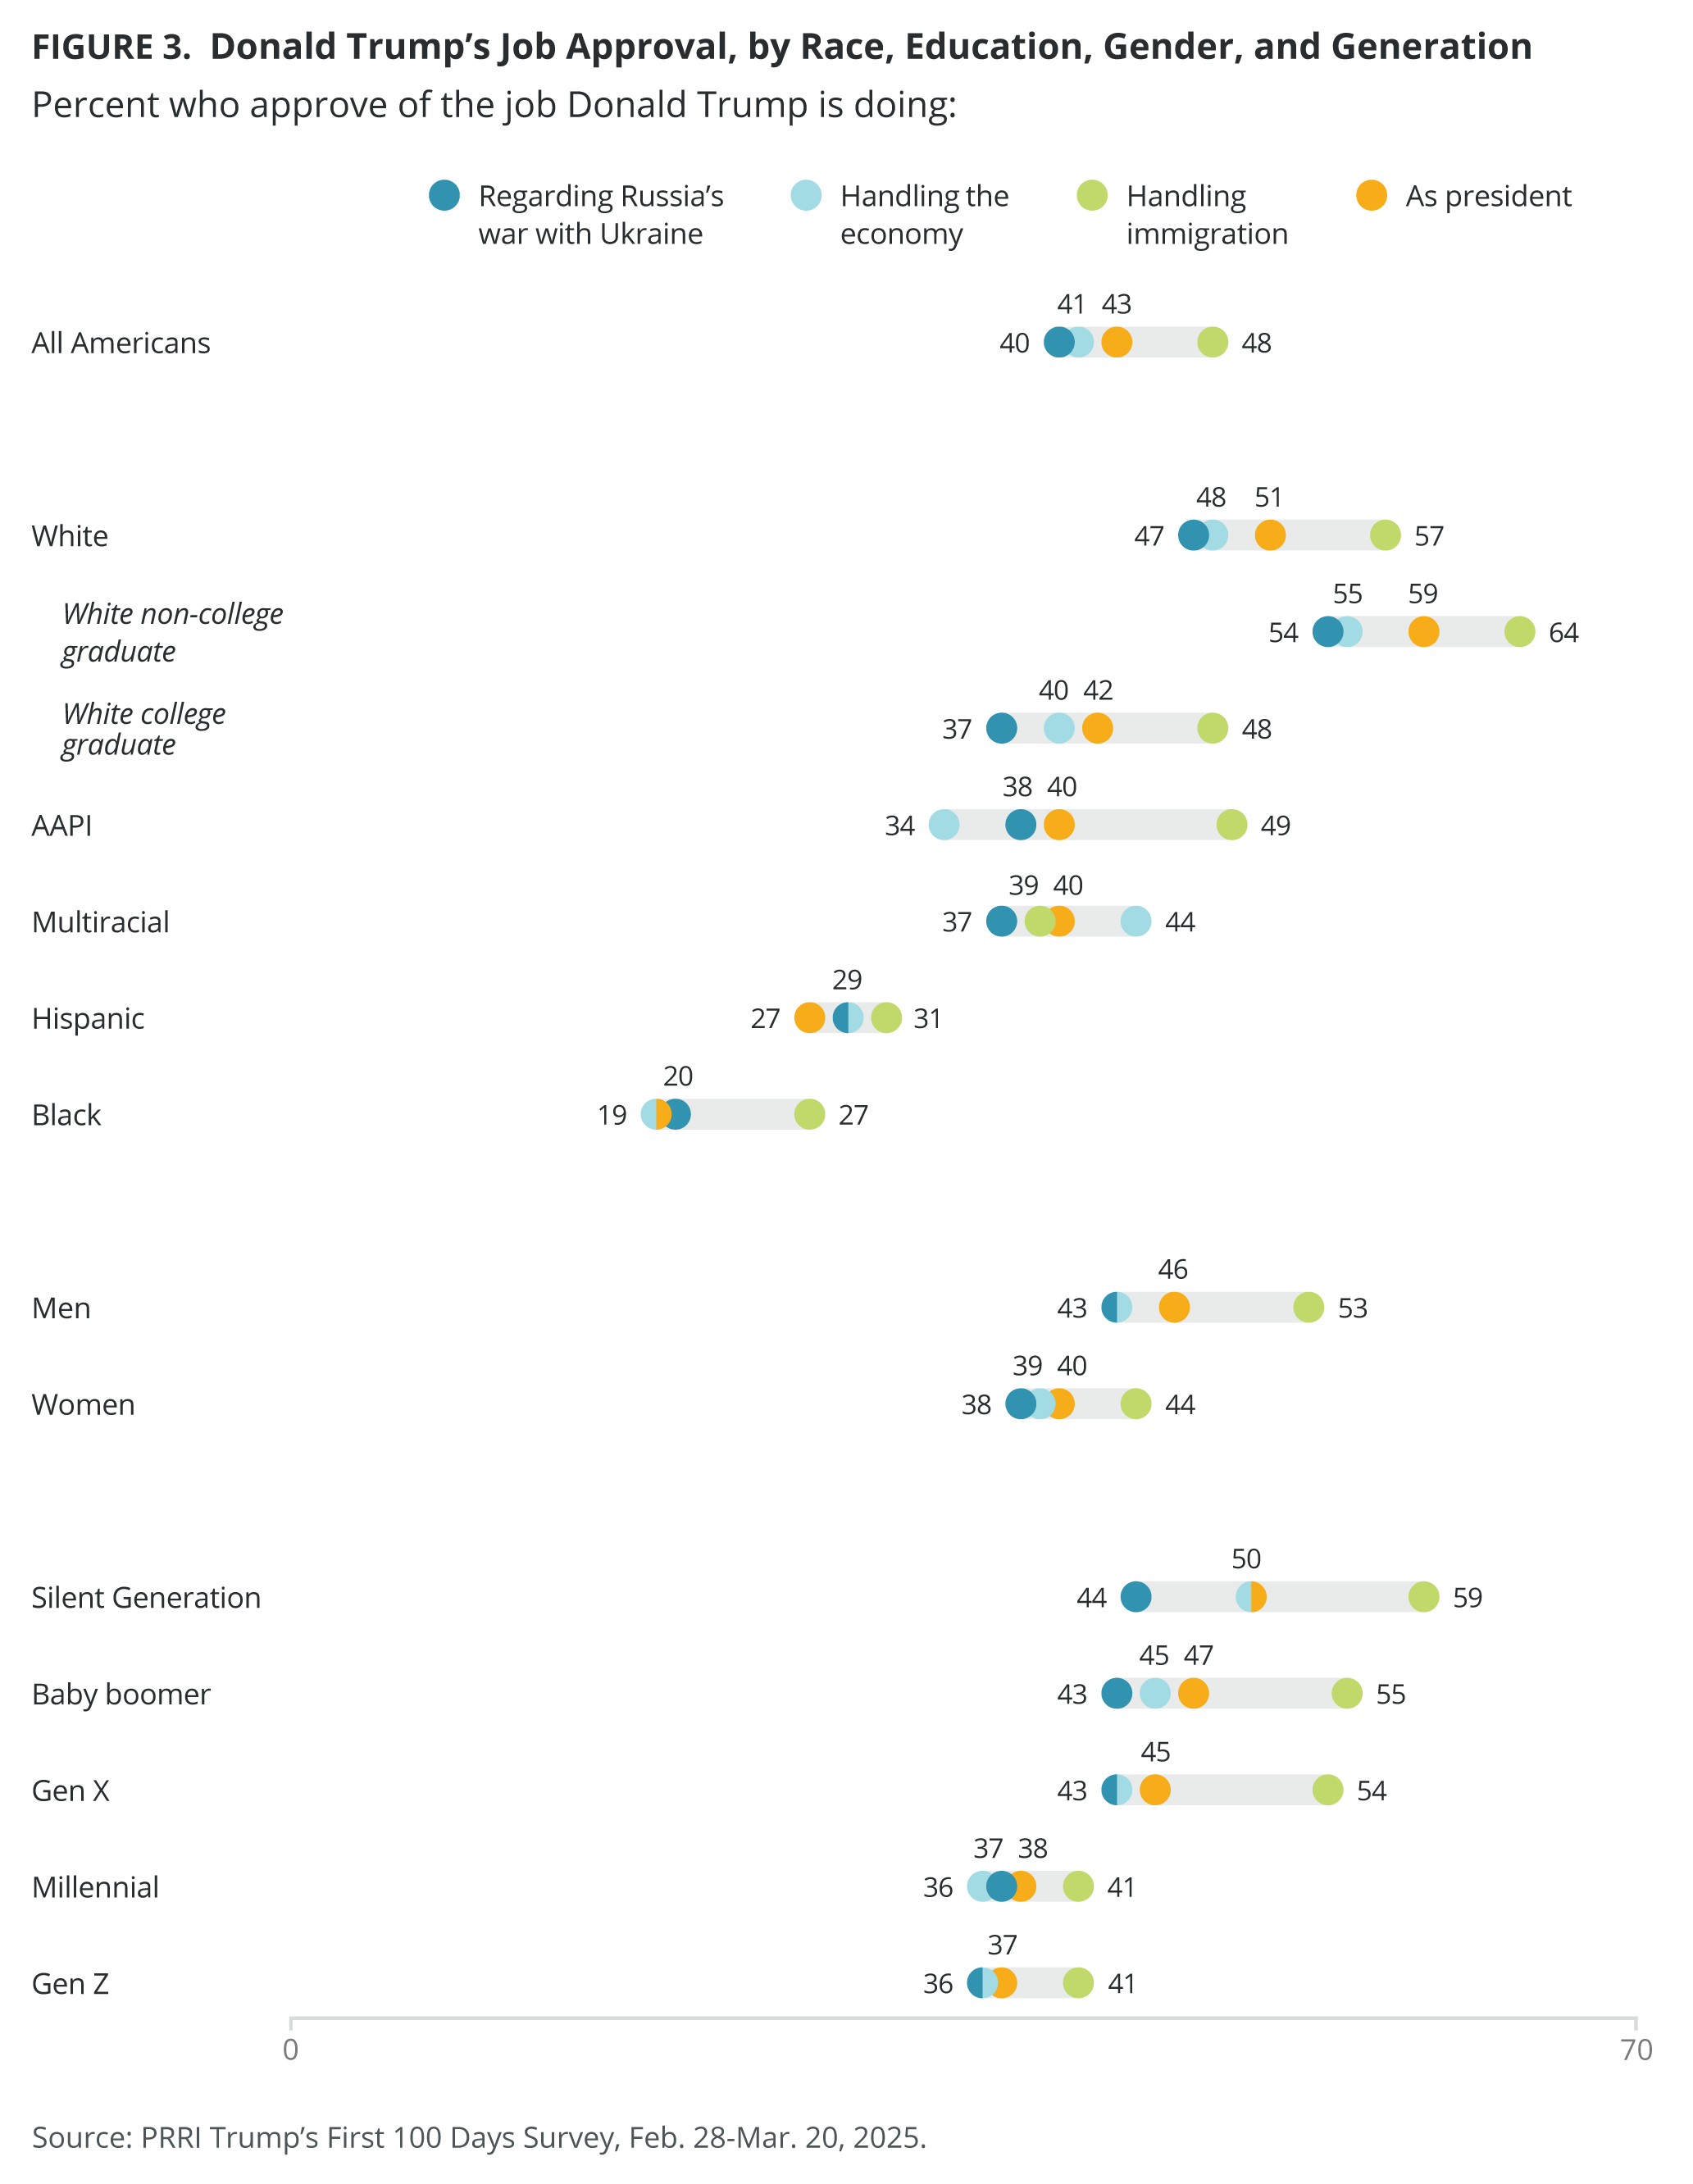
White Americans (51%) are significantly more likely than multiracial (40%), AAPI (40%), Hispanic (27%), and Black Americans (19%) to approve of Trump’s job performance. Men (46%) are significantly more likely than women (40%) to approve of Trump’s performance as president, as well as white Americans without a college degree compared with white Americans with a college degree (59% vs. 42%). Older generations approve more of the job that Trump is doing as president than younger generations, including 50% of the Silent Generation, 47% of baby boomers, 45% of Gen Xers, 38% of millennials and 37% of Gen Zers.
Immigration
Americans are evenly divided in their approval of the job that Trump is doing handling immigration (48% approve, 49% disapprove). Nearly all Republicans (90%) approve of the job Trump is doing on immigration, compared with roughly half of independents (48%) and just 13% of Democrats.
White Christian groups are the most likely to approve of the job that Trump is doing handling immigration. Nearly eight in ten white evangelical Protestants (78%), along with 65% of Latter-day Saints, 64% of white mainline/non-evangelical Protestants, and 63% of white Catholics approve of the job that Trump is doing handling immigration. Christians of color, non-Christians, and unaffiliated Americans are significantly less likely than white Christian groups to approve. About four in ten other non-Christians (43%) and Jewish Americans (39%) approve, as well as one-third religiously unaffiliated Americans (35%), Hispanic Protestants (34%), and three in ten Hispanic Catholics (29%), and Black Protestants (29%).
Most Christian nationalism Adherents (80%) and Sympathizers (71%), as well as half of Skeptics, (50%) approve of the job Trump is doing handling immigration. Just 19% of Rejecters approve.
The majority of white Americans (57%) and half of AAPI (49%) approve of the job that Trump is doing handling immigration, compared with 39% of multiracial, 31% of Hispanic, and 27% of Black Americans. About two-thirds of white Americans without a college degree (64%) also approve, compared with 48% of white Americans with a college degree. Men are more likely than women to approve (53% vs. 44%).
Older generations approve more of the job Trump is doing handling immigration than younger generations: the Silent Generation (59%), baby boomers (55%), Gen Xers (54%), millennials (41%), and Gen Zers (41%).
The Economy
About four in ten Americans (41%) approve of the job Trump is doing to handle the economy, while the majority disapprove (57%). The share of those who approve has decreased significantly, from 50% in September 2020. Most Republicans (82%) approve of Trump’s handling of the economy, compared with 36% of independents and just 8% of Democrats.
White evangelical Protestants (73%) are the most likely to approve of the job that Trump is doing handling the economy, followed by Latter-day Saints (64%), white Catholics (54%), and white mainline/non-evangelical Protestants (50%). Christians of color, non-Christians, and unaffiliated Americans are less likely than white Christian groups to approve, including 35% of Hispanic Protestants and other non-Christians, 31% of Jewish Americans, 27% of religiously unaffiliated Americans, 26% of Hispanic Catholics, and 20% of Black Protestants.
Most Christian nationalism Adherents (76%) and Sympathizers (66%) approve of the job Trump is doing with the economy. Comparatively, 39% of Skeptics and 11% of Rejecters approve.
No racial group reaches majority approval of the job that Trump is doing handling the economy. However, white Americans (48%) are more likely than multiracial (44%), AAPI (34%), Hispanic (29%), and Black Americans (19%) to approve. Notably, white Americans without a college degree (55%) are 15 percentage points more likely than white Americans with a college degree (40%) to approve of the job Trump is doing handling the economy. Men are also significantly more likely to give Trump higher marks in dealing with the economy than women (43% vs. 39%).
No generation reaches majority approval of the job Trump is doing handling the economy. Half of the Silent Generation (50%), 45% of baby boomers, 43% of Gen Xers, and 36% of both millennials and Gen Zers approve.
Russia’s War with Ukraine
Four in ten Americans (40%) approve of the job that Trump is doing regarding Russia’s war with Ukraine, while 56% disapprove. Eight in ten Republicans (80%) approve of Trump’s foreign policy, compared with 37% of independents and 8% of Democrats.
White evangelical Protestants (70%) are the most likely to approve of the job that Trump is doing regarding Russia’s war with Ukraine, followed by Latter-day Saints (60%), and slim majorities of white Catholics (51%) and white mainline/non-evangelical Protestants (51%). Around one-third or fewer Hispanic Protestants (38%), other non-Christians (35%), unaffiliated Americans (29%), Hispanic Catholics (25%), Jewish Americans (25%), and Black Protestants (19%) also approve.
Most Christian nationalism Adherents (72%) and Sympathizers (64%) approve of the job Trump is doing regarding Russia’s war with Ukraine. Comparatively, 40% of Skeptics and 12% of Rejecters approve.
No racial group or generation reaches majority approval of the job that Trump is doing regarding Russia’s war with Ukraine, including nearly half of white Americans (47%), about four in ten AAPI (38%) and multiracial Americans (37%), and 29% of Hispanic and 20% of Black Americans. Older generations are more likely than younger generations to approve, including around four in ten members of the Silent Generation (44%), baby boomers (43%), Gen Xers (43%), millennials (37%), and Gen Zers (36%).
Favorability Ratings
Donald Trump
Four in ten Americans (40%) express favorable views of Donald Trump, while 56% express unfavorable views, including 45% who say they have a very unfavorable view of him. In April 2016, before Trump officially secured the Republican party presidential nomination, his favorability stood at 24%. By the 2016 election, his favorability rating had risen to 33%. Since his first election as president, Trump’s favorability ratings have fluctuated, ranging from a high of 44% in the first quarter of 2019 to a low of 31% in 2021, shortly after his supporters’ Jan. 6 attack on the U.S. Capitol.[2]
Unsurprisingly, most Republicans hold a favorable view of Trump (83%), including a majority who say they hold a very favorable view (55%). Republican favorable views of Trump have remained consistently strong around the same point in time over the past decade. In April 2016, 53% of Republicans expressed favorable views of Trump. That number jumped to 76% ahead of the 2016 election and to 87% by February 2017, staying above 80% through 2020. Following the 2020 election, Trump’s favorability among Republicans declined to 72% in the beginning of both 2021 and 2023. However, by 2025, those numbers have rebounded above 80%. In contrast, just 8% of Democrats express a favorable view of Trump, a share that has remained steady over the past decade. Independents have largely mirrored the views of all Americans over the years, with a slightly smaller share expressing a favorable view of Trump in 2025 (35%) than all Americans (40%).
Most Americans who most trust far-right TV news sources (95%) and most trust Fox News (86%) hold favorable views of Trump, compared with 39% of those who do not watch TV news, and 23% of Americans who most trust mainstream TV news sources.
Among religious groups, Trump’s favorability is highest among white evangelical Protestants, nearly three in four of whom report having favorable views in 2025 (73%). While other white Christian groups are less likely than white evangelical Protestants to view Trump favorably in 2025, a majority still holds a favorable view, including 53% of white Catholics and 52% of white mainline/non-evangelical Protestants.
Fewer Jewish Americans (33%), Hispanic Protestants (32%), other non-Christians (30%), religiously unaffiliated (27%), Hispanic Catholics (25%), and Black Protestants (18%) rate Trump favorably. Trump wins higher favorability ratings among Americans who attend religious services on a more frequent basis: Half of Americans who attend religious services weekly or more (50%) hold favorable views, along with 47% of those who attend monthly or a few times a year and 34% of those who seldom or never attend services.
Most Christian nationalism Adherents (74%) and Sympathizers (65%) have a favorable opinion of Trump. Comparatively, a minority of Skeptics (40%) and Rejecters (11%) favor him.
There is a distinct race, gender, and education gap with respect to views on Trump. Around half of white Americans (49%) rate Trump favorably, compared with smaller shares of multiracial (34%), AAPI (34%), Hispanic (27%), and Black Americans (19%). White Americans without a college degree are more likely than those with a college degree to hold favorable views of Trump (55% vs. 38%). Men are also more likely than women to hold favorable views of Trump (43% vs. 37%).
Trump wins higher favorability ratings among older than younger generations: 50% of members of the Silent Generation, 47% of baby boomers, and 42% of Gen Xers hold favorable views of Trump, compared with 35% of both millennials and Gen Zers. Gen Z men (41%) are significantly more likely to give Trump higher favorability ratings than Gen Z women (29%); similarly, Trump finds higher favorability with Gen X men vs. Gen X women (46% vs. 38% respectively).
JD Vance
More than one-third of Americans have a favorable view of JD Vance (35%), compared with half of those who hold an unfavorable view (50%), and 12% who have not heard of him. Vance’s favorability and unfavorability ratings increased slightly from 32% and 46%, respectively, in 2024, while those who have not heard of him decreased from 20%. Three-quarters of Republicans (75%) have a favorable opinion of Vance, 15% have an unfavorable opinion, and 7% have not heard of him. By contrast, just 6% of Democrats have a favorable opinion of Vance, 85% view him unfavorably, and 9% have not heard of him. A majority of independents (53%) have an unfavorable opinion of the vice president, 31% have a favorable opinion, and 14% have not heard of him.
Americans who most trust far-right TV news sources (94%) and Fox News (79%) are the most likely to have a favorable opinion of Vance, compared with 32% of those who do not watch TV news and 19% of those who trust mainstream TV news.
Over two-thirds of white evangelical Protestants (68%) have a favorable opinion of Vance, significantly more than white Catholics (50%), white mainline/non-evangelical Protestants (49%), and Latter-day Saints (47%). All other religious groups are significantly less likely than white Christian groups to hold a favorable opinion of the vice president, including one-third or fewer Jewish Americans (36%), Hispanic Protestants (25%), unaffiliated Americans (21%), other non-Christian (20%), Black Protestants (17%), and Hispanic Catholic (17%). While fewer than one in ten white Christian groups and around one in ten members of other religious groups have not heard of Vance, a notably higher share of Hispanic Protestants (27%) and Hispanic Catholics (26%) remain unfamiliar with the vice president.
A majority of Christian nationalism Adherents (67%) and Sympathizers (59%) have a favorable opinion of Vance. Comparatively, a minority of Skeptics (35%) and Rejecters (7%) favor him.
No racial group holds majority favorable views of Vance, though white Americans (45%) are notably more likely than multiracial (29%), AAPI (28%), Hispanic (18%), and Black Americans (14%) to hold a favorable opinion. Hispanic Americans (25%) are the most likely to say they have not heard of Vance, followed by multiracial (19%) and Black Americans (16%). Just 8% of white Americans and 7% of AAPI have not heard of him.
Trump’s Leadership: Dangerous Dictator or Strong Leader Restoring America’s Greatness?
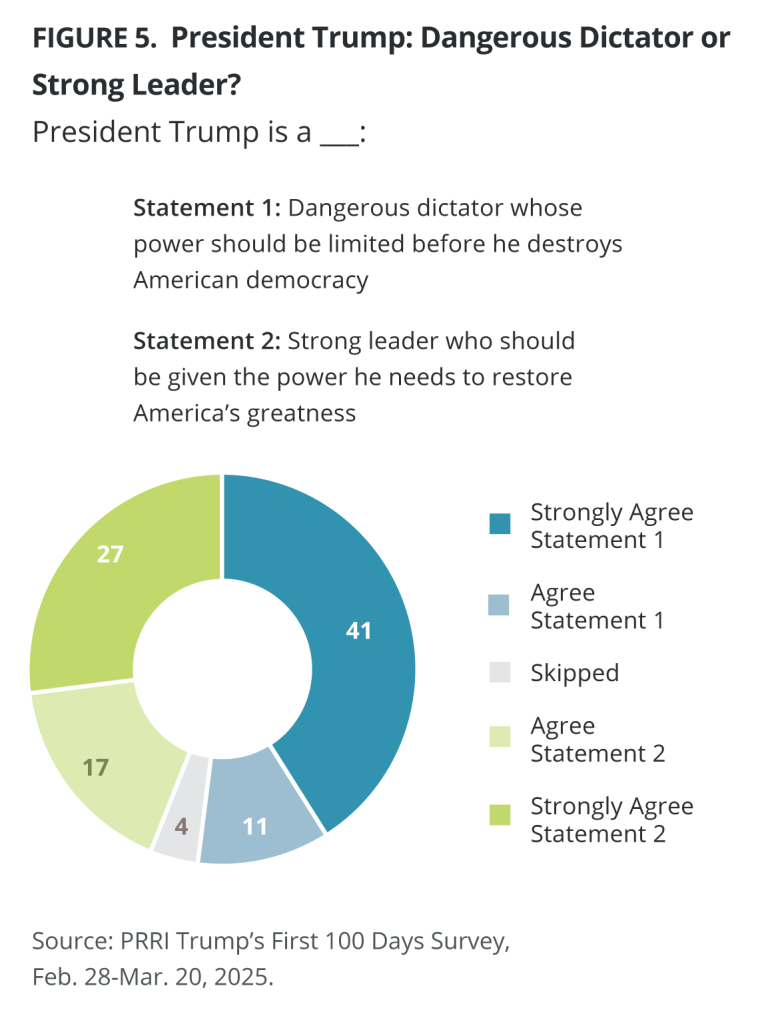
A majority of Americans are more likely to agree with the statement “President Trump is a dangerous dictator whose power should be limited before he destroys American democracy” (52%) than with the statement “President Trump is a strong leader who should be given the power he needs to restore America’s greatness” (44%). Both statements are divided along party lines, with most Democrats (87%) agreeing with the first statement, and most Republicans agreeing with the second statement (81%). Independents are more likely to agree with the first statement than the second (56% vs. 42%).
Among Americans who voted for Trump and regret their decision, 55% agree that he is a dangerous dictator, compared with 42% who view him as strong leader who should be given the power he needs to restore America’s greatness. Among all non-voters, 54% view Trump as a dangerous dictator, compared with 39% who view him as a strong leader. Among non-voters who regret their decision not to vote, 68% view Trump as a dangerous dictator, compared with 30% who view him as a strong leader.[3]
Majorities of white Christian groups, including three in four white evangelical Protestants (73%), two-thirds of Latter-day Saints (66%), 56% of white Catholics, and 54% of white mainline-non-evangelical Protestants, view Trump as a strong leader who should be given the power to restore America’s greatness. By contrast, majorities of Christians of color, non-Christians, and unaffiliated Americans, including 71% of Black Protestants, 69% of Hispanic Catholics, 65% of unaffiliated Americans, 64% of Jewish Americans, 63% of other non-Christians, and 58% of Hispanic Protestants, view Trump as a dangerous dictator whose power should be limited. Those who attend religious services seldom or never (59%) are more likely than those who attend monthly (48%) or weekly (44%) to view Trump as a dangerous dictator.
Most Christian nationalism Rejecters (84%) and Skeptics (54%) agree that Trump is a dangerous dictator, compared with just 30% of Sympathizers and 26% of Adherents. By contrast, around seven in ten Adherents (73%) and Sympathizers (70%) view Trump as a strong leader who should be given the power to restore America’s greatness, compared with 46% of Skeptics and just 15% of Rejecters.
Majorities of Black (67%), Hispanic (63%), AAPI (58%), and multiracial Americans (56%) view Trump as a dangerous dictator whose power should be limited before he destroys American democracy. White Americans are slightly more likely to view Trump as a strong leader who should be given the power to restore America’s greatness (51%) than to view him as a dictator (45%). White Americans without a four-year college degree are more likely to view Trump as a strong leader who should be given the power to restore America’s greatness (57%) than to view him as a dictator (39%) while white Americans with a four-year degree are more likely to view Trump as a dictator (56%) than as a strong leader (42%).
Except for members of the Silent Generation (46%), at least half of baby boomers (50%), Gen Xers (50%), millennials (55%), and Gen Zers (55%) view Trump as a dangerous dictator.
The Expansion of Executive Power
Elections: Postponing the Midterm Elections and Allowing a President to Serve More Than Two Terms
Nearly eight in ten Americans (77%) disagree with the statement “If President Trump can’t get our country out of crisis in the next year, he should postpone the 2026 midterm elections for Congress,” while only 17% agree. Similarly, low percentages of Republicans (19%), independents (16%), and Democrats (16%) agree that Trump should postpone the 2026 midterm elections in a crisis.
Similarly, nearly eight in ten Americans (79%) disagree with the statement “The U.S. Constitution should be amended to allow presidents to serve more than two terms in office,” compared with only 17% who agree. Republicans (27%) are more likely than independents (16%) and Democrats (8%) to agree.
Exemptions to the Rule of Law
Are Elected Officials Above the Law?
Nearly all Americans agree (89%) that no elected official, including the president, should be above the law; only 8% disagree with this statement. There is widespread agreement by party, media trust, religious affiliation, Christian nationalism beliefs, race, education levels, gender, and generation that no elected official should be above the law.
Support for a President Willing to Break Laws to Save the Country
More than three-quarters of Americans (76%) disagree with the statement “Because things have gotten so far off track, we need a president who is willing to break some laws if that’s what it takes to save the country,” compared with 20% who agree. Republicans (29%) are more likely than independents (22%) and Democrats (9%) to agree with this statement.
Around three in ten Americans who most trust Fox News (32%) and far-right TV news sources (30%) agree that we need a president who is willing to break some laws to save the country, compared with 22% of those who do not watch TV news and 16% of those who most trust mainstream TV news.
A higher share of Christian nationalism Adherents (38%) and Sympathizers (32%) agree that we need a president willing to break laws to save the country, compared with Skeptics (20%) and Rejecters (8%).
White Americans without a college degree are more than twice as likely as white Americans with a college degree to agree (25% vs. 10%).
Should the President Be Above Congress and the Supreme Court?
Nearly eight in ten Americans (78%) disagree with the statement “When decisions by Congress or the Supreme Court hold our country back, the president should be able to ignore them,” compared with only 18% who agree. However, nearly three in ten Republicans (28%) agree, compared with only 17% of independents and 9% of Democrats.
Over one-quarter of Americans who most trust Fox News and far-right TV news sources (both 27%) agree, followed by two in ten of those who do not watch TV news (20%) and 13% of those who most trust mainstream TV news sources.
There is some variation among religious groups, with 23% of white evangelical Protestants, 21% of members of other non-Christian religions, 18% of white Catholics and religiously unaffiliated, 17% of white mainline/non-evangelical Protestants and Black Protestants, 16% of Hispanic Protestants and Catholics, and 13% of Jewish Americans agreeing with the statement.
Christian nationalism Adherents, however, are significantly more likely (41%) than Christian nationalism Sympathizers (27%), Skeptics (15%), and Rejecters (9%) to agree that if the country is being held back by decisions of Congress or the Supreme Court, the president should be able to ignore them.
While there are no differences by race and gender, white Americans without a four-year college degree are more likely than white Americans with a college degree to agree (25% vs. 7%).
Trump’s Executive Orders
Mass Firing of Federal Employees
A majority of Americans (55%) agree that “President Trump has overstepped his authority by ordering the mass firing of federal employees across multiple agencies” while 41% disagree. Majorities of Democrats (85%) and independents (58%) agree, compared with only 27% of Republicans.
Roughly three in four Americans who most trust mainstream TV news sources (74%) are more likely to agree that Trump has overstepped his authority regarding mass firings; a majority of Americans who do not watch TV news (52%) also support this position. In contrast, relatively few Americans who most trust Fox News (18%) or more far-right TV news sources (10%) agree.
Only about one in three white evangelical Protestants (34%) agree that Trump overstepped his authority by ordering the mass firing of federal employees; 64% disagree. Fewer than half of Latter-day Saints (46%) and white Catholics (47%) also agree that Trump overstepped his authority, compared with half of white mainline/non-evangelical Protestants (50%). In contrast, majorities of most religious groups agree that Trump has overstepped his authority by ordering the mass firing of federal employees. Three in four Black Protestants (76%), 67% of Jewish Americans, 65% of members of other non-Christian religions, 63% of religiously unaffiliated, and 62% of Hispanic Protestants and Hispanic Catholics agree.
The majority of Christian nationalism Rejecters (83%) and Skeptics (56%) agree that Trump overstepped his authority by ordering the mass firing of federal employees, compared with one-third of Adherents (35%) and Sympathizers (33%).
Black Americans (68%) are significantly more likely than AAPI (57%), multiracial (54%), and white Americans (50%) to agree that Trump overstepped his authority by ordering the mass firing of federal employees, but do not differ from Hispanic Americans (62%).
While there is little variation by generation, there are differences by gender and education. Women are more likely than men to agree with the statement (58% vs. 52%) as are white Americans with a four-year college degree, compared with white Americans without a four-year degree (59% vs. 46%).
Task Force on Anti-Christian Bias
Most Americans (78%) oppose “the establishment of a federal task force that focuses exclusively on discrimination against Christians rather than discrimination against all religions,” while only 16% favor it. The majority of Democrats (91%), independents (85%), and Republicans (66%) oppose such a task force.
Jewish Americans (89%) and the religiously unaffiliated (89%) express the highest opposition to the establishment of a task force on anti-Christian bias, followed closely by Black Protestants (83%), white mainline/non-evangelical Protestants (82%), Latter-day Saints (80%), white Catholics (79%), Hispanic Catholics (79%), other non-Christians (76%), and Hispanic Protestants (74%). Although still a majority, white evangelical Protestants (66%) report the lowest opposition.
Most Americans across media trust, race, gender, education levels, and generation oppose the establishment of a task force that focuses on discrimination against Christians. Strong majorities of Christian nationalism Rejecters (95%) and Skeptics (87%) oppose the establishment of such a task force. Notably, a majority of both Christian nationalism Adherents (51%) and Sympathizers (69%) also oppose it.
Closing of Federal Agencies
More than seven in ten Americans (71%) oppose closing or drastically shrinking all major federal agencies, even if it means things like airline travel, medicine, and water may be less safe, compared with 25% who favor this policy. Nearly all Democrats (95%) and three in four independents (75%) oppose such closures or reductions, while Republicans are evenly split (48% oppose, favor).
Majorities of Americans across religious groups, race, gender, education levels, and generation oppose the closing or drastic shrinking of all major federal agencies if it means airline travel, medicine, and water may be less safe.
Implementing New Tariffs
Two-thirds of Americans (65%) oppose the implementation of new tariffs, or taxes, on imported goods from other countries, even if it raises prices for American consumers, while 31% favor tariffs. Nearly all Democrats (93%) and seven in ten independents (71%) oppose implementing new tariffs, compared with one-third of Republicans (34%).
White evangelical Protestants (39%) are the only religious group where the majority do not oppose the implementation of new tariffs on goods imported from other countries. Majorities of all other religious groups oppose such tariffs, including 85% of Black Protestants, 84% of Hispanic Catholics, 78% of Jewish Americans, 76% of religiously unaffiliated, 72% of both Hispanic Protestants and non-Christians, 59% of white mainline/non-evangelical Protestants, 57% of Latter-day Saints, and 55% of white Catholics.
Most Christian nationalism Rejecters (93%) and Skeptics (70%) oppose implementing new tariffs, compared with 45% of Sympathizers and 38% of Adherents.
Solid majorities of Americans across race, gender, education levels, and generation oppose the implementation of new tariffs.
Birthright Citizenship
About two-thirds of Americans (64%) favor the “U.S. Constitution’s existing guarantee that all children who are born in the United States are automatically granted U.S. citizenship, regardless of their parents’ citizenship status,” while 32% oppose birthright citizenship. Most Democrats (87%) and independents (65%) favor birthright citizenship, compared with 45% of Republicans.
Black Protestants (82%) are the religious group with the highest percentage of support for birthright citizenship, followed by Hispanic Catholics (77%), Jewish Americans (76%), Hispanic Protestants (73%), religiously unaffiliated Americans (71%), other non-Christians (67%), white mainline/non-evangelical Protestants (60%), white Catholics (54%), and Latter-day Saints (54%). White evangelical Protestants (49%) are the only group without majority support for birthright citizenship.
Most Christian nationalism Rejecters (85%) and Skeptics (67%) favor birthright citizenship, compared with nearly half of Sympathizers (49%) and Adherents (47%).
Majorities of Americans across race, gender, education levels, and generation favor birthright citizenship.
The Role of Elon Musk
Elon Musk Favorability
A majority of Americans (58%) have an unfavorable opinion of Elon Musk, while one-third have a favorable opinion (34%); 4% have not heard of him. Around seven in ten Republicans (71%) view him favorably, while 30% of independents and 8% of Democrats view him favorably.
Americans who trust most far-right TV news sources (89%) and Fox News (82%) are the most likely to have a favorable opinion of Musk, compared with 32% of those who do not watch TV news and 18% of those who most trust mainstream TV news.
White evangelical Protestants are the only group where a majority hold favorable views of Musk (61%). A plurality of white Catholics (46%), white mainline/non-evangelical Protestants (45%), and Latter-day Saints (43%) also show favorable views. Musk’s favorability ratings are lower among Jewish Americans (34%), other non-Christians (31%), religiously unaffiliated (23%), Hispanic Protestants (22%), Hispanic Catholics (22%), and Black Protestants (16%).
A majority of Christian nationalism Adherents (60%) and Sympathizers (58%) have a favorable opinion of Musk. Comparatively, a minority of Skeptics (35%) and Rejecters (8%) favor him.
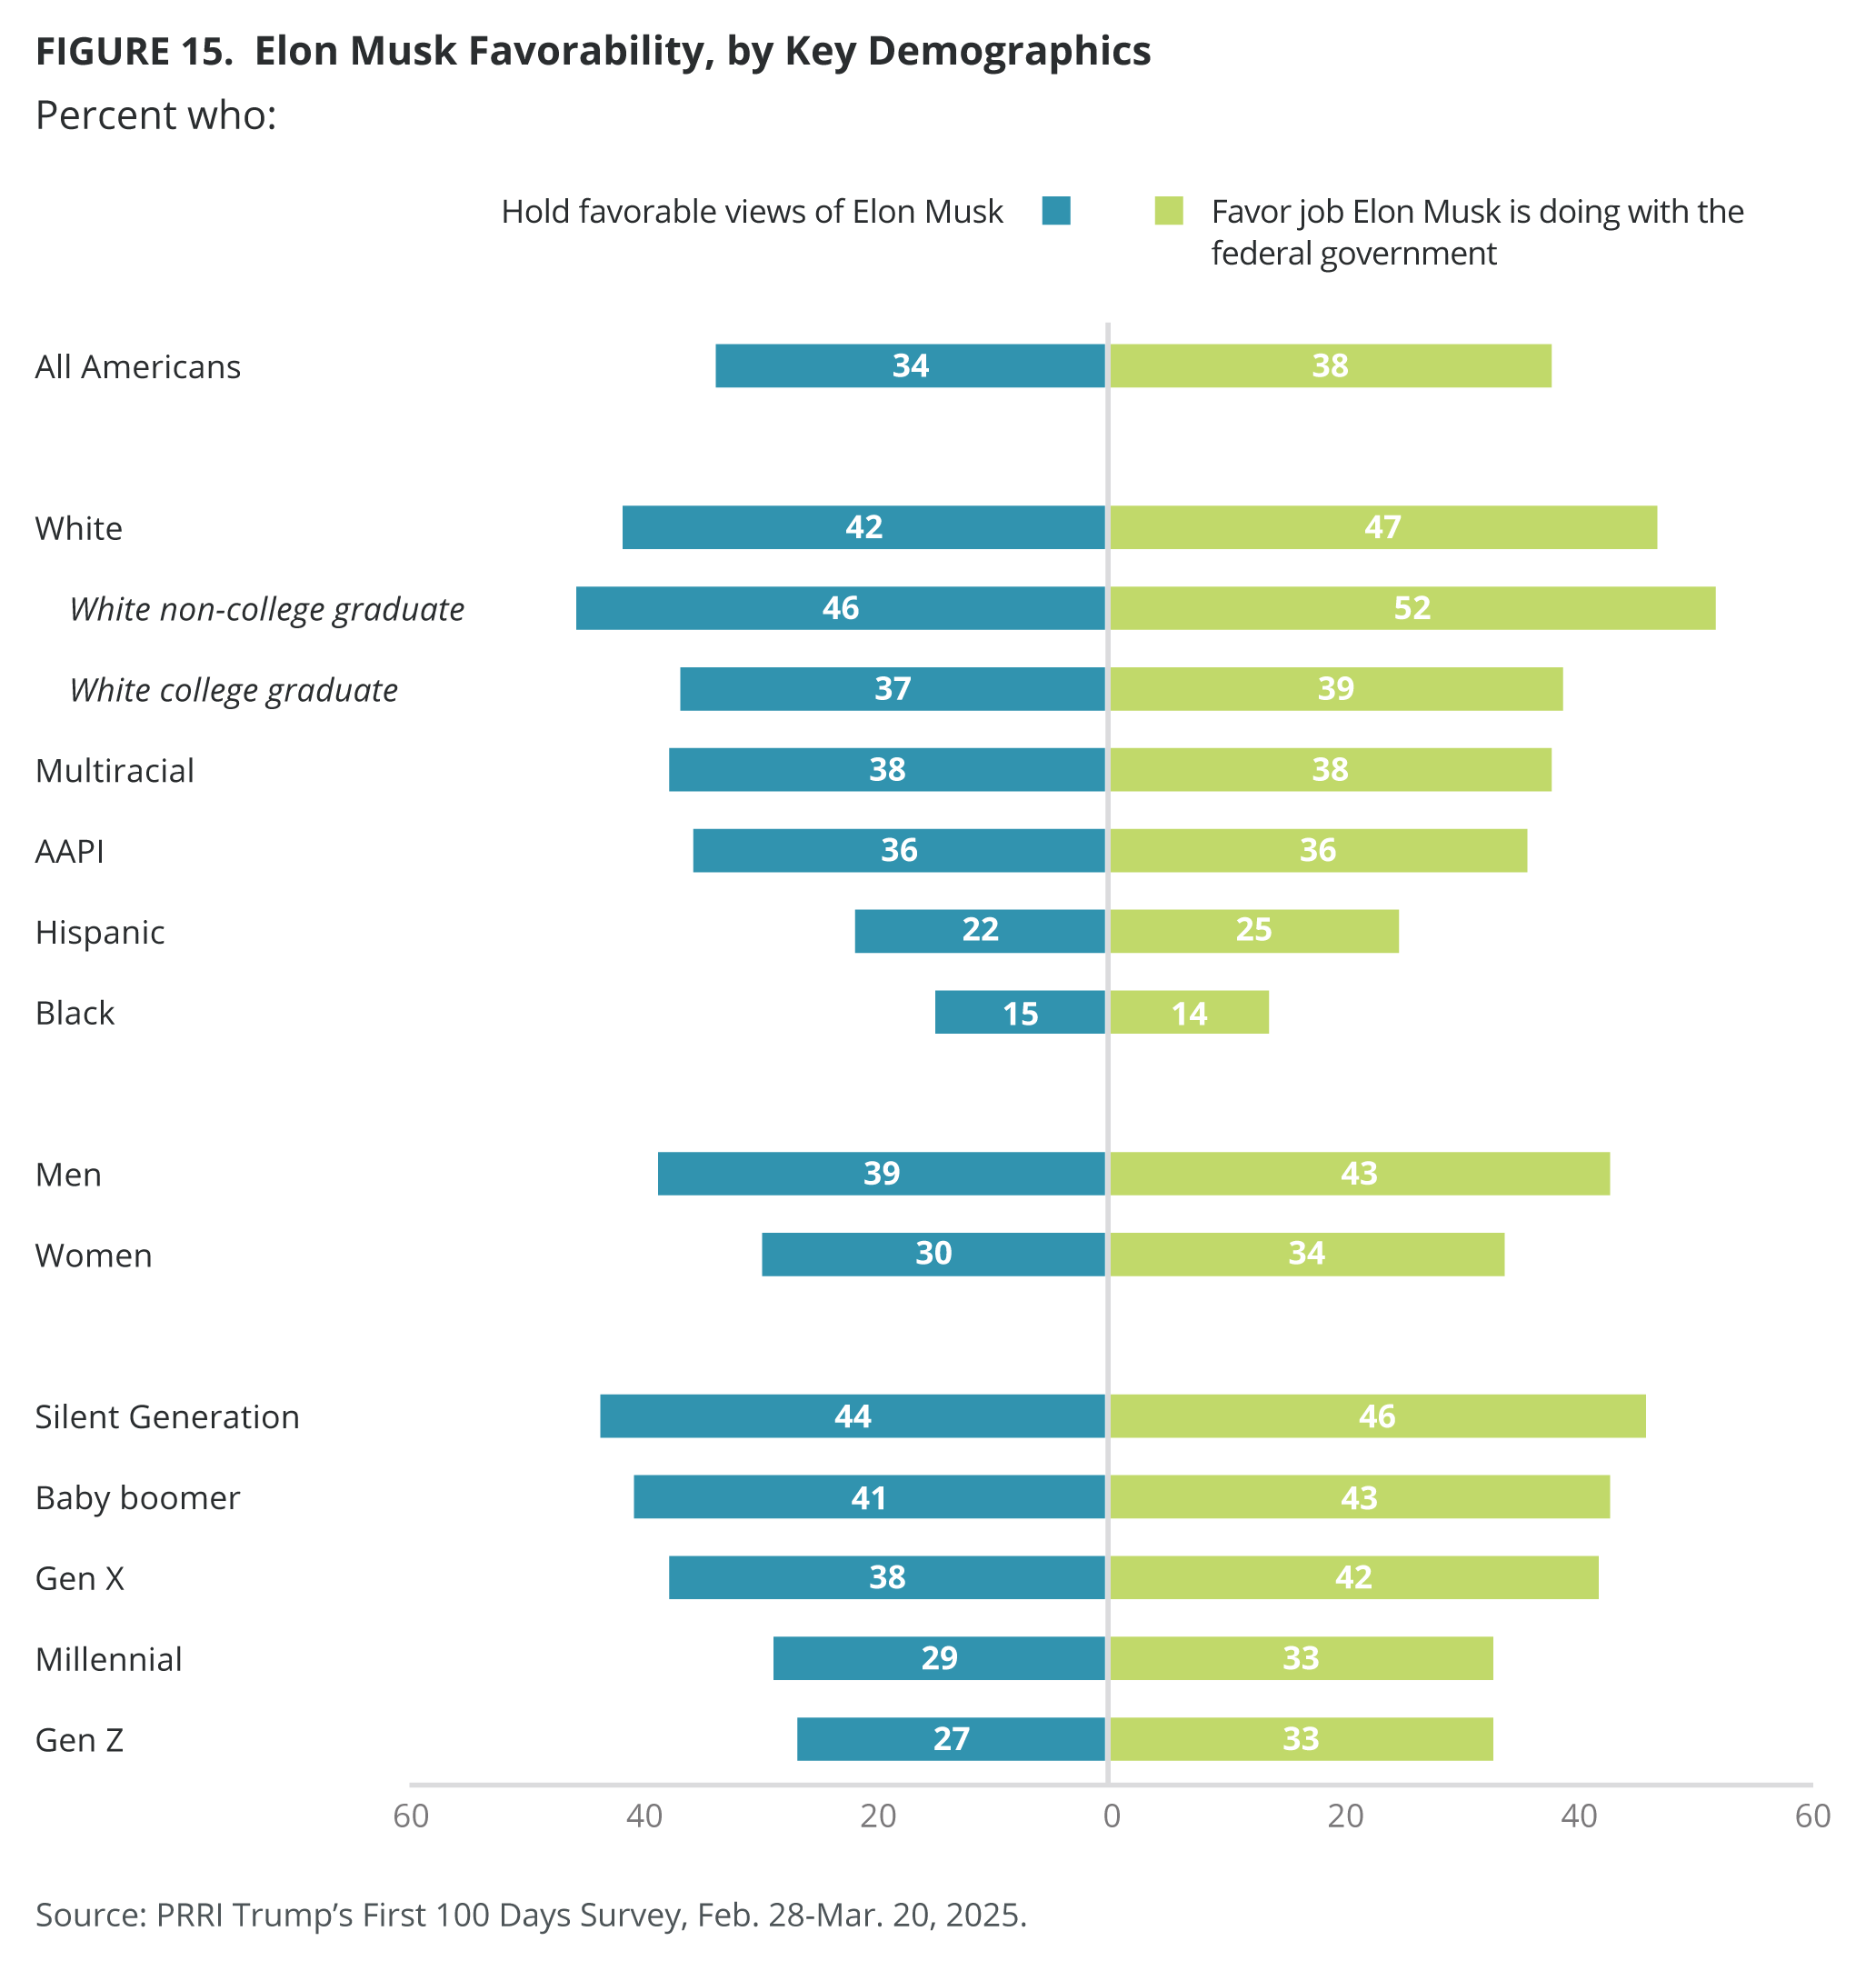
White Americans without a four-year college degree are more likely than white Americans with a college degree to show favorable views of Musk (46% vs. 37%). Men (39%) are more likely than women (30%) to view Musk favorably as are older generations than younger generations: the Silent Generation (44%), baby boomers (41%), Gen Xers (38%), millennials (29%), and Gen Zers (27%).
Elon Musk Job Approval
A majority of Americans (59%) disapprove of the job Elon Musk is doing within the federal government, including 45% who strongly disapprove, compared with nearly four in ten Americans (38%) who approve. Most Republicans (78%) approve of the job Musk is doing within the federal government, compared with one-third of independents (34%) and only 8% of Democrats.
Most Americans who trust far-right TV news sources (90%) and Fox News (83%) approve of the job Musk is doing with the federal government, compared with 38% of Americans who do not watch TV news, and 21% who trust mainstream TV news.
White Christian groups are more likely than Christians of color, non-Christians, and unaffiliated to approve of Musk’s job, including 68% of white evangelical Protestants, 55% of Latter-day Saints, and half of white Catholics (50%) and white mainline/non-evangelical Protestants (49%). Fewer Jewish Americans (33%), Hispanic Protestants (32%), other non-Christians (28%), religiously unaffiliated (26%), Hispanic Catholics (24%), and Black Protestants (15%) approve of Musk’s job within the government.
Christian nationalism Adherents (69%) and Sympathizers (62%) are significantly more likely to approve of the job that Musk is doing, compared with Skeptics (39%) and Rejecters (10%).
Black Americans have the lowest levels of approval (14%) for Musk, followed by one-quarter of Hispanic Americans (25%), more than a third of AAPI (36%), nearly four in ten multiracial Americans (38%), and nearly half of white Americans (47%). Among white Americans, those without a college degree are more likely than those with a college degree to approve (52% vs. 39%). In addition, men are more likely than women (43% vs. 34%) to approve of the job Musk is doing within the government.
Older generations are more likely than younger generations to approve of the job Musk is doing within the federal government: the Silent Generation (46%), baby boomers (43%), Gen Xers (42%), millennials (33%), and Gen Zers (33%).
Allowing Elon Musk Access Private Data
Two-thirds of Americans oppose allowing Elon Musk to access private data about American citizens at federal government agencies such as the IRS or the Social Security Administration (68% vs. 28%). Nearly all Democrats (94%), about three in four independents (73%), and four in ten Republicans (39%) oppose allowing Musk such access.
The majority of Americans who most trust mainstream TV news (85%) and do not watch TV news (69%) oppose Musk’s access to citizens’ private data, compared with just 29% of those who most trust Fox News and 17% of those who most trust far-right TV news sources.
Except for white evangelical Protestants, solid majorities of all religious groups — even other white Christian groups — oppose allowing Musk access to citizens’ private data, including Black Protestants (86%), Hispanic Catholics (81%), religiously unaffiliated (78%), Jewish Americans (77%), Hispanic Protestants (73%), other non-Christians (72%), white mainline/non-evangelical Protestants (64%), and Latter-day Saints (60%). White evangelical Protestants, however, are equally divided on this question (50% favor, 48% oppose).
Nearly all Christian nationalism Rejecters (94%) and seven in ten Skeptics (71%) oppose allowing Musk to access citizens’ private data, while Sympathizers are equally divided (50% favor, 50% oppose). The majority of Christian nationalism Adherents (56%) agree with allowing Musk to access citizens’ private data.
Opposition to allowing Musk to access private data about American citizens at federal government agencies such as the IRS or the Social Security Administration is high across race, gender, education levels, and generation.
Elon Musk Doing More Harm than Good
A majority of Americans (53%) agree that Elon Musk’s attempts to find waste and fraud in federal government agencies are reckless and doing more harm than good; more than four in ten (43%) disagree with the statement. Most Democrats (85%) agree, compared with 56% of independents and only 22% of Republicans.
Americans who most trust mainstream TV news (73%) are more likely than those who do not watch TV news (50%) to agree. In contrast, very few Americans who most trust Fox News (16%) or far-right TV news (9%) agree that Musk’s work in the government is reckless and doing more harm than good.
More than seven in ten Black Protestants (72%) and Jewish Americans (71%), as well as the majority of Hispanic Catholics (65%), religiously unaffiliated (64%), other non-Christian religions (60%), and Hispanic Protestants (58%), agree that Musk’s attempts to find fraud and waste in the federal government are reckless and harmful. White Christian groups are less likely to agree, including a plurality of Latter-day Saints (46%), white mainline/non-evangelical Protestants (45%), and white Catholics (45%). White evangelical Protestants (30%) are the least likely to agree that Musk’s attempts to find fraud and waste in the federal government are reckless and harmful.
About eight in ten Americans who qualify as Christian nationalism Rejecters (85%) agree with the negative impact of Musk’s attempts to find fraud and waste in federal agencies, followed by 53% of Skeptics, 33% of Sympathizers, and 30% of Adherents.
While there are no substantial differences by gender and generation, there are differences by race and education. About six in ten Black (67%), Hispanic (62%), and AAPI Americans (58%), as well as half of multiracial (50%), and white Americans (48%) agree that Musk’s attempts to find fraud and waste in the federal government are reckless. Among white Americans, those with a four-year college degree or higher are more likely than those without a college degree to agree (57% vs. 43%).
Authoritarianism and Political Violence
Right-Wing Authoritarianism
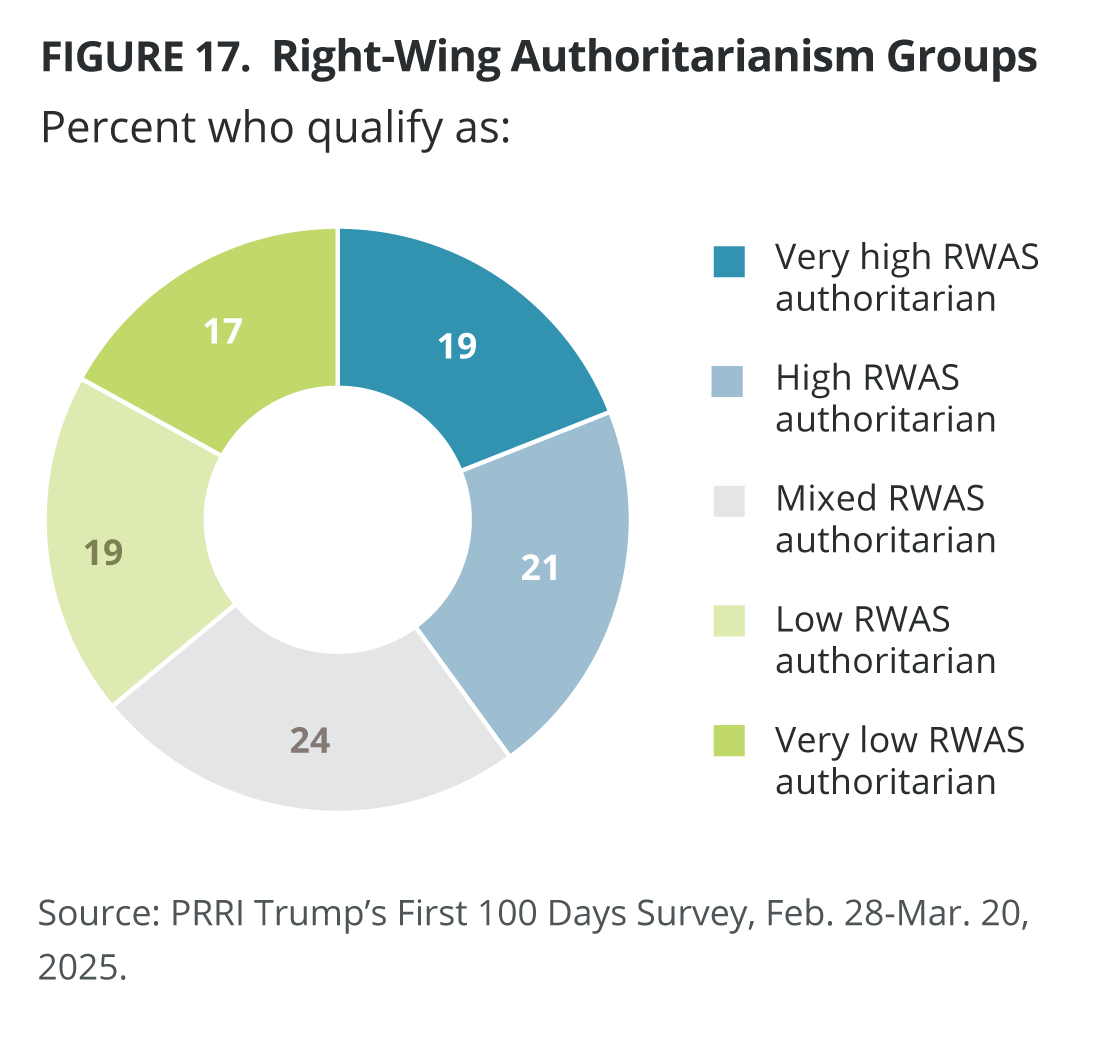
PRRI finds that most Americans do not hold highly authoritarian views. Four in ten Americans (40%) score high on the Right-Wing Authoritarian Scale, compared with a slightly lower percentage of those who score low (36%); one in four Americans qualify as having mixed opinions (24%). These classifications in our RWAS have remained stable since PRRI first developed the scale June 2024.[4]
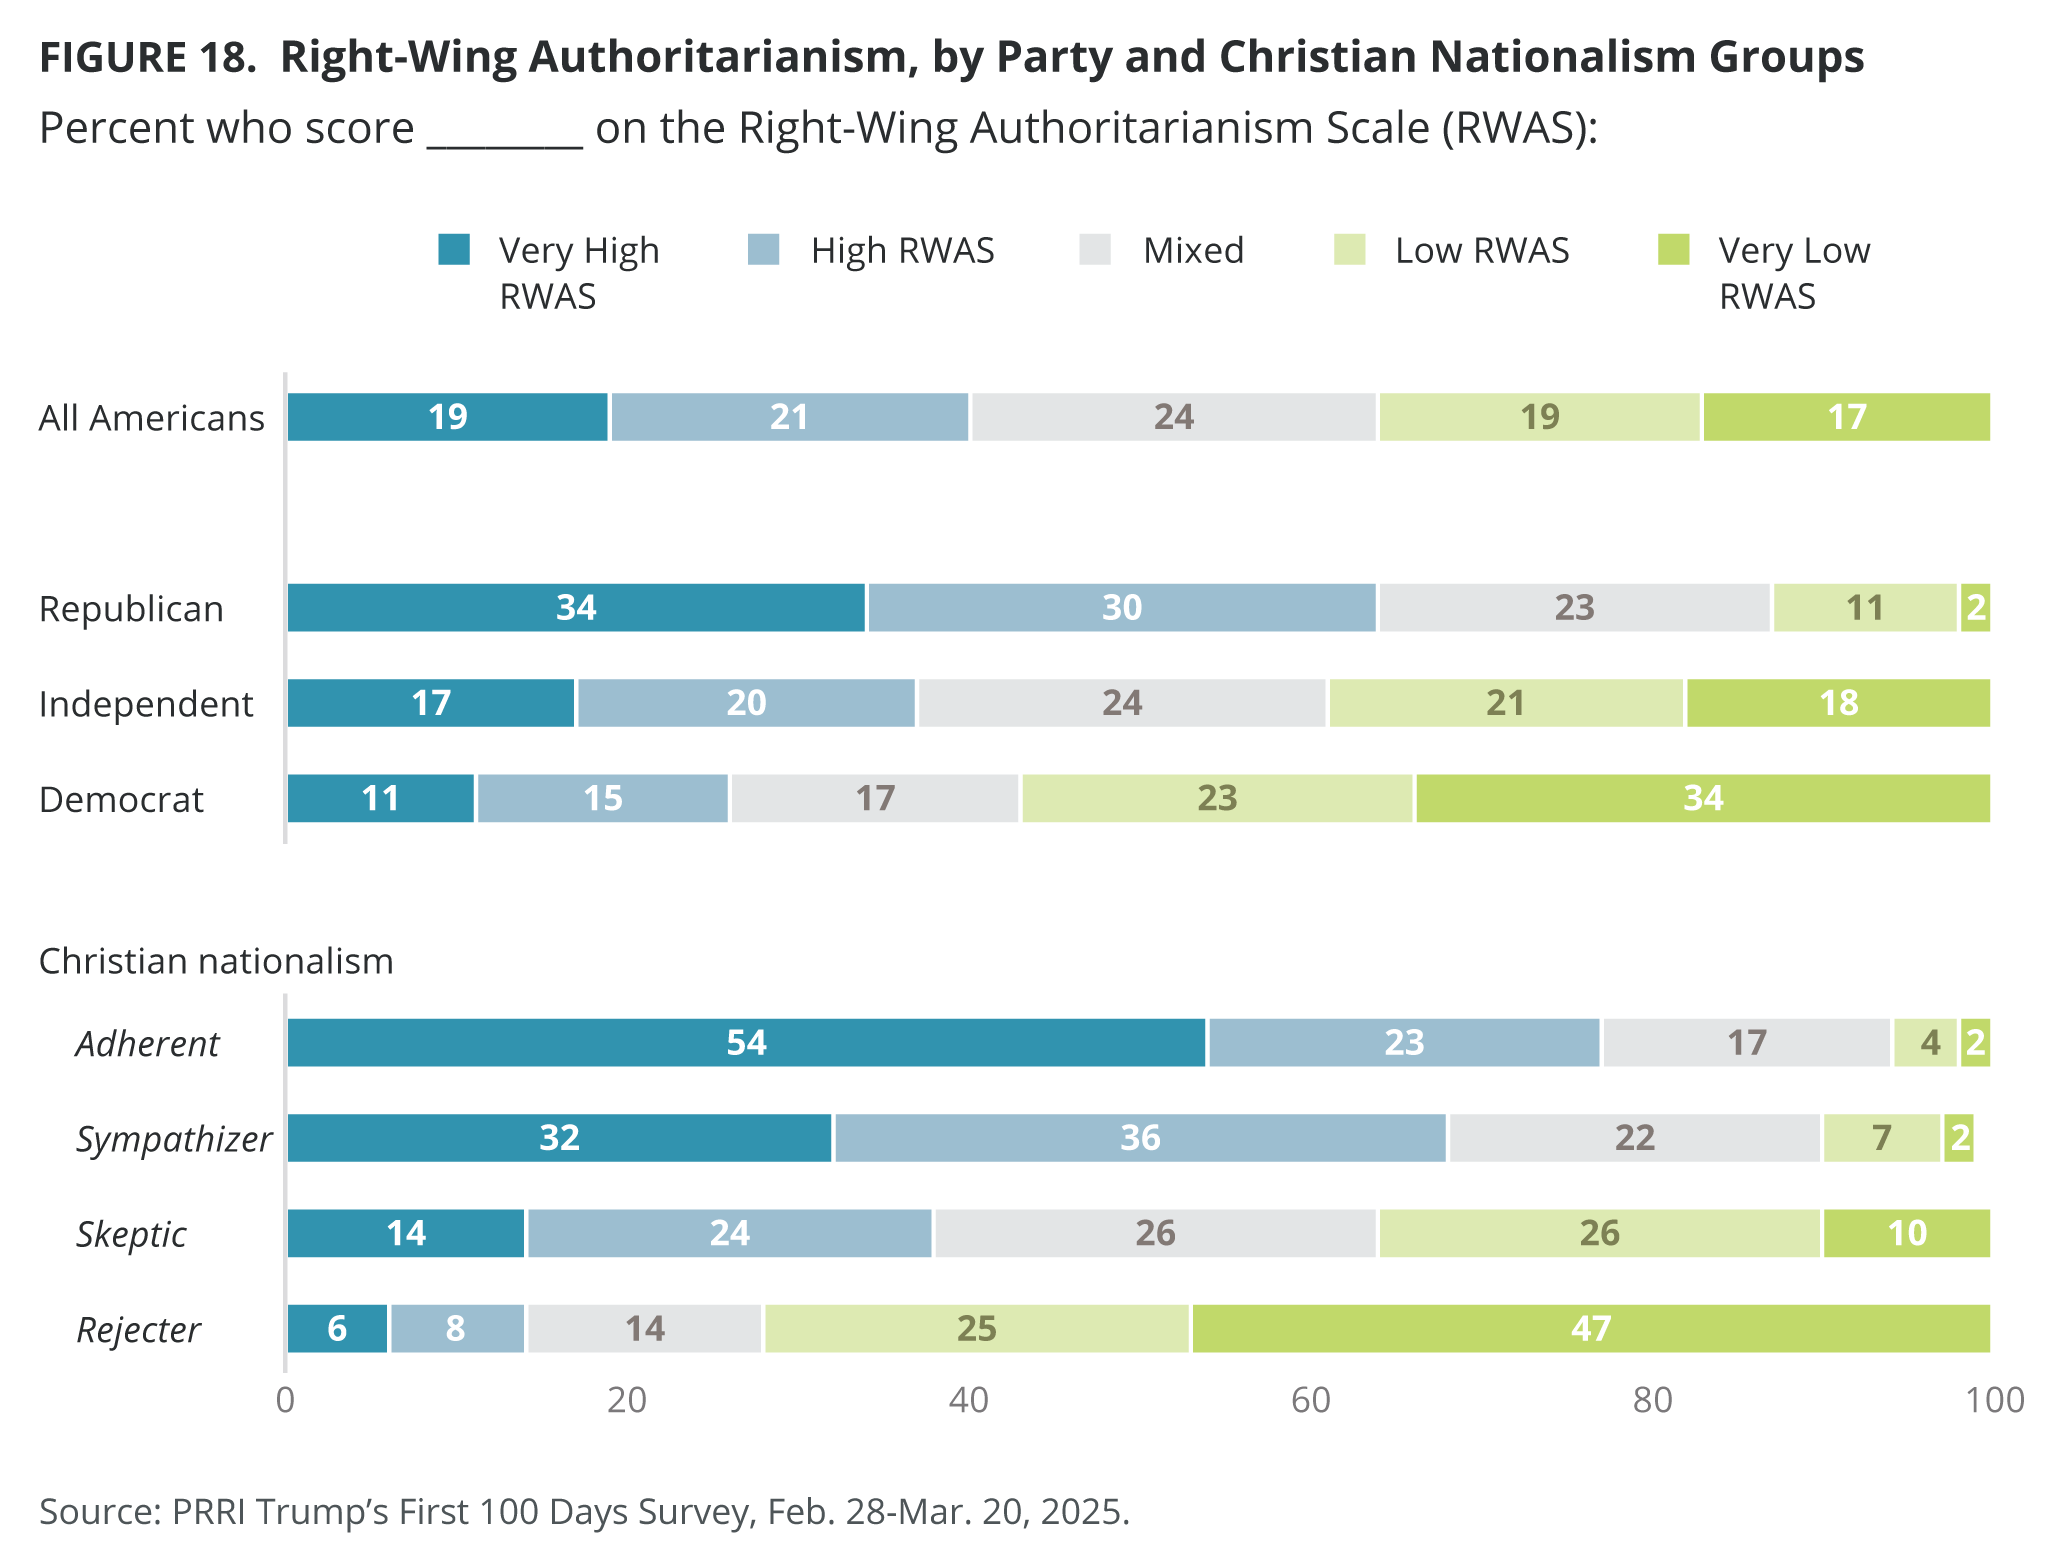
Partisanship is closely linked to right-wing authoritarian views. Two-thirds of Republicans score high on the RWAS (64%), compared with 37% of independents and 26% of Democrats. These percentages have remained consistent since 2024.
Right-wing authoritarianism views are significantly more prevalent among Americans who qualify as Christian nationalism Adherents (77%) and Sympathizers (68%). While 38% of Skeptics hold these views, the prevalence of these views among Rejecters (14%) is much smaller. The percentages across Christian nationalism groups have remained stable since June 2024.
Political Violence
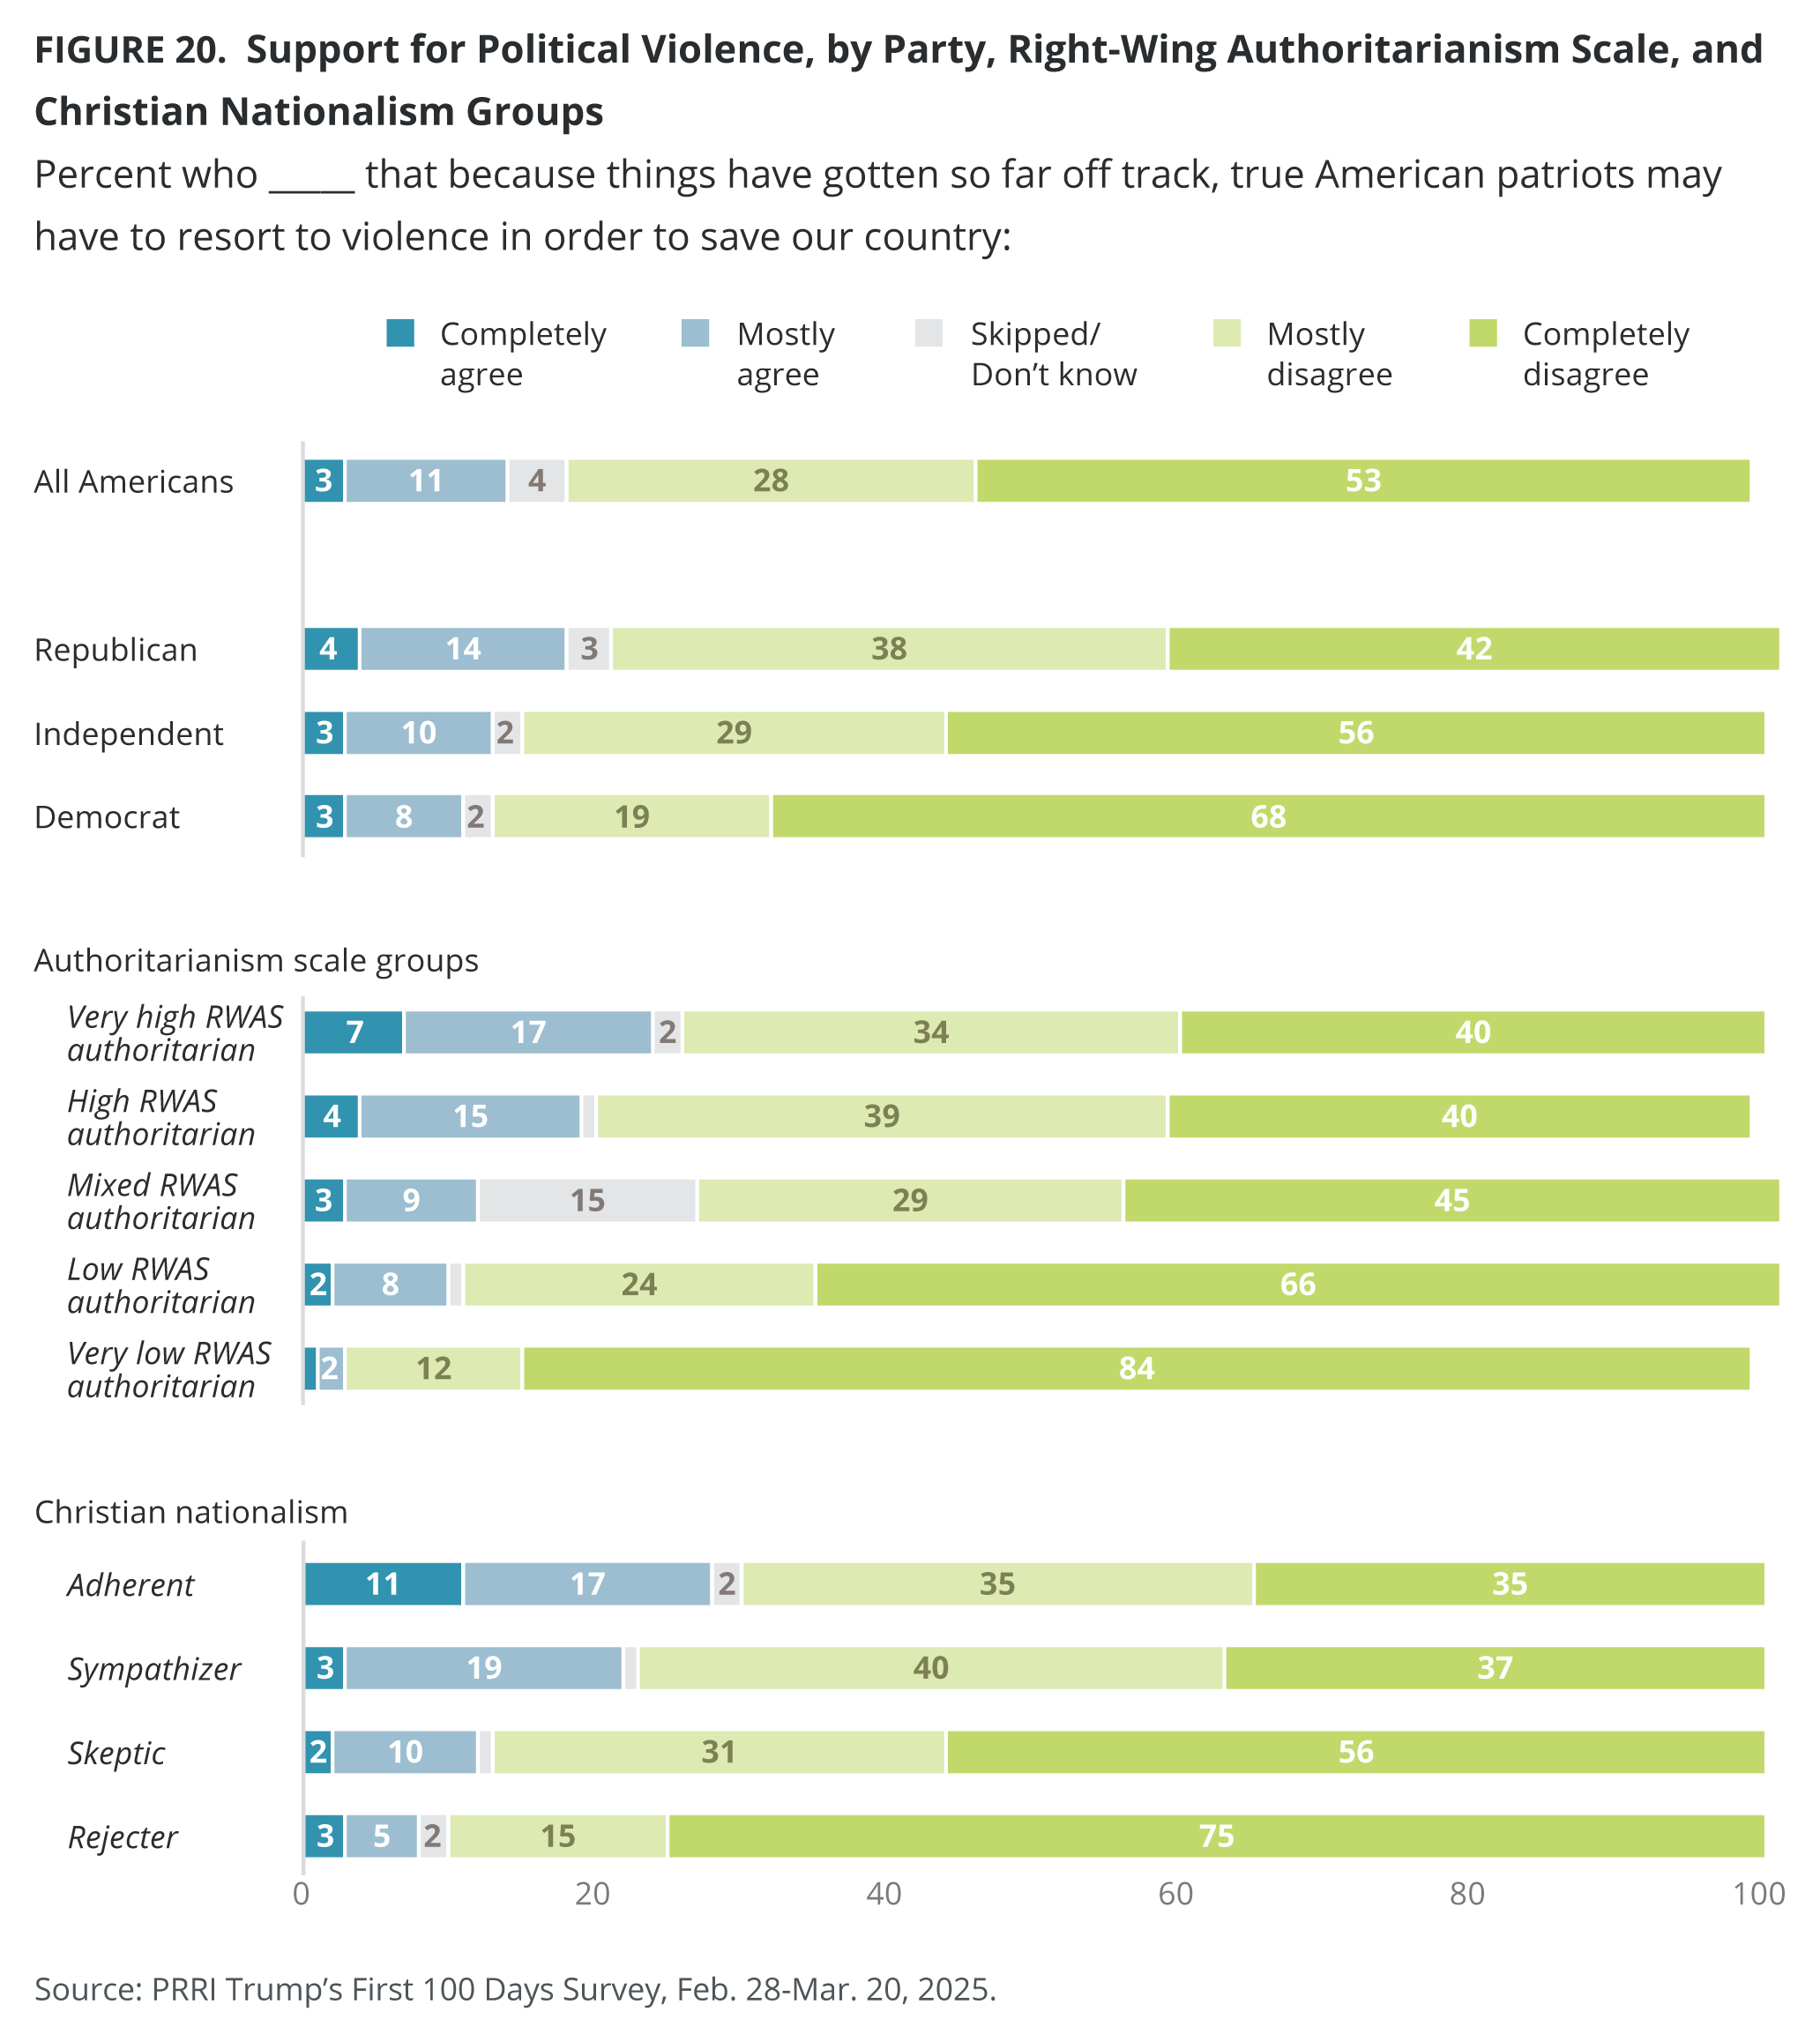
PRRI finds that most Americans (81%) disagree that “because things have gotten so far off track, true American patriots may have to resort to violence in order to save our country,” including 53% who completely disagree, compared with 14% of those who agree. Except for September 2023 when support for political violence peaked at 23%, these percentages have remained stable since the question was first asked in March 2021.
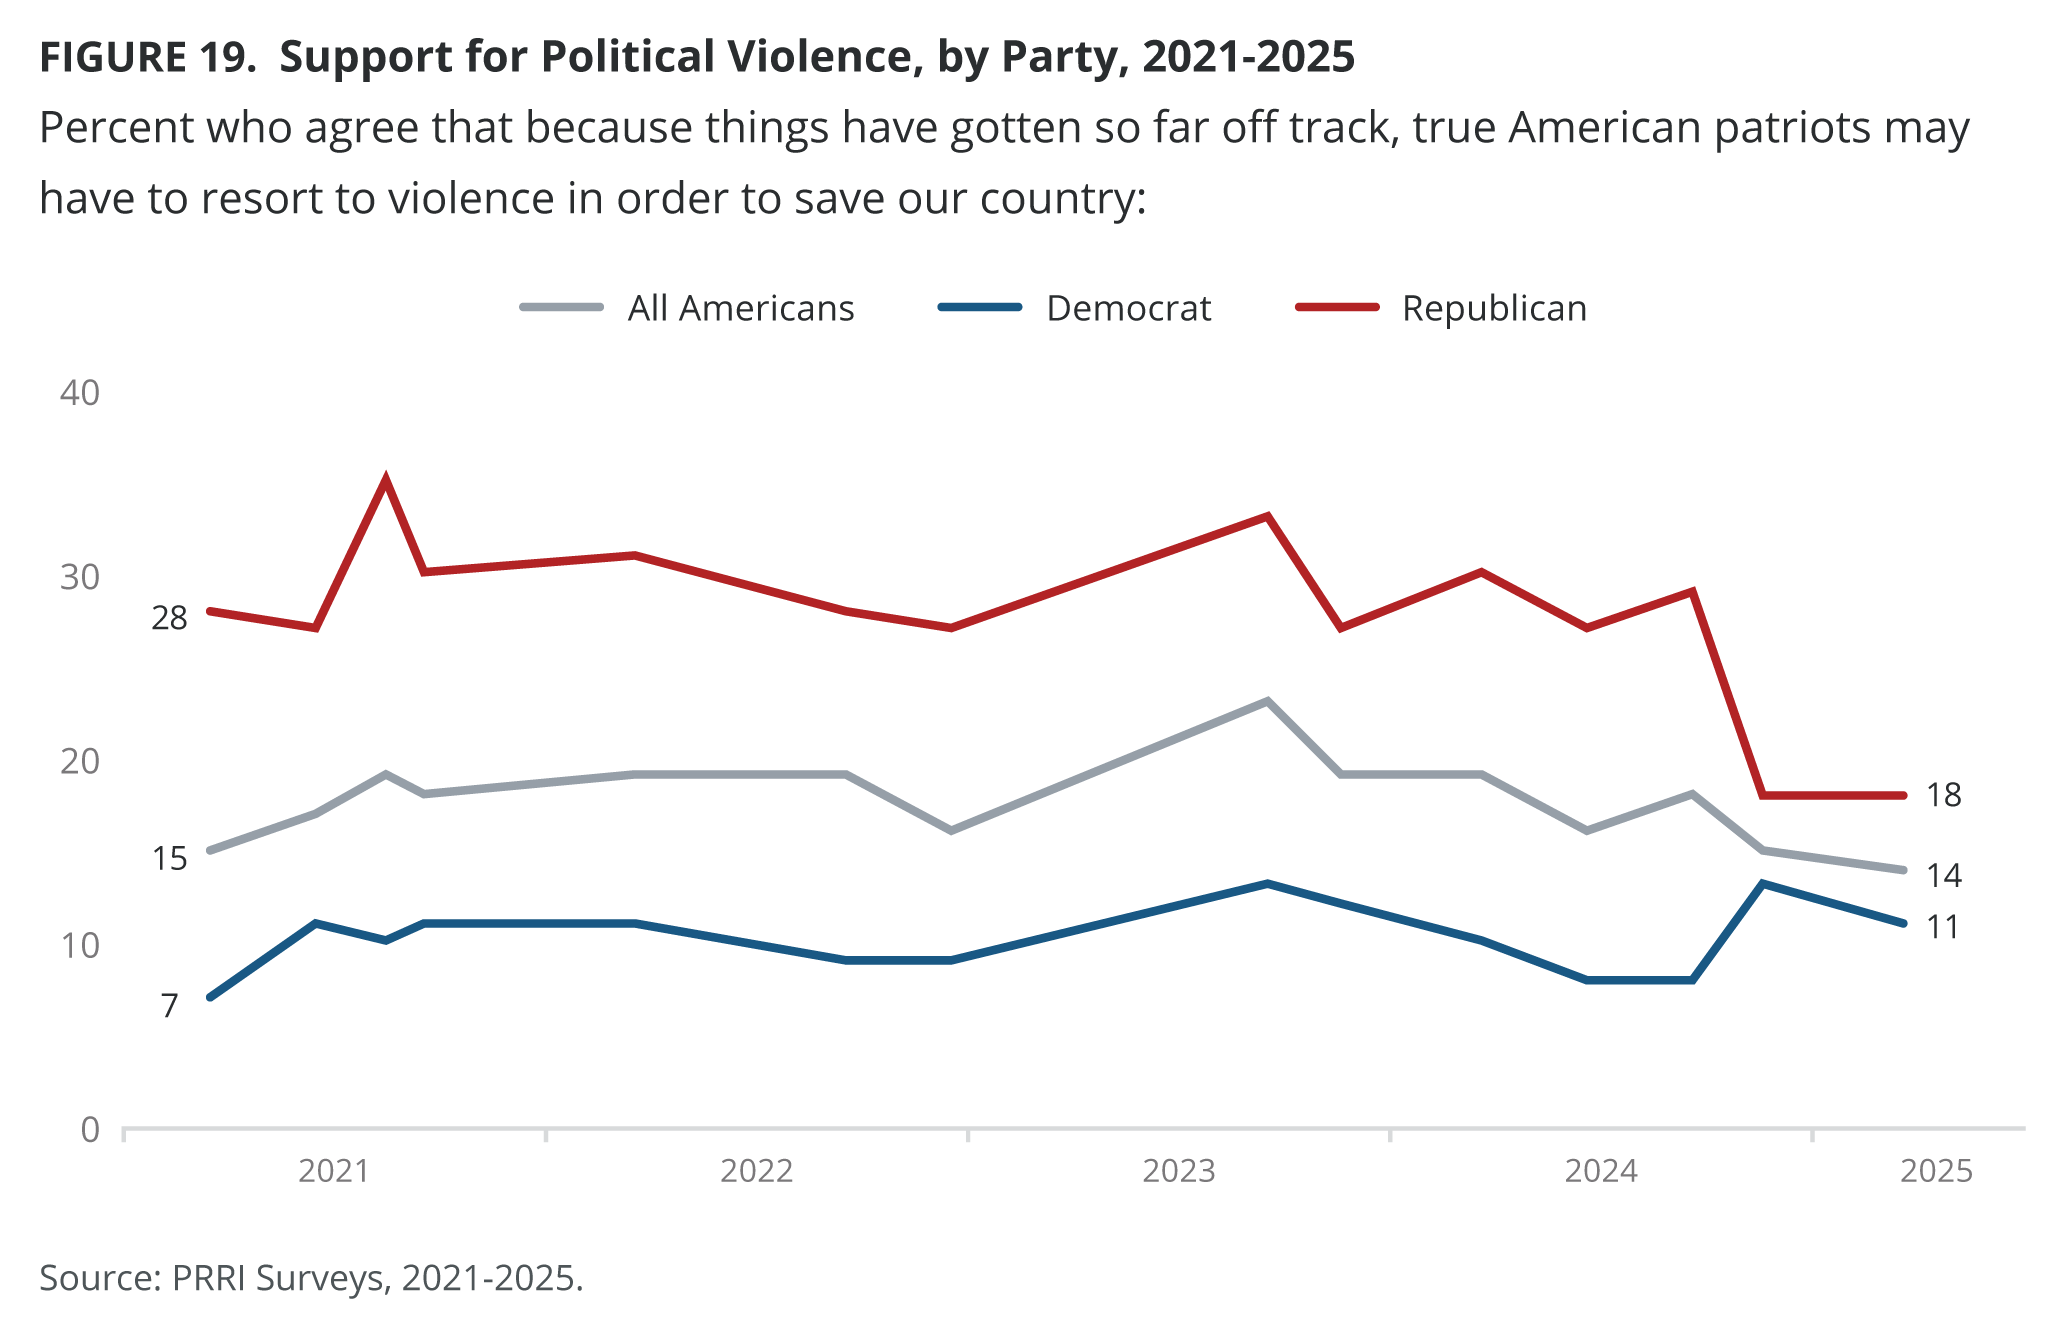
Republicans (18%) are more likely to agree that political violence may be necessary to save our country than independents (13%) and Democrats (11%). Independents’ views on this measure have been consistent since March 2021. Support for political violence among Republicans during Joe Biden’s presidency was significantly higher than today, although marked by some volatility, ranging from a low of 27% at multiple points to a high of 35% in August 2021. Republicans’ support for political violence following Trump’s installation as president is at 18% — the lowest since this question was first asked in March 2021, following the insurrection at the U.S. Capitol on Jan. 6, 2021. Democrats’ support for political violence has remained consistently low during this period, ranging from a low of 7% to a high of 13%.
Notably, Americans who score very high (24%) or high (19%) on the RWAS are significantly more likely to agree that political violence may be necessary to save the country than those who have mixed opinions (12%), score low (10%), or very low (3%).
Support for Christian nationalism is also associated with increased support for political violence. 28% of Americans who qualify as Adherents agree that true American patriots may have to resort to violence to save the country, followed closely by 22% of Sympathizers. Christian nationalism Skeptics (12%) and Rejecters (8%) are less likely to support political violence.
Christian Nationalism Favorability
Around two in ten Americans (21%) say they hold a favorable view of Christian nationalism, compared with over four in ten (43%) who hold an unfavorable view and nearly one-third (32%) who have not heard of the term. Favorability for Christian nationalism has not shifted since the question was first asked in 2022, when 20% of Americans held a favorable view. Interestingly, not only are Republicans (38%) more likely than independents (19%) and Democrats (11%) to hold favorable views of Christian nationalism, they are also more likely to say they have not heard of the term (40% vs. 31% and 24%, respectively).
A slim majority of those who most trust far-right TV news (53%) hold favorable views of Christian nationalism, followed by 44% of those who most trust Fox News, and around two in ten who do not watch TV news (17%) or most trust mainstream TV news (16%). Four in ten Americans who most trust Fox News (40%), more than one-third or less who most trust far-right TV news (35%), do not watch TV news (35%), and who most trust mainstream TV news (29%) say they have not heard of Christian nationalism.
Around four in ten white evangelical Protestants (41%) and Latter-day Saints (36%) say they view Christian nationalism favorably, compared with smaller shares of other religious groups: Hispanic Protestants (31%), white Catholics (27%), Black Protestants (25%), white mainline/non-evangelical Protestants (25%), Hispanic Catholics (16%), other non-Christians (14%), Jewish Americans (11%), and religiously unaffiliated Americans (8%). By contrast, nearly half of Hispanic Catholics (47%) say they have not heard of Christian nationalism, as do around one-third of white evangelical Protestants (36%), Black Protestants (36%), white mainline/non-evangelical Protestants (35%), Hispanic Protestants (34%), and white Catholics (33%). Around three in ten Latter-day Saints (31%), unaffiliated Americans (28%), other non-Christians (26%), and 18% of Jewish Americans report having never heard of the term.
The majority who qualify as Christian nationalism Adherents (53%) view Christian nationalism favorably, compared with 41% of Sympathizers, 18% of Skeptics, and only 2% of Rejecters. Roughly four in ten Adherents (35%), Sympathizers (40%), and Skeptics (37%), as well as 19% of Rejecters have never heard of the term.
White Americans without a four-year college degree are more likely to hold favorable views of Christian nationalism (25%) or to have never heard of the term (38%) than white Americans with a four-year degree or higher (18% and 21%, respectively). Men (25%) are more likely than women (19%) to hold favorable views of Christian nationalism; however, women are more likely than men to say they have never heard of the term (37% vs. 27%). At least around two in ten Americans in each generation hold favorable views of Christian nationalism, and one-third or fewer say they have never heard of the term.
U.S. National Identity: Diversity or Homogeneity?
The Impact of Racial and Religious Discrimination
Discrimination Against Christians
Six in ten Americans (60%) disagree with the statement “Today, discrimination against Christians has become as big a problem as discrimination against other groups,” compared with over one-third of Americans who agree (36%). Agreement with this statement has decreased from 49% since the question was first asked in 2015. A majority of Republicans (58%) agree, compared with 33% of independents and 19% of Democrats. Agreement has decreased since 2015, when 65% of Republicans, 51% of independents, and 34% of Democrats agreed.
Americans who most trust far-right TV news sources (77%) are most likely to say that discrimination against Christians has increased to the same level as discrimination against other groups, followed by 64% who most trust Fox News, 37% who do not watch TV news, and 26% who most trust mainstream TV news.
White evangelical Protestants (66%) are the only religious group where the majority believe discrimination against Christians has become as big a problem as discrimination against other groups. A plurality of Hispanic Protestants (48%), Latter-day Saints (48%), and Black Protestants (45%) agree with the statement, followed by around four in ten or less white Catholics (41%), white mainline/non-evangelical Protestants (38%), Hispanic Catholics (30%), other non-Christians (23%), religiously unaffiliated (20%), and Jewish Americans (13%).
Most Americans who qualify as Christian nationalism Adherents (79%) and Sympathizers (66%) agree discrimination against Christians is as big an issue as discrimination against other groups, compared with 33% of Skeptics and only 5% of Rejecters.
While there is little variation by race, there are differences by education. White Americans without a four-year college degree are more likely than white Americans with a college degree to believe there is increased discrimination against Christians (44% vs. 30%).
Gen Zers (34%) are significantly less likely than baby boomers (41%) and members of the Silent Generation (46%) to agree, but do not differ from millennials (32%) or Gen Xers (37%).
Discrimination Against White Americans
Six in ten Americans (60%) disagree that discrimination against white Americans has become as big a problem as discrimination against Black Americans and other minorities, compared with 37% who agree. Fewer Americans today agree with this sentiment than when the question was first asked in 2011, when just under half of Americans (46%) agreed. Six in ten Republicans (60%), 36% of independents, and 16% of Democrats agree. While Republicans’ agreement has remained consistent since 2011, agreement decreased from 45% among independents and 36% among Democrats.
Most Americans who most trust far-right TV news (69%) and most trust Fox News (64%) agree that discrimination against white Americans has become as big a problem as discrimination against Black Americans and other minorities, compared with 37% of those who do not watch TV news and 26% who most trust mainstream TV news.
White evangelical Protestants (59%) and Latter-day Saints (54%) are the only religious groups among whom a majority agree that discrimination against white Americans has become as big a problem as discrimination against Black Americans and other minorities. Less than half of white mainline/non-evangelical Protestants (47%) and white Catholics (47%) agree, followed by 33% of Jewish Americans, 31% of Hispanic Catholics, 26% of religiously unaffiliated, 25% of Hispanic Protestants, 23% other non-Christians, and 21% of Black Protestants.
Around six in ten Americans who qualify as Christian nationalism Adherents (64%) or Sympathizers (60%) agree that discrimination against white Americans has become as big a problem as discrimination against Black Americans and other minorities, compared with 36% of Skeptics and only 11% of Rejecters.
Over four in ten white Americans (43%) agree discrimination against white people is as big as a problem as other racial groups, compared with 31% of AAPI, 28% of multiracial, 27% of Hispanic, and 19% of Black Americans. White Americans without a four-year college degree are more likely than white Americans with a four-year degree or higher to agree (52% vs. 31%).
Gen Zers (29%) are less likely than older generations to agree that discrimination against white Americans is as big a problem, including 35% of millennials, 37% of Gen Xers, 42% of baby boomers, and 44% of members of the Silent Generation.
Generations of Slavery and Discrimination Against Minorities
Americans are more likely to agree than disagree with the statement “Generations of slavery and discrimination against Black people and Native Americans have given white people unfair economic advantages” (51% vs. 45%). Agreement with this statement has gone up 9 percentage points (up from 42%) since the question was first asked in 2015.
Three-fourths of Democrats (75%) agree that generations of slavery and discrimination have given white people unfair economic advantages, compared with around half of independents (52%) and one-quarter of Republicans (27%).
Americans who most trust mainstream TV news (65%) are most likely to agree, followed by 50% who do not watch TV news, 25% who most trust Fox News, and only 13% who most trust far-right TV news.
Among religious traditions, the majority of Black Protestants (69%), other non-Christian religions (66%), Jewish Americans (64%), religiously unaffiliated (61%), Hispanic Catholic (55%), and Hispanic Protestants (53%) agree that generations of slavery and discrimination have given white people unfair economic advantages. Fewer white Christian groups agree, including about four in ten white mainline/non-evangelical Protestants (45%), Latter-day Saints (42%), and white Catholics (39%), and one-third of white evangelical Protestants (32%).
Christian nationalism Rejecters (76%) are more likely than Skeptics (50%), Sympathizers (34%), and Adherents (35%) to agree with the negative effects of generations of slavery and discrimination.
Nearly seven in ten Black Americans (68%) agree that generations of slavery and discrimination have given white people unfair economic advantages, followed by 57% of AAPI, 53% of Hispanic and multiracial, and 46% of white Americans. White Americans with a four-year college degree or higher are more likely than white Americans without a four-year degree to agree (54% vs. 41%).
While there are no differences by gender, there are some differences by generation. A majority of Gen Zers (54%) and millennials (55%) agree that generations of slavery and discrimination have given white people unfair economic advantages, compared with 47% of Gen Xers, 50% of baby boomers, and 45% of members of the Silent Generation.
Black Lives Matter Movement
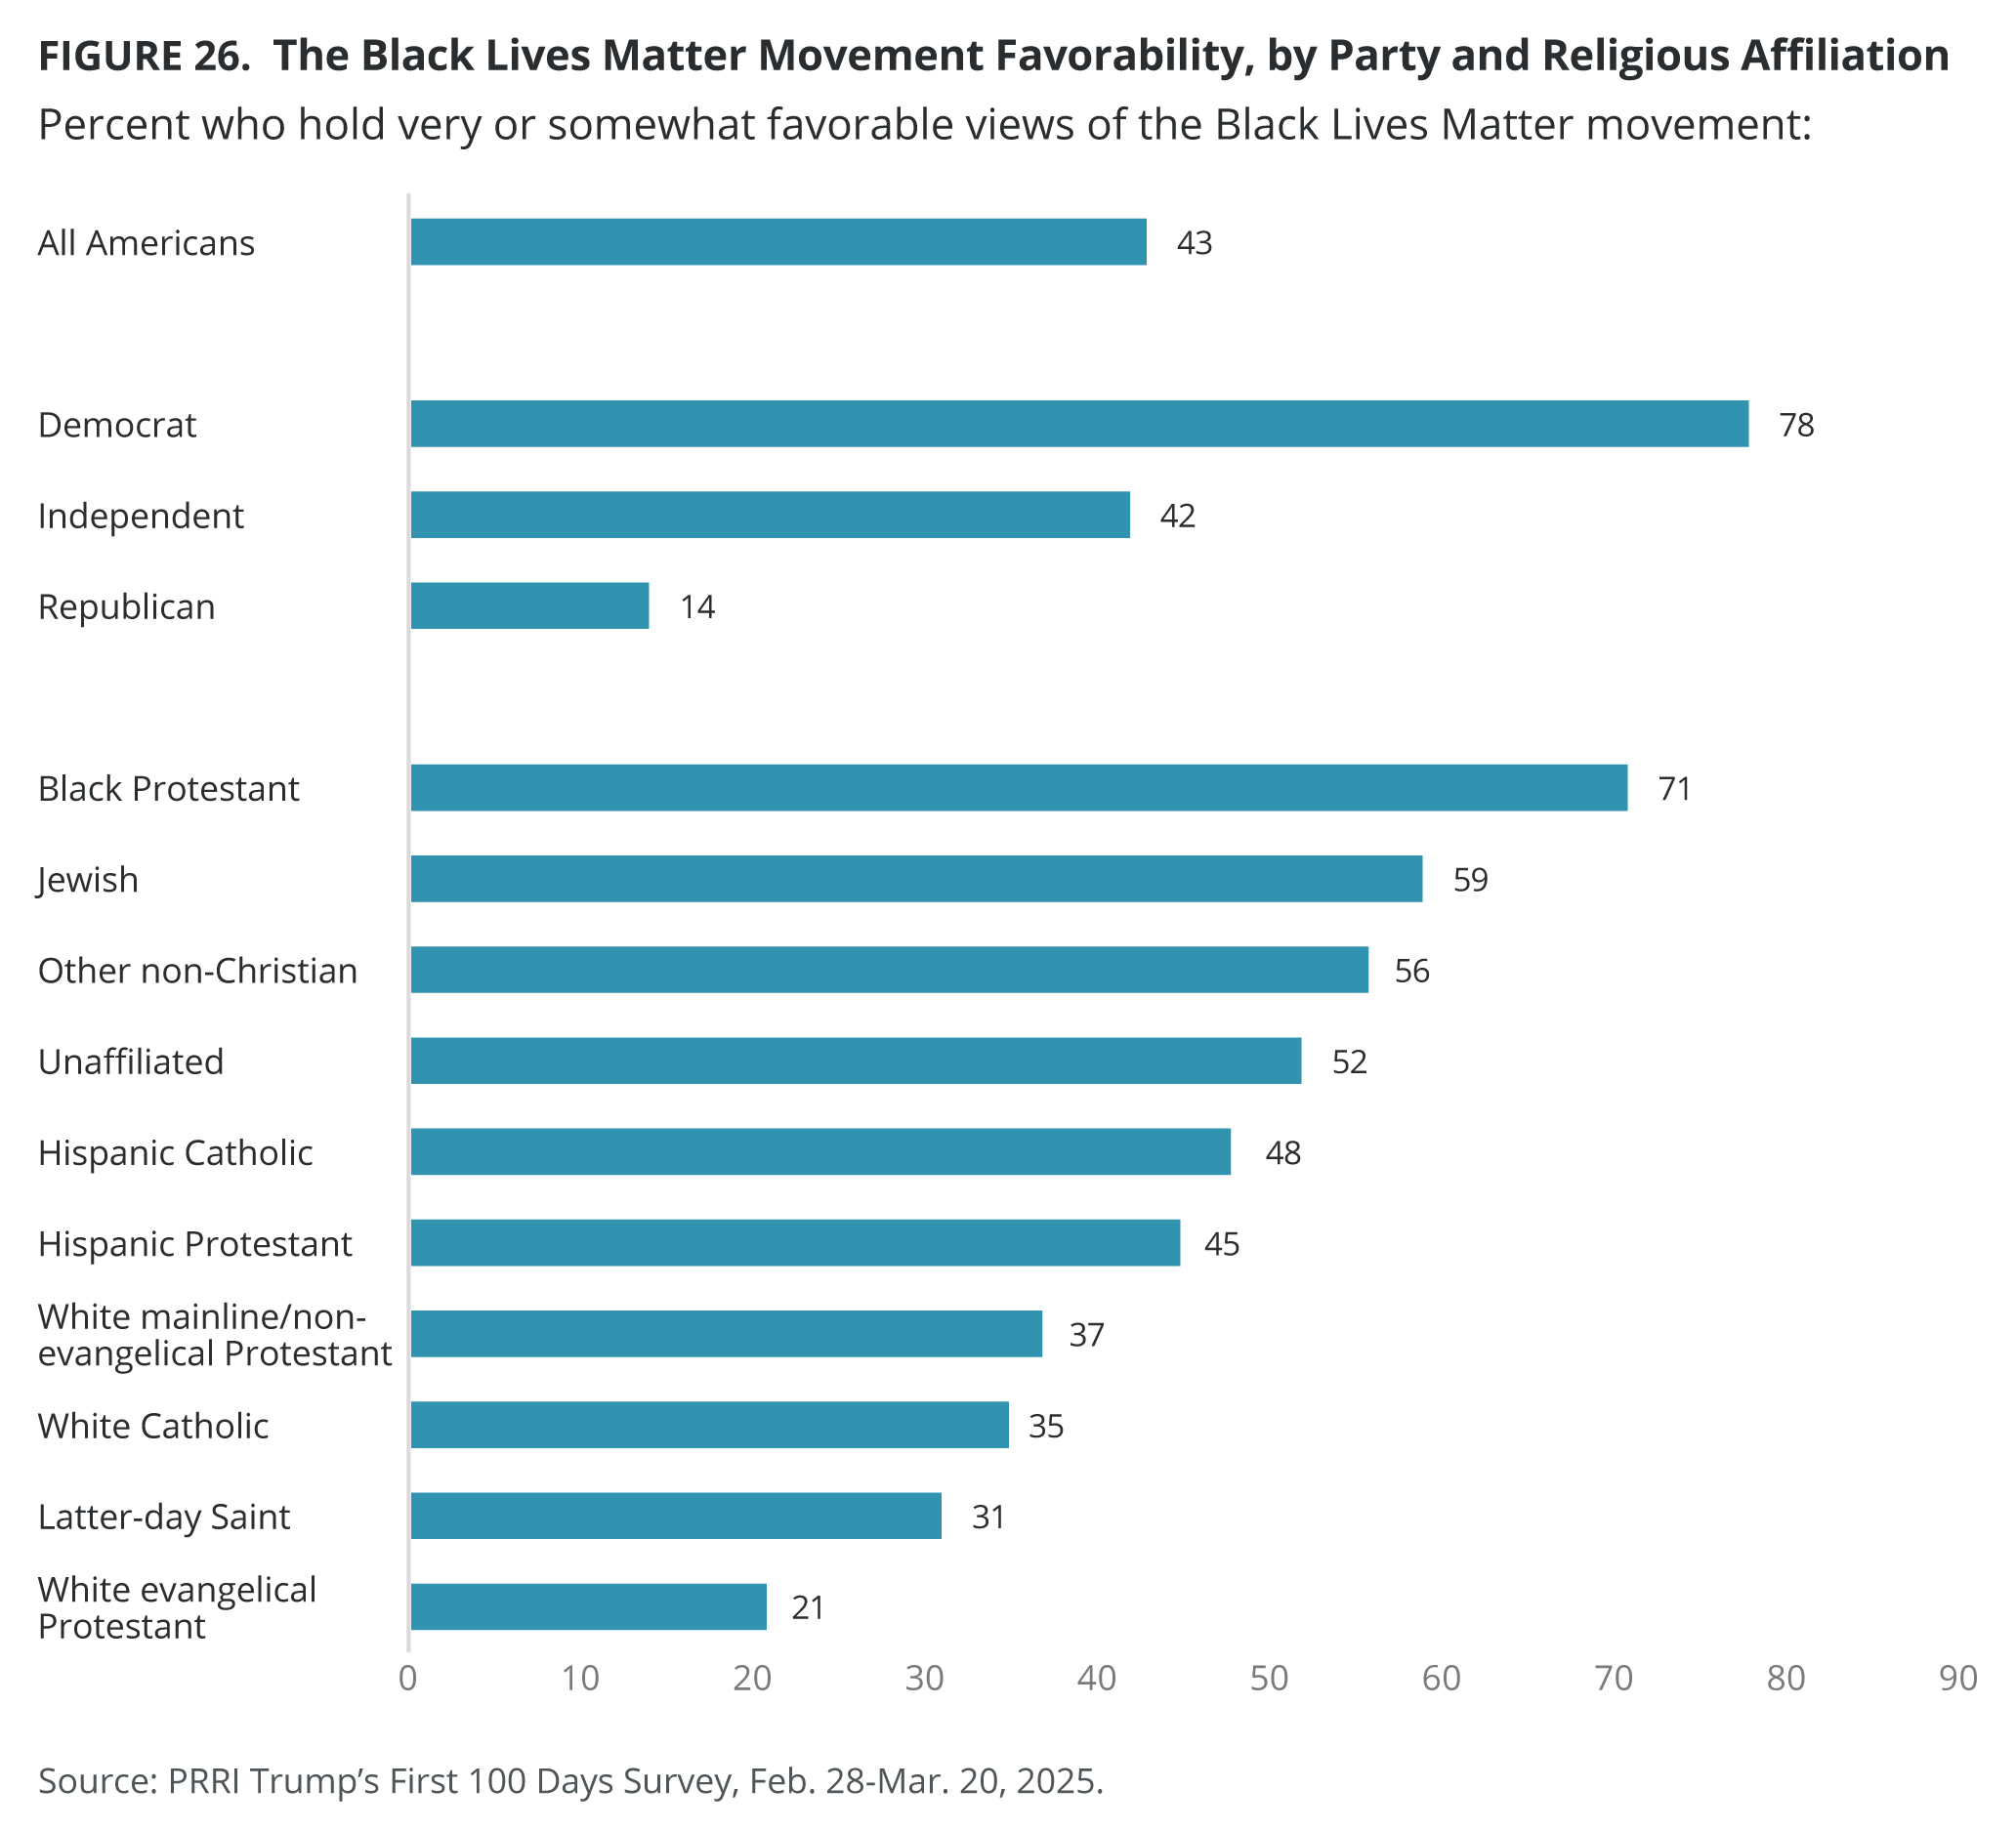
More than four in ten Americans (43%) hold favorable views of the Black Lives Matter Movement, while 49% hold unfavorable views of the movement. Nearly eight in ten Democrats (78%) view the Black Lives Matter movement favorably, compared with 42% of independents and only 14% of Republicans. Americans who most trust mainstream TV news (59%) are more likely than those who do not watch TV news (39%), who most trust Fox News (18%), and who most trust far-right TV news (6%) to hold favorable views of the Black Lives Matter movement.
Around seven in ten Black Protestants (71%) and the majority of Jewish Americans (59%), other non-Christian religions (56%), and religiously unaffiliated Americans (52%) hold favorable views of the Black Lives Matter movement. Less than half of Hispanic Catholics (48%) and Hispanic Protestants (45%), less than four in ten white mainline/non-evangelical Protestants (37%) and white Catholics (35%), three in ten Latter-day Saints (31%), and two in ten white evangelical Protestants (21%) hold favorable views of the movement. Hispanic Catholics (18%) and Hispanic Protestants (14%) are the only religious groups where more than one in ten have not heard of the Black Lives Matter movement.
Seven in ten Americans who qualify as Christian nationalism Rejecters (70%) say they view the Black Lives Matter movement favorably, compared with 41% of Skeptics, 26% of Sympathizers, and 21% of Adherents.
Black Americans (64%) are the only group where the majority hold favorable views of the Black Lives Matter movement. A plurality of AAPI (45%), Hispanic (44%), multiracial (42%) and white Americans (38%) hold favorable views of the movement. Nearly two in ten Hispanic Americans (16%) have not heard of the Black Lives Matter movement, compared with less than one in ten Americans in other racial groups. White Americans with a four-year college degree or higher (45%) are more likely than white Americans without a four-year degree (34%) to hold favorable views of the Black Lives Matter movement.
Women (47%) are also more likely than men (39%) to hold favorable views of the movement. Nearly half of Gen Zers (48%) and around four in ten millennials (43%), Gen Xers (39%), baby boomers (43%), and members of the Silent Generation (40%) say they view the Black Lives Matter movement favorably.
Perceptions of Diversity Initiatives: Benefit or Burden?
A majority of Americans (54%) are more likely to agree with the statement “Efforts to increase diversity almost always strengthen an organization’s workforce” than with the statement “Efforts to increase diversity always come at the expense of white people” (41%). Both statements are divided along party lines, with eight in ten Democrats (79%) agreeing with the first statement, while two thirds of Republicans agree with the second statement (64%). Independents are more likely to agree with the first than the second statement (55% vs. 42%).
Americans who most trust mainstream TV news (66%) are more likely to agree that diversity is almost always beneficial to an organization’s workforce, compared with 54% who do not watch TV news, 33% who most trust Fox News, and only 20% who most trust far-right TV news.
More than six in ten other non-Christians (69%), Black Protestants (66%), Hispanic Protestants (65%), Hispanic Catholics (65%), religiously unaffiliated (65%), and Jewish Americans (61%) agree that efforts to increase diversity almost always strengthen an organization’s workforce. By contrast, except for white mainline/non-evangelical Protestants who are evenly divided (50% view diversity positively, 48% view diversity negatively), majorities of all other white Christian groups, including 62% of white evangelical Protestants, 60% of Latter-day Saints, and 53% of white Catholics, agree that efforts to increase diversity almost always come at the expense of white people.
The majority of Christian nationalism Rejecters (81%) and Skeptics (56%) agree with the idea that efforts for diversity almost always strengthen an organization’s workforce, compared with over one-third of Sympathizers (38%) and Adherents (35%).
More than six in ten Black (64%), Hispanic (64%), and AAPI Americans (64%) agree with the benefits of diversity in an organization, followed by 52% of multiracial and 49% of white Americans. White Americans with a four-year college degree or higher are more likely to agree than white Americans without a four-year degree (55% vs. 45%).
Women are more likely than men to agree (58% vs. 51%). Except for members of the Silent Generation (42%), the majority of each generation agree that diversity strengthens an organization, including 57% of Gen Zers, 59% of millennials, 52% of Gen Xers, and 53% of baby boomers.
Support for Racial Diversity and Religious Pluralism in America
Racial Diversity
Eight in ten Americans (80%) say they would prefer the U.S. to be a nation made up of people from all over the world, while just 15% say they would prefer the U.S. to be a nation primarily made up of people of western European heritage. Most Democrats (91%), independents (83%), and Republicans (73%) would prefer a racially diverse country.
Most Americans across media trust, religious affiliation, race, gender, education levels, and generation say they would prefer a racially diverse nation. Christian nationalism Adherents (63%) and Sympathizers (75%) are less likely to prefer a racially diverse nation over a nation primarily made up of people of western European heritage, compared with Christianism nationalism Skeptics and (84%) and Rejecters (93%).
Religious Pluralism
Seven in ten Americans (70%) say they would prefer the U.S. to be a nation made up of people belonging to a wide variety of religions, compared with 25% of Americans who say they would prefer a nation primarily made up of people who follow the Christian faith. Democrats (86%) are more likely than independents (75%) and Republicans (56%) to say they would prefer the U.S. to be a religiously pluralistic nation.
White evangelical Protestants (47%) are the only religious tradition with less than half in favor of religious pluralism in the U.S. The majority of all other religious groups prefer religious pluralism: Jewish Americans (93%), religiously unaffiliated Americans (84%), non-Christian religions (83%), Hispanic Catholics (75%), white mainline/non-evangelical Protestants (74%), Latter-day Saints (73%), white Catholics (70%), Black Protestants (68%), and Hispanic Protestants (59%).
The majority of Americans who qualify as Christian nationalism Rejecters (95%), Skeptics (78%), and Sympathizers (53%) prefer a religiously diverse nation, compared with only 36% of Adherents; a majority of Adherents (63%) prefer a nation primarily made up of people who follow the Christian faith.
Most Americans across media trust (except for those who trust most far-right TV news, at 46%), race, gender, education levels, and generation prefer a religiously diverse nation over a nation primarily made up of people who follow the Christian faith.
Teaching American History
The vast majority of Americans (86%) agree with the statement “We should teach American history that includes both our best achievements and our worst mistakes.” In contrast, just one in ten Americans (10%) agree with the statement “We should teach American history that only focuses on what makes this country exceptional and great.” Around nine in ten Americans of each party affiliation agree with the first statement, including 90% of Democrats, 89% of independents, and 86% of Republicans.
Most Americans, regardless of media trust, religious affiliation, race, gender, education levels, and generation, agree that we should teach both the positive and negative sides of American history.
Other Issues
Immigration
Belief in the Great Replacement Theory
Two-thirds of Americans (64%) disagree with the statement “Immigrants are invading our country and replacing our cultural and ethnic background,” compared with 33% who agree. Since the statement was first asked in September 2019 (36%), agreement has fluctuated between a low of 29% in August 2021 and a high of 38% in September 2023. Republicans (60%) are more likely than independents (30%) and Democrats (12%, down from 20% in 2019) to agree with the Great Replacement Theory.
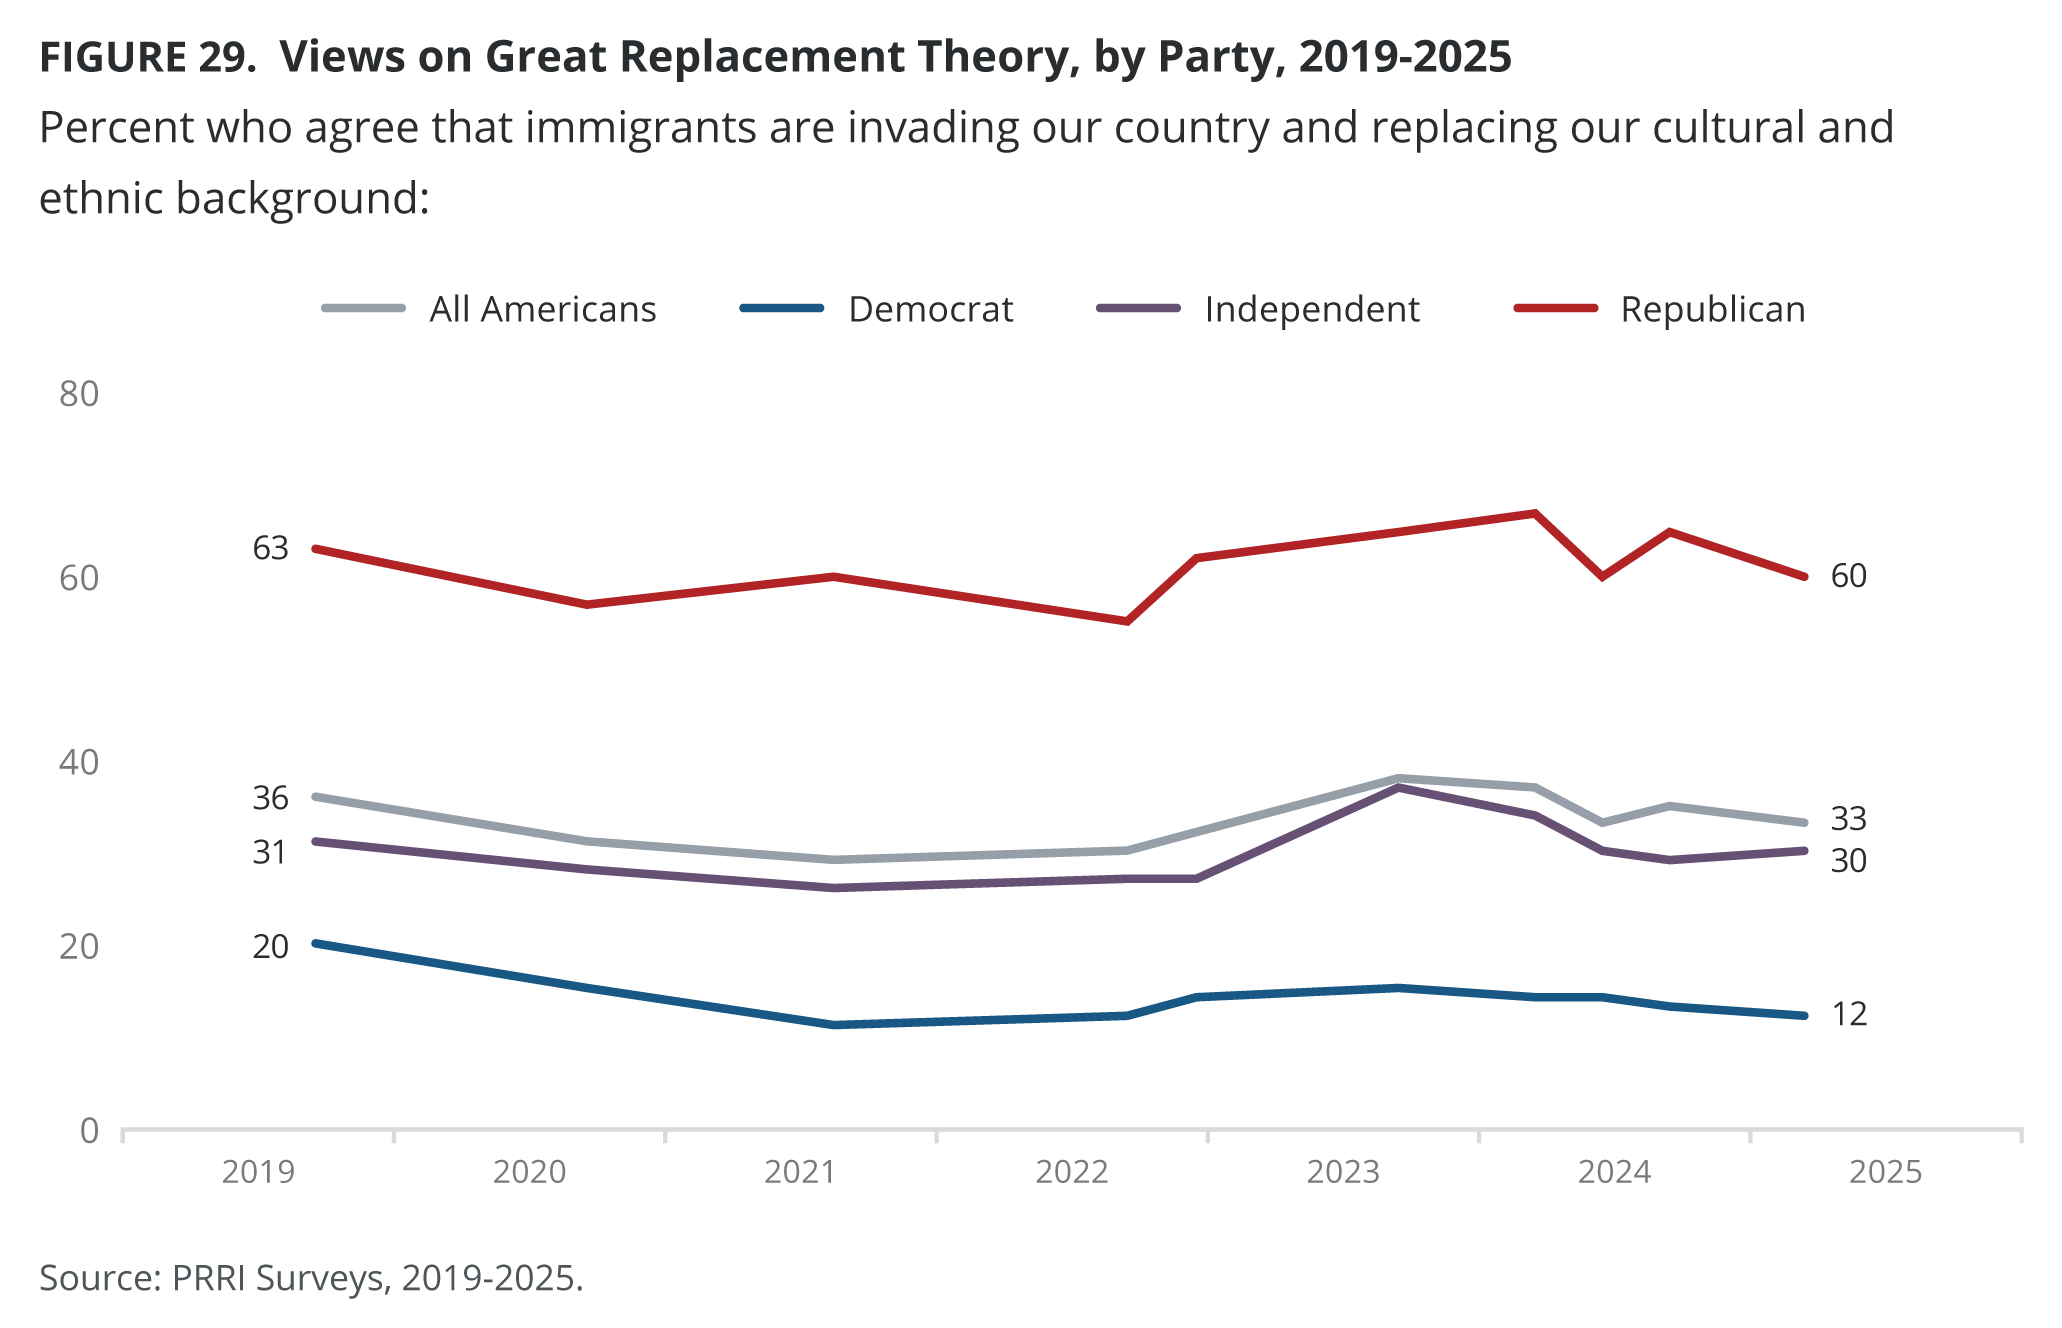
Americans who most trust far-right news sources (76%) and most trust Fox TV News (64%) are more likely to agree with the statement than Americans who do not watch TV News (31%) and Americans who most mainstream TV news (22%).
White evangelical Protestants (57%) are the only religious group with majority agreement with the Great Replacement Theory. Around four in ten white Catholics (46%) and white mainline/non-evangelical Protestants (41%), and one-quarter of Jewish Americans (28%), Black Protestants (27%), and unaffiliated Americans (24%) agree. Around two in ten members of other non-Christian religions (22%), Hispanic Protestants (18%), and Hispanic Catholics (18%) also agree.
Christian nationalism Adherents (66%) and Sympathizers (54%) are notably more likely than Skeptics (31%) and Rejecters (8%) to agree with the Great Replacement Theory.
U.S. Military Encampments for Undocumented Immigrants
Six in ten Americans (61%) disagree that the federal government should place immigrants who are in the country illegally in internment camps guarded by the U.S. military until they can be deported, while over just one-third agree (35%). Republicans (62%) are far more likely to agree that the federal government should place immigrants who are in the country illegally in internment camps guarded by the U.S. military until they can be deported, compared with either independents (31%) or Democrats (15%).
Americans who most trust far-right TV news sources (80%) and Americans who most trust Fox News (65%) are significantly more likely than those who do not watch TV news (31%) and those who most trust mainstream media sources (27%) to agree that the federal government should place undocumented immigrants in internment camps until they are deported.
White evangelical Protestants (56%) are the only religious group with majority support for militarized encampments for undocumented immigrants. Nearly half of white Catholics (47%), and white mainline/non-evangelical Protestants (47%) also agree, while only three in ten non-Christians (34%), Black Protestants (31%), and Jewish Americans (28%) agree. Religiously unaffiliated Americans (23%), Hispanic Protestants (22%), and Hispanic Catholics (19%) are the least likely to agree.
A majority of Christian nationalism Adherents (64%) and Sympathizers (56%) agree that undocumented immigrants should be placed in guarded military encampments, compared with 34% of Skeptics and just 13% of Rejecters.
Around four in ten white (41%) and AAPI (39%) Americans support the federal government setting up military encampments, followed by one-third of multiracial Americans (33%) and two in ten Black (25%) and Hispanic (20%) Americans. Among white Americans, those without a college degree are more likely than those with a college degree to agree (47% vs. 31%).
Men are more likely than women to agree (38% vs. 33%). Except for members of the Silent Generation (52%), no other generation reaches majority support for setting up militarized internment camps to detain undocumented immigrants before deportation, including 40% of baby boomers, 38% of Gen Xers, 30% of millennials, and 27% of Gen Zers.
Gender and Gender Identity
Support for Traditional Gender Roles
Over one-third of Americans (37%) agree that society is better off when men and women stick to the jobs and tasks they are naturally suited for, while 58% disagree. Agreement has remained relatively stable since the question was first asked in 2016 (39%), with a low of 32% in June 2024. In 2025, a majority of Republicans agree (55%), an 11-percentage-point increase from 44% in 2016. Agreement is lower among independents (39%) and Democrats (21%), with Democrats showing a decline from 31% in 2016.
Most viewers of far-right TV news (66%) and Fox News (56%) agree, compared with 36% of those who report not watching TV news (36%) and those who most trust mainstream TV news sources (31%).
Beliefs that traditional gender roles improve society vary by religious affiliation. Only white evangelical Protestants (55%) show majority agreement with the idea that men and women should stick to tasks they are better suited for. A plurality of white Catholics (45%), Hispanic Protestants (43%), Hispanic Catholics (42%), Black Protestants (39%), and white mainline/non-evangelical Protestants (37%) agree. Support for traditional gender roles is lower among non-Christians (28%), religiously unaffiliated Americans (27%), and Jewish Americans (26%).
Two-thirds of Christian nationalism Adherents (67%) and 60% of Sympathizers agree that society is better off with traditional gender roles, compared with 38% of Skeptics, and only 12% of Rejecters.
While there are no racial differences, men (41%) are slightly more likely than women (34%) to agree. The Silent Generation (55%) is the only group where the majority support traditional gender roles, compared with 37% of Gen Xers, baby boomers, and millennials, and 35% of Gen Zers.
Equal Rights and Protections for Transgender People
Seven in ten Americans (71%) agree that transgender people deserve the same rights and protections as other Americans, with only one-quarter of Americans disagreeing (24%). A majority in each political party agrees, including 87% of Democrats, 77% of independents, and 56% of Republicans.
The majority of Jewish Americans (81%), religiously unaffiliated Americans (80%), Hispanic Catholics (78%), white mainline/non-evangelical Protestants (77%), white Catholics (74%), members of other non-Christians (74%), and Black Protestants (70%) agree. Around six in ten Hispanic Protestants (61%) and white evangelical Protestants (55%) agree.
Among white Americans with a four-year college degree, eight in ten (82%) agree that transgender people deserve equal rights and protections under the law, a 17-percentage-point difference in agreement compared with white Americans without a four-year degree (65%).
Transgender Bathroom Laws
While most Americans support equal protections for transgender people (71%), a majority also support laws that require transgender individuals to use bathrooms that correspond to their sex at birth (57%). Around four in ten Americans oppose restrictive bathroom laws (38%). A large majority of Democrats (64%) oppose restrictive bathroom laws, compared with 38% of Independents and 15% of Republicans.
Opinions on restrictive bathroom laws vary by religious affiliation. Jewish Americans (61%) and religiously unaffiliated (55%) are the only religious groups with majority opposition to the implementation of restrictive bathroom laws. Half or less of other religious groups, including 47% of non-Christian religions, 38% of white mainline/non-evangelical Protestants, 37% of Hispanic Catholics, 34% of Black Protestants, white Catholics, and Latter-day Saints, 24% of Hispanic Protestants, and 17% of white evangelical Protestants oppose implementing restrictive bathroom laws.
Americans who qualify as Christian nationalism Rejecters (71%) and Skeptics (37%) are more likely to oppose laws requiring transgender people to use bathrooms that correspond to their sex at birth, compared with Christian nationalism Adherents (18%) and Sympathizers (18%).
Half of AAPI Americans (50%) oppose restrictive bathroom laws, compared with 40% of multiracial, 39% of white, 38% of Black, and 36% of Hispanic Americans.
Mandatory Vaccines for Children
Nearly three-quarters of Americans (73%) believe mandatory vaccines for children should be legal in all or most cases, compared with one-quarter of Americans (24%) who believe they should be illegal in all or most cases. Nine in ten Democrats (90%), three-quarters of independents (73%), and six in ten Republicans (63%) say mandatory vaccines for children should be legal in all or most cases.
Most Americans across media trust (except for those who most trust far rights news, 40%), religious affiliation, Christian nationalism beliefs, race, gender, education levels, and generation say that mandatory vaccines for children should be legal in all or most cases.
APPENDIX A. Survey Methodology
The survey was designed and conducted by PRRI. The survey was conducted among a representative sample of 5,025 adults (age 18 and up) living in all 50 states in the United States, who are part of Ipsos’s KnowledgePanel and an additional 372 who were recruited by Ipsos using opt-in survey panels to increase the sample sizes in smaller states. Interviews were conducted online between February 28th – March 20th, 2025.
Respondents are recruited to the KnowledgePanel using an addressed-based sampling methodology from the Delivery Sequence File of the USPS – a database with full coverage of all delivery addresses in the U.S. As such, it covers all households regardless of their phone status, providing a representative online sample. Unlike opt-in panels, households are not permitted to “self-select” into the panel; and are generally limited to how many surveys they can take within a given time period.
The initial sample drawn from the KnowledgePanel was adjusted using pre-stratification weights so that it approximates the adult U.S. population. Next, a probability proportional to size (PPS) sampling scheme was used to select a representative sample.
To reduce the effects of any non-response bias, a post-stratification adjustment was applied. The needed benchmarks were obtained from the latest 2024 March supplement of the Current Population Survey (CPS), except language proficiency, which is not available from CPS, and was obtained from the 2023 American Community Survey (ACS). Additionally, the 2024 vote choice benchmark was obtained from the Associated Press Tabulation of Certified Results. The post-stratification weight rebalanced the sample based on the following benchmarks: gender by age, race/ethnicity, education, income, language proficiency, Census region by metropolitan status, and 2024 presidential vote choice. Additionally, we included individual states (50 states plus D.C.) to account for the oversampling of some states.
The margin of error for the national survey is +/- 1.69 percentage points at the 95% level of confidence, including the design effect for the survey of 1.6. In addition to sampling error, surveys may also be subject to error or bias due to question wording, context, and order effects. Additional details about the KnowledgePanel can be found on the Ipsos website: https://www.ipsos.com/en-us/solution/knowledgepanel
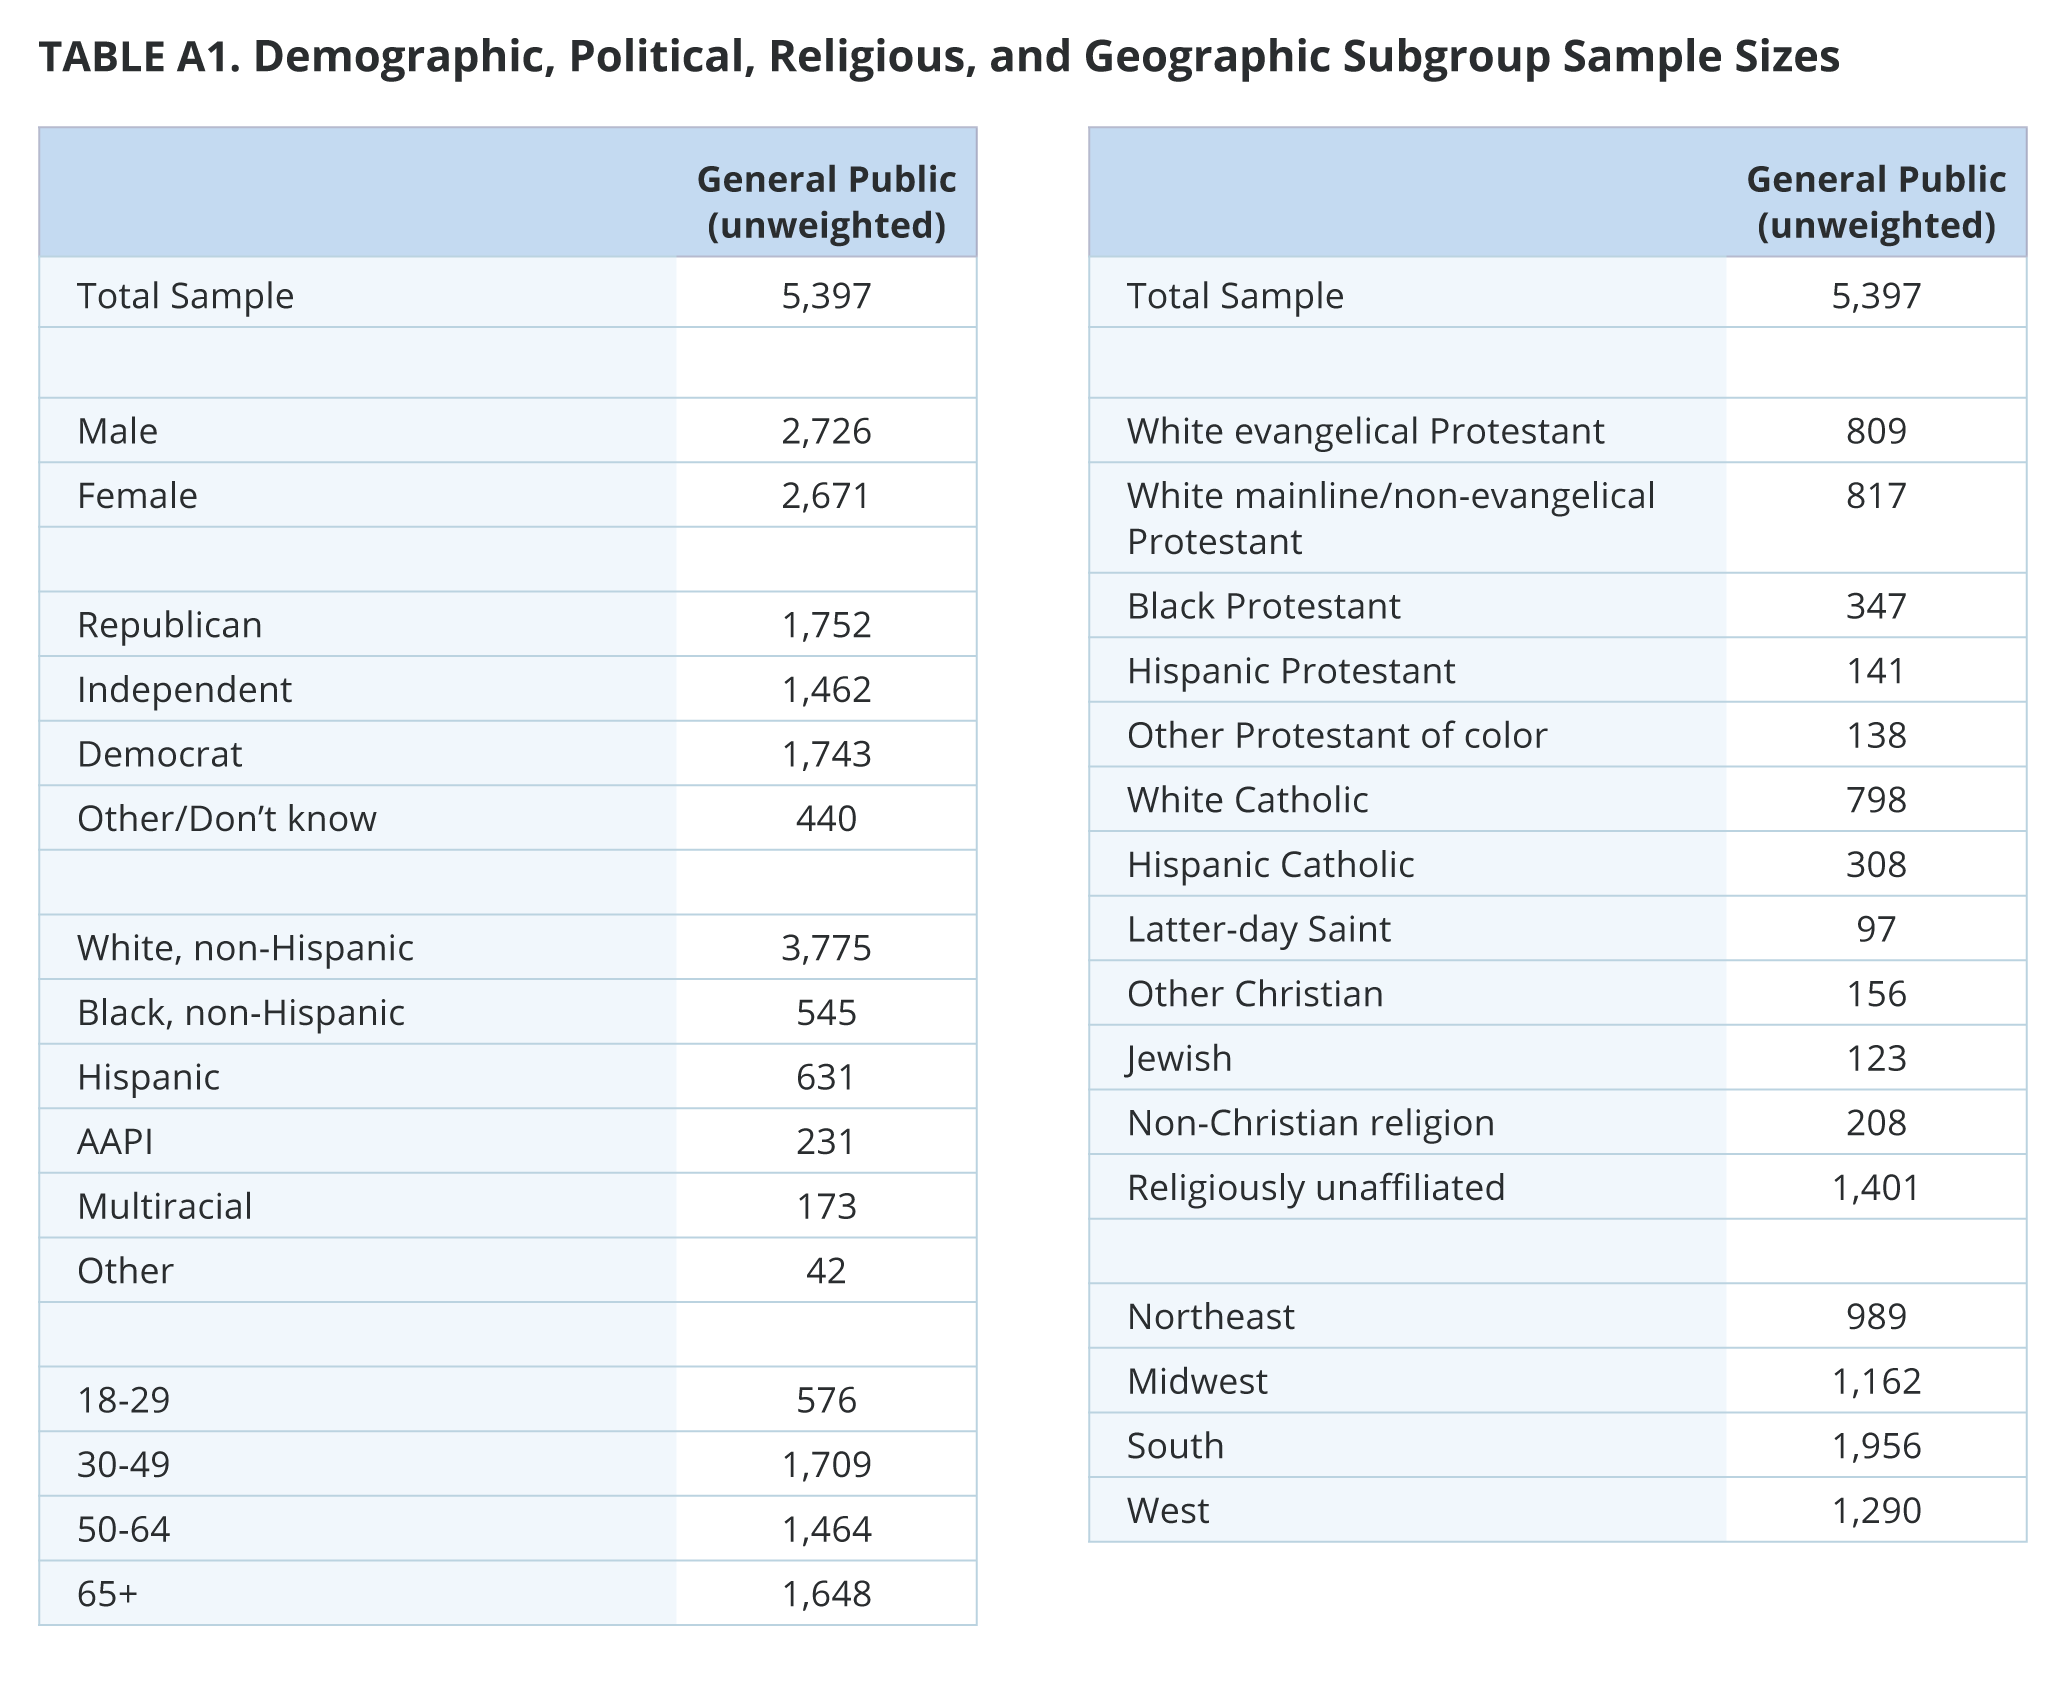
[1] The number of cases for Latter-day Saints is 97.
[2] Figure 4 depicts favorability ratings for Trump taken during the first quarter of each year. No favorability ratings of Trump are available in the 2022 data, which may affect direct comparisons.
[3] The number of cases of Harris voters who regret their vote is too small to report.
[4] For more information on how the Right-Wing Authoritarianism Scale was created, see our September 2024 report “One Leader Under God: The Connection Between Authoritarianism and Christian Nationalism in America.”