Introduction
State of the Country
Critical Issues
“Litmus Test” Issues That Drive Voting Choices
Views of The Biden Administration
Assessments of 2024 Candidates
Aftermath of the 2020 Election
The 2024 Campaign
Threats to Democracy: Christian Nationalism and QAnon
QAnon Beliefs
State of Democracy in America
The State of the Economy in America
The State of Public Education in America
Specific Issues
Foreign Policy
To view a PDF of findings presented October 25, 2023, click here: 2023 American Values Survey. To view the webinar via YouTube, click here: What do Americans think about the health of our democracy and the upcoming presidential election?.
Introduction
In this divided era of American politics, the nation turns its eyes toward an unprecedented presidential election, with two of the oldest leading candidates in history — one of whom is facing federal and state indictments related to efforts to overturn the previous election. The 14th Annual American Values survey, conducted by PRRI in partnership with the Brookings Institution, examines Americans’ attitudes about the leading candidates for president, potential support for third-party candidates, and the issues that define these partisan and cultural fault lines. The survey illuminates Americans’ concerns about the overall direction of the country, the state of the economy and inflation, public education, social connectedness, and the broader health of our democracy. Additionally, the survey highlights attitudes about abortion, gender and LGBTQ issues, immigration, foreign policy, Christian nationalism, and support for QAnon, among other issues.
State of the Country
The Right or Wrong Direction?
More than three-fourths of Americans (77%) believe that the country is going in the wrong direction, compared with only 22% who believe the country is going in the right direction. The vast majority of Republicans (90%) and independents (81%) say the country is going in the wrong direction, compared with 59% of Democrats.
Most Americans, regardless of religious tradition, see the country as going in the wrong direction: 92% of white evangelical Protestants, 82% of white mainline/non-evangelical Protestants, 79% of white Catholics, 75% of religiously unaffiliated Americans, and two-thirds of Black Protestants (68%), non-Christian religious Americans (66%), and Hispanic Catholics (64%).
There are no significant differences with respect to views on the direction of the country by gender, race, generation, education, region, or whether respondents live in rural, suburban, and urban areas.
Change Since the 1950s
Fewer Americans believe that American culture and way of life has mostly changed for the better (44%) than changed for the worse (55%) since the 1950s. Republicans (73%) are more likely than independents (57%) and Democrats (34%) to believe it has mostly changed for the worse.
Nearly nine in ten Americans who most trust far-right news (89%), seven in ten Americans who most trust Fox news (71%), and nearly six in ten Americans who do not watch TV news (58%) believe American culture and way of life have mostly changed for the worse. Under half of Americans who most trust mainstream news (45%) believe the same.
Majorities of white Christians — including white evangelical Protestants (77%), white mainline/non-evangelical Protestants (60%), and white Catholics (57%) — believe American culture and way of life has mostly changed for the worse. Hispanic Catholics, Black Protestants, and non-Christian religious Americans are more divided. By contrast, religiously unaffiliated Americans are less likely to say American culture and way of life has changed for the worse (43%) than for the better (57%).
While younger Americans are not optimistic, they remain less likely than older Americans to believe that American culture and way of life have mostly changed for the worse: 49% of Generation Z and millennials, 58% of Generation X, 60% of baby boomers, and 67% of the Silent Generation.
The majority of white (58%) and Hispanic Americans (54%), and nearly half of Black Americans (47%), agree that America’s culture and way of life have mostly changed for the worse.
Americans without a college education are more likely than college-educated Americans to believe that America has changed for the worse, including 61% with some college and 60% with a high school education or less, compared with 46% of college graduates and 43% of postgraduates.
Americans in urban areas are divided on this question (50% better vs. 49% worse), compared with majorities of those who live in suburban (55%) and rural (67%) areas who believe that America’s culture and way of life have changed for the worse.
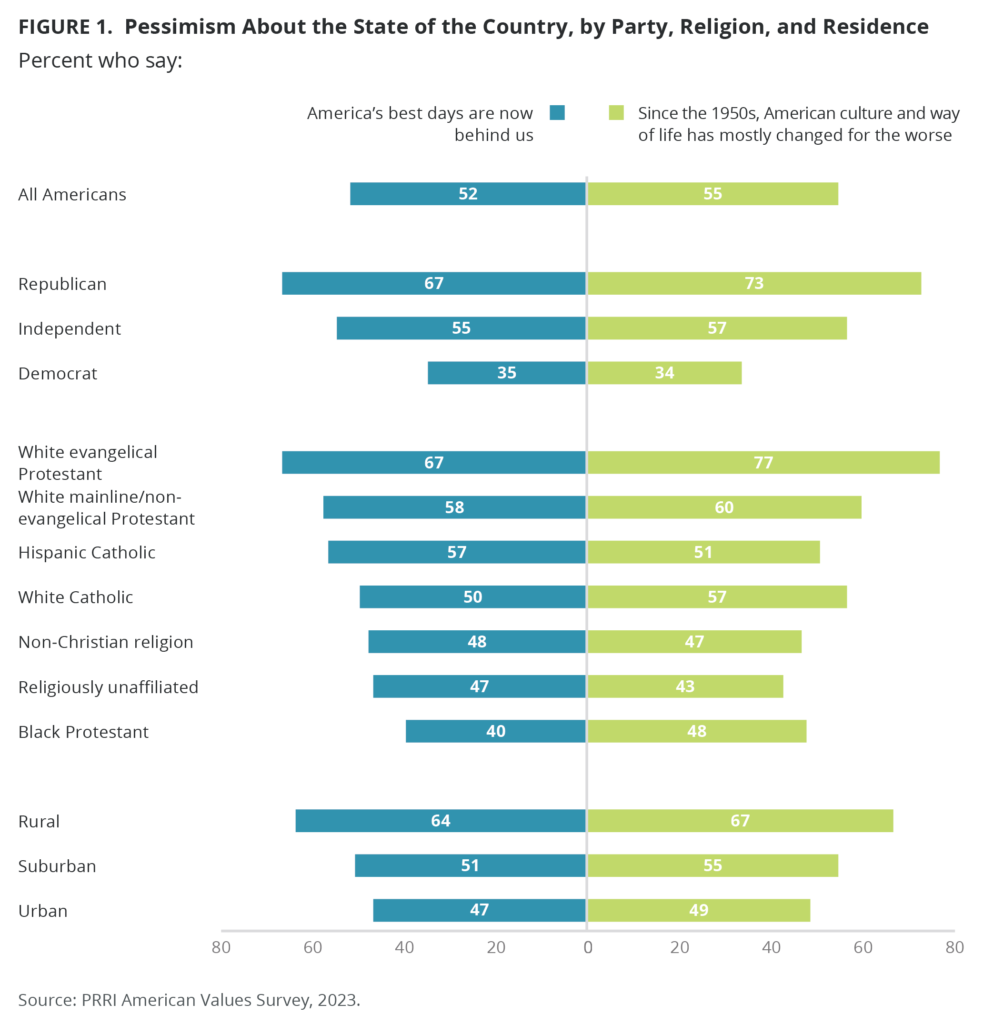
American’s Best Days are Behind Us
The country is more divided about the possibility of better days in the future. A slim majority of Americans (52%) agree that “America’s best days are now behind us,” while 43% disagree. Republicans (67%) and independents (55%) are much more likely than Democrats (35%) to believe that America’s best days are behind us. A majority of Democrats (61%) disagree.
More than seven in ten Americans who trust far-right news (71%) and about six in ten Fox News viewers (60%) and those who do not watch TV news (55%) believe the best days are behind us. Americans who trust mainstream news are divided (47% agree, 50% disagree).
White Americans (55%), Hispanic Americans (51%), and Asian Americans and Pacific Islanders (AAPI) (50%) similarly agree that America’s best days are behind us, compared with 39% of Black Americans. Further, majorities of all generations, except for Gen Z (48%), believe that America’s best days are behind us, including 54% of millennials and the Silent Generation, 53% of Gen X, and 51% of baby boomers.
The belief that America’s best days are behind us decreases with higher levels of education: 56% of Americans with a high school education or less, 57% of Americans with only some college education, 49% of college graduates, and just 36% of postgraduates believe that America’s best days are behind us.
Rural Americans (64%) are also more likely than Americans in suburban (51%) or urban areas (47%) to believe that America’s best days are now behind us.
Support for Authoritarianism as a Response to the Direction of the Country
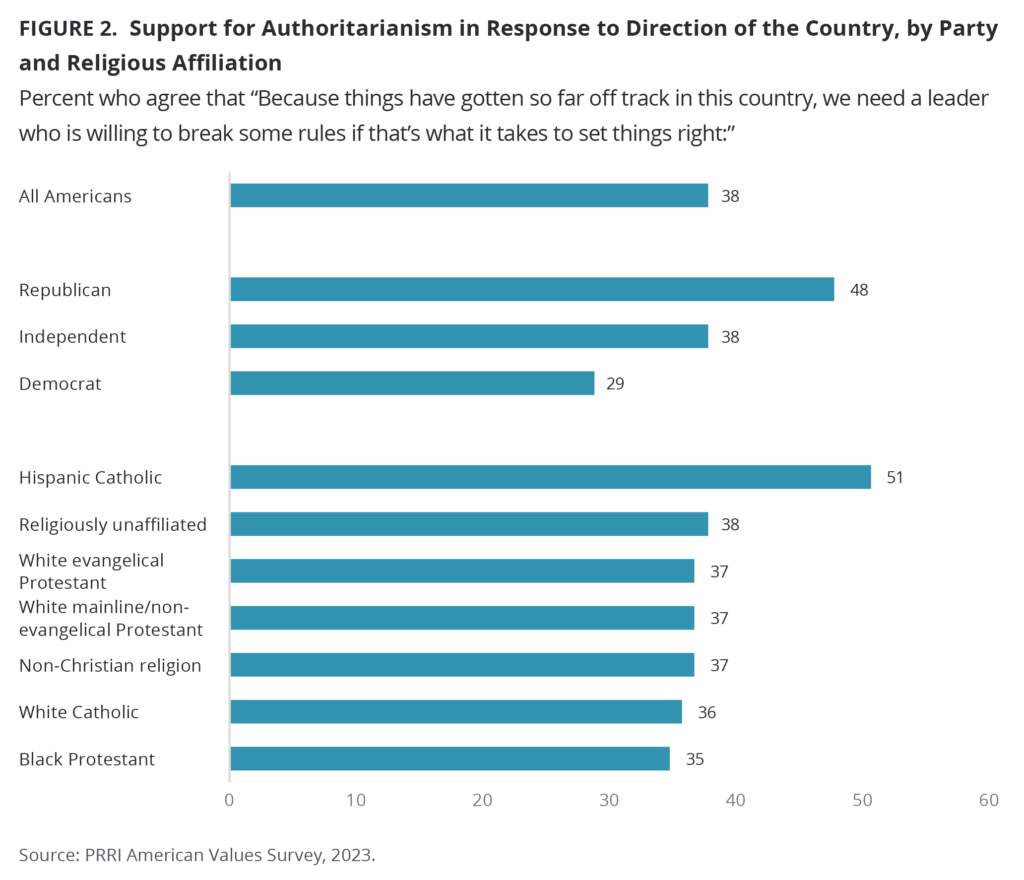
Just under four in ten Americans (38%) agree with the statement, “Because things have gotten so far off track in this country, we need a leader who is willing to break some rules if that’s what it takes to set things right,” while 59% disagree.
About half of Republicans (48%) agree with the need for a leader who is willing to break some rules, compared with four in ten independents (38%) and three in ten Democrats (29%). Majorities of Americans who most trust Fox News (53%) or far-right outlets (52%) agree that we need a leader who breaks the rules, compared with smaller shares of those who do not trust TV news (40%), or who most trust mainstream news (32%). Republicans with favorable views of former President Donald Trump are notably more likely than those with unfavorable views of Trump to agree with the need for a leader who is willing to break some rules (54% vs. 32%).
A slim majority of Hispanic Catholics (51%) agree with this statement, along with nearly four in ten religiously unaffiliated Americans (38%), white evangelical Protestants (37%), white mainline/non-evangelical Protestants (37%), non-Christians (37%), white Catholics (36%), and Black Protestants (35%). White Americans who attend religious services weekly or more (29%) are less likely than those who attend monthly or a few times a year (39%) or those who seldom or never attend services (37%) to agree with the need for a leader who is willing to break some rules.
Americans who believe that the country has changed for the worse since the 1950s are substantially more likely than those who say that it has changed for the better to agree with the need for a leader who is willing to break some rules (43% vs. 31%).
Support for Political Violence as a Response to the Direction of the Country
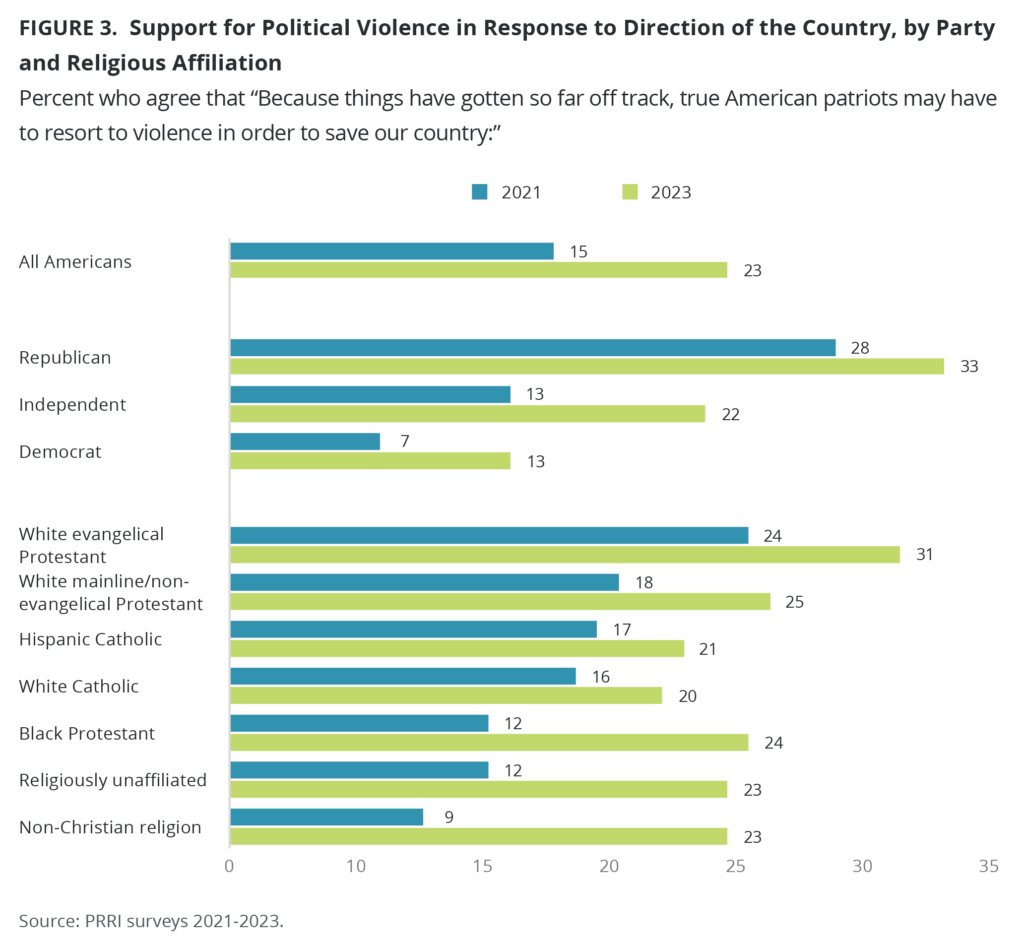
Disturbingly, support for political violence has increased over the last two years. Today, nearly a quarter of Americans (23%) agree that “because things have gotten so far off track, true American patriots may have to resort to violence in order to save our country,” up from 15% in 2021. PRRI has asked this question in eight separate surveys since March 2021. This is the first time support for political violence has peaked above 20%.
One-third of Republicans (33%) today believe that true American patriots may have to resort to violence to save the country, compared with 22% of independents and 13% of Democrats. Those percentages have increased since 2021, when 28% of Republicans and 7% of Democrats held this belief. Republicans who have favorable views of Trump (41%) are nearly three times as likely as Republicans who have unfavorable views of Trump (16%) to agree that true American patriots may have to resort to violence to save the country.
Americans who believe that the 2020 election was stolen from Donald Trump are more than three times as likely as those who do not believe that the election was stolen from Trump — 46% to 13%, respectively — to agree that true American patriots may have to resort to violence to save the country.
Over three in ten white evangelical Protestants (31%), along with 25% of white mainline/non-evangelical Protestants, 24% of Black Protestants, 23% of non-Christians, 23% of religiously unaffiliated Americans, 21% of Hispanic Catholics, and 20% of white Catholics agree that true American patriots may have to resort to violence to save the country. Among white Christians, there are no differences by church attendance on this question.
Americans who believe that the country has changed for the worse since the 1950s are more than twice as likely as those who say that it has changed for the better to agree that true American patriots may have to resort to violence to save the country (30% vs. 14%).
Critical Issues
Among 20 political issues, Americans are most likely to rate increasing costs of housing and everyday expenses (62%) as a critical issue. About half also say crime (50%), health care (49%), human trafficking (48%), the health of democracy (47%), what children are learning in public schools (47%), and access to guns and gun safety (46%) are critical issues. Around four in ten Americans consider education (43%), immigration (40%), mental health (40%), the growing gap between rich and poor (40%), and climate change (38%) critical issues as well. In addition, about one-third of Americans say abortion (36%), jobs and unemployment (34%), terrorism (32%), infrastructure like bridges and the electrical grid (30%), racial inequality (29%), and reforming the U.S. Supreme Court (29%) are critical issues. Americans are less likely to regard artificial intelligence (19%) and LGBTQ rights (14%) as critical.
Increasing costs of housing and everyday expenses is the only area that majorities of Democrats (63%), independents (61%), and Republicans (60%) each see as a critical issue. Majorities of Democrats also rate climate change (66%), access to guns and gun safety (66%), health care (59%), the health of democracy (58%), the growing gap between the rich and poor (57%), mental health (54%), and racial inequality (51%) as critical issues. By contrast, majorities of Republicans rate what children are learning in public schools (59%), crime (57%), immigration (57%), and human trafficking (54%) as critical issues.
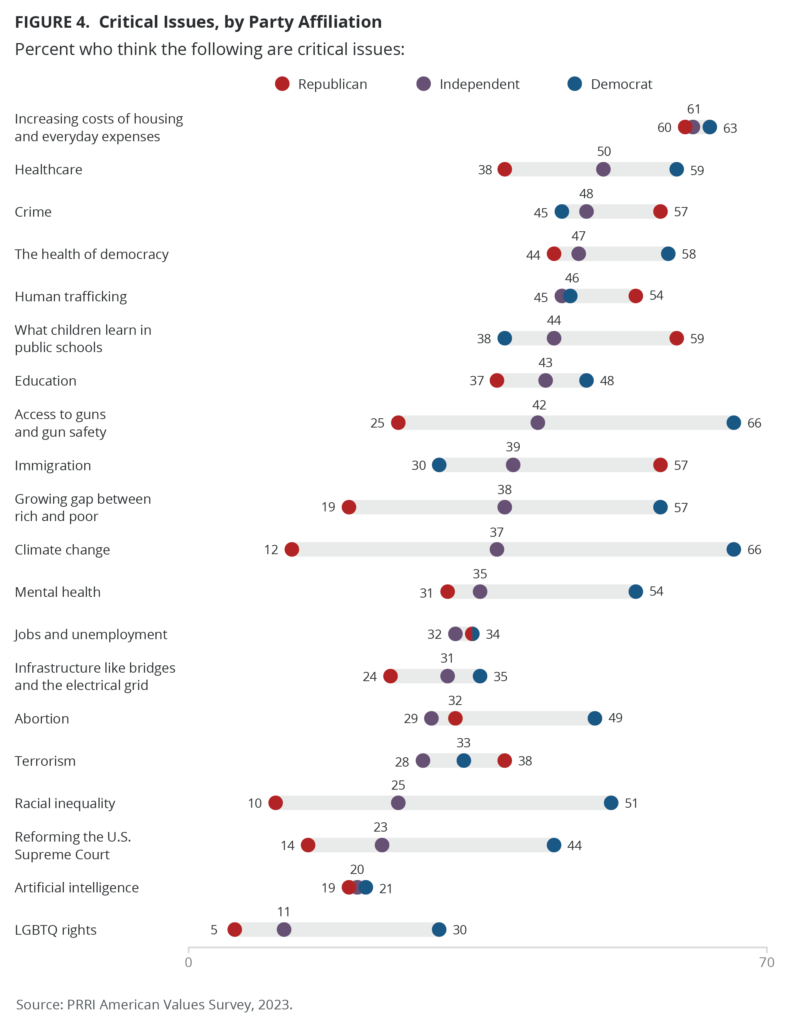
Across majorities of all racial groups, increasing costs of housing and everyday expenses is the issue most frequently rated as critical; however, there are racial differences on other top issues. Notably, while white Americans’ top critical issues closely mirror all Americans — the health of democracy (49%), what children are learning in public schools (46%), health care (45%), and crime (44%) — none reaches majority. By contrast, majorities of Hispanic and Black Americans align when rating human trafficking (65% and 59%, respectively), crime (63% and 58%, respectively), and health care (54% and 61%, respectively) as critical issues. Black Americans (62%) are more likely than Hispanic Americans (42%) to rate racial inequality as a critical issue, while Hispanic Americans (48%) are more likely than Black Americans (46%) to consider climate change a critical issue.
“Litmus Test” Issues That Drive Voting Choices
Abortion
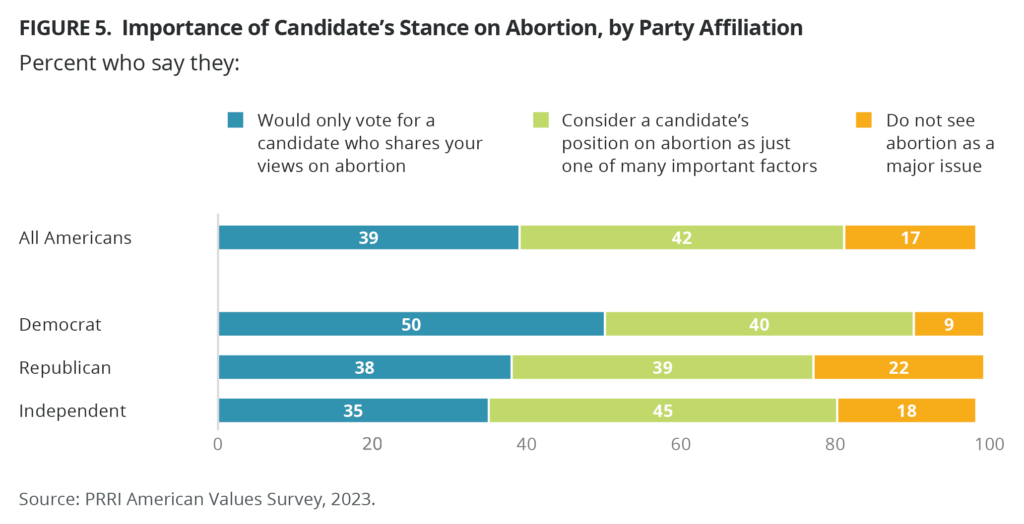
Approximately four in ten Americans (39%) say they will only vote for a candidate who shares their views on abortion. Slightly more Americans (42%) state that they will take a candidate’s position on abortion into consideration when voting. Fewer than two in ten Americans (17%) say they do not see abortion as a major issue.
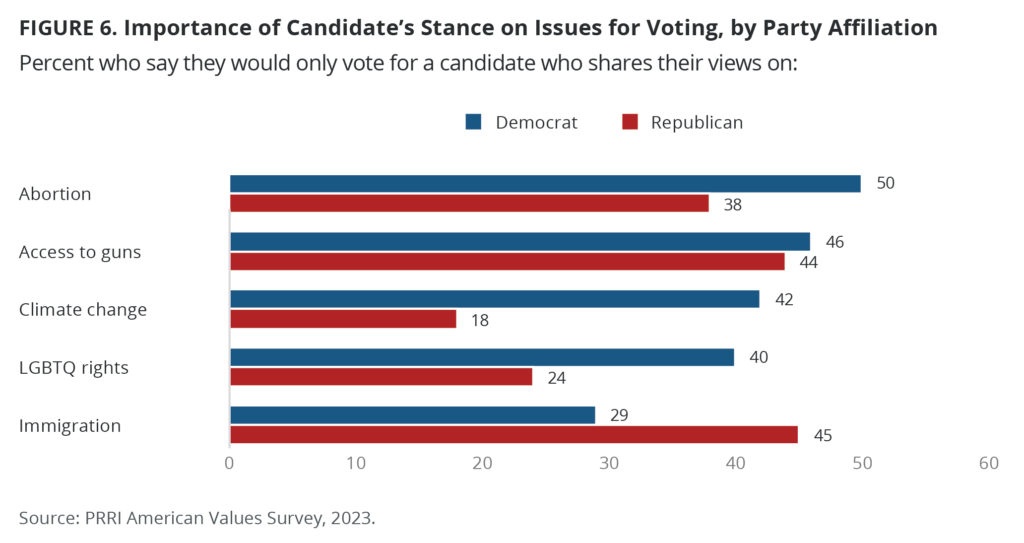
Reflecting the sea change in abortion politics, Democrats are now significantly more likely than Republicans to say their support for a candidate hinges on the candidate’s position on abortion. Half of Democrats (50%) say that they would only vote for a candidate who shares their views on abortion, compared with only 38% of Republicans and 35% of independents. Over four in ten independents (45%), 40% of Democrats, and 39% of Republicans say they will take a candidate’s position on abortion into consideration when voting. Around two in ten Republicans (22%) and independents (18%) do not see abortion as a major issue when voting for a candidate. Only 9% of Democrats say the same.
White evangelical Protestants stand out as the major religious group most opposed to the legality of abortion (75%). Nearly half (47%) say they would only vote for a candidate who shares their views on abortion. By contrast, religiously unaffiliated Americans, who are the least likely to oppose the legality of abortion (17%), also share the same view on voting (47%), along with 43% of non-Christians, 36% of Hispanic Catholics, 33% of Black Protestants, 33% of white Catholics, and 28% of white mainline/non-evangelical Protestants.
Access to Guns
Four in ten Americans (39%) say that they would only vote for a candidate who shares their views regarding access to guns. Almost half (48%) of Americans consider views about access to guns as just one of many important issues when deciding who to vote for. Just 11% of Americans do not see guns as a major issue. Democrats (46%) and Republicans (44%) are more likely than independents (35%) to say that a candidate must share their views on gun access.
Immigration
When asked how a candidate’s views on immigration might affect their vote, 32% of Americans stated they would only vote for someone who shared their views. Nearly six in ten Americans (56%) consider a candidate’s position on immigration as just one of many important factors and one in ten do not see immigration as an important issue (10%). Republicans (45%) are the most likely to say that they would only vote for a candidate who shares their views on immigration. In comparison, slightly fewer than three in ten Democrats (29%) and independents (27%) say the same.
LGBTQ Rights
Nearly three in ten Americans say they would only support a candidate who shares their views on LGBTQ rights (28%). Over one-third of Americans either only consider a candidate’s views on LGBTQ rights as one of many important factors (35%), or do not view this as a major issue (36%). Democrats (40%) are significantly more likely to only vote for a candidate who shares their views on LGBTQ rights, compared with 24% of Republicans and 23% of independents.
Climate Change
Just under three in ten Americans (27%) say that they would only vote for a candidate who shares their views on climate change. Forty-five percent of Americans say that they consider views on climate change as one of many important factors when determining a candidate to vote for. One-quarter of Americans (25%) do not view climate change as a major issue. Democrats (42%) are more than twice as likely as Republicans (18%) to say that they would only vote for a candidate who shares their views on climate change. One-quarter of independents (25%) say the same.
Views of The Biden Administration
Biden’s Job Performance
As President
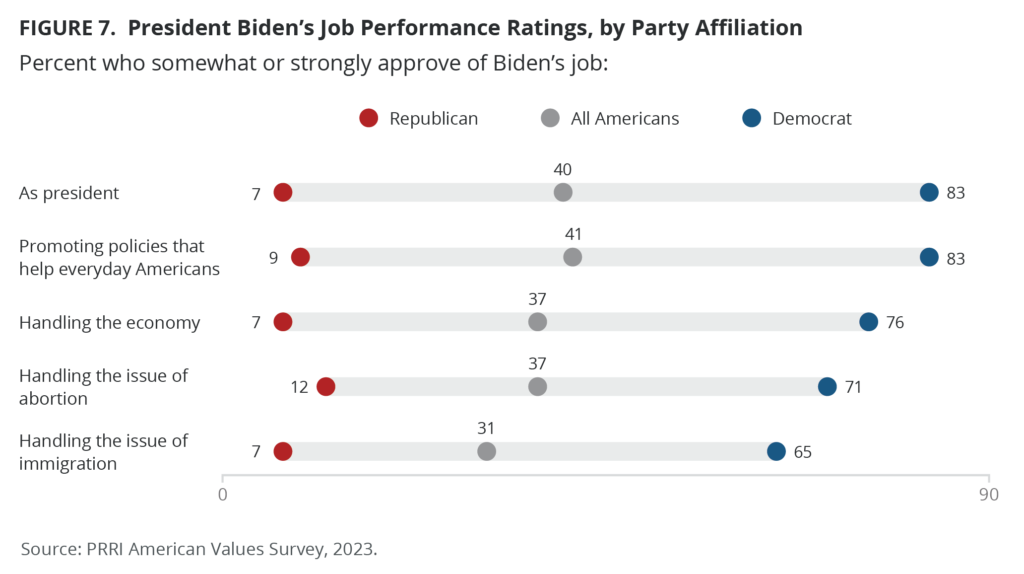
Four in ten Americans (40%) strongly or somewhat approve of the job that Joe Biden is doing as president, while a majority (57%) disapprove, including 39% who strongly disapprove. Results are unsurprisingly divided by party: 7% of Republicans, 35% of independents, and 83% of Democrats approve of the job Biden is doing as president. Notably, there is a distinct lack of intensity among Democrats: 32% say they strongly approve, while 51% say they somewhat approve.
Biden’s approval ratings are roughly comparable to where they were in September 2022 (43%); however, they have dropped significantly since September 2021 (52%). Compared with last year, Biden’s approval ratings have slipped among independents (down from 45%) but have remained similar among Republicans and Democrats (7% and 84% in September 2022, respectively).
White Christian groups are least likely to approve of the job that Biden is doing as president. Just 12% of white evangelical Protestants, along with 30% of white mainline/non-evangelical Protestants and 31% of white Catholics, approve of the job that Biden is doing. Half or more of non-Christian religious Americans (50%), religiously unaffiliated Americans (51%), Hispanic Catholics (54%), and Black Protestants (71%) approve of the job Biden is doing as president.
Black Americans (62%) are significantly more likely than white Americans (32%), Hispanic Americans (48%), or Americans of other races or ethnicities (50%) to approve of Biden’s job performance.
On the Issues
About four in ten Americans (41%) say that they approve of the job Biden is doing promoting policies that help everyday Americans, while 56% disapprove. More than eight in ten Democrats approve (83%), compared with 36% of independents, and 9% of Republicans.
Fewer than four in ten Americans (37%) approve of the job Biden is doing to handle the economy, while 61% disapprove. Three-quarters of Democrats (76%) approve of Biden’s handling of the economy, compared with 32% of independents and 7% of Republicans. These shares have remained steady compared to September 2022.
Slightly fewer than four in ten Americans (37%) approve of the job that Biden is doing handling the issue of abortion, while 59% disapprove. Seven in ten Democrats (71%), compared with about one-third of independents (34%) and around one in ten Republicans (12%), approve of Biden’s handling of abortion. These shares are roughly similar to September 2022.
Less than one-third of Americans (31%) approve of the job that Biden is doing to handle immigration, while 65% disapprove. Americans are less likely to approve of the job Biden is doing on immigration than they were in September 2022 (37%). Around two-thirds of Democrats (65%) approve of the job Biden is doing on immigration, a decrease from September 2022 (73%). Approval among independents has decreased from 36% a year ago to 27% now. Views among Republicans have remained steady, with just 7% saying they approve of the job Biden is doing on immigration.
Assessments of 2024 Candidates
Biden and Trump
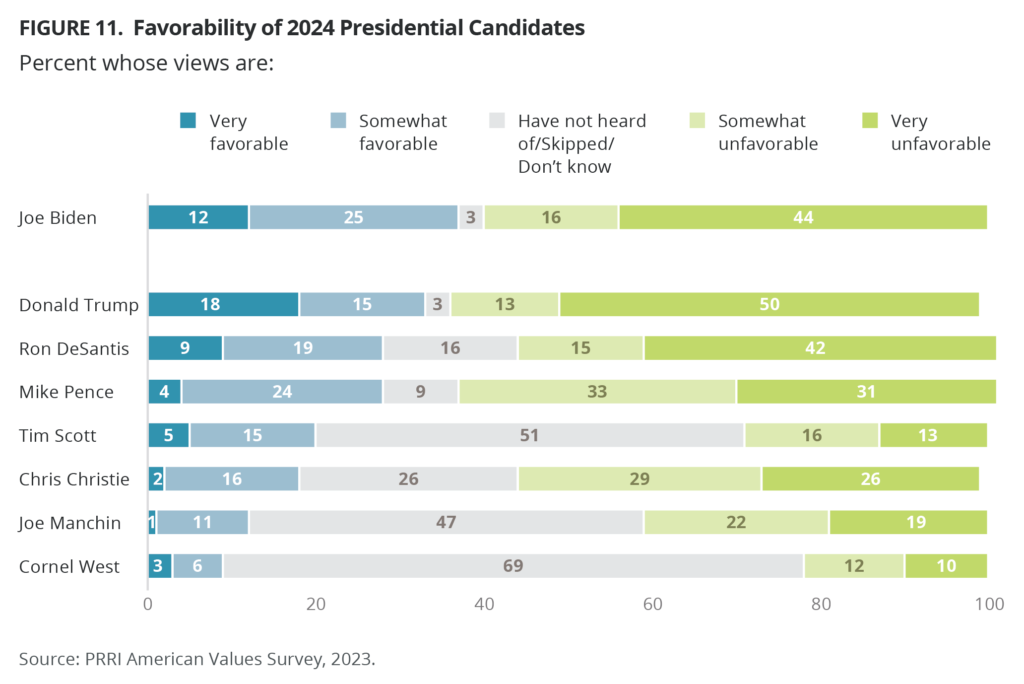
Americans generally express unfavorable views of each of the prominent 2024 presidential candidates included in the survey. While most Americans view Biden and Trump unfavorably, they are even less likely to hold favorable views of other candidates in the 2024 race.
Joe Biden
Fewer than four in ten Americans hold favorable views of Biden (37%) while six in ten Americans have unfavorable views of him (60%), marking his highest unfavorable ratings in the past four years. Compared with a similar point in the 2020 election cycle, Biden’s favorability ratings have dropped slightly (down from 42% in October 2019). Biden’s highest favorability ratings were in January 2021, just after his inauguration (55%).
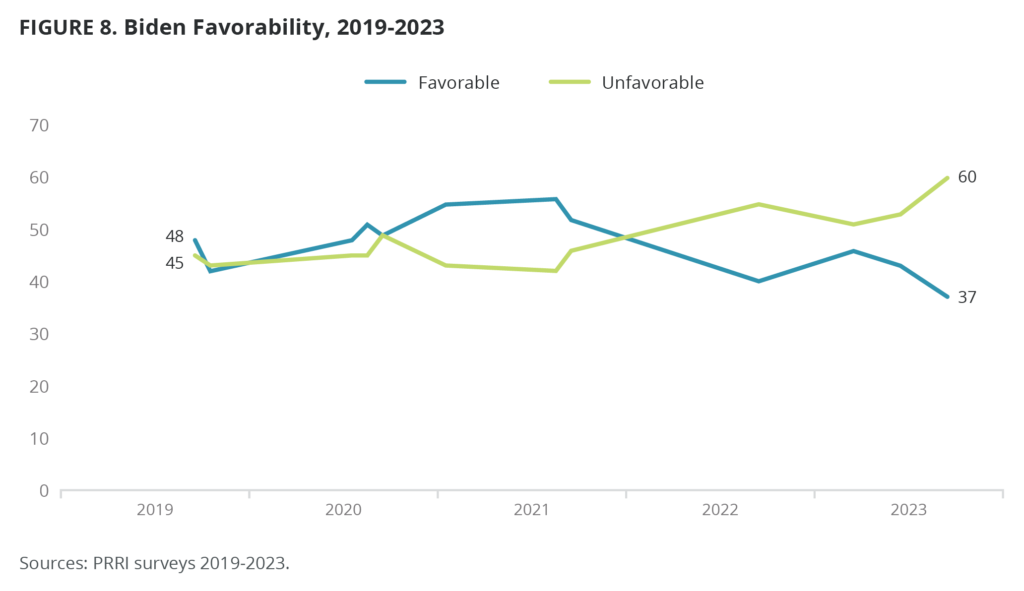
Eight in ten Democrats have favorable views of Biden (80%), including around one-third of Democrats who view him very favorably (32%). Three in ten independents (30%) and 6% of Republicans say they are favorable toward Biden.
Majorities of Hispanic Catholics (52%) and Black Protestants (64%) rate Biden favorably, compared with less than half of non-Christian religious Americans (46%) and religiously unaffiliated Americans (45%). White Christian groups are least likely to express favorable views of Biden, including 29% of white mainline/non-evangelical Protestants, 28% of white Catholics, and 11% of white evangelical Protestants.
Black Americans (55%) are most likely to express favorable views of Biden, compared with less than half of Hispanic Americans (47%), Americans of other races (45%), and less than three in ten white Americans (29%).
White Americans with a four-year college degree are much more likely than those with less formal education to hold favorable views of Biden. About one-quarter of white Americans with a four-year degree or less (23%), compared with nearly four in ten Americans with a four-year college degree (39%), say they hold favorable views of Biden.
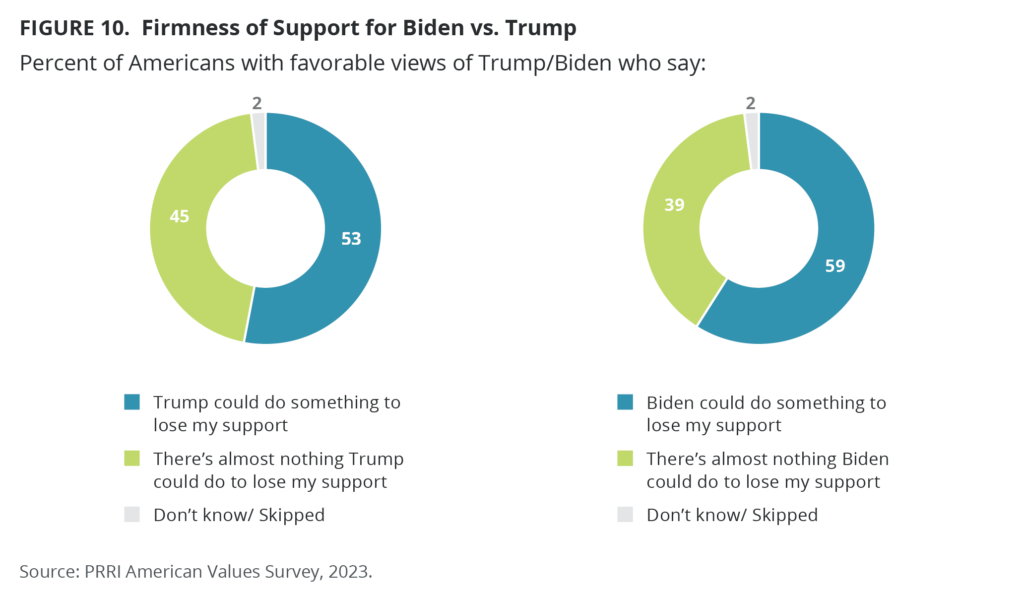
Could Biden Lose Support Among Those Who View Him Favorably?
Around six in ten Americans who hold favorable views of Biden say that there is something he could do to lose their support (59%), while 39% say there is nothing Biden could do to lose their support. A slim majority of Democrats with favorable views of Biden agree that he could do something to lose their support (52%), along with around seven in ten independents (69%).
Younger Americans with favorable views of Biden are much more likely than older generations to say that he could do something to lose their support, including 70% of members of Gen Z, and 72% of millennials, compared with 57% of members of Gen X, and 47% of baby boomers.
Donald Trump
One-third of Americans (33%) express favorable views of Trump, while 63% express unfavorable views, including half who say they have a very unfavorable view of him (50%). These ratings are generally similar to September 2022, when 35% of Americans rated him favorably. At the comparable point of the 2020 election cycle in September 2019, 35% of Americans had favorable views of Trump.
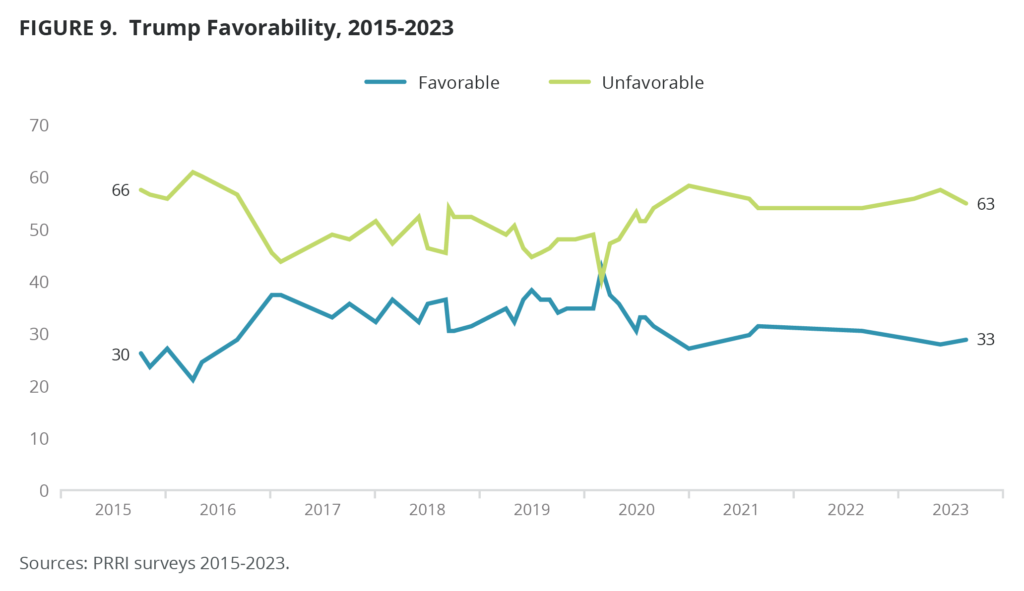
Around seven in ten Republicans hold a favorable view of Trump (69%), including around four in ten Republicans who say they hold very favorable views of Trump (44%). Roughly three in ten independents (31%) view Trump favorably, compared with just 6% of Democrats. Seven in ten Americans who most trust Fox News (70%) and nearly all Americans who most trust far-right news outlets (92%) hold favorable views of Trump, compared with 38% of those who do not watch TV news, and 15% of Americans who most trust mainstream news outlets.
White evangelical Protestants continue to be some of Trump’s most ardent supporters and remain the only major religious group in which a majority (61%) rate him favorably. Other white Christian groups are less likely to rate Trump favorably, including 44% of white mainline/non-evangelical Protestants, and 39% of white Catholics. Fewer Hispanic Catholics (34%), religiously unaffiliated Americans (22%), non-Christian religious Americans (20%), and Black Protestants (11%) rate Trump favorably. Trump wins higher favorability ratings among white Americans who attend religious services on a more frequent basis. Nearly half of white Americans who attend religious services weekly or more (47%) hold favorable views, along with 42% of those who attend monthly or a few times a year and 34% of those who seldom or never attend services.
Around four in ten white Americans (39%) rate Trump favorably, compared with smaller shares of Hispanic Americans (33%) and AAPI (22%).
Trump wins marginally higher favorability ratings among older generations: 38% of members of the Silent Generation, 34% of baby boomers, and 36% of members of Gen X hold favorable views of Trump, compared with 32% of millennials and 29% of members of Gen Z.
There is a distinct education gap with respect to views on Trump, especially among white Americans: 45% of white Americans who do not have a four-year degree hold favorable views of Trump, compared with 28% of white Americans with at least a four-year degree.
Republicans and Republican-leaning independents who agree with the need for a leader who is willing to break some rules are much more likely to support Trump in the Republican primary than those who disagree with that statement (55% vs. 36%).
Could Trump Lose Support Among Those Who View Him Favorably?
A slim majority of Americans who hold favorable views of Trump say that he could do something to lose their support (53%). A slightly smaller share (45%) says there is almost nothing Trump could do to lose their support. Among Republicans who view Trump favorably, a majority (54%) say there is nothing he could do to lose their support, compared with 36% of independents.
Just under half of Americans who most trust Fox News and have favorable views of Trump say that he could lose their support, along with just one-third of those who most trust far-right media outlets (34%). In comparison, around six in ten Americans who hold favorable views of Trump and most trust mainstream news (57%) or do not watch TV news (61%) say that Trump could do something to lose their support.
Among those who hold a favorable view of Trump, those with less than a college degree are more likely than those with at least a four-year college degree to say there is nothing he could do to lose their support (49% vs. 62%).
The Rest of the Field
Ron DeSantis
Fewer than three in ten Americans (28%) hold favorable views of Republican presidential candidate and Florida Gov. Ron DeSantis, while 57% hold unfavorable views of him, and 14% have not heard of him. The share of Americans who view DeSantis favorably has remained relatively steady compared with polling in June (27%), March (30%), and September 2022 (26%). Six in ten Republicans (61%) hold favorable views of DeSantis, compared with 30% of independents, and just 3% of Democrats.
Chris Christie
Less than one in five Americans (18%) have favorable views of former New Jersey Gov. Chris Christie, while a solid majority (55%) have unfavorable views of him, and roughly one-quarter have not heard of him (23%). Interestingly, there are no partisan differences in views of Christie: 20% of Republicans, 20% of independents, and 20% of Democrats all view him favorably.
Tim Scott
One in five Americans (20%) view South Carolina Sen. Tim Scott favorably, while 29% view him unfavorably and 48% have not heard of him. Compared to June 2023, Americans have not changed their views on Scott: 22% viewed him favorably, 25% viewed him unfavorably, and a slim majority (51%) had not heard of him. Around one-third of Republicans (34%) view Scott favorably, compared with 22% of independents and 8% of Democrats.
Mike Pence
Aside from Biden and Trump, Americans are most likely to be familiar with former Vice President Mike Pence (just 6% have not heard of him), but fewer than three in ten rate him favorably (28%). Nearly two-thirds rate him unfavorably (64%). Republicans are divided in their views of Pence: 45% rate him favorably, while 49% rate him unfavorably. Around one-quarter of independents rate him favorably (26%), along with 18% of Democrats.
Cornel West
Americans are broadly unfamiliar with Green Party candidate Cornel West: two-thirds have not heard of him (67%). One in ten Americans (9%) rate him favorably, while 22% rate him unfavorably. Fewer than one in ten independents (7%) rate him favorably, along with 6% of Republicans and 14% of Democrats.
Joe Manchin
Just under half of Americans (45%) have not heard of West Virginia Sen. and potential third-party candidate Joe Manchin. Twelve percent view him favorably, and 41% view him unfavorably. Manchin is unpopular in his own Democratic Party (just 7% view him favorably). Independents (13%) and Republicans (18%) are more likely to view him favorably.
Aftermath of the 2020 Election
The Big Lie
Roughly one-third of Americans (32%) agree that the 2020 election was stolen from Trump. This share has remained relatively stable since March 2021 when 29% of Americans agreed.
More than six in ten Republicans (63%) continue to say that the 2020 election was stolen from Trump, compared with 31% of independents and 6% of Democrats. Two-thirds of Americans who most trust Fox News (65%) and nearly all Americans who most trust far-right news outlets (92%) believe that the 2020 election was stolen from Trump. In comparison, only 38% of Americans who do not watch TV news and 14% of Americans who most trust mainstream news outlets believe this false narrative.
As some of his staunchest supporters, white Christians are most likely to say that the 2020 election was stolen from Trump. Six in ten white evangelical Protestants (60%) say the election was stolen, along with 38% of white mainline/non-evangelical Protestants and 38% of white Catholics. Less than one-quarter of Hispanic Catholics (24%), religiously unaffiliated Americans (23%), non-Christian religious Americans (22%), and Black Protestants (11%) agree.
Among white Americans, those without a four-year degree (44%) are significantly more likely than those who have a four-year degree (27%) to say the election was stolen from Trump.
Did Trump Commit Crimes?
Did Trump Break the Law to Stay in Power?
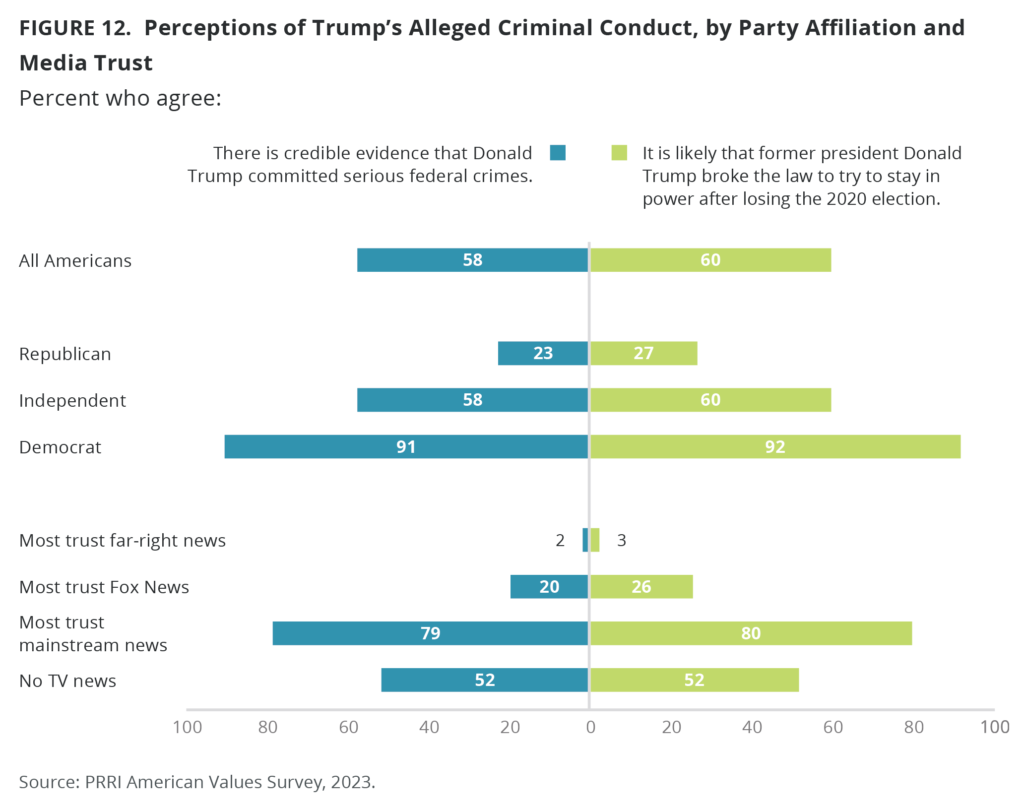
Six in ten Americans (60%) agree with the statement that it is likely that former president Donald Trump broke the law to try to stay in power after losing the 2020 election, while 38% disagree.
About one-quarter of Republicans (27%), compared with 60% of independents and 92% of Democrats, believe Trump broke the law to try to stay in power. Americans who most trust Fox News (26%) or far-right news outlets (3%) are least likely to believe Trump broke the law to stay in power after losing the election, compared with a slim majority of Americans who do not watch TV news (52%) and eight in ten Americans (80%) who most trust mainstream news.
Is There Credible Evidence of Federal Crimes?
A solid majority of Americans (58%) agree that there is credible evidence that Donald Trump committed serious federal crimes, while 37% disagree.
Roughly one-quarter of Republicans believe Trump committed serious federal crimes, compared with a broad majority of independents (58%) and nine in ten Democrats (91%). Belief that Trump committed crimes is lowest among Americans who most trust Fox News (20%) and those who most trust far-right news outlets (2%), compared with majorities of those who do not watch TV news (52%) or most trust mainstream outlets (79%).
Few Trump supporters believe that there is credible evidence that Trump committed serious federal crimes. Only 28% of white evangelical Protestants believe that there is credible evidence that Trump committed serious federal crimes. Only 14% of Americans who hold favorable views of Trump say that there is evidence that he committed crimes. Even among those who hold favorable views of Trump but say there is something he could do to lose their support, only 22% believe he committed serious federal crimes.
The 2024 Campaign
What Are Americans Looking for in a Presidential Candidate?
Economy Versus Culture
Americans are roughly divided about whether they prefer a presidential candidate who can best manage the economy (51%) versus a presidential candidate who can best protect and preserve American culture and the American way of life (46%).
Most Republicans prefer a candidate who can preserve American culture (58%) over one who can manage the economy (40%), while most Democrats and independents prefer a candidate who can manage the economy (57% and 53% respectively). Americans who most trust Fox News (63%) or far-right news networks (73%) are much more likely to say they want a presidential candidate who will preserve American culture than those who do not watch TV news (40%) or those who most trust mainstream news outlets (45%).
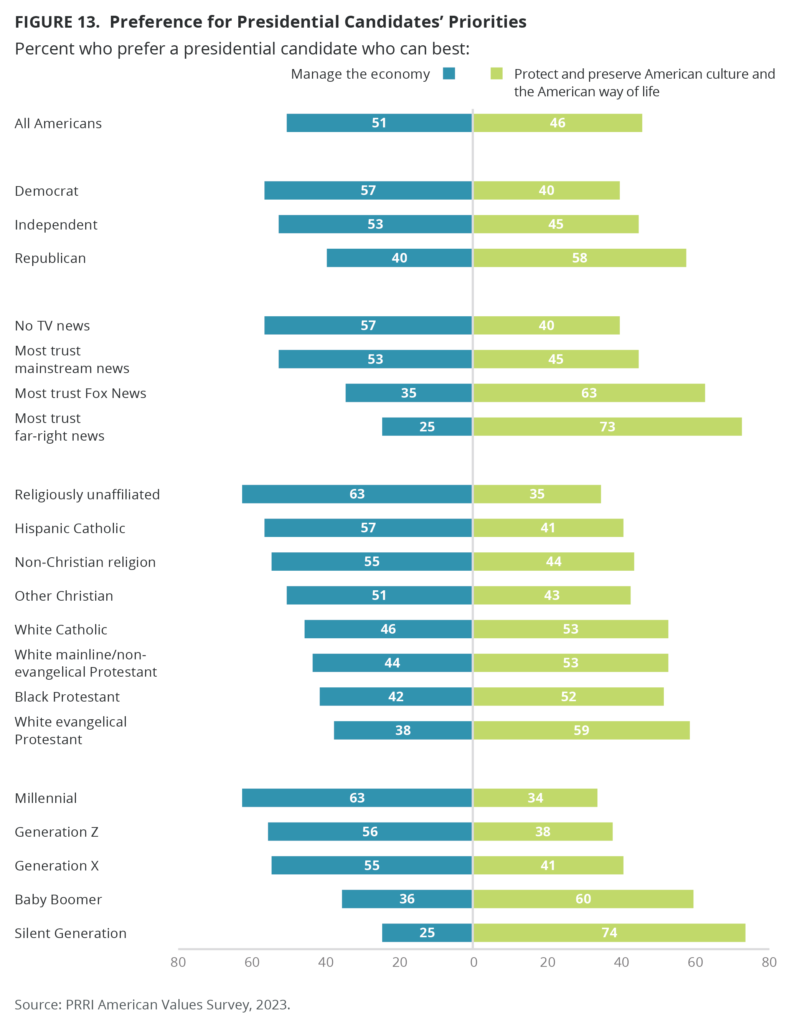
Majorities of white Christian groups say they would prefer a candidate who would preserve American culture, including 59% of white evangelical Protestants, 53% of white mainline/non-evangelical Protestants, and 53% of white Catholics. A slim majority of Black Protestants (52%) also say they would prefer a president who can protect American culture. By contrast, majorities of religiously unaffiliated Americans (63%), Hispanic Catholics (57%), non-Christian religious Americans (55%), and other Christian groups (51%) say they prefer a president who can best manage the economy.
There are deep generational divides on the preference for presidential candidates. Majorities of Gen Z (56%), millennials (63%), and Gen X (55%) say they prefer a president who can best manage the economy. Majorities of baby boomers (60%) and members of the Silent Generation (74%) prefer a president who can preserve and protect American culture.
Views of Political Parties
The Republican Party
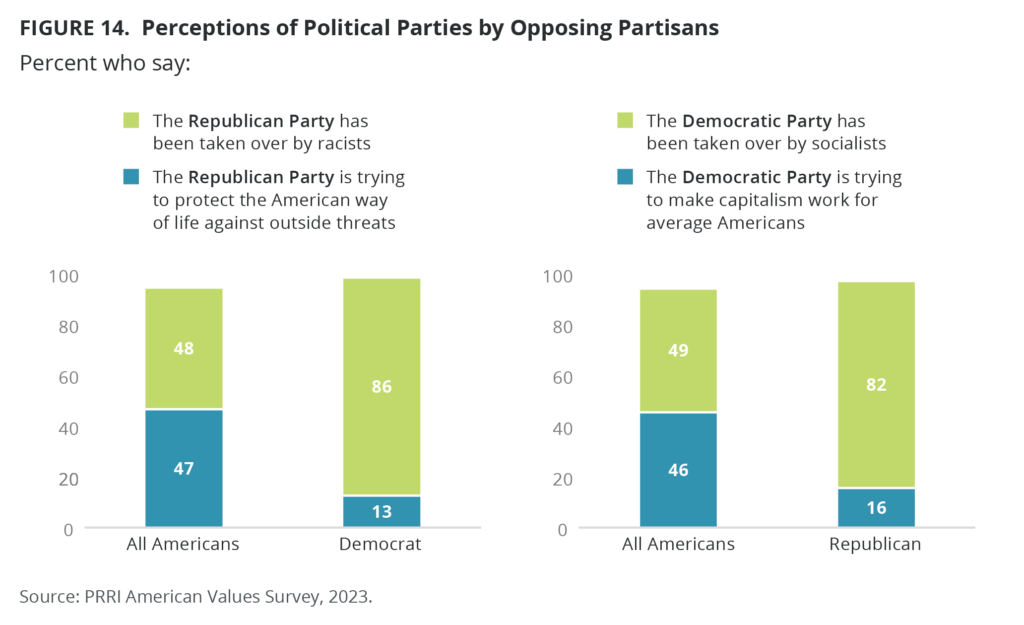
Nearly half of Americans (47%) say the Republican Party is trying to protect the American way of life against outside threats. A similar percentage of Americans (48%) say the party has been taken over by racists. Such views about the Republican Party have remained unchanged in the last few years.
A strong majority of Republicans (87%) say the party wants to protect the American way of life, compared with 47% of independents and only 13% of Democrats. Democrats overwhelmingly view the Republican Party as being controlled by racists (86%), a view shared by 48% of independents and only 11% of Republicans.
The Democratic Party
Nearly half Americans (46%) say the Democratic Party is trying to make capitalism work for average Americans, down from 51% of Americans in 2021. This year, 49% believe the party has been taken over by socialists. In 2021, 44% of Americans believed that the party was taken over by socialists.
More than eight in ten Democrats (85%) believe that their party is trying to make capitalism work for everyone, while eight in ten Republicans (82%) say the Democratic Party has been taken over by socialists. Independents are more divided: 41% say the Democratic Party is attempting to make capitalism work and 54% say the party is run by socialists.
Trump and Biden as Their Parties’ Nominees
Biden as the Democratic Nominee
Around two-thirds of Democrats and independents who lean toward the Democratic party say they would prefer someone else to be the party’s nominee (64%), while 34% say they would prefer Biden to be the nominee. Democrats (39%) are somewhat more likely than Democratic-leaning independents (23%) to say they prefer Biden to be the nominee. These shares are roughly similar to September 2022, when 40% of Democrats and 20% of Democratic-leaning independents said they would prefer Biden to be the nominee.
Even among Democrats and leaners who approve of Biden’s job performance, 41% say he should be the nominee. That share drops to 6% among those who disapprove of Biden’s job as president. Similarly, even among Democrats and leaners who say they voted for Biden in 2020, just 38% say that they would prefer him to be the nominee.
Democrats and leaners who say they prefer a president who can handle the economy are much less likely than those who want a president who will protect American culture to say that they would prefer Biden to be the Democratic nominee (28% vs. 43%).
Democrats and Democratic-leaning independents who said they would prefer someone other than Biden were asked to provide a brief open-ended response for why they preferred someone else. Among this group, nearly 70% of open-ended responses (or 150 out of the 219 responses) mentioned Biden’s age or the desire for younger leadership. Roughly 5% of open-ended responses mentioned Biden’s mental capacity. The remaining respondents mentioned a mix of job disapproval, policy disagreements, the feeling that Biden was not equipped to challenge Trump, or other issues or disagreements.
Among all Americans, more than three-quarters agree with the statement that Joe Biden is too old to be president (78%), including half who completely agree (50%). Majorities of nearly every demographic group agree with the statement that Biden is too old to be president. Even two-thirds of Democrats (67%) agree that Biden is too old, compared with 81% of independents and 89% of Republicans.
Trump as the Republican Nominee
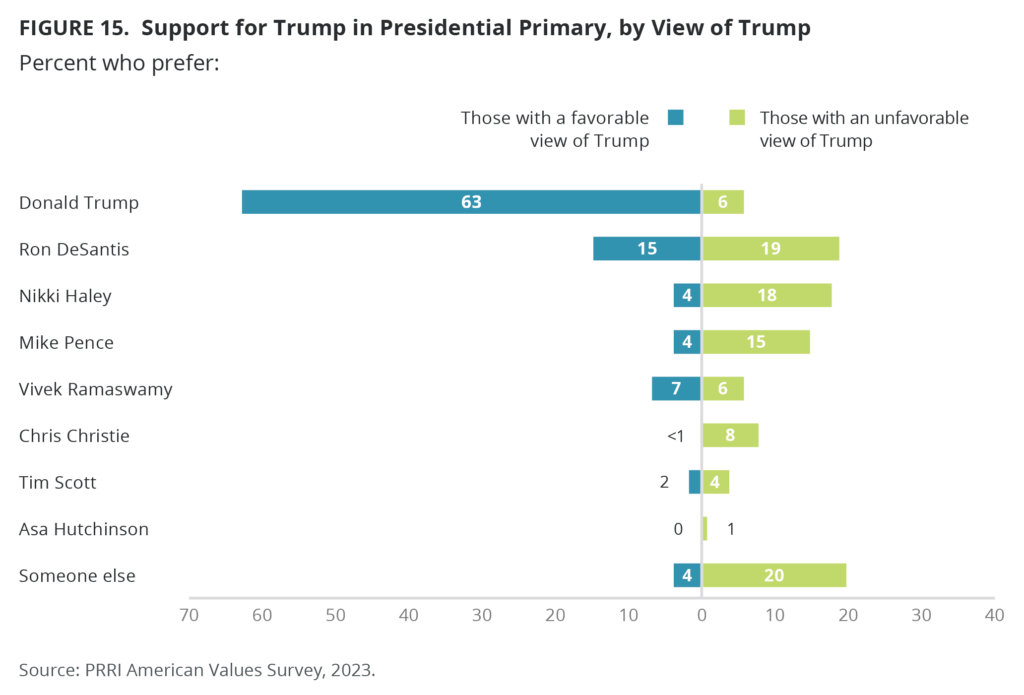
When presented with a list of Republican presidential candidates, 44% of Republicans and Republican-leaning independents say that they would prefer Donald Trump to be the nominee. Sixteen percent say that they prefer Ron DeSantis, 8% prefer Nikki Haley, 7% prefer Mike Pence, 7% prefer Vivek Ramaswamy, 3% prefer Chris Christie, 3% prefer Tim Scott, less than 1% prefer Asa Hutchinson, and 10% prefer someone else. Republicans (47%) are slightly more likely than Republican-leaning independents 39% to say that they prefer Trump.
Among Republicans and Republican-leaning independents, those who attend religious services weekly or more are less likely to prefer Trump (39%), compared with those who attend monthly or a few times a year (45%) or seldom or never attend services (47%). Republicans and leaners who attend once a week or more are more likely to prefer DeSantis (21%) than those who attend at least a few times a year (13%) or seldom or never attend (13%).
Among Republicans and leaners who hold favorable views of Trump, 63% say they would prefer him to be the nominee. That share dips to just 6% of those who have unfavorable views of Trump; however, there is no clear frontrunner among Republicans and leaners with unfavorable views of Trump. Among those who hold unfavorable views of Trump, 19% prefer DeSantis, 18% prefer Haley, 15% prefer Pence, 8% prefer Christie, 6% prefer Ramaswamy, 4% prefer Scott, 1% prefer Hutchinson, and 20% prefer someone else.
Most Republicans and leaners who supported Trump in 2020 (54%) say they would prefer Trump to be the nominee. Just two in ten members of this group support DeSantis (19%). Half of Republicans and leaners who prefer a candidate who can protect American culture prefer Trump (49%) over DeSantis (15%) or any other candidates to be the nominee. Those who want a candidate who can manage the economy also prefer Trump (38%) over DeSantis (18%) or any of the other Republican candidates.
Republicans and leaners who said they would prefer someone other than Trump to be the nominee were asked to provide a brief open-ended response for why they preferred someone else. Open-ended responses are varied: 16% said they felt that Trump was too much of a divisive or polarizing figure, 10% said they worried about Trump’s electability in a general election, 10% indicated that they simply preferred another candidate and 6% said that Trump’s policies as president were not effective. Other open-ended response themes combined to make up no more than 3% of responses: Trump’s age (5% of responses), his communication style (4%), his legal problems (5%), his personality (5%), a general desire for fresh leadership (5%), and concerns about general “baggage” that Trump’s candidacy would entail (3%). The remaining respondents offered unique or vague reasons.
Among all Americans, half (50%) agree with the statement that Trump is too old to be president, while 47% disagree. Roughly one-quarter of Republicans (27%) agree that Trump is too old, compared with 52% of independents and 71% of Democrats.
Voting in 2024
Six in ten Americans (61%) say that they are absolutely certain to vote in the 2024 presidential election, while around one in ten say they probably will vote (11%), or the chances are 50-50 (9%). Five percent of Americans say there is a less than 50-50 chance they will vote, and 13% of Americans say they are definitely not voting.
Republicans and Democrats are similarly likely to say they are certain to vote (76% and 73%, respectively), while a slim majority of independents (54%) say they are certain to vote.
More than seven in ten white Christians say they are certain to vote, including 78% of white evangelical Protestants, 77% of white Catholics, and 70% of white mainline/non-evangelical protestants. Six in ten Black Protestants (61%) and majorities of religiously unaffiliated Americans (56%) and non-Christian religious Americans (53%) say they are certain to vote. Hispanic Catholics (42%) are the only major religious group where fewer than half say they are certain to vote.
Certainty to vote in the 2024 presidential election decreases with age. Less than half of members of Gen Z (43%) or millennials (49%), compared with 64% of members of Gen X, 77% of baby boomers, and 87% of members of the silent generation, say they are certain to vote.
Seven in ten white Americans (71%), compared with around half of Black Americans (53%) and AAPI (49%), say they are certain to vote. Just four in ten (40%) Hispanic Americans say they are certain to vote. White Americans without a four-year college degree (63%) are significantly less likely than white Americans with a four-year degree (83%) to say they are certain to vote.
The 2024 Horse Race
In a two-way race, registered voters are evenly divided over whether they would vote for Biden (48%) and Trump (46%), while 6% of Americans do not choose either candidate. Voters’ choices are largely consistent with their self-reported 2020 vote: 94% of Americans who say they voted for Trump plan to support him in 2024, and 94% of 2020 Biden voters say they will support him in 2024. Just 4% of 2020 Trump voters say they will support Biden in 2024, the same share as 2020 Biden voters who say they will support Trump in 2024 (4%).
In the two-way presidential vote, 91% of Democrats prefer Biden, 88% of Republicans prefer Trump, and independents are divided evenly between Biden (46%) and Trump (46%).
Majorities of white Christian voters support Trump in the 2024 election, including three-quarters of white evangelical Protestants (76%), and nearly six in ten white Catholics (59%) and white mainline/non-evangelical protestants (57%). In contrast, majorities of Black Protestant voters (79%), religiously unaffiliated voters (67%), and non-Christian religious voters (63%) prefer Biden.
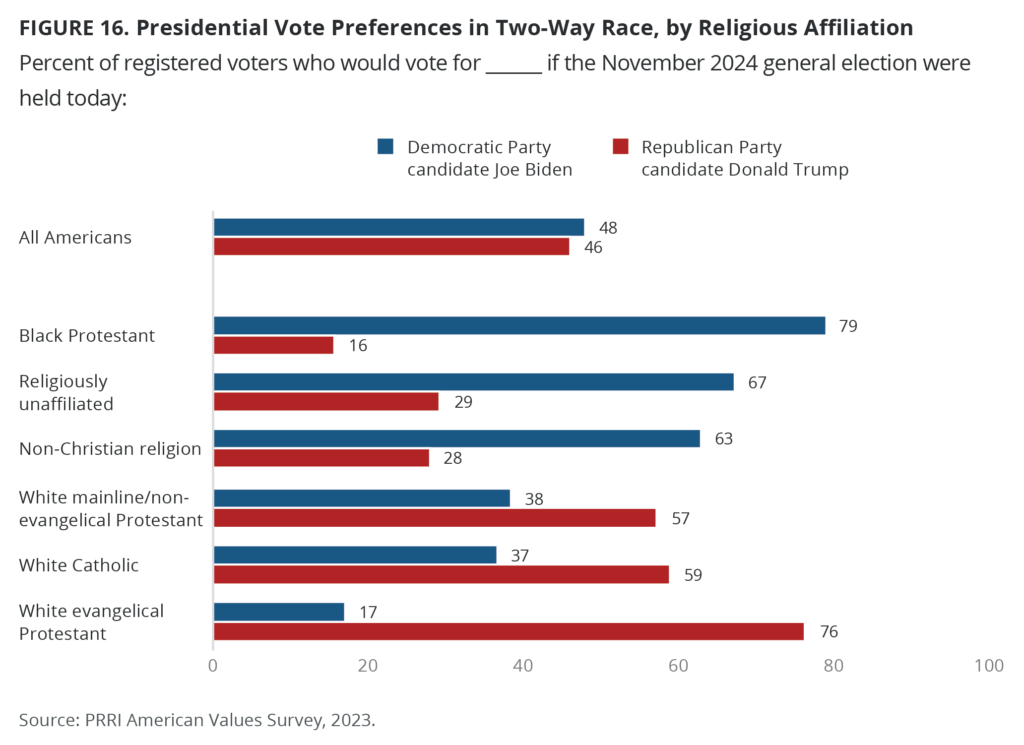
Among white voters, support for Trump increases dramatically with frequency of religious attendance. Among those who seldom or never attend services, 47% prefer Trump, compared with 57% of those who attend monthly or a few times a year, and 65% of those who attend weekly or more.
A majority of white voters (54%) prefer Trump over Biden, while Biden wins majorities of support among Hispanic voters (51%) and Black voters (77%). Six in ten white voters without a four-year college degree prefer Trump (62%), compared with 43% of white voters with at least a four-year college degree who prefer Trump.
Voters in urban areas are almost twice as likely as rural voters to prefer Biden (57% vs. 31%). Suburban voters divide evenly, with 48% preferring Biden and 46% preferring Trump.
In the six key 2024 presidential swing states (Arizona, Georgia, Michigan, Nevada, Pennsylvania, and Wisconsin), Trump wins 49% while Biden wins 43% — a difference that is within the margin of error.
The Effect of Third-Party Candidates
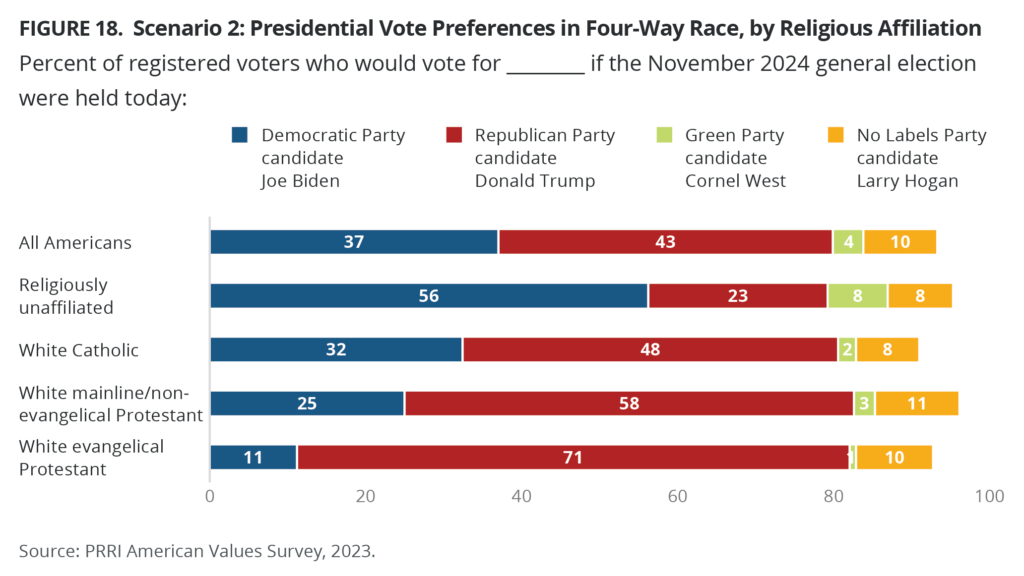
In addition to asking registered voters about a two-way matchup between Biden and Trump, this survey also asked respondents — except those who say they are definitely not voting in 2024 — about their intended vote choice with four candidates in the race. Half of respondents were asked if they would vote for Biden, Trump, Green Party candidate Cornel West or potential No Labels candidate Joe Manchin; the other half were asked if they would vote for Biden, Trump, West, or potential No Labels candidate Larry Hogan.
Including named third-party candidates in the horse race vote shifts the dynamics of the matchup between Trump and Biden somewhat. In the matchup that includes West and Manchin, Biden garners 41% to Trump’s 38%, but these differences are not statistically significant. Five percent prefer West, 10% prefer Manchin, and 6% do not choose a candidate. In the matchup including West and Hogan, Biden garners 37% to Trump’s 43%, but these differences are not statistically significant. In this matchup, 4% prefer West, 10% prefer Hogan, and 7% do not choose a candidate.[1]
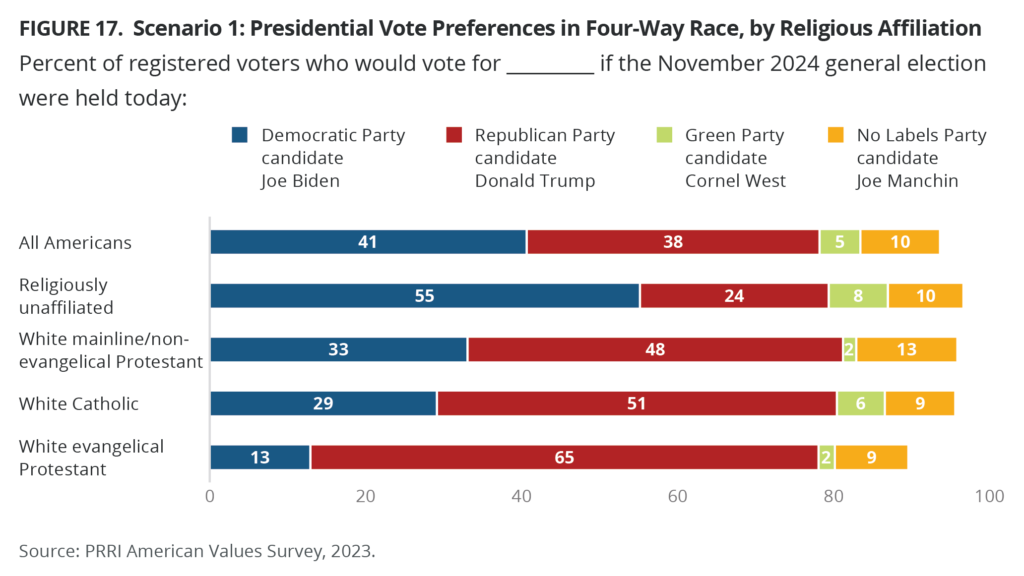
In the four-way race that includes West and Manchin, Biden’s support dips from 48% in the two-way vote to a slightly smaller 41% share in the four-way vote. Trump’s support dips at a similar rate, from 46% in the two-way vote to 38% in the four-way vote.
Biden’s support drops the most in the four-way race against Manchin and West among groups that are typically his base. Among Black voters, support for Biden drops from 77% in the two-way race to 61% in the four-way race that includes West and Manchin. Furthermore, Biden’s support among Democrat voters drops from 91% in the two-way vote to 84% in the four-way race that includes West and Manchin. Among Black voters, 11% support West in the four-way race that includes Manchin and 7% in the four-way race that includes Hogan.
Trump’s support among his base weakens slightly with the inclusion of Manchin and West. Among Republicans, support for Trump in the two-way race drops from 88% to 79% when Manchin and West are included. Trump also sees a decline in support from white evangelical Protestant voters from 76% in the two-way vote to 65% in the four-way vote against Manchin and West.
In the four-way race that includes Hogan and West, Biden’s support drops from 48% in the two-way race to 37% in the four-way race while Trump’s support decreases from 46% to 43% in the four-way vote with Hogan and West.
Between the two-way race and the four-way race with West and Hogan, support for Biden drops from 91% to 85% among Democrat voters. Biden also sees significant decreases between the two- and four-way race questions in support among Black voters (from 77% to 64%) and Hispanic voters (from 51% to 39%). [2]
Trump’s decline in support between the two-way race and the four-way race with West and Hogan is more modest among key base groups. Notably, Republican voters are only marginally less likely to support him (88% vs. 84%), as are white evangelical voters (76% vs. 71%).
Views of Third Parties
Four in ten Americans (42%) say they are very or somewhat likely to consider voting for a presidential candidate from a new political party that is an alternative to the Democratic or Republican parties. A majority of those likely to consider voting for a new political party (74%) say they would vote for a candidate from a party that is in the middle between Democrats and Republicans. Eleven percent say they would vote for a candidate from a party that is more liberal than the Democratic Party and 13% say they would vote for a candidate from a party that is more conservative than the Republican Party.
Democrats (33%) and Republicans (35%) are similarly likely to say they would vote for a third-party candidate, compared with a majority of independents (55%). A quarter of Democrats (24%) who would consider a third party want a party that is more liberal than the Democrats. Similarly, 23% of Republicans who would consider a third party want a party that is more conservative than the Republicans. Broad majorities of Americans who would consider a third party across the partisan spectrum say they would rather have a new party that is in the middle, including 67% of Democrats, 71% of Republicans, and 81% of independents.
A majority of Americans (56%) say they are unlikely to vote for a candidate from a new political party. Almost half of those (49%) who are unlikely to vote for a candidate from a new party say they would not do so because those candidates rarely win. One in five Americans (20%) say they would not vote for a candidate from a new political party because even if they are elected, they would not be able to get anything done, and 28% say they would not vote for a candidate from a new political party because they are happy with the party they typically vote for.
Threats to Democracy: Christian Nationalism and QAnon
God Intended America to Be a New Promised Land for European Christians
One-third of Americans (33%) agree that “God intended America to be a new promised land where European Christians could create a society that could be an example to the rest of the world,” compared with 61% who disagree. A slim majority of Republicans (52%) agree that God intended America to be a new promised land, compared with 31% of independents and 21% of Democrats.
A majority of white evangelical Protestants (54%) agree with this statement, compared with 41% of white mainline/non-evangelical Protestants, 39% of Black Protestants, 38% of white Catholics, and 35% of Hispanic Catholics. Non-Christians (17%) and religiously unaffiliated Americans are the least likely to agree (16%).
Americans who believe that America was designed by God to be a promised land for European Christians are significantly more likely than those who disagree to say that true American patriots may have to resort to violence to save the country (39% vs. 16%).
The Founders of the U.S. Intended it to be a Christian Nation
Americans are somewhat divided over whether the founders of the United States intended it to be a Christian nation with western European values (52% agree vs. 42% disagree). Most Republicans (75%) agree with this statement, compared with 51% of independents and 35% of Democrats.
White evangelical Protestants are the most likely to agree (77%) that the founders of the United States intended it to be a Christian nation, followed by white mainline/non-evangelical Protestants (62%), white Catholics (57%), and Black Protestants (53%). About four in ten or fewer Hispanic Catholics (44%), non-Christian religious Americans (40%), and unaffiliated Americans (37%) also agree.
About two-thirds of Americans living in rural areas (65%) agree that the United States was intended to be a Christian nation, compared with 52% of suburban Americans and 46% of urban Americans.
QAnon Beliefs
In 2021, PRRI began tracking beliefs in the QAnon conspiracy movement based on a composite measure from the following three questions: (1) The government, media, and financial worlds in the U.S. are controlled by a group of Satan-worshipping pedophiles who run a global child sex trafficking operation. (2) There is a storm coming soon that will sweep away the elites in power and restore the rightful leaders. (3) Because things have gotten so far off track, true American patriots may have to resort to violence in order to save our country.
The number of Americans who agree with each individual question has increased significantly between 2021 and 2023. Today, around one-quarter of Americans agree a storm is coming that will sweep away elites in power (27% in 2023 vs. 20% in 2021); that violence may be necessary to save the country (23% in 2023 vs. 15% in 2021); and that the government, media, and financial worlds are controlled by Satan-worshipping pedophiles (25% in 2023 vs. 15% in 2021).
To assess overall belief in QAnon, PRRI created a composite measure from these three questions and identified the following three groups:
- QAnon believers: Respondents who completely or mostly agreed with these statements.
- QAnon doubters: Respondents who mostly disagreed with these statements.
- QAnon rejecters: Respondents who completely disagreed with all three statements.
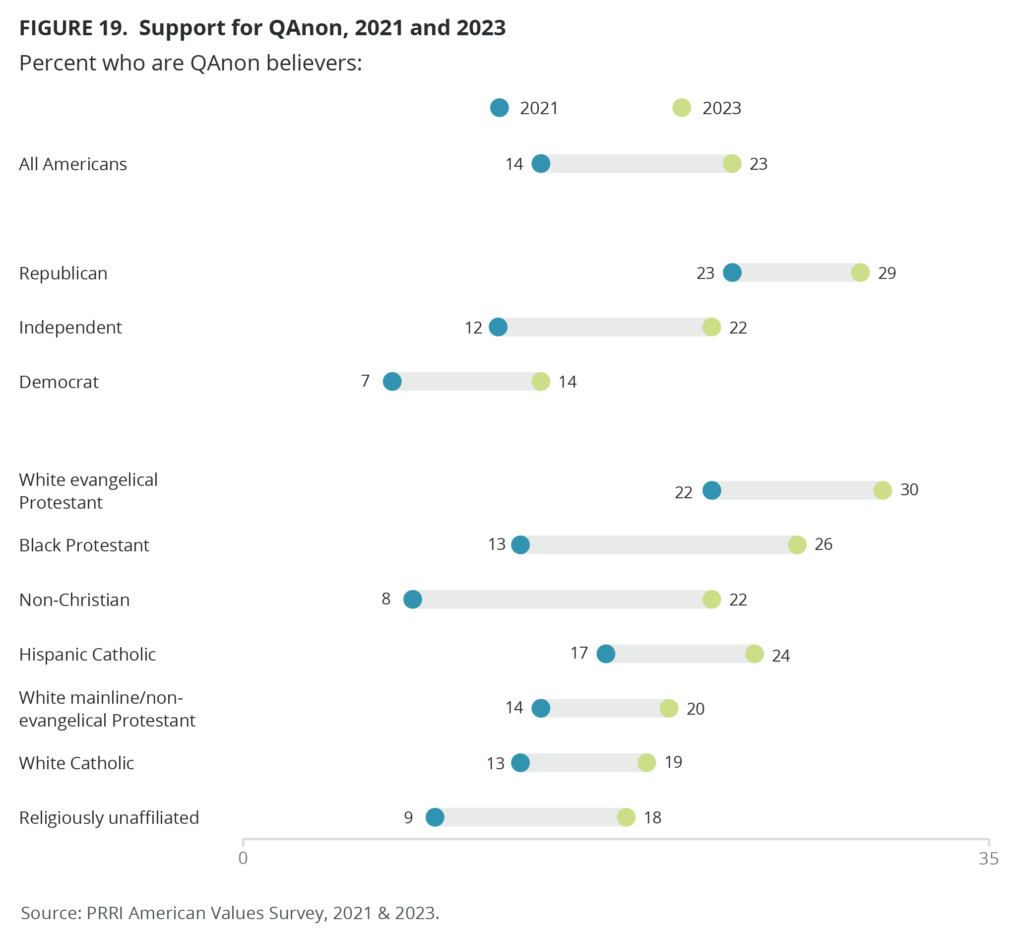
Since March 2021, the share of QAnon believers has increased significantly, from 14% to 23% today. The percentage of Americans who completely reject QAnon beliefs has significantly decreased from 40% to 29% in 2023. Additionally, the share of those who generally doubt — but do not fully reject — QAnon beliefs has increased slightly from 46% to 49% in 2023.
Across party lines, there has been a significant increase in QAnon believers as well as a decrease in QAnon rejecters. Most notably, the number of Democrats who qualify as QAnon believers has doubled since March 2021, from 7% to 14% in 2023; those who are QAnon rejecters has decreased from 58% to 43%. Among independents, the share of QAnon believers has increased from 12% to 22% and the percentage of QAnon rejecters has decreased from 40% to 30%. A similar, but smaller, trend also exists among Republicans. Currently, approximately three in ten Republicans (29%) qualify as QAnon believers, up from 23% in 2021; 14% are QAnon rejecters, up from 21% in 2021. About six in ten Republicans (57%), 47% of independents, and 44% of Democrats are QAnon doubters.
White evangelical Protestants (30%) are the most likely to be QAnon believers, followed by around one-quarter of Black Protestants (26%) and Hispanic Catholics (24%). However, since 2021, white evangelical Protestants (20%), Black Protestants (16%), and religiously unaffiliated Americans (9%) have seen the largest increases in QAnon beliefs.
State of Democracy in America
Future of American Democracy
Three-quarters of Americans (75%) agree that the future of American democracy is at risk in the 2024 presidential election. Democrats (84%) are the most likely to agree that the future of American democracy is at risk, but 77% of Republicans and 73% of independents also agree.
A majority of people across religious and racial lines also agree that the future of American democracy is at stake in 2024.
Reelection of Trump or Biden Poses a Threat to Democracy
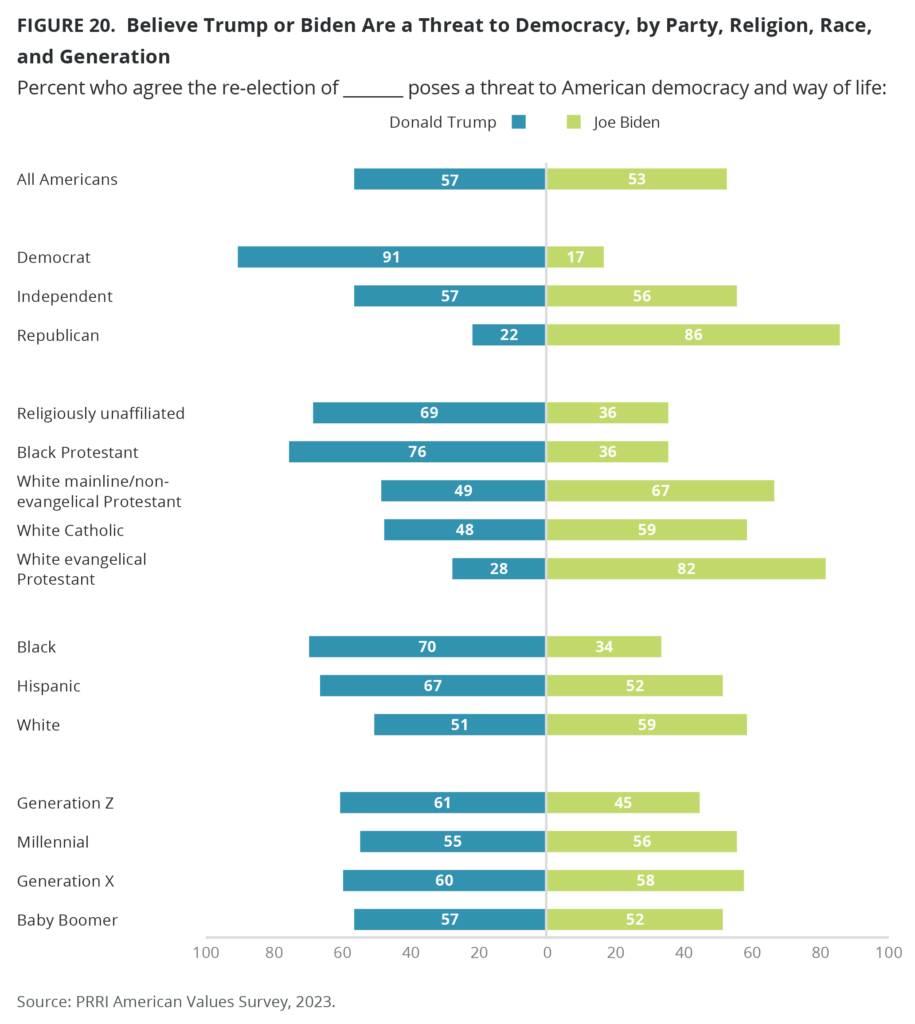
Nearly six in ten Americans (57%) see the reelection of Trump as a threat to American democracy and way of life, while 41% disagree. Notably, a slim majority of Americans (53%) also agree the reelection of Biden to the White House poses a threat to American democracy, compared with 43% who disagree.
Nine in ten Democrats (91%) and nearly six in ten independents (57%), but just 22% of Republicans, see the reelection of Trump as a threat to American democracy. By contrast, majorities of Republicans (86%) and independents (56%) agree that the reelection of Biden poses a threat to American democracy, compared with just 17% of Democrats.
Approximately three-quarters of Black Protestants (76%) and 69% of religiously unaffiliated Americans (69%) see Trump as a threat to American democracy, and white mainline/non-evangelical Protestants (49% agree vs. 50% disagree) and white Catholics (48% agree vs. 52% disagree) are divided on this question. Just 28% of white evangelical Protestants agree that the reelection of Trump poses a threat to democracy.[3] Majorities of white evangelical Protestants (82%), white mainline/non-evangelical Protestants (67%), and white Catholics (59%) agree that the reelection of Biden poses a threat to American democracy; only 36% of both Black Protestants and religiously unaffiliated Americans agree.
More than two-thirds of Black Americans (70%) and Hispanic Americans (67%) say the reelection of Trump poses a threat to American democracy. White Americans are divided about Trump being a threat to democracy (51% agree vs. 47% disagree). By contrast, nearly six in ten white Americans (59%) and 52% of Hispanic Americans, but only one-third of Black Americans (34%), say the reelection of Biden poses a threat to democracy.
Majorities of all generations agree that Trump poses a threat to American democracy: Gen Z (61%), millennials (55%), Gen X (60%), and baby boomers (57%).
By contrast, less than half of Gen Z Americans (45%) say that the reelection of Biden poses a threat to American democracy, compared with majorities of all other generations, including millennials (56%), Gen X (58%), and baby boomers (52%).
Democracy is Broken If Biden or Trump Win 2024 Election
Forty-five percent of Americans agree that if Trump wins the election, this means that democracy is broken and we may need a new form of government, compared with 38% who agree with this sentiment if Biden wins the 2024 election.
More than seven in ten Democrats (72%), 42% of independents, and 22% of Republicans agree that if Trump wins the election, democracy is broken. By contrast, nearly two-thirds of Republicans (64%), 37% of independents, and 18% of Democrats agree that democracy is broken if Biden wins the 2024 election.
Seven in ten Black Protestants (70%) and 59% of religiously unaffiliated Americans say democracy is broken if Trump wins the 2024 election, compared with 36% of white Catholics, 32% of white mainline/non-evangelical Protestants, and 27% of white evangelical Protestants.[4] Slim majorities of white evangelical Protestants (53%) and white Catholics (51%) agree that democracy is broken if Biden wins the 2024 election, while only 40% of white mainline/ non-evangelical Protestants, 31% of religiously unaffiliated Americans, and 21% of Black Protestants agree.
Majorities of Black (66%) and Hispanic Americans (53%) agree that democracy is broken if Trump is reelected, compared with 38% of white Americans. About four in ten white Americans (42%) and Hispanic Americans (40%) agree that democracy is broken if Biden wins the 2024 election, while Black Americans (24%) are half as likely to agree.
Gen Z Americans (39%) are less likely than all other generations, including millennials (48%), Gen X (45%), and baby boomers (44%), to agree that if Trump wins the 2024 election, democracy is broken. Gen Z Americans (28%) are less likely than all other generations, including millennials (36%), Gen X (41%), and baby boomers (42%), to agree that if Biden wins the 2024 election, democracy is broken.

The State of the Economy in America
Concerns About the Economy
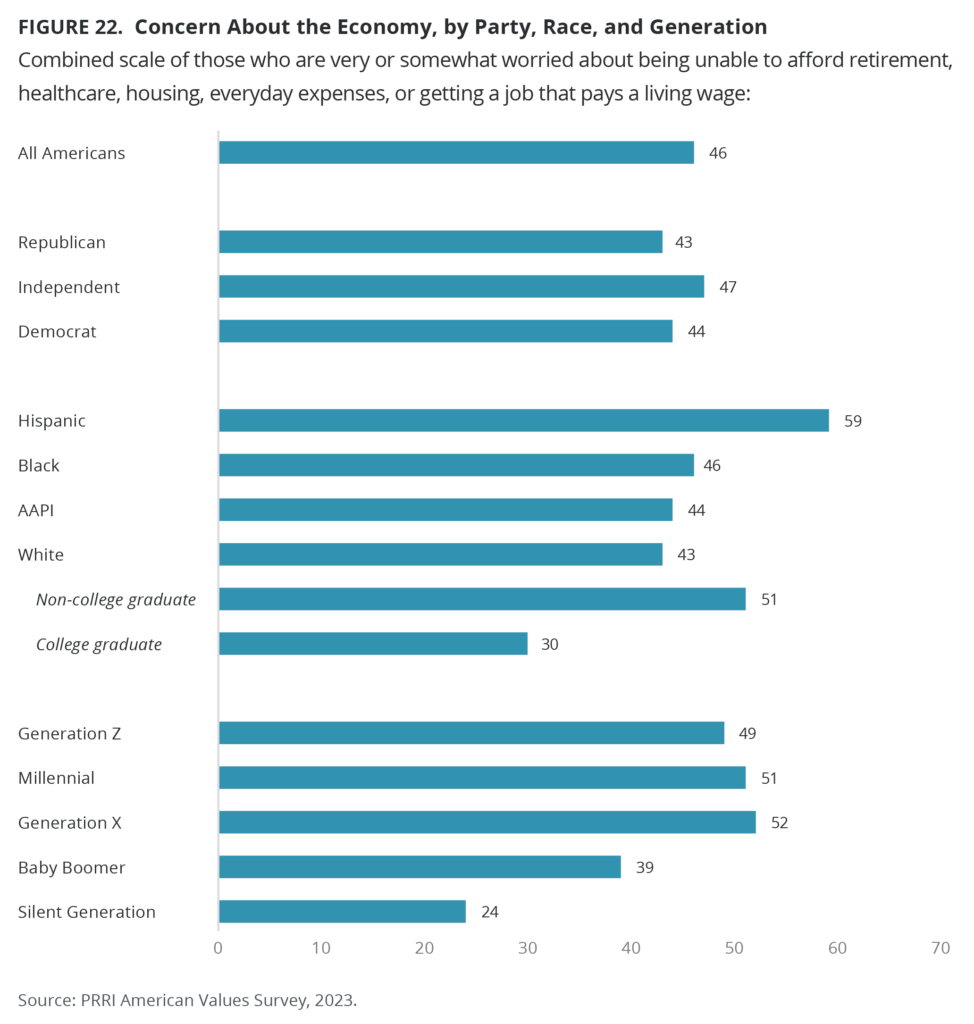
The survey finds several indicators of increased economic stress. More than seven in ten Americans (72%) say they are worried about not having enough money to retire, including 39% who are very worried. More than six in ten Americans say they are very or somewhat worried about being unable to afford health care (66%), housing (64%), or everyday expenses such as groceries or gas (63%), or get a job that pays a living wage (61%). A majority of Americans (82%) report being very or somewhat worried about at least one of these five items, while 46% report being very or somewhat worried about all five items.
There are no significant partisan differences: over four in ten Republicans (43%), Democrats (44%), and independents (47%) are very or somewhat concerned about all five economic items.
The majority of Hispanic Americans (59%) are very or somewhat concerned about all five economic items, compared with 46% of Black Americans, 44% of AAPI, and 43% of white Americans. Whites without a college degree are substantially more likely than those with a college degree to be concerned about all five economic items (51% vs. 30%).
Concerns about all five economic indicators decreases with each generation: 49% of Gen Z, 51% of millennials, 52% of Gen X, 39% of baby boomers, and 24% of the Silent Generation.
Concerns about Inflation
When Americans were asked their views about the problem of inflation, 44% say that inflation is mostly a problem because prices are rising too fast, versus 49% who say that inflation is mostly a problem because prices are already too high. Just 5% say they do not believe inflation is a major problem today. Republicans (49%) are more likely than Democrats (44%), and independents (42%) to say that inflation is mostly a problem because prices are rising too fast, but partisan groups are equally likely to say prices are already too high (47%, 48%, and 51%, respectively). Democrats are twice as likely as Republicans to say inflation is not a major problem today (7% vs. 3%). These views remain consistent across various demographics, including religious affiliation, generations, race, education, gender, region, and area of residence.
Confidence in College as a Smart Investment in the Future
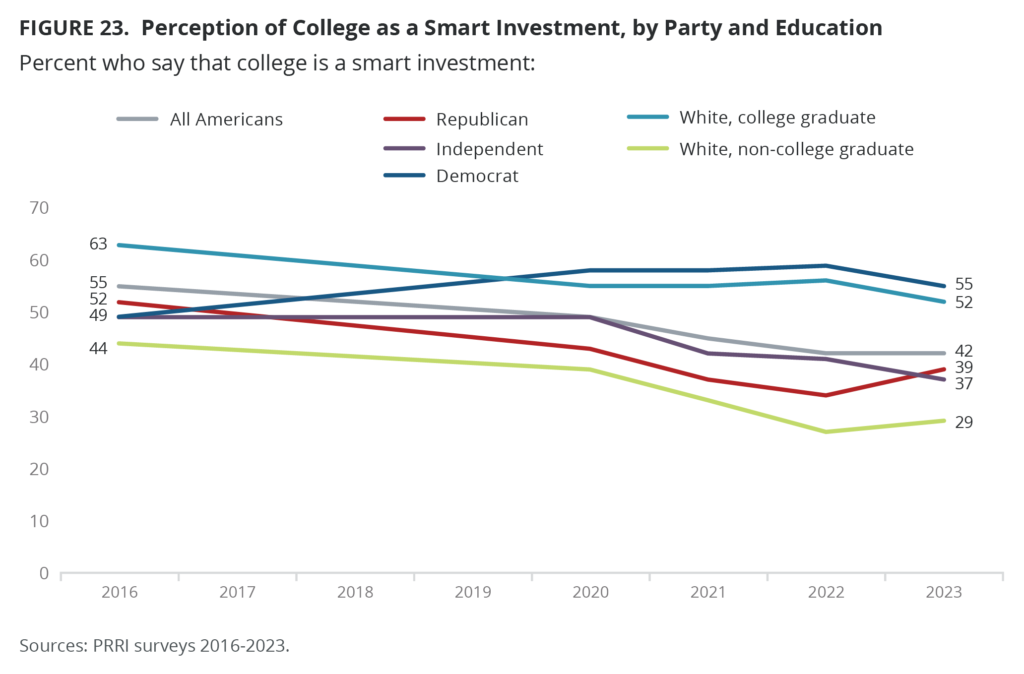
Reflecting economic pessimism and the rising costs of college tuition in the country, a majority of Americans (56%) say that a college education is a risky gamble that might not pay off, compared with about 42% who say a college education is a smart investment in the future. These attitudes represent an inversion from attitudes in 2016, when a majority of Americans (55%) saw college education as a smart investment. All partisans are now far less likely to say college is a smart investment: Republicans are down from 52% in 2016 to 39% in 2023, independents are down from 49% to 37%, and Democrats are down from 66% to 55%.
A majority of AAPI (60%) and half of Hispanic Americans (50%) say a college education is a good investment in the future, compared with 43% of Black Americans and 38% of white Americans. However, white Americans with a four-year college degree or higher are nearly twice as likely as white Americans without a four-year college degree to say that college is a smart investment (52% vs. 29%). However, among both groups, the belief in a college education as a smart investment has decreased significantly since 2016 (63% among those with a four-year college degree vs. 44% among those without a four-year college degree).
Confidence that a college education is a smart investment in the future varies little across generations: 44% of Gen Z, 38% of millennials, 43% of Gen X, 43% of baby boomers, and 48% of the Silent Generation believe that college is a good investment.
The State of Public Education in America
Despite controversies erupting around the country regarding the teaching of American history, overwhelming majorities of Americans today support teaching the good and the bad of American history, trust public school teachers to select appropriate curriculum, and strongly oppose the banning of books that discuss slavery or the banning of Advanced Placement (AP) African American History. A solid majority of Americans also oppose banning social and emotional learning programs in public schools, which have come under attack by religious conservatives in recent years. Americans are more divided on the teaching of elective Bible courses in public schools and teaching about sexual orientation and gender identity.
Teaching Children History
Nearly all Americans (94%) agree that “we should teach our children both the good and bad aspects of our history so that they can learn from the past,” compared with just 4% who agree that “we should not teach children history that could make them feel uncomfortable or guilty about what their ancestors did in the past.” These views are consistent across party affiliation, religious affiliation, generation, race, education, gender, region, or whether Americans live in rural, suburban, and urban areas.
View of Teachers and Librarians
Three-quarters of Americans (75%) agree that public school teachers and librarians are professionals whom we should trust to provide our kids with appropriate curriculum and books that teach the good and bad of American history, compared with 22% who believe that public school teachers and librarians should not be allowed to develop curriculum and teach books that wrongly portray America as a racist country. The number of Americans who agree that teachers and librarians should be trusted to teach history appropriately has increased from 66% in 2022 to 75% in 2023.
Democrats (92%) are more likely than independents (73%) and Republicans (61%) to agree that teachers and librarians should be trusted to teach history appropriately. Republicans and Republican-leaning independents who attend religious services weekly or more (49%) are less likely than those who attend at least a few times a year (61%) or seldom/never attend (63%) to agree.
Americans who trust Fox News (49%) or far-right media outlets the most (36%) are less likely to agree that teachers and librarians should be trusted to teach history appropriately, compared with those who trust no TV news source (75%) or most trust mainstream media sources (88%).
Majorities of all major religious groups agree that teachers and librarians should be trusted to teach history, including at least eight in ten Black Protestants (90%), unaffiliated Americans (85%), Hispanic Protestants (84%), and non-Christian religious Americans (82%). Around seven in ten or more Hispanic Catholics (76%), white mainline/non-evangelical Protestants (72%), and white Catholics (70%) also agree, compared with 60% of white evangelical Protestants.
What is Appropriate to Teach in Public School
Banning Books that Include Depictions of Slavery
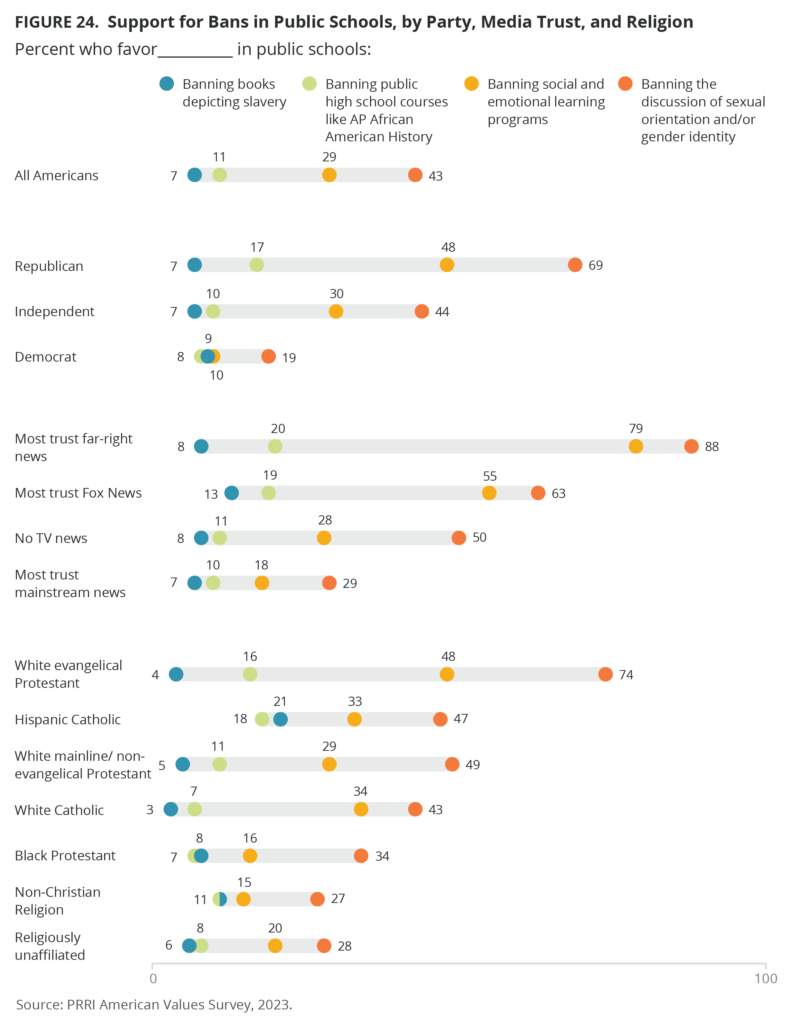
Fewer than one in ten Americans favor the banning of books that include depictions of slavery from being taught in public schools (7%), compared with 88% who oppose such bans. About the same number of Republicans (7%), independents (7%), and Democrats (9%) favor banning these books. There are few attitudinal differences across various demographics, including religious affiliation, generations, race, education, gender, region, or whether Americans live in rural, suburban, and urban areas.
Banning AP African American History
Similarly, about one in ten Americans (11%) favor banning public high school courses like AP African American History because the topics of slavery and segregation are likely to make white students feel guilty or uncomfortable, compared with 84% who oppose such bans. Republicans (17%) are more likely than independents (10%) and Democrats (8%) to favor banning these courses. There are few attitudinal differences across various demographics, including religious affiliation, generations, race, education, gender, region, or whether Americans live in rural, suburban, and urban areas.
Banning Social and Emotional Learning Programs
Approximately three in ten Americans (29%) favor banning social and emotional learning programs from public schools because they conflict with the moral teachings that kids should be getting from home, compared with 66% of Americans who oppose such bans. Nearly half of Republicans (48%), but only 30% of independents and 10% of Democrats, favor such bans. Republicans and Republican-leaning independents who attend religious services weekly or more (55%) are notably more likely than those who attend religious services at least a few times a year (43%) or seldom/never attend (47%) to favor banning social and emotional learning programs in public schools.
Americans who most trust far-right news sources (79%) are far more likely to favor banning social and emotional learning programs than those who most trust Fox News (55%), those who do not watch TV news (28%), and those who most trust mainstream news (18%).
White evangelical Protestants are most likely to favor banning social and emotional learning programs (48%), followed by white Catholics (34%), Hispanic Catholics (33%), white mainline/non-evangelical Protestants (29%), religiously unaffiliated Americans (20%), Black Protestants (16%), and non-Christians (15%).
Banning Discussions of Sexual Orientation and Gender Identity
Approximately four in ten Americans (43%) favor banning the discussion of sexual orientation and/or gender identity in public schools, compared with a majority (53%) who oppose such bans. There are massive partisan divides on this question. Nearly seven in ten Republicans (69%), compared with only 44% of independents and 19% of Democrats, favor banning discussion of sexual orientation and gender in public schools.
Americans who most trust far-right news sources (88%) and those who most trust Fox News (63%) are far more likely those who do not watch TV news (50%) or those who most trust mainstream news (29%) to favor banning the discussion of sexual orientation and/or gender identity in public schools.
White evangelical Protestants (74%) are the only major religious group in which a majority favor banning the discussion of sexual orientation and/or gender identity in public schools. Fewer than half of white mainline/non-evangelical Protestants (49%), Hispanic Catholics (47%), white Catholics (43%), Black Protestants (34%), religiously unaffiliated Americans (28%), and non-Christians (27%) favor such bans.
Support for banning discussions of sexual orientation and gender identity in public schools decreases with education: 47% of both Americans with a high school education or less or some college, 40% of college graduates, and 31% of postgraduates.
Americans who live in rural areas (55%) are notably more likely than those who live in suburban (44%) and urban areas (36%) to favor banning discussions of sexual orientation and gender in public schools.
Elective Christian Bible Courses
A majority of Americans (53%) favor offering elective courses on the Bible that are taught from Christian perspective in public schools, compared with 43% who oppose offering these courses. Republicans (73%) are notably more likely than independents (52%) and Democrats (38%) to favor offering elective Bible courses in public schools. Republicans and Republican-leaning independents who attend religious services weekly or more (50%) are more than twice as likely as those who attend religious services at least a few times a year (23%) or seldom/never attend (18%) to strongly favor offering elective courses on the Bible in public schools.
Americans who most trust far-rights news media outlets are the most likely to favor elective Bible courses in public schools (81%), followed by Fox News viewers (66%). Americans who don’t trust any TV news (54%) or most trust mainstream news (48%) are less likely to favor elective Bible courses.
Over eight in ten white evangelical Protestants (86%) and Hispanic Protestants (82%) favor offering elective Bible courses in public schools, along with 66% of Black Protestants, 63% of white mainline/non-evangelical Protestants, 60% of Hispanic Catholics, and 52% of white Catholics. About three in ten members of non-Christian religions (34%) and unaffiliated Americans (27%) favor these courses.
Americans living in rural areas are most likely to favor or strongly favor elective Bible courses (68%), compared with Americans living in urban (50%) and suburban areas (50%).
Specific Issues
Abortion
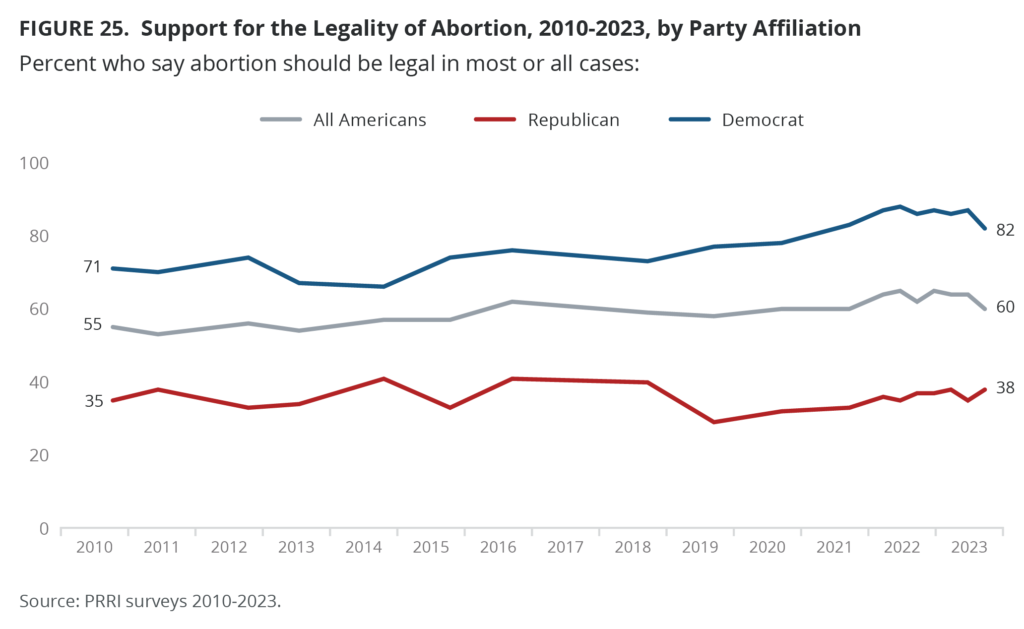
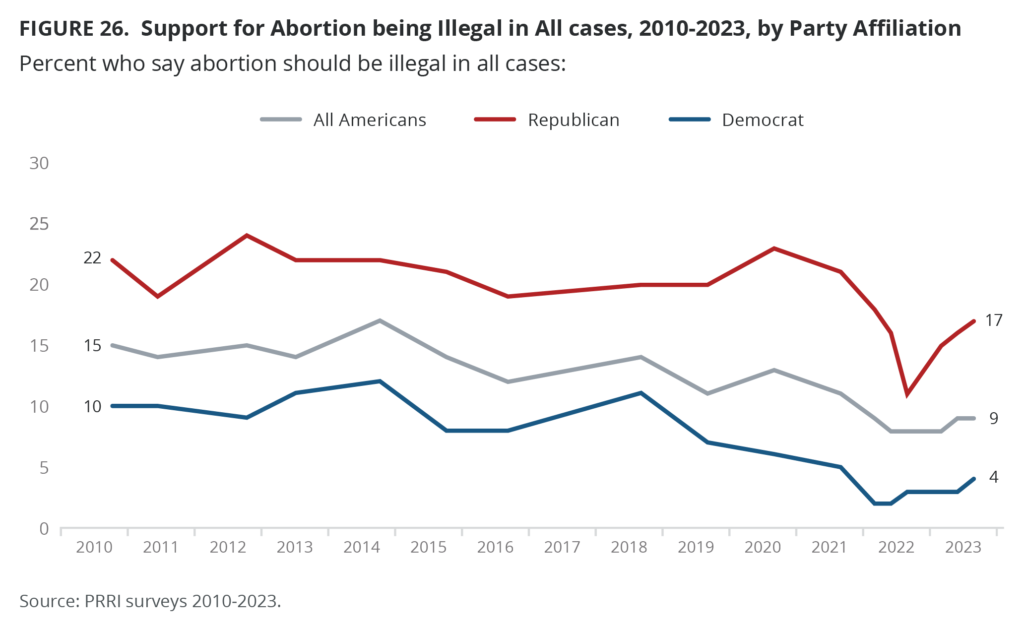
Six in ten Americans (60%) say abortion should be legal in most or all cases, compared with less than four in ten Americans (37%) who say it should be illegal in most or all cases. Notably, Americans are nearly three times as likely to say abortion should be legal in all cases as they are to say it should be illegal in all cases (26% vs. 9%). Since PRRI began asking this question in 2010, the proportion of Americans who say abortion should be illegal in all cases has never risen above 19%, measured in 2014.
Nearly four in ten Republicans (38%) say abortion should be legal in most or all cases, compared with 61% who say it should be illegal in most or all cases. Notably, only 17% of Republicans say abortion should be illegal in all cases. Two-thirds of independents (63%) and an overwhelming majority of Democrats (82%) say abortion should be legal in most or all cases. Since 2010, Democratic support for the legality of abortion in all or most cases has increased by 11 percentage points, up from 71%.
White evangelical Protestants are the only major religious group in which a majority opposes the legality of abortion (24% favor, 75% oppose), but even among white evangelical Protestants, far less say abortion should be illegal in all cases (24%). Nearly all other major religious groups support the legality of abortion, including 82% of religiously unaffiliated Americans, 79% of members of non-Christian religious groups, 70% of Black Protestants, 65% of white mainline/non-evangelical Protestants, and 59% of white Catholics. Hispanic Catholics are divided (48% vs. 49%) on the issue.
Support for the legality of abortion increases with education, but even among Americans with a high school education or less, the majority support the legality of abortion (53%), as do Americans with some college (61%), a four-year college education (64%), and postgraduate education (74%).
Americans who live in rural areas (49%) are less likely than those who live in suburban (62%) and urban (63%) areas to support the legality of abortion. Notably, there is majority support for the legality of abortion in all regions of the country: South (55%), Midwest (61%), West (63%), and Northeast (68%).
Systemic Racism
The Impact of the Legacy of Slavery and Discrimination
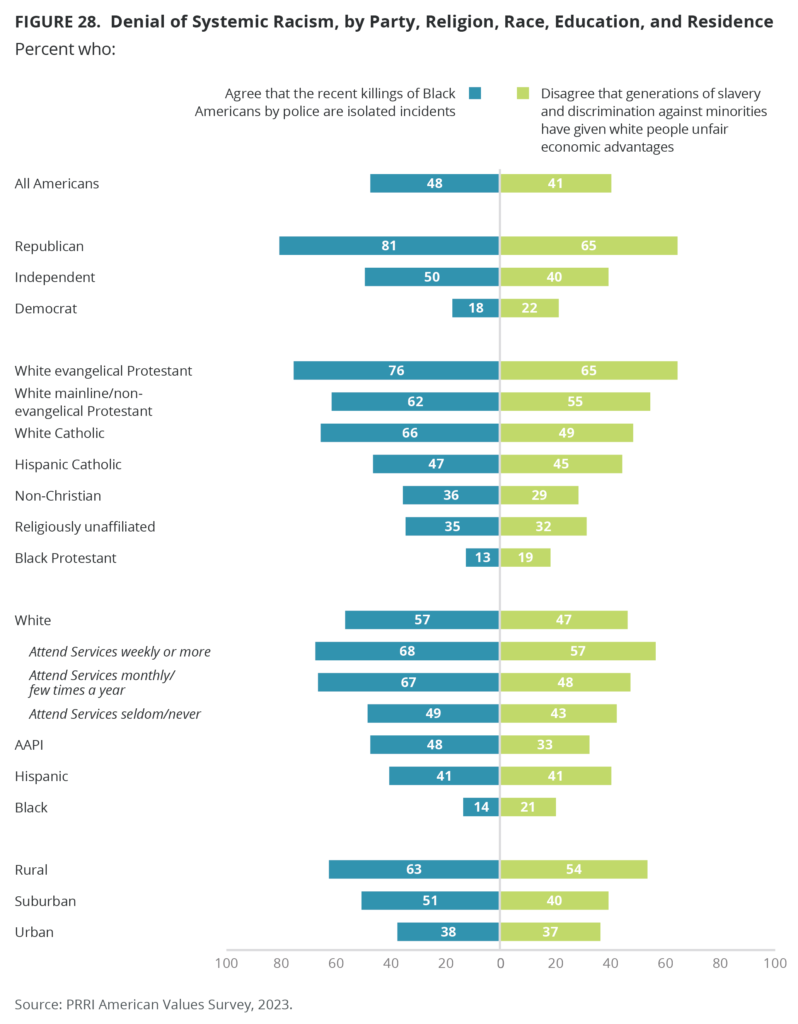
A majority (53%) of Americans agree that generations of slavery and discrimination against Black people and Native Americans have given white people unfair economic advantages, compared with 41% who disagree. Majorities of Republicans (65%) and independents (40%) disagree with this statement, compared with only 22% of Democrats.
White Christian subgroups are significantly more likely than other religious groups to disagree with this statement. About two-thirds of white evangelical Protestants (65%), 55% of white mainline/non-evangelical Protestants, and about half of white Catholics (49%) disagree that the legacy of slavery and discrimination against minorities has created unfair economic advantages for white people. By contrast, 45% of Hispanic Catholics, one-third of religiously unaffiliated Americans (32%), 29% of non-Christian religious Americans, and just 19% of Black Protestants disagree.
White (47%) and Hispanic Americans (41%) are more likely than AAPI (33%) and Black Americans (21%) to disagree that generations of slavery and discrimination against minorities have given white people unfair economic advantages. However, white Americans with at least a four-year college degree are more likely than white Americans without a college degree (52% vs. 38%) to disagree. Whites who attend religious services weekly or more (57%) are more likely than those who attend at least a few times a year (48%) or seldom/never attend (43%) to disagree.
The Killing of Black Americans by Police
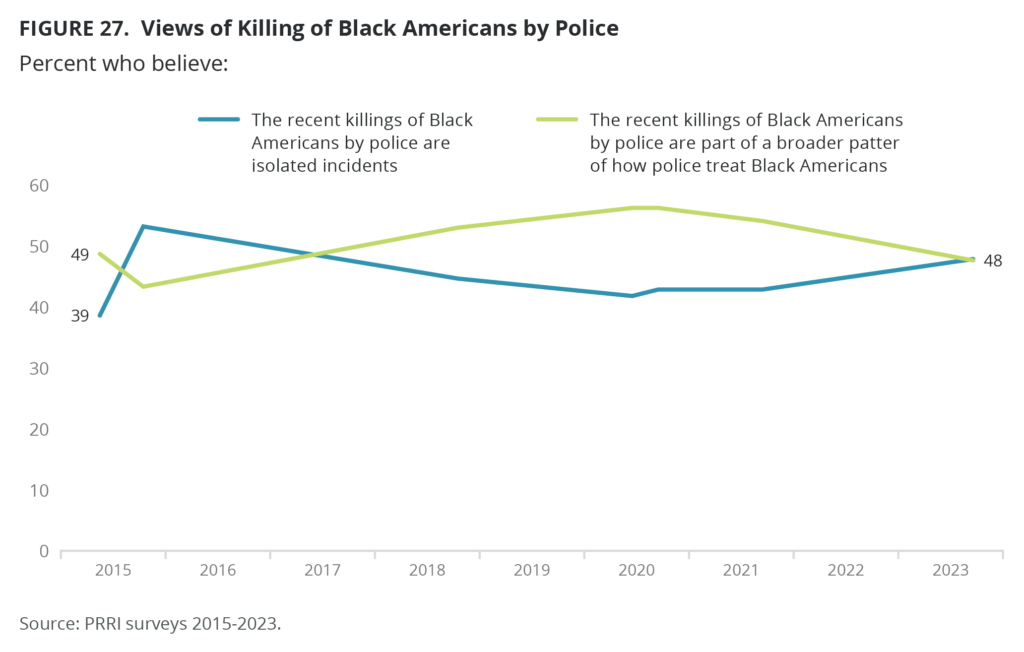
Americans are divided over whether the recent killings of Black Americans by police are isolated incidents (48%) or part of a broader pattern of how police treat Black Americans (48%). PRRI first asked this question in 2015, as the Black Lives Matter movement was gaining national recognition. At that time, similar numbers of Americans said the killings of Black Americans by police were part of a pattern (49%). The proportion of Americans agreeing with that perspective increased to 53% in 2018 and 56% in 2020 before falling back to 2015 levels today.
Around eight in ten Republicans (81%), half of independents (50%), and 18% of Democrats believe that killings of Black Americans by police are isolated incidents rather than part of a broader pattern of how police treat Black Americans.
The vast majority of Americans who most trust far-right media outlets (91%) and Fox News (81%) for television news say that the killing of Black Americans by police are isolated incidents, compared with half of those who don’t watch TV news (50%) and 35% of those who watch mainstream news.
Solid majorities of white Christian groups say that the killing of Black Americans by police are isolated incidents, including 76% of white evangelical Protestants, 66% of white Catholics, and 62% of white mainline/non-evangelical Protestants, compared with 47% of Hispanic Catholics, 36% of non-Christians, 35% of religiously unaffiliated Americans, and just 13% of Black Protestants.
White Americans (57%) are much more likely than AAPI (48%) and Hispanic Americans (41%) to say that killings of Black Americans by police are isolated incidents rather than part of a pattern of how police treat Black Americans. Just 14% of Black Americans say that the killings are isolated incidents. White Americans without college degrees are more likely to think this way than those with college degrees (62% vs. 49%). Whites who attend religious services weekly or more (68%) and who attend at least a few times a year (67%) are more likely than those who seldom or never attend (49%) to say that killings of Black Americans by police are isolated incidents.
Americans who live in rural areas (63%) are substantially more likely than those who live in suburban (51%) or urban areas (38%) to say the killings of Black Americans are isolated incidents. Americans who say that racial inequality is a critical issue are five times less likely to say this than those who say racial inequality is not an important issue (16% vs. 86%).
Gender and LGBTQ Issues
Society is Too Soft and Feminine
Americans are divided over whether society as a whole has become too soft and feminine (48% agree vs. 48% disagree). Since PRRI first asked this question in 2010, the partisan divide has doubled, from 23% to 48%. Over seven in ten Republicans (72%) say society has become too soft and feminine, compared with 48% of independents and 24% of Democrats.
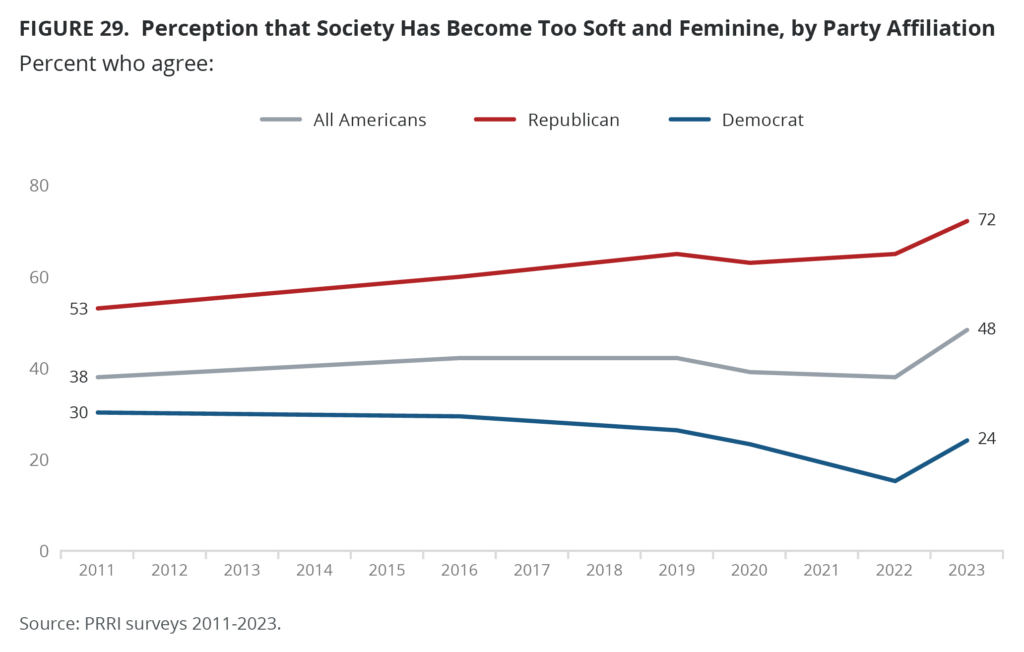
Majorities of white Christian subgroups agree that society has become too soft and feminine, including two-thirds of white evangelical Protestants (67%) and slim majorities of white mainline/non-evangelical Protestants (53%) and white Catholics (53%). Under half of Black Protestants (46%) and Hispanic Catholics (46%), as well as four in ten unaffiliated Americans (40%) and one-third of non-Christians (34%), also agree.
White Americans (51%) are more likely than Black Americans (45%), Hispanic Americans (42%), and AAPI (39%) to say society has become too soft and feminine. However, white Americans with a four-year college degree (39%) are less likely than those without a four-year degree or higher (59%) to agree.
Men are more likely than women to say that society has become too soft and feminine (55% vs. 41%), but there are no substantial differences by generation. However, there is a gap on this question between Gen Z men (60%) and Gen Z women (42%).
Over four in ten Americans who live in urban areas (42%) say society has become too soft and feminine, compared with about half of those who live in suburban areas (48%) and 58% of those who live in rural areas.
Bathroom Accommodations
A majority of Americans today favor laws that require transgender individuals to use bathrooms that correspond to their sex at birth rather than their current gender identity (54% favor, 40% oppose). Despite increasing support for LGBTQ rights generally, Americans are moving in the opposite direction regarding this specific question. Americans are nearly 20 percentage points more likely to favor such policies today than they were in 2016, when the question was first asked (35% favor, 53% oppose).
Compared with responses from 2016, support for restrictive bathroom policies is notably higher among Republicans and independents. The biggest shift is among Republicans, who are 36 percentage points more likely to favor requiring transgender individuals to use bathrooms that correspond to their sex at birth (from 44% in 2016 to 80% in 2023). Independents are also more likely to support these policies today (56%) than they were in 2016 (37%). Democrats (31% in 2023) have slightly shifted from 27% in 2016.
With the exception of religiously unaffiliated Americans (38%) and non-Christians (40%), majorities of all religious groups support requiring transgender individuals to use bathrooms that correspond to their sex at birth, including eight in ten white evangelical Protestants (80%), 61% of white mainline/non-evangelical Protestants, 61% of Hispanic Catholics, 59% of white Catholics, and 55% of Black Protestants.
Slim majorities of Hispanic Americans (57%) and white Americans (56%) support restrictive bathroom policies, compared with under half of Black Americans (47%) and AAPI (46%). However, white Americans with a college degree are notably less likely than those without a college degree to support restrictive bathroom policies (49% vs. 61%).
Support for restrictive bathroom policies increases with generation. Gen Z (43%) are the least supportive, compared with 53% of millennials, 57% of Gen X, 59% of baby boomers and 60% of the Silent Generation. Men are more likely than women to support restrictive bathroom policies (58% vs. 52%).
Americans who live in urban (50%) and suburban (53%) areas are less likely than those who live in rural areas (65%) to favor restrictive bathroom policies.
Preventing Medical Care for Gender Transition Among Children
Americans are divided over whether they favor (49%) or oppose (47%) laws that would prevent parents from allowing their child to receive medical care for a gender transition. Since PRRI first asked the question in September 2022, Americans (44%) have grown more supportive of laws that prevent gender transition medical care for minors. Both Republicans (72%) and Democrats (28%) have grown more likely to agree with such laws in 2023 than they were in 2022 (61% and 22%, respectively). Independents have not shifted much (49% in 2023 vs. 46% in 2022).
Majorities of white Christian groups support these laws, including 72% of white evangelical Protestants (up from 59% in 2022), 56% of white mainline/non-evangelical Protestants (up from 46% in 2022), and 52% of white Catholics (up from 43% in 2022). Under half of Hispanic Catholics (47%) and Black Protestants (46%) support these laws. Non-Christian religious Americans (37%) and religiously unaffiliated Americans (37%) are the least likely to support preventing parents from allowing their child to receive medical care for gender transition.
White Americans (52%) are more likely than Hispanic Americans (44%) and Black Americans (41%) to support these laws, but do not differ from AAPI (49%). However, whites with a college degree are substantially less likely than those without a college degree to support these laws (44% vs. 56%).
Under half of Americans who live in urban (46%) and suburban areas (47%) support preventing parents from allowing their child to receive medical care for gender transition, compared with 61% of those who live in rural areas. Similarly, those who live in the Northeast (42%) and the West (46%) are less likely than those who live in the Midwest (52%) and the South (52%) to support these laws.
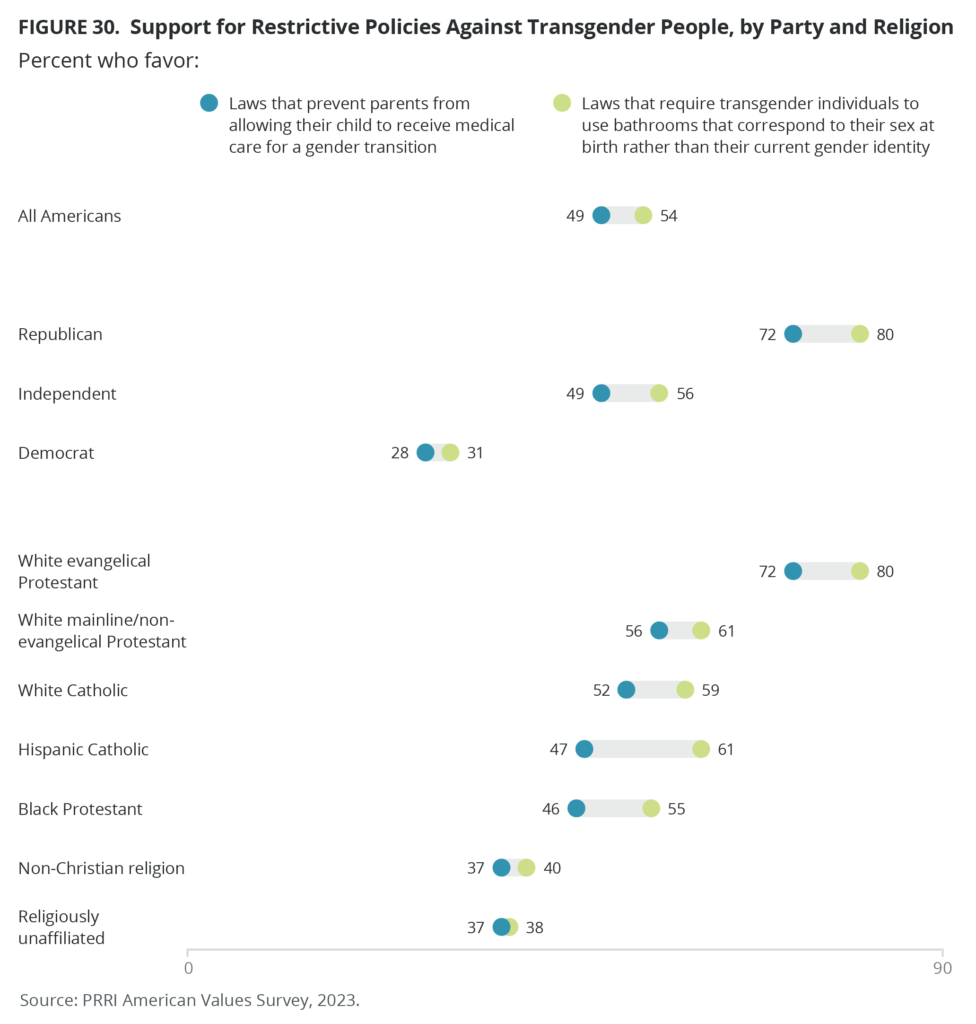
People Advocating for Transgender Rights Have Gone Too Far in Recent Years
A slim majority of Americans (54%) agree that people advocating for the rights of transgender people have gone too far in recent years, compared with 43% who disagree. Most Republicans (85%) and independents (56%) agree with this statement, compared with 29% of Democrats.
Majorities of white Christian groups agree, including 80% of white evangelical Protestants, 67% of white Catholics, and 57% of white mainline/non-evangelical Protestants. Religiously unaffiliated Americans (39%) are the least likely to agree that people advocating for transgender rights have gone too far in recent years. [5]
White Americans (58%) are more likely than Hispanic Americans (48%) and Black Americans (48%) to agree. However, whites with a college degree are substantially less likely than those without a college degree to agree (49% vs. 62%). Men are more likely than women to agree that people advocating for transgender rights have gone too far in recent years (57% vs. 50%).
Seven in ten Americans who live in rural areas (70%) agree that people advocating for transgender rights have gone too far in recent years, compared with 54% of those who live in suburban areas, and under half who live in urban areas (46%).
Restricting the Rights of Transgender People Is Just Another Form of Discrimination
At the same time, a majority of Americans (58%) agree that restricting the rights of transgender people is just another form of discrimination, compared with 37% who disagree. Most Democrats (79%) and independents (59%) agree with this statement, compared with 43% of Republicans.
With the exception of white evangelical Protestants (35%), majorities of all other religious groups agree that restricting the rights of transgender people is just another form of discrimination, including 55% of white mainline/non-evangelical Protestants, 56% of Black Protestants, 60% of Hispanic Catholics, 67% of white Catholics, and 75% of religiously unaffiliated Americans. [6]
Around six in ten Americans who live in urban (59%) and suburban areas (63%) agree that restricting the rights of transgender people is just another form of discrimination, compared with 45% of those who live in rural areas.
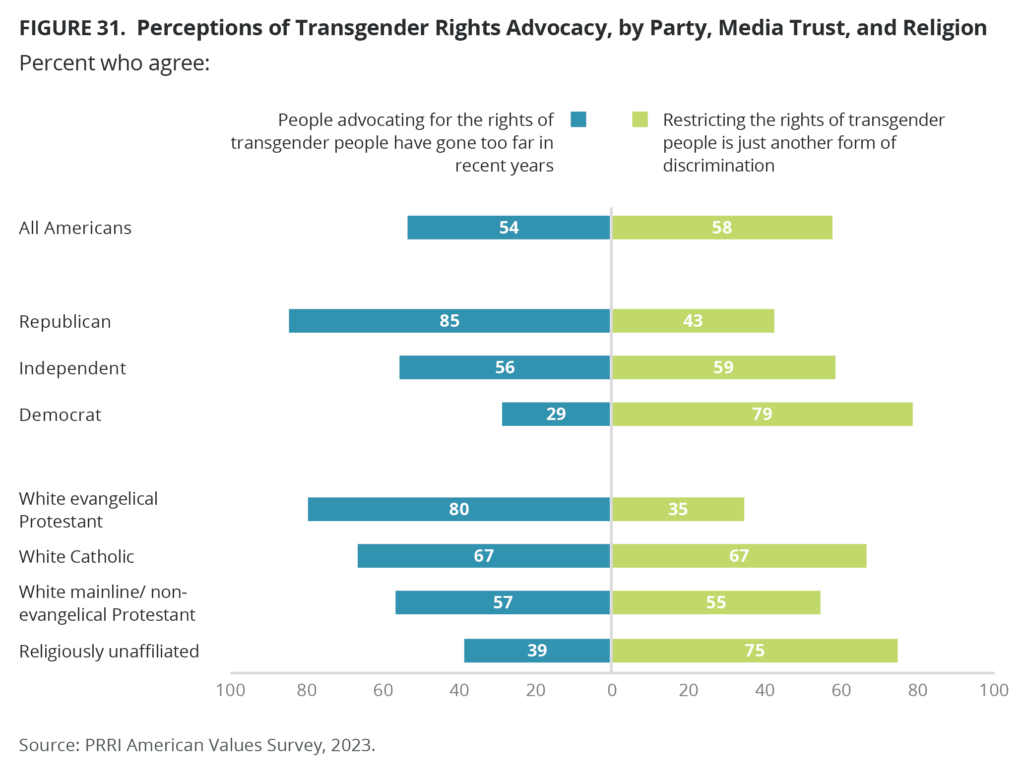
Immigration
Perceptions of Immigrants as a Threat
Growing Number of Newcomers as a Threat
A majority of Americans (52%) say the growing number of newcomers from other countries strengthens American society, compared with 44% who say it threatens traditional American customs and values. The perception of immigrants as a threat has fluctuated over the last decade but today stands at a similar level to when the question was first asked in 2011 (42%).
More than seven in ten Republicans (72%) say newcomers are a threat, compared with a far lower percentage of independents (43%) and Democrats (21%). Three in four Democrats (76%), 53% of independents, and 25% of Republicans say newcomers from other countries strengthen American society.
Americans who most trust far-right news outlets are notably more likely to say that immigrants threaten American customs and values (90%), along with 71% of Americans who most trust Fox News. Americans who do not trust any TV news (43%) or most trust mainstream outlets (37%) are much less likely to think this way.
White Christian subgroups are significantly more likely than members of other groups to perceive newcomers as a threat. Seven in ten white evangelical Protestants (70%) and a slim majority of white mainline/non-evangelical Protestants (56%) and white Catholics (55%) are more likely to see newcomers as a threat. Less than half of Hispanic Catholics (42%), Black Protestants (39%), religiously unaffiliated Americans (32%), and non-Christian religious Americans (30%) perceive newcomers as a threat.
“Great Replacement” Theory
Nearly four in ten Americans (38%) agree with the statement “Immigrants are invading our country and replacing our cultural and ethnic background,” compared with 57% who disagree. Agreement with this statement has remained unchanged from 36% in 2019, when PRRI first asked this question.
While Democrats (15%) have become less likely to agree with this idea — which is promoted in conservative circles as “the Great Replacement Theory” — than they were in 2019 (20%), independents (37%) have grown more likely to agree with this sentiment (31% in 2019). Republican views (65%) have remained consistent since 2019 (63%).
The vast majority of far-right news (87%) and Fox News viewers (67%) agree with this theory, compared with 35% of those who do not watch TV news or 29% of those who watch mainstream news.
White Christian subgroups are notably more likely than other religious groups to share this perception of immigrants as an invading force: 61% of white evangelical Protestants, 51% of white Catholics, and 46% of white mainline/non-evangelical Protestants. By contrast, only 30% of Black Protestants, 30% of Hispanic Catholics, 28% of religiously unaffiliated Americans, and 26% of non-Christian religious Americans share this sentiment.
Immigration Policies
Pathway to Citizenship
Nearly six in ten Americans (60%) say that immigrants living in the United States illegally should be given a way to become citizens, provided they meet certain requirements. More than one in ten say they would prefer undocumented immigrants to be eligible for permanent residency status but not citizenship (13%), and one-quarter say all immigrants living in the country illegally should be identified and deported (25%). Support for a pathway to citizenship for undocumented immigrants has remained remarkably consistent since 2013, from a low of 57% in 2022 and 2015 to a high of 67% in 2019.
Democrats (80%) have grown more supportive of a path to citizenship for undocumented immigrants, with support increasing from 71% in 2013 when the question was first asked. By contrast, Republicans (45%) have become less supportive than they were in 2013 (53%).
Majorities of almost all religious groups support allowing undocumented immigrants to become citizens. White evangelical Protestants (45%) stand out as the only religious group in which a majority does not support a path to citizenship for undocumented immigrants.
Building a Wall on America’s Southern Border
Americans are divided over favoring (47%) or opposing (50%) building a wall along the U.S. border with Mexico. Support for this policy has grown since 2016 when the question was first asked (41%). More than eight in ten Republicans (82%) support Trump’s border wall idea, while a similar number of Democrats oppose it (81%). Independents roughly mirror Americans in general (46% favor, 50% oppose).
Preventing Refugees from Entering the U.S.
A majority of Americans oppose passing a law to prevent refugees from entering the United States (59%), compared with 37% who favor it. Opposition and support for this policy has remained stable since 2017 (59% vs. 36%). There are stark partisan divisions. Republicans (63%) are substantially more likely than independents (37%) and Democrats (17%) to favor the passage of a law that would prevent refugees from entering the United States.
Placing Stricter Limits on Number of Legal Immigrants
Americans are divided on whether they favor (50%) or oppose (46%) passing a law that places stricter limits on the number of legal immigrants coming to the U.S. Attitudes over this question have not changed since it was first asked in 2018 (51% vs. 47%). Republicans (70%) are notably more likely than independents (50%) and Democrats (34%) to favor passing a law that places stricter limits on the number of legal immigrants coming to the U.S.
Passing A Law That Prevents Asylum Seekers from Coming to The U.S.
Americans are also divided about passing a law that prevents asylum seekers from coming to the U.S. if they haven’t first sought protection in some other country (47% favor, 48% oppose). Two-thirds of Republicans (67%), half of independents (49%), and 30% of Democrats favor this policy.
Majorities of white evangelical Protestants (60%), white Catholics (56%), and white mainline/non-evangelical Protestants (55%) favor this policy. Hispanic Catholics (53% vs. 47%) and Black Protestants (46% vs. 47%) are divided on this policy. Non-Christian religious Americans (42%) and unaffiliated Americans (37%) are the least likely to favor passing a law that prevents asylum seekers from coming to the U.S. if they haven’t first sought protection in some other country.
Installing Physical Deterrents to Prevent Immigrants from Entering U.S.
A slim majority (52%) of Americans oppose installing deterrents such as walls, floating barriers in rivers, and razor wire to prevent immigrants from entering the country illegally, even if they endanger or kill some people, compared with 44% who support this tactic. Nearly eight in ten Republicans (77%), compared with 44% of independents and just 15% of Democrats, favor this policy.
Nearly all far-right news viewers (96%) as well as nearly eight in ten Fox News viewers (77%) support this policy, compared with about half of those who do not watch TV news (47%) and 29% of those who watch mainstream news.
Majorities of white Christian subgroups favor this policy, including 74% of white evangelical Protestants, 58% of mainline Protestants/non-evangelical Protestants, and 56% of white Catholics, compared with one-third or less unaffiliated Americans (33%), Hispanic Catholics (27%), non-Christians (26%), and Black Protestants (25%).
A majority of white Americans (53%) favor installing deterrents such as walls, floating barriers in rivers, and razor wire to prevent immigrants from entering the country illegally, even if they endanger or kill some people, compared with 34% of AAPI, 30% of Hispanic Americans, and 23% of Black Americans. Whites without a college degree are more likely than those with a college degree to favor this policy (59% vs. 44%).
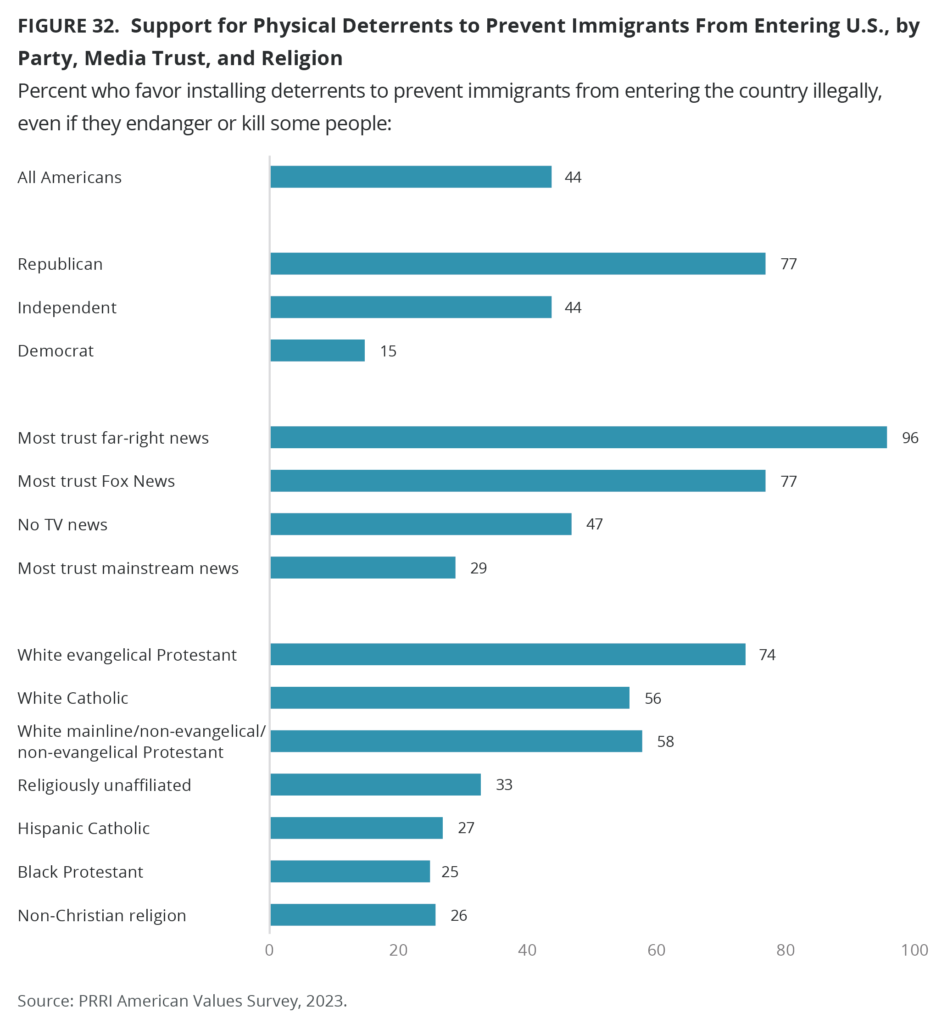
Foreign Policy
A majority of Americans (64%) consider Russia an enemy of the U.S. and an additional 24% consider Russia unfriendly but not an enemy. By contrast, 6% consider Russia friendly but not an ally. Only 2% of Americans consider Russia to be an ally of the U.S. The number of Americans who consider Russia an ally of the U.S. has decreased in the past six years (8% in 2017, compared with 2% in 2023). The number of Americans who consider Russia an enemy of the U.S. has increased 40 percentage points, from 24% in 2017 to 64% in 2023.
By contrast, four in ten Americans consider Ukraine an ally of the U.S. (40%), a similar number consider Ukraine friendly but not an ally (41%), 9% consider Ukraine unfriendly but not an enemy, and just 5% consider Ukraine an enemy of the U.S. Further, a majority of Americans (54%) agree that we should continue aid to Ukraine because resisting Russian aggression is in the vital national security interests of the United States. In comparison, 42% of Americans who say we should end aid to Ukraine because we need the money to address problems here at home.
Three in ten Americans consider Mexico an ally of the U.S. (30%), 42% consider Mexico friendly but not an ally, 19% consider Mexico unfriendly but not an enemy, and 4% consider Mexico to be an enemy of the U.S. By contrast, Americans are less likely to consider Hungary to be an ally of the U.S. (17%). Forty-seven percent consider Hungary friendly but not an ally, 23% consider Hungary unfriendly but not an enemy, and only 4% consider Hungary an enemy of the U.S.
Three percent of Americans consider China to be an ally of the U.S., 13% consider China friendly but not an ally, 34% consider China unfriendly but not an enemy, and 47% consider China an enemy of the U.S. The number of Americans who consider China an enemy of the U.S. has increased significantly, from 33% 2020 to 47% in 2023.
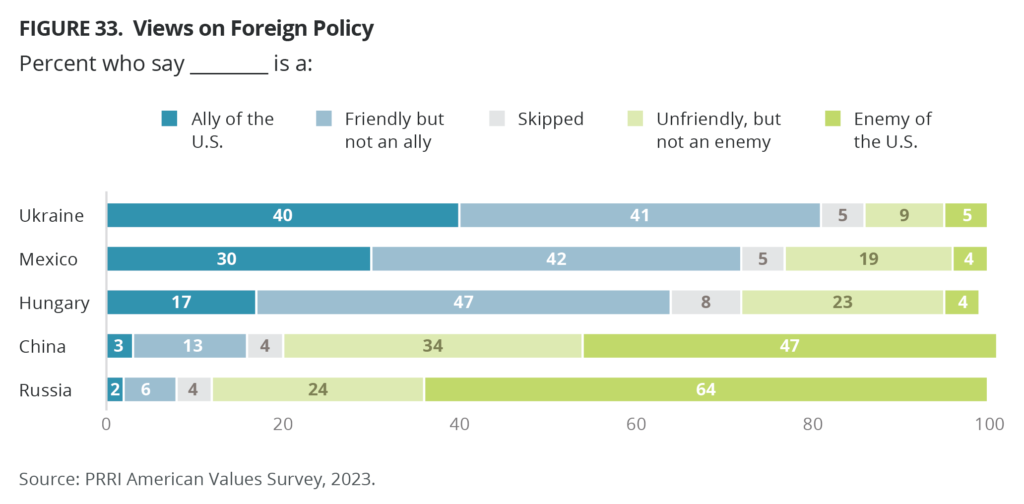
[1] Although support for Biden and Trump appears to shift in these two hypothetical matchup scenarios, these differences are within the margin of error for the subset of voters in each split sample (N=1,167; N=1,165) and are not statistically significant. Moreover, the samples in the split-form categories are similar with respect to the makeup of Republicans, Democrats, and independents.
[2] The number of cases for Hispanic voters is 93. Results need to be interpreted with caution.
[3] Because these questions were asked to half samples, the number for all other religious groups are too small to report, in addition to AAPI, and the Silent Generation. The sample size for Black Protestants on this question is 90 and should be interpreted with caution.
[4] Because these questions were asked to half samples, the number for all other religious groups are too small to report, in addition to AAPI, and the Silent Generation. The sample size for Black Protestants on this question is 94 and should be interpreted with caution.
[5] Because this question was asked to half sample, the number for all other religious groups are too small to report, in addition to AAPI.
[6] Because this question was asked to half sample, the number for all other religious groups are too small to report, in addition to AAPI.
Recommended Citation
“Threats to American Democracy Ahead of an Unprecedented Presidential Election.” PRRI (October 25, 2023).
Survey Methodology
The survey was designed and conducted by PRRI. The survey was made possible through the generous support of the Carnegie Corporation of New York, with additional support from the Ford Foundation, the Unitarian Universalist Veatch Program at Shelter Rock, and the Open Society Foundations. The survey was conducted among a representative sample of 2,525 adults (age 18 and up) living in all 50 states and the District of Columbia in the United States who are part of Ipsos’s Knowledge Panel. Interviews were conducted online between August 25 – 30, 2023
Respondents are recruited to the KnowledgePanel using an addressed-based sampling methodology from the Delivery Sequence File of the USPS – a database with full coverage of all delivery addresses in the United States. As such, it covers all households regardless of their phone status, providing a representative online sample. Unlike opt-in panels, households are not permitted to “self-select” into the panel, and are generally limited to how many surveys they can take within a given time period.
The initial sample drawn from the KnowledgePanel was adjusted using pre-stratification weights so that it approximates the adult U.S. population defined by the March 2022 supplement of the Current Population Survey. Next, a probability proportional to size (PPS) sampling scheme was used to select a representative sample.
To reduce the effects of any non-response bias, a post-stratification adjustment was applied based on demographic distributions from the March 2022 supplement of the Current Population Survey, except language proficiency, which is not available from CPS and came from the 2021 American Community Survey (ACS). Additionally, the 2020 vote choice benchmarks were obtained from the Federal Election Commission’s Official 2020 Presidential General Election Results. The post-stratification weight rebalanced the sample based on the following benchmarks: gender by age, race and ethnicity, Census region by metropolitan status, education, income, language proficiency, and 2020 presidential vote choice. The sample weighting was accomplished using an iterative proportional fitting (IFP) process that simultaneously balances the distributions of all variables.
The margin of error for the survey is +/- 2.19 percentage points at the 95% level of confidence, including the design effect for the survey of 1.26. In addition to sampling error, surveys may also be subject to error or bias due to question wording, context, and order effects. Additional details about the KnowledgePanel can be found on the Ipsos website: https://www.ipsos.com/en-us/solution/knowledgepanel