Young Adults Less Certain About Voting in 2016
Compared to 2012, fewer Americans report they are absolutely certain to vote in the upcoming election (71% in 2012 vs. 59% in 2016).
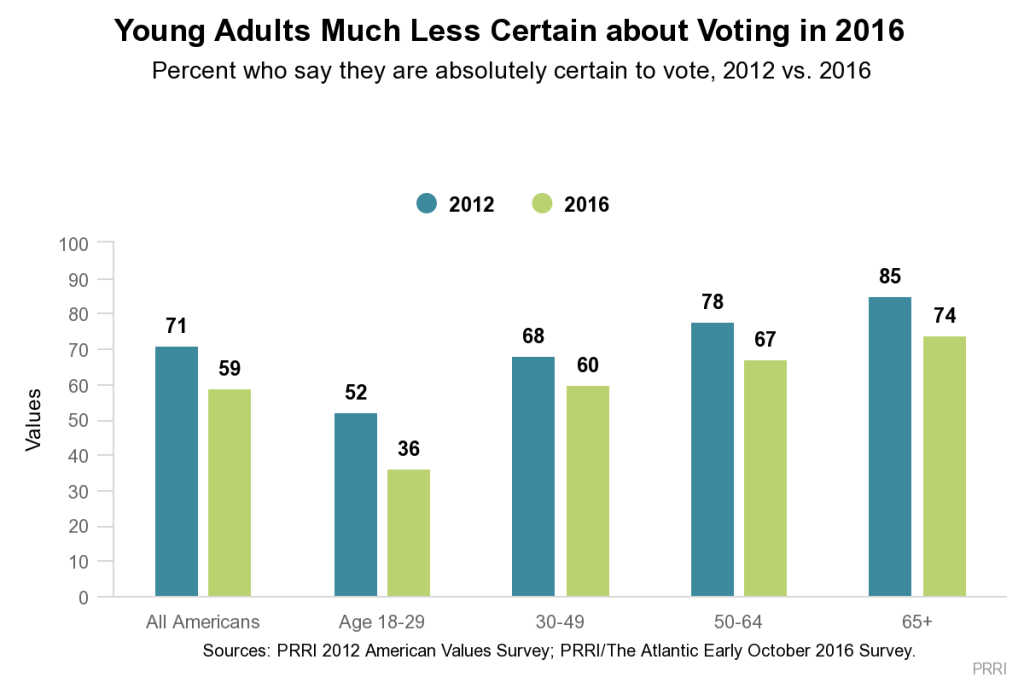 Young adults (age 18 to 29)—a group with which Clinton holds an advantage—are particularly less likely to say they are certain to vote in the upcoming election compared to 2012. Currently, only 36% of young adults say they are absolutely certain they will be casting a ballot in the 2016 election. In 2012, more than half (52%) of young adults said they were certain to vote.
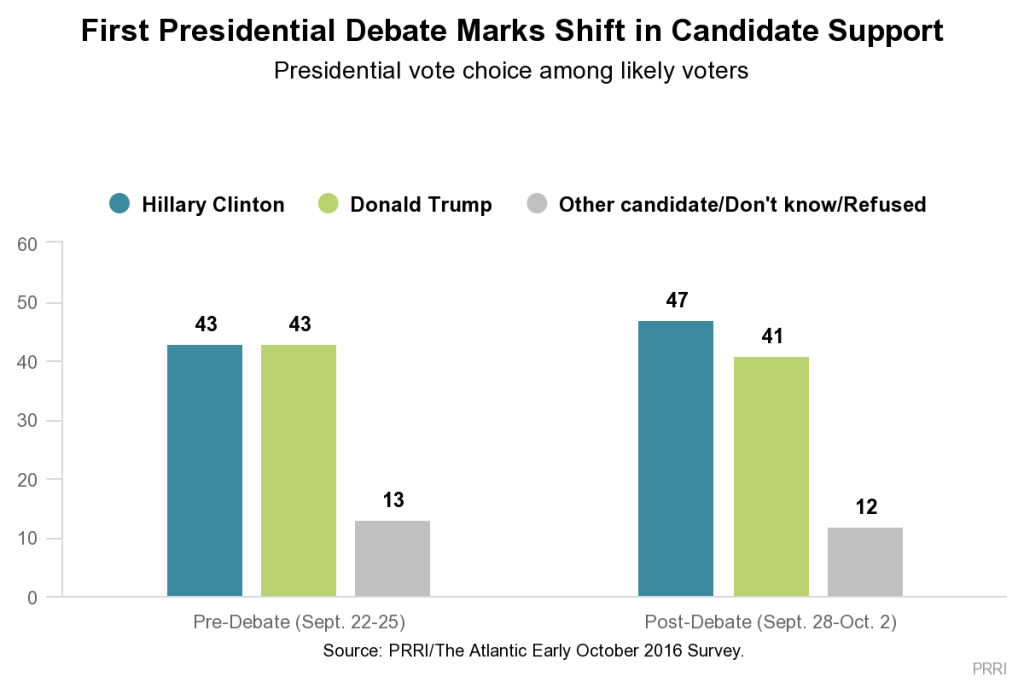
2016 Vote Preference
Hillary Clinton has expanded her support among likely voters compared to the previous week. Currently, 47% of likely voters say they are supporting or leaning toward supporting Clinton, compared to 41% who report they are supporting Donald Trump.1 One week earlier, before the first presidential debate, Clinton and Trump were tied among likely voters (43% vs. 43%, respectively).
Trump leads Clinton by 10 percentage points among white voters (49% vs. 39%, respectively) while non-white voters prefer Clinton by nearly 60 percentage points (75% vs. 16%, respectively). There are large divisions among whites by social class. White working-class voters strongly support Trump over Clinton (56% vs. 32%, respectively), while white college-educated voters are supporting Clinton over Trump (49% vs. 39%, respectively).
 Consistent with past presidential contests, white Christian voters favor the current Republican nominee over his Democratic opponent by a nearly 2 to 1 margin: 59% vs. 30%, respectively. In contrast, non-white Christian voters are supporting Clinton over Trump by an even wider margin: 74% vs. 18%, respectively. Looking at specific religious groups, nearly seven in ten (69%) white evangelical Protestant voters favor Trump, while fewer than one in five (19%) say they are supporting Clinton. A majority (56%) of white Catholic voters also prefer Trump, while only about one-third (31%) are supporting Clinton. However, Catholic voters overall are more divided (49% Trump vs. 42% Clinton). Religiously unaffiliated voters prefer Clinton to Trump by a substantial margin (65% vs. 24%, respectively).
Republicans and Democrats appear to be equally likely to support their party’s nominee. Nine in ten (90%) Democratic voters say they are supporting Clinton and roughly as many (86%) Republican voters say they are supporting Trump in November. Independent voters prefer Trump to Clinton by a substantial margin (44% vs. 36%, respectively). However, one in five independent voters report they would be supporting a third party candidate (16%) or expressed no preference in their vote choice (4%).
There is a substantial gender gap in voter preference this year. Overall, female voters prefer Clinton over Trump by 25 percentage points (58% vs. 33%, respectively). Among male voters, by contrast, Trump leads Clinton by 13 percentage points (49% vs. 36%, respectively). There is also a sizable gap in the vote preferences of white men and white women. White female voters prefer Clinton over Trump (52% vs. 41%, respectively), while Trump leads Clinton among white male voters (57% vs. 26%, respectively).
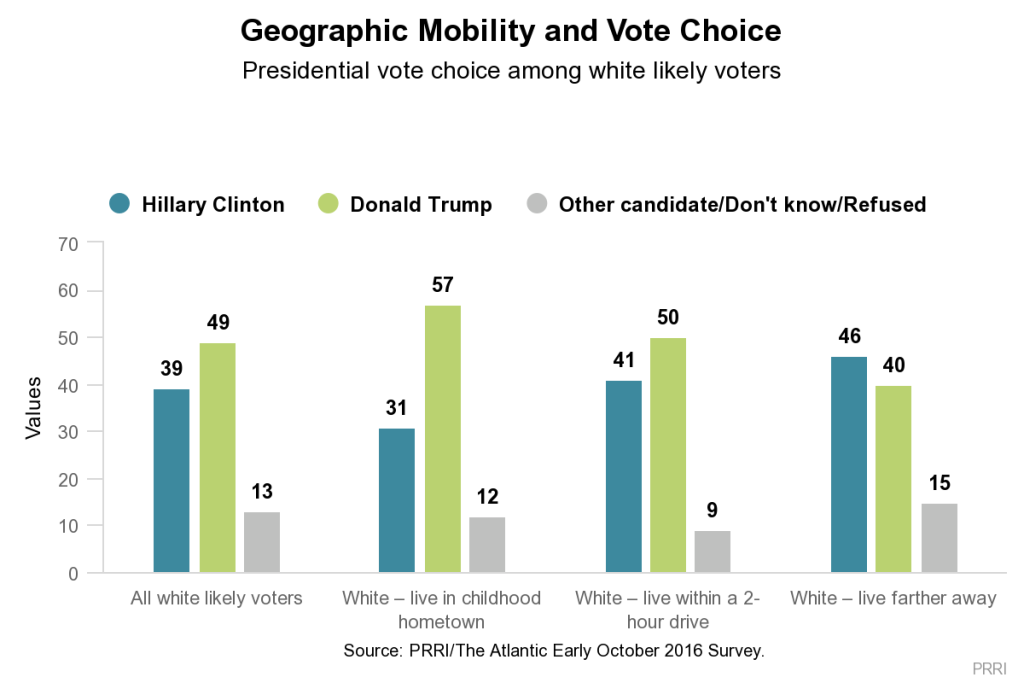
Geographic Mobility and Vote Choice
Geographic mobility strongly influences the candidate preferences of white voters. White voters who still live in the community in which they were raised are supporting Trump over Clinton by 26 percentage points (57% vs. 31%, respectively). Trump also has an advantage over Clinton among white voters who live within a 2-hour drive from their hometown (50% vs. 41%, respectively). However, among white voters who live farther away from their hometown, Clinton leads Trump (46% vs. 40%, respectively).
 Overall, more than one-third (35%) of white Americans report still living in the town or city in which they were born, and another 27% of white Americans say they live within a two-hour drive from their hometown. Approximately four in ten (37%) report living more than two hours away from the town in which they were raised.
There are pronounced differences in education levels between whites who live in their hometown and those who live farther than a 2-hour drive away. A majority (53%) of whites living in their hometown have a high school education or less, compared to only 29% of those living farther away.
Endnotes
1 Likely voters are defined as Americans who are currently registered to vote who report that they are “absolutely certain” to vote in the presidential election this year. All references to “voters” are “likely voters” in this analysis.
Recommended Citation
Jones, Robert P., and Daniel Cox. “Still Live Near Your Hometown? If You’re White, You’re More Likely to Support Trump | PRRI/The Atlantic Survey.” PRRI. 2016. http://www.prri.org/research/prri-atlantic-oct-6-poll-politics-election-clinton-trump/.
Topline and methodology for Sept. 22-25, 2016 survey as referenced in this survey’s topline.