Executive Summary
 Direction of Country
Pessimism about the direction of the country is considerably higher today (74%) than it was at this time during the 2012 presidential race, when 57% of the public said the country was off on the wrong track.
- Americans are more likely to say that things veered off track some time ago than to believe it occurred in the last few years (44% vs. 30%).
- A majority (53%) of Americans approve of how President Barack Obama is handling his job as president, up from a 38% job approval rating just before the 2014 midterm elections.
Americans are divided about whether American culture and way of life have changed for worse (51%) or better (48%) since the 1950s.
- About seven in ten likely voters supporting Donald Trump (72%) say American society and way of life has changed for the worse since the 1950s, while seven in ten likely voters supporting Hillary Clinton (70%) say things have changed for the better.
- A majority (56%) of white Americans say American society has changed for the worse since the 1950s, while roughly six in ten black (62%) and Hispanic (57%) Americans say American society has changed for the better.
- Class differences among whites are pronounced. A majority (56%) of white college-educated Americans say American society is generally better now than it was in the 1950s, while nearly two-thirds (65%) of white working-class Americans say things are now worse.
- No group has a dimmer view of American cultural change than white evangelical Protestants: nearly three-quarters (74%) say American culture has changed for the worse since the 1950s.
Leadership: Authoritarianism, Political Correctness, and Gender
Americans are closely divided over the question of authoritarian leadership. Forty-six percent of Americans agree with the statement, “Because things have gotten so far off track in this country, we need a leader who is willing to break some rules if that’s what it takes to set things right,” compared to 52% who disagree. A majority (55%) of Republicans agree we need such a leader, while a majority (57%) of Democrats disagree.
Nearly six in ten (57%) Americans say it is important to speak frankly about sensitive issues and problems facing the country even if certain people are offended. About four in ten (39%) say it is important to avoid using language that is hurtful and offensive to some people when discussing sensitive issues. Nearly seven in ten (68%) Republicans say it is important to speak openly about problems facing the country even if some people are offended, while only about four in ten (41%) Democrats agree.
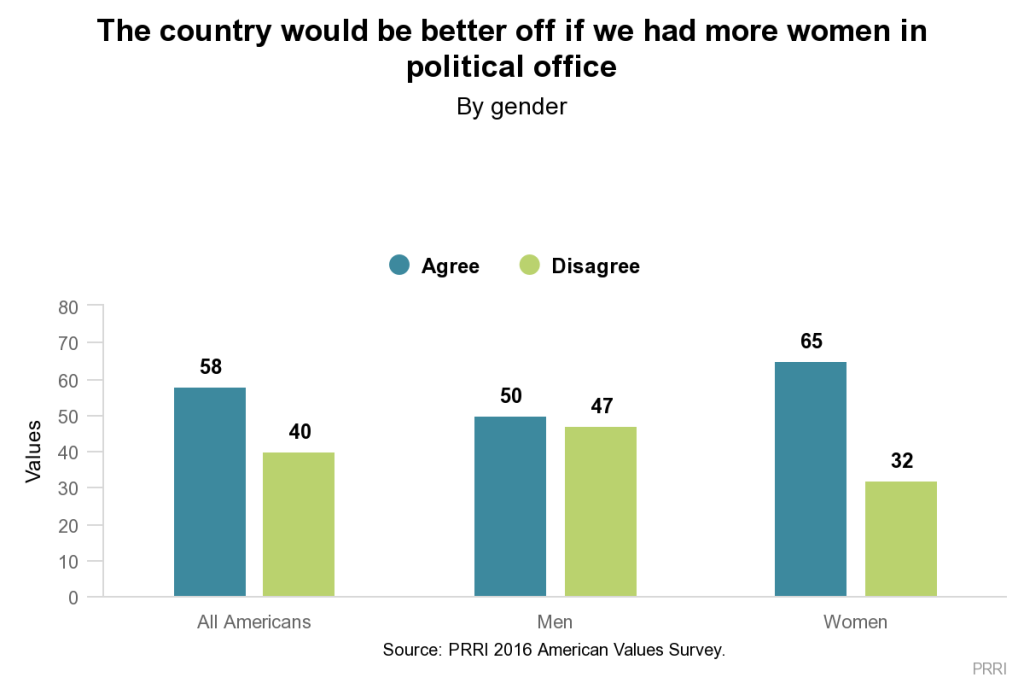
Most (58%) Americans believe the country would be better off if there were more women serving in public office. More than three-quarters (77%) of Democrats say the U.S. would benefit from more women serving in political leadership roles. Fewer than four in ten (37%) Republicans—including only 42% of Republican women—believe the country would be better off with more women holding public office. More than six in ten (62%) Republicans disagree.
There is broader consensus among the public about the achievement double standard women face in employment. Two-thirds (67%) of all Americans, including 80% of women and 54% of men, agree women often have to be more qualified than men to be considered for the same job. Roughly one in three (32%) disagree.
The Candidates and Political Parties
More than six in ten (61%) Americans say neither political party represents their views anymore. Dissatisfaction with America’s two major parties has risen significantly since 1990, when fewer than half (48%) of Americans believed neither political party represented their views.
Both Hillary Clinton and Donald Trump continue to have historically low favorability ratings with fewer than half of the public viewing each candidate positively (41% vs. 33%, respectively). Clinton is viewed less favorably than the Democratic Party (49%), but Trump’s low favorability rating is more consistent with the Republican Party’s low favorability (36%).
The public is more likely to attribute a number of positive qualities to Clinton than to Trump. The public is divided over which presidential candidate is more honest and trustworthy (45% Clinton, 44% Trump) and over who is a stronger and more decisive leader (47% Clinton, 47% Trump). But on every other attribute, Clinton has a substantial advantage over Trump, including having “the right temperament and personality” (61% Clinton, 33% Trump) and having “the right background and experience” (64% Clinton, 31% Trump).
Confidence in the Electoral Process
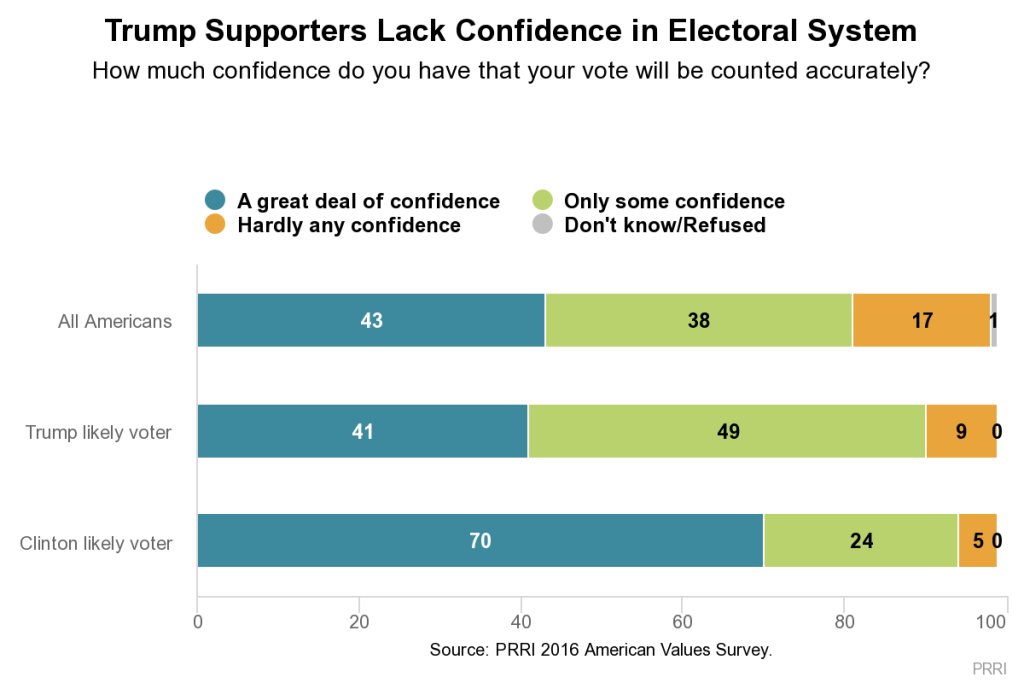
Fewer than half (43%) of the public say they have a great deal of confidence that their vote will be counted accurately. Roughly four in ten (38%) Americans report having only some confidence, while close to one in five (17%) say they have little confidence their vote will be accurately counted. There are stark differences among likely voters, with 70% of Clinton supporters—but only 41% of Trump supporters—reporting a great deal of confidence their votes will be counted accurately.
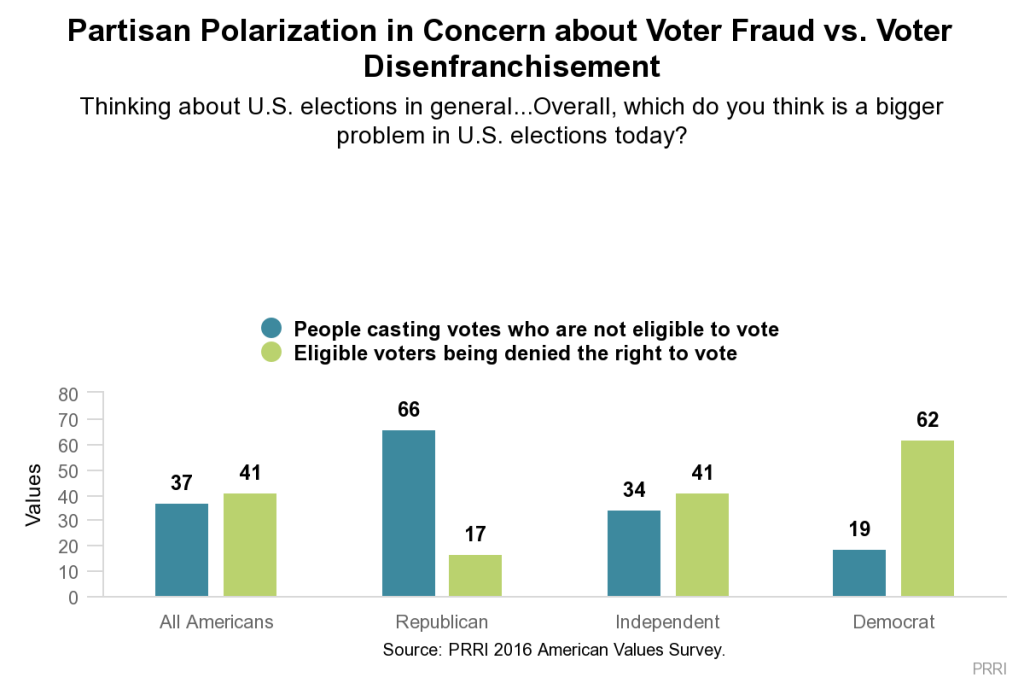 Americans are almost evenly divided over what constitutes the more significant problem with U.S. elections today: People casting votes who are not eligible (37%) or eligible voters being denied the right to vote (41%). Roughly one in ten (9%) Americans volunteer that voter apathy is the most significant problem.
- Roughly two-thirds (66%) of Republicans believe voter fraud is a bigger problem than voter disenfranchisement, compared to only 19% of Democrats. More than six in ten (62%) Democrats say eligible voters being denied access is the bigger problem facing the election system.
A majority (57%) of Americans agree politics and elections are controlled by people with money and by big corporations so it doesn’t matter if they vote, compared to roughly four in ten (42%) who disagree.
Partisan Segregation in Social Circles and Congregations
In 2016, Americans’ social networks are strongly segregated by party loyalties. Three-quarters of black Americans (75%) and a majority of Hispanic Americans (56%) report having no close friend or family member who is supporting Trump, compared to only 24% of white Americans. Nearly half (46%) of white working-class Americans report that they do not have a single person among their immediate family and friends who is supporting Clinton, while only 22% of white college-educated Americans say the same.
There is also evidence that American churches are highly segregated by party. More than eight in ten (83%) Trump supporters who attend religious services at least weekly estimate that most of their fellow church members are supporting Trump. Similarly, more than three-quarters (78%) of Clinton supporters who attend religious services at least weekly estimate that most of their fellow church members are supporting Clinton.
Campaign Issues
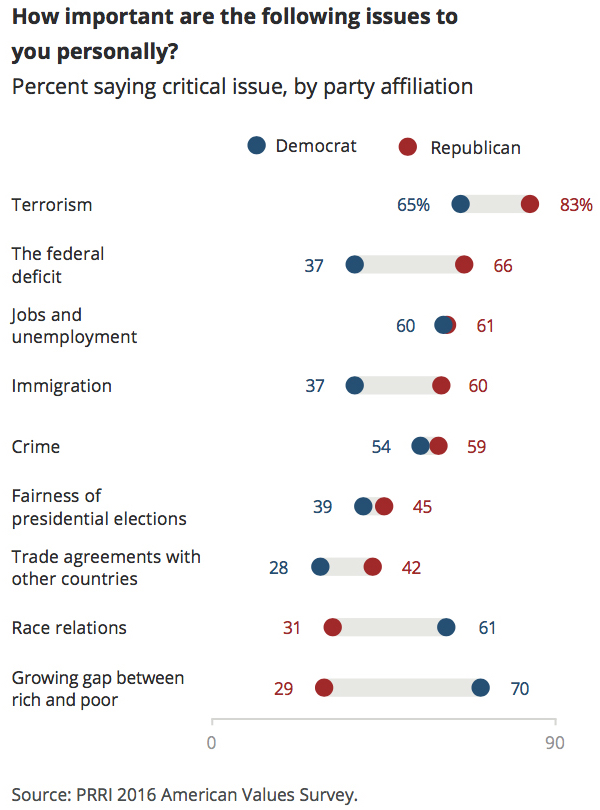
No issue is viewed by more Americans as important today than terrorism, with seven in ten (70%) Americans, including 83% of Republicans and 65% of Democrats, saying it is a critical issue to them personally. In fact, a majority (53%) of Americans report they are at least somewhat worried that they or someone in their family will be a victim of terrorism. There are major partisan divides on other issue priorities.
- Republicans are significantly more likely than Democrats to say the federal deficit (66% vs. 37%, respectively) and immigration (60% vs. 37%, respectively) are critical issues. By contrast, Democrats are more likely than Republicans to say the growing gap between rich and poor (70% vs. 29%, respectively) and race relations (61% vs. 31%, respectively) are critical to them personally.
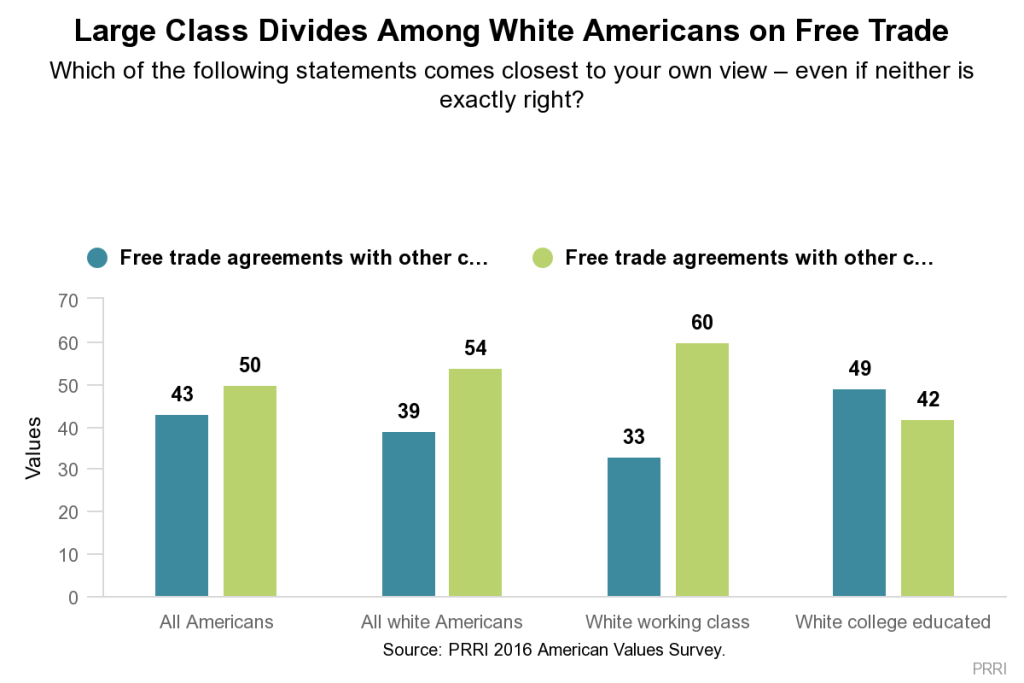
Americans are closely divided about the benefits of free trade. Forty-three percent of the public say free trade agreements are mostly helpful because they open markets to U.S. companies and allow Americans to buy goods more cheaply. Half (50%) of Americans take the opposite view: free trade agreements are mostly harmful because they send jobs overseas and drive down wages in the U.S.
- Nearly two-thirds (64%) of Republicans, compared to only 40% of Democrats, believe free trade is generally harmful.
Nearly six in ten (57%) Americans say the decline in American manufacturing jobs was caused by government policies and poorly negotiated trade deals, while only 37% blame globalization and technological advances.
- A majority of Republicans (71%) and independents (57%) say manufacturing declines in the country are primarily the result of bad deals and policies. Democrats are about equally as likely to blame government decision-making (46%) as they are to blame globalization and technological advances (48%).
The public is split over whether the U.S., as a member of NATO, should use military force to defend any member country when it is attacked or whether the U.S. should only use military force if its immediate security is threatened (49% vs. 45%, respectively).
- There are no significant partisan differences in views about NATO.
Americans are divided over the cultural contributions immigrants make to American society. Close to half (46%) of Americans say the growing number of newcomers from other countries threatens traditional American customs and values, while 44% say these immigrants strengthen our society.
- Nearly three-quarters (73%) of Republicans report the growing number of newcomers threatens American customs and values, while only 29% of Democrats say the same. More than six in ten (63%) Democrats say immigrants strengthen American society.
Roughly four in ten (41%) Americans favor building a wall along the U.S.-Mexico border, while nearly six in ten (58%) are opposed. Support for this policy has remained unchanged since May 2016.
- Roughly three-quarters (73%) of Republicans favor this policy compared to fewer than four in ten (38%) independents and only about one in five (19%) Democrats.
Most (56%) Americans reject a policy of temporarily banning Muslims from other countries coming to the U.S., although a sizeable minority (43%) express support for the policy.
- Seven in ten (70%) Republicans favor a policy of temporarily banning Muslims from other countries from entering the U.S., compared to only 23% of Democrats.
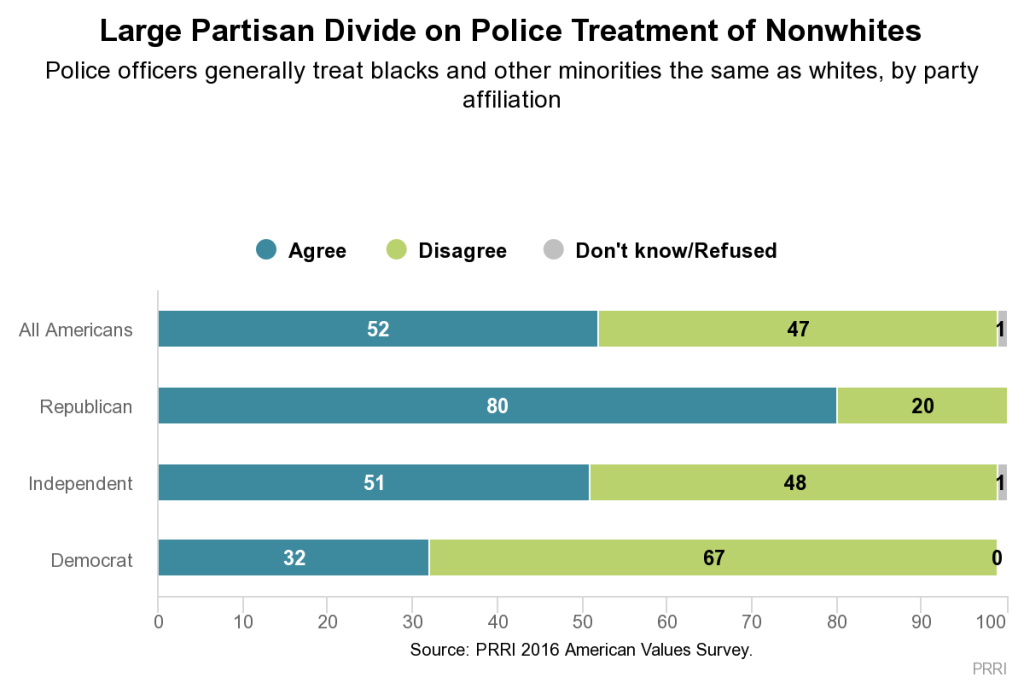
A majority (52%) of Americans agree that police officers generally treat nonwhite and white Americans the same, while 47% disagree. This represents an 11-point increase from 2015, when only 41% of the public said police officers treat nonwhite and white people the same.
- Roughly eight in ten (79%) black Americans and more than six in ten (62%) Hispanic Americans reject the idea that police officers treat everyone the same. In stark contrast, nearly two-thirds (64%) of white Americans, including strong majorities of white working-class (66%) and white college-educated Americans (59%), agree that police officers are generally evenhanded in their treatment of nonwhite and white Americans.
- Fully eight in ten (80%) Republicans, but only about one-third (32%) of Democrats, agree police officers generally treat blacks, other minorities, and whites the same.
Nearly three-quarters (74%) of Americans agree that people who have been convicted of felonies should be allowed to vote after they complete their sentences. Roughly one-quarter (26%) disagree. Support for restoring voting rights for felons after they serve their sentence is high across all segments of American society.
- Majorities of Democrats (83%), independents (73%), and Republicans (62%) agree with this policy, as do strong majorities of blacks (85%), Hispanics (78%), and whites (71%).
I. The State of the Nation
Direction of the Country
Americans are overwhelmingly pessimistic about the direction of the country. Nearly three-quarters (74%) of Americans say things in this country have gotten seriously off on the wrong track, compared to just one-quarter (25%) who say things are generally going in the right direction. More than nine in ten (92%) Republicans say America is headed down the wrong track, a view shared by about eight in ten (79%) independents and close to six in ten (57%) Democrats. Pessimism about the direction of the country is considerably higher today than it was at this time during the 2012 presidential race, when 57% of the public said the country was off on the wrong track.1
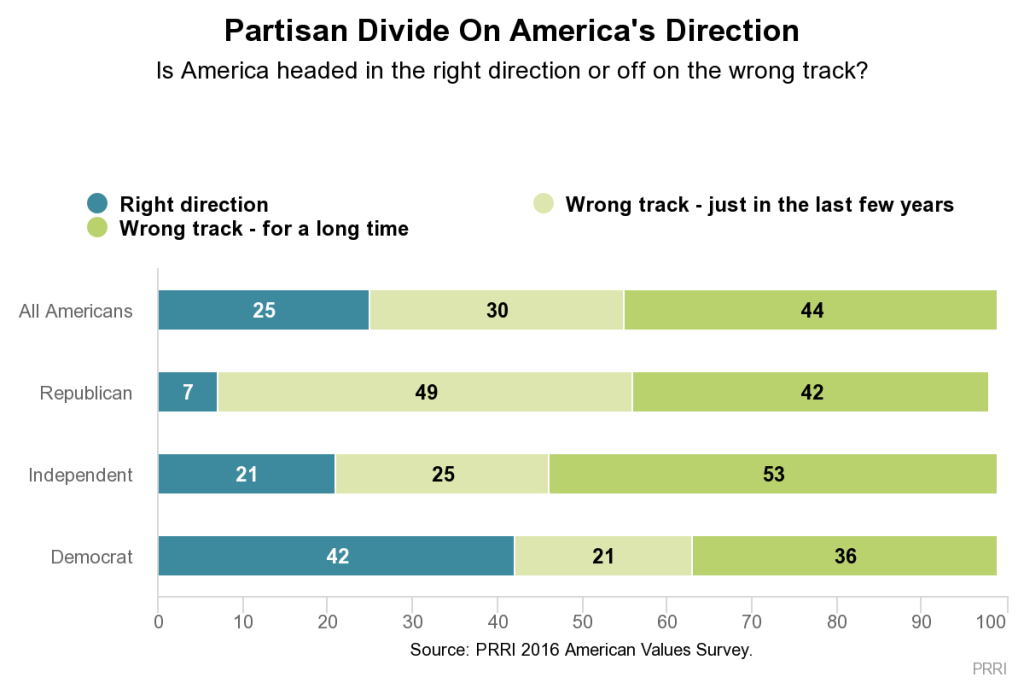 However, Americans are much more likely to say things got off track a long time ago (44%) than in the last few years (30%). There are substantial partisan differences about when the country veered off track. Republicans are roughly divided about whether the country got off on the wrong track a long time ago (42%) or just in the last few years (49%). Democrats are more likely to say the country took a wrong turn a long time ago (36%) than more recently (21%). Independents are more than twice as likely to say the country took a wrong turn a long time ago (53%) than in the last few years (25%).
*Note: Full question text is: “Do you think things in this country are generally going in the right direction or do you feel things have gotten pretty seriously o on the wrong track? And do you think things have gotten o track in just the last few years or do you think things have been o track for a long time?” One percent of respondents who said “wrong track” did not provide a time estimate. They are not shown in chart above.
Critical Issues
No issue is viewed by more Americans as important today than terrorism, with seven in ten (70%) saying it is a critical issue to them personally. About six in ten (61%) say jobs and unemployment is a critical concern, while majorities also cite crime (54%) and the growing gap between rich and poor (52%) as critical issues. Nearly half of Americans view the federal deficit (49%) and race relations (47%) as issues of critical importance, and roughly four in ten say the same about the issues of immigration (44%) and the fairness of presidential elections (41%). Only one-third (33%) of Americans say trade agreements with other countries are critically important to them.
 Issue priorities vary substantially by race and ethnicity. Nearly eight in ten (79%) black Americans say crime is a critical issue to them personally, a view shared by only about half of Hispanic (53%) and white Americans (50%). Blacks (73%) are also somewhat more likely than Hispanics (65%) and whites (57%) to view jobs and unemployment as a critical issue. Similarly, more than seven in ten (72%) blacks and a majority (54%) of Hispanics cite race relations as a critical concern, while only about four in ten (41%) whites say the same. And while two-thirds (67%) of blacks and a majority (53%) of Hispanics view the growing gap between rich and poor as critical, less than half (48%) of whites hold this view. Notably, Hispanics are the most likely to view immigration as critical (53%), a view shared by 45% of whites and fewer than four in ten (37%) blacks.
The issue concerns of white Americans are not monolithic, however. White working-class Americans are significantly more likely than white college-educated Americans to say a range of issues are personally critical to them. For example, white working-class Americans are more likely than white college-educated Americans to cite terrorism (76% vs. 62%, respectively), crime (59% vs. 38%, respectively), immigration (51% vs. 39%, respectively), the fairness of presidential elections (44% vs. 28%), and trade agreements with other countries (39% vs. 25%, respectively) as critical issues.
Unsurprisingly, the issue priorities of partisans also differ markedly. Republicans are significantly more likely than Democrats to say terrorism (83% vs. 65%, respectively), the federal deficit (66% vs. 37%, respectively), immigration (60% vs. 37%, respectively), and trade agreements with other countries (42% vs. 28%, respectively) are critical issues. In contrast, Democrats are more likely than Republicans to list the growing gap between rich and poor (70% vs. 29%, respectively) and race relations (61% vs. 31%, respectively) as critical to them personally.
Concerns about Personal Safety and Security
Americans report a number of concerns about their personal safety and security. More than six in ten Americans say they are at least somewhat worried they or someone in their family will be a victim of violent crime (61%) or that someone in their household will become unemployed (61%). A majority (53%) of Americans report they are at least somewhat worried they or someone in their family will be a victim of terrorism. And more than one-third (36%) say they are at least somewhat worried about the Zika virus.
Fears about personal safety and security cut across the political divide, with Republicans, independents, and Democrats all about as likely to express concerns on these issues.
Is the U.S. Too Politically Correct?
Most of the country generally rejects the idea that greater sensitivity is required when discussing controversial subjects. Nearly six in ten (57%) Americans say it is important to speak frankly about sensitive issues and problems facing the country even if certain people are offended. About four in ten (39%) say it is important to avoid using language that is hurtful and offensive to some people when discussing sensitive issues.
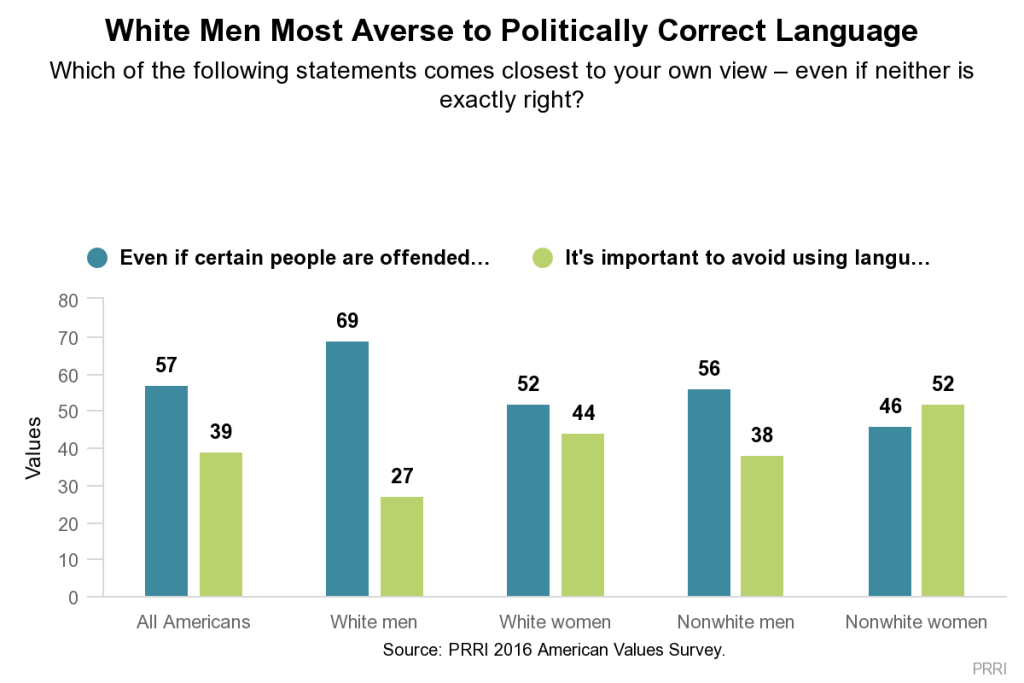 Compared to black and Hispanic Americans, white Americans are less likely to say it is important to avoid using language others may find offensive when discussing sensitive issues. Six in ten (60%) whites—including 69% of white men and 52% of white women— believe it is important to speak frankly about sensitive subjects even if some are offended; only 35% of whites say it is important to avoid using hurtful language.
Nonwhite Americans are much more divided on this question. While about half of black (50%) and Hispanic (51%) Americans agree it is important to speak frankly, even if some people are offended, 46% of both blacks and Hispanics say it is important to avoid using hurtful language when discussing sensitive issues.
Attitudes on the importance of being sensitive to the views of others when discussing delicate subjects differ markedly among partisans. Nearly seven in ten (68%) Republicans say it is important to speak openly about problems facing the country even if some people are offended, while only about four in ten (41%) Democrats agree. A majority (55%) of Democrats say it is important to avoid hurtful language that could offend others when discussing sensitive topics.
The Current Political Climate
Obama Job Approval
A majority (53%) of Americans approve of how President Barack Obama is handling his job as president, up from a 38% job approval rating just before the 2014 mid-term elections.2
Views of Obama’s job performance are highly polarized by race and ethnicity. Nearly nine in ten (88%) black Americans say they approve of the way Obama has handled his job as president, as do nearly seven in ten (69%) Hispanic Americans. In contrast, only about four in ten (42%) white Americans approve of Obama’s performance as president, while a majority (57%) disapprove.
Among white Americans, class differences in attitudes about Obama’s performance are considerable. Nearly two-thirds (64%) of white working-class Americans disapprove of Obama’s job performance, compared to only 35% who approve. By contrast, a majority (54%) of white college-educated Americans approve of how President Obama has performed as president, while 45% disapprove.
Nearly nine in ten (89%) Republicans disapprove of Obama’s presidential performance, while a nearly identical number (90%) of Democrats approve. Independents are closely divided: 51% approve, 48% disapprove.
Dissatisfaction with the Political System
The Need for an Authoritarian Leader
Americans are closely divided over the question of authoritarian leadership. Forty-six percent of Americans agree with the statement, “Because things have gotten so far off track in this country, we need a leader who is willing to break some rules if that’s what it takes to set things right,” compared to 52% who disagree.
There are only modest racial and ethnic differences in attitudes about the type of leadership the country needs. A slim majority (51%) of Hispanic Americans say America is in need of a leader who will break rules because things have gotten so off track, a view shared by 49% of black Americans and 45% of white Americans.
White Americans, however, are divided by class on this leadership question. A majority (55%) of white working-class Americans agree America needs a leader who would be willing to break rules to get things back on track, while 44% disagree. In sharp contrast, seven in ten (70%) white college-educated Americans disagree things are so off track in America that we need a rule-breaking leader to make things right, and only about three in ten (29%) agree with the statement.
Partisans also differ considerably in their preference for a leader who will break rules, with Republicans expressing the strongest support for such a leader. A majority (55%) of Republicans believe that because things are so off track in America, we need a leader willing to break some rules to set things right, while a nearly identical number of Democrats (57%) disagree. The views of independents closely mirror the views of Americans overall.
Frustration with the Parties and Elections
Most Americans do not feel well-represented by either of the major political parties. More than six in ten (61%) Americans say neither political party represents their views anymore, while fewer than four in ten (38%) disagree. Dissatisfaction with America’s two major parties has risen significantly since 1990, when fewer than half (48%) of Americans believed neither political party represented their views.
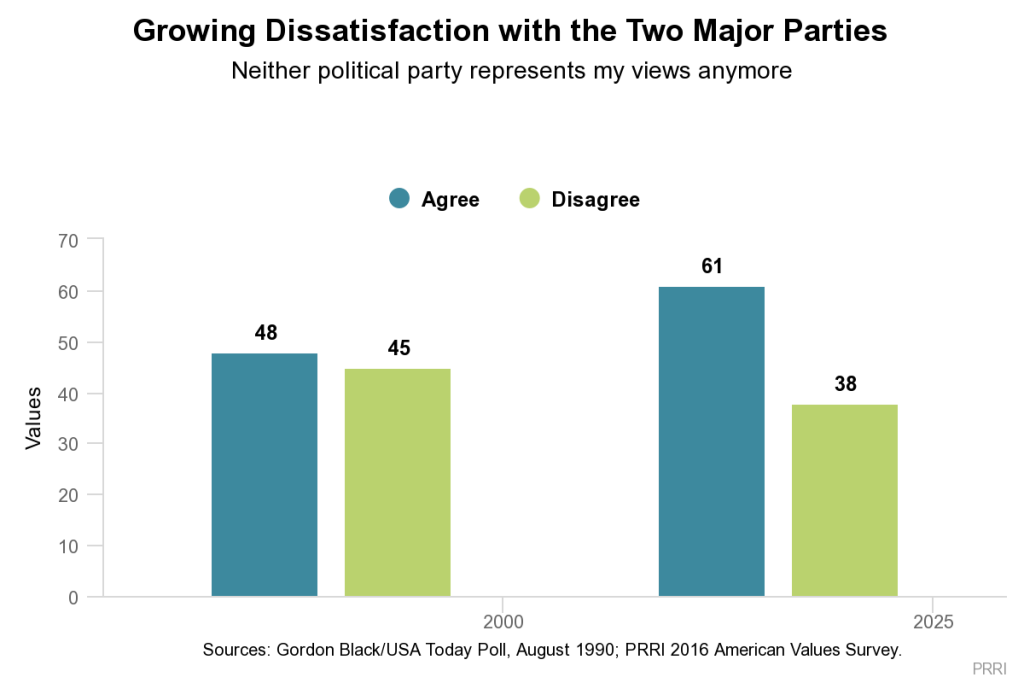 More than six in ten Hispanic (62%) and white Americans (61%) say their views are not reflected by either major political party, while a slim majority (52%) of black Americans say the same. Notably, white Americans’ level of dissatisfaction with the two parties does not differ by class.
Unsurprisingly, independents are more likely than Democrats and Republicans to say their views are not reflected by the two parties, though large numbers of partisans from both sides of the aisle also express this opinion. Nearly eight in ten (77%) political independents and a majority (54%) of Republicans believe neither major political party represents their views today. Fewer than half (46%) of Democrats agree, while a majority (52%) of Democrats disagree with this statement.
America’s Best President
No one president stands out as the singular favorite among Democratic and Democratic-leaning Americans.3 More than one-third (35%) of Democrats cite President Barack Obama as their favorite president, while about one in five name John F. Kennedy (21%) or Bill Clinton (20%) and another 15% name Franklin Delano Roosevelt. Only five percent of Democrats say Jimmy Carter is their favorite president, and one percent each select Lyndon Johnson or Harry Truman.
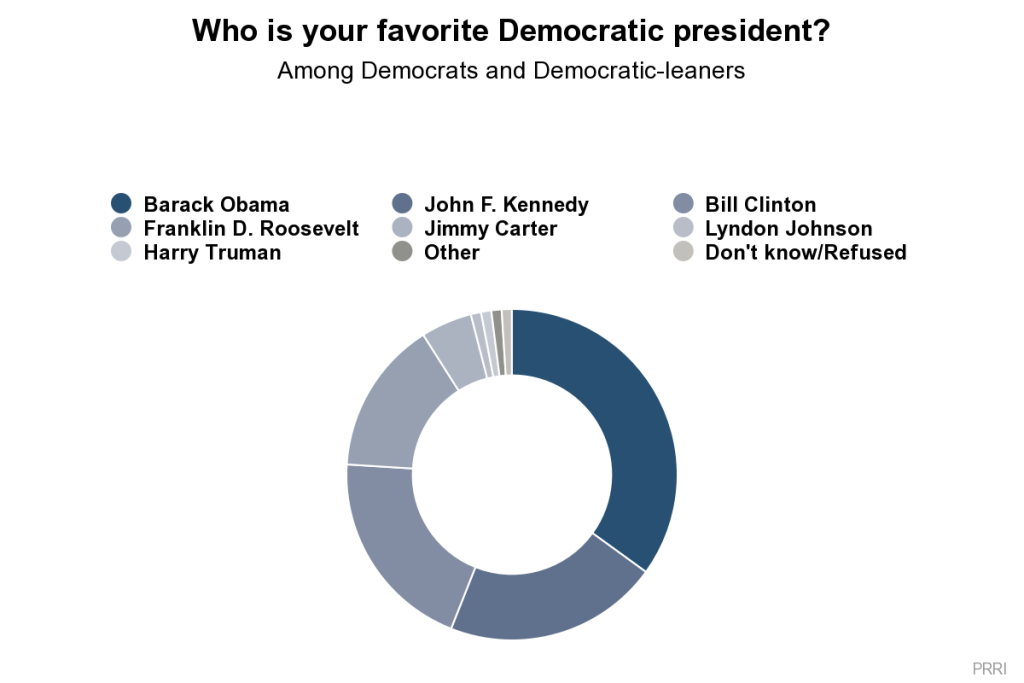 President Obama is especially popular with black and Hispanic Democrats. A majority (57%) of black Democrats and a plurality (41%) of Hispanic Democrats say Obama is their favorite Democratic president. White Democrats, in contrast, are roughly evenly divided in support for Obama (24%), Kennedy (23%), Roosevelt (22%), and Clinton (19%).
President Obama also wins out among young Democrats. Close to half (44%) of Democratic young adults (age 18-29) list Obama as their favorite Democratic president, with Kennedy (19%), Roosevelt (16%), and Clinton (14%) finishing far behind. By contrast, Democratic seniors (age 65 and older) are largely divided among Kennedy (26%), Roosevelt (23%), and Obama (19%).
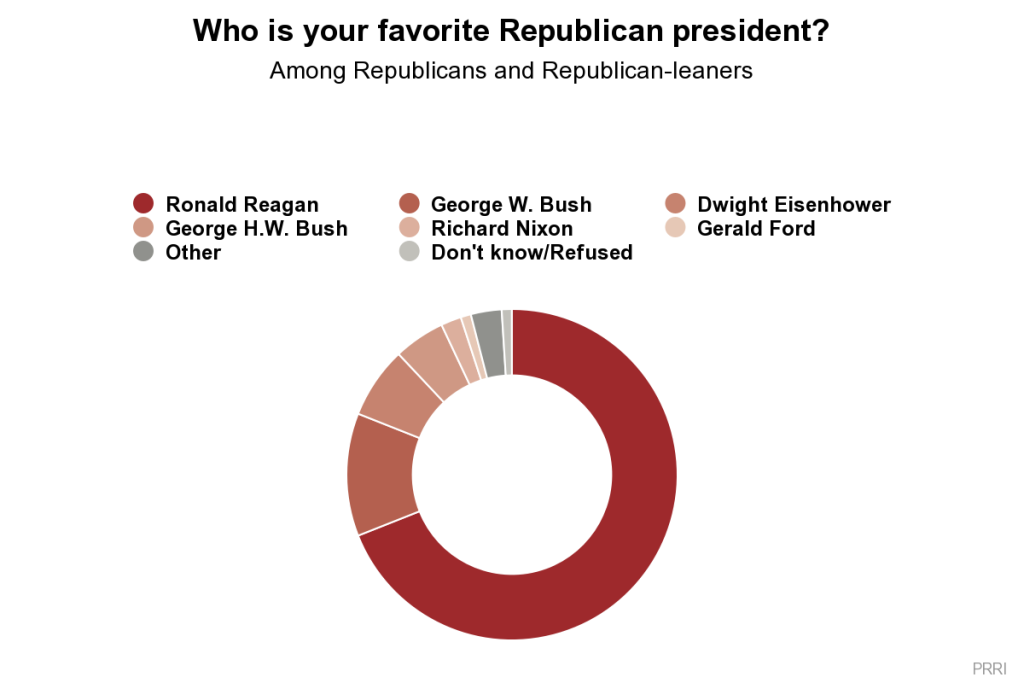 On the Republican side, Ronald Reagan is far and away the most popular president. Nearly seven in ten (69%) Republicans and Republican leaners say Reagan is their favorite president, while George W. Bush (12%) finishes in a distant second. Seven percent of Republicans name Dwight Eisenhower as their favorite Republican president, five percent select George H.W. Bush, two percent select Richard Nixon, and just one percent select Gerald Ford.
Reagan is the overwhelming favorite among every major demographic group of Republicans. Notably, Republican young adults are the only demographic group in which a majority do not select Reagan: 45% of Republican young adults cite Reagan as their favorite Republican president, followed by George W. Bush at 28%.
II. The 2016 Election
Views of the Candidates
Both Hillary Clinton and Donald Trump fare poorly in the eyes of the public, but Clinton continues to retain a modest advantage over her opponent. Roughly four in ten (41%) Americans have a favorable view of Clinton, while 57% view her unfavorably. Only one-third (33%) of Americans view Trump favorably, while nearly two-thirds (65%) express a negative opinion of him. Neither candidates’ favorability ratings have changed significantly since they captured their respective party’s nominations.
Notably, Clinton is viewed less favorably by the public than the last two Democratic presidents, each of whom have net positive favorability ratings. A majority (54%) of Americans have a favorable opinion of Barack Obama, while more than half (52%) of the public report a favorable view of former president Bill Clinton. The public’s views of the Democratic Party are more divided (49% favorable vs. 48% unfavorable).
Trump also is viewed far less favorably than George W. Bush (45% favorable vs. 53% unfavorable), the last Republican president, but his favorability ratings are comparable to the low favorability ratings of the Republican Party (36% favorable vs. 60% unfavorable).
Candidate Traits
While the public is roughly divided over whether being honest or trustworthy or whether being a strong and decisive leader best describes Clinton or Trump, across a range of other attributes, Americans are more likely to ascribe positive qualities to Clinton.
The public is divided over which presidential candidate is more honest and trustworthy (45% Clinton, 44% Trump) and over who is a stronger and more decisive leader (47% Clinton, 47% Trump).
Perceptions of the candidates’ honesty varies significantly by race, ethnicity, and class. A majority (53%) of white Americans say Trump is the more honest and trustworthy candidate, a view sharply at odds with black and Hispanic Americans, who say this better describes Clinton (71% and 59%, respectively). Nearly six in ten (59%) white working-class Americans believe Trump is the more honest and trustworthy candidate; white college-educated Americans are divided, with nearly equal numbers saying this attribute describes Clinton (45%) as it does Trump (43%).
Clinton has an advantage over Trump in being perceived as having strong religious beliefs (50% vs. 36%, respectively). Notably, white evangelical Protestants are much more likely to say having “strong religious beliefs” better describes Trump than Clinton (58% vs. 28%, respectively).
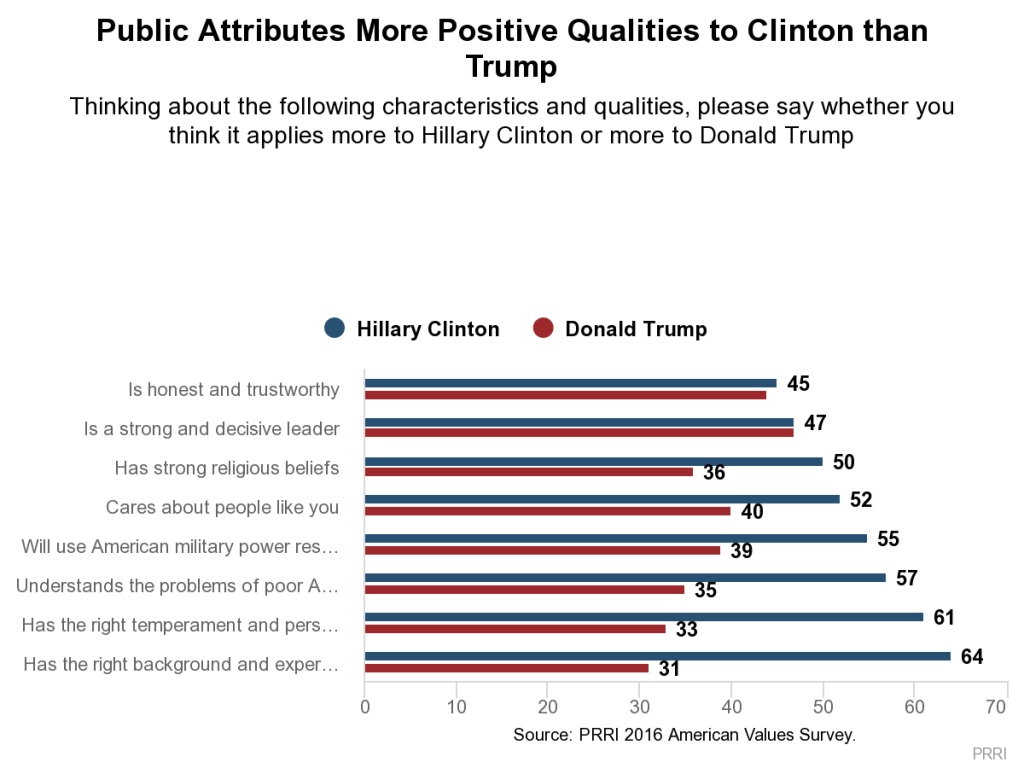 Americans are also more likely to perceive Clinton as being someone who “cares about people like you” than Trump (52% vs. 40%, respectively). A majority of black (76%) and Hispanic (68%) Americans believe Clinton is the candidate who cares more about people like them, while white Americans are divided by class. A majority (56%) of white working-class Americans say Trump cares more about people like them, while roughly as many white college-educated Americans (55%) say Clinton is the candidate who most cares about people like them.
The public overall is more likely to believe Clinton, rather than Trump, is likely to use American military power responsibly (55% vs. 39%, respectively). Clinton has a similarly-sized advantage over Trump in perceptions that she better understands the problems of poor Americans (57% vs. 35%, respectively). Finally, Americans are roughly twice as likely to say Clinton is better described as having the right background and experience (64% vs. Trump’s 31%) and having the right temperament and personality (61% vs. Trump’s 33%).
Understanding the Problems of People Like You
Few Americans believe either Clinton (35%) or Trump (25%) better understands the problems that people like them face. In fact, a plurality (39%) say neither candidate really understands the problems of people like them.
Perceptions of the candidates’ ability to understand average Americans’ problems vary widely by race and class. More than six in ten (63%) black Americans say Clinton is the candidate who better understands their problems, while just five percent say the same of Trump. Hispanics are also more likely to say Clinton, rather than Trump, has a better understanding of the problems they face (40% vs. 12%, respectively). White Americans are more divided. Twenty-eight percent of whites say Clinton better understands their concerns, while one-third (33%) say Trump has a better understanding. Nearly four in ten (38%) whites say neither candidate really understands the challenges they face.
There is a sizable class division among white Americans. White working-class Americans are more likely to believe Trump understands the challenges that people like them are facing (36% vs. Clinton’s 22%). White college-educated Americans are more likely to say Clinton, rather than Trump, has the better grasp of their problems (37% vs. 26%, respectively).
Single Most Important Trait this Election
By far the most important trait Americans believe a presidential candidate should possess is honesty. Nearly four in ten (39%) Americans name honesty is the single most important candidate quality. More than one in five (22%) say experience is the most important quality, while slightly fewer (16%) mention strength. Fewer than one in ten Americans say an “even temperament” (9%) or compassion (6%) is the most critical characteristic.
There are sharp divisions between partisans in views about the most important candidate attribute. A majority (54%) of Republicans say honesty is the most important quality for a presidential candidate to possess, while only about half as many (25%) Democrats agree. Republicans are also much more likely than Democrats to stress the importance of strength (28% vs. 10%, respectively). Conversely, Democrats are much more likely than Republicans to emphasize the importance of experience (35% vs. 7%, respectively) and an even temperament (15% vs. 3%, respectively). Relatively few Democrats (8%) and Republicans (3%) say compassion is a singularly important quality in a candidate.
Confidence in the Election System
Fewer than half (43%) of the public say they have a great deal of confidence that their vote will be counted accurately. Roughly four in ten (38%) Americans report having only some confidence, while close to one in five (17%) say they have little confidence their vote will be accurately counted.
Confidence in the voting system varies substantially by race and class. Close to half (46%) of white Americans have a great deal of confidence that their vote will be counted compared to roughly four in ten black (42%) and Hispanic Americans (38%). However, blacks are about twice as likely as whites (28% vs. 15%, respectively) to say they have hardly any confidence that their vote will be counted properly. Roughly one in five (22%) Hispanics say they have hardly any confidence. Class divisions are even more stark. Only about one-third (35%) of white working-class Americans report having a great deal of confidence in the voting system, while more than six in ten (61%) white college-educated Americans say the same.
Democrats are more likely than Republicans and independents to report a high degree of confidence in the voting system (55% vs. 44% and 35%, respectively). There are stark differences among likely voters, with 70% of Clinton supporters—but only 41% of Trump supporters—reporting a great deal of confidence their votes will be counted accurately.
Despite the fact that there is no evidence of widespread voter fraud, Americans are roughly evenly divided over what constitutes the more significant problem with U.S. elections today: people casting votes who are not eligible (37%) or eligible voters being denied the right to vote (41%). Roughly one in ten (9%) Americans volunteered that voter apathy is the most significant problem.
 The issue of voter fraud sharply divides the public along political lines. Roughly two-thirds (66%) of Republicans believe voter fraud is a bigger problem than voter disenfranchisement. More than six in ten (62%) Democrats say eligible voters being denied access is the bigger problem facing the election system, compared to only 19% who say voter fraud is the bigger problem. Independents reflect the views of the public overall.
Americans also express considerable frustration with the power of money and big corporations in politics. A majority (57%) of Americans agree politics and elections are controlled by people with money and by big corporations so it doesn’t matter if they vote, compared to roughly four in ten (42%) who disagree.
There is rough agreement among Americans across racial and ethnic divides. The political cynicism of white Americans does vary considerably by social class, however. Nearly two-thirds (64%) of white working-class Americans agree elections are controlled by those with money so it doesn’t matter if they vote, a view shared by only about four in ten (42%) white college-educated Americans. A majority (57%) of the white college educated reject this idea.
Independents express more cynical views of the political system than both Democrats and Republicans. Nearly two-thirds (65%) of independents say voting is ineffective because elections are controlled by big corporations and the wealthy, while slim majorities of Republicans (53%) and Democrats (51%) say the same. Nearly half of both Democrats (49%) and Republicans (47%) disagree.
Additionally, young adults (age 18-29) are significantly more jaded than seniors (age 65 and older) in their attitudes about the futility of voting. About two-thirds (66%) of young adults believe politics and elections are controlled by corporations and those with money so their vote does not matter, an opinion shared by fewer than half (49%) of seniors.
The 2016 Vote
At this stage in the campaign,4 Hillary Clinton leads Donald Trump among likely voters by a significant margin (49% vs. 41%, respectively).5 The motivations of likely Clinton and Trump voters varies. Nearly six in ten (57%) Trump voters report that their primary reason for supporting Trump is to oppose Clinton. Only 42% of Trump voters say their vote is primarily about supporting the Republican nominee. A slight majority (52%) of voters who support Clinton say their vote is mostly about opposing Trump; close to half (48%) of Clinton voters say their vote is about supporting Clinton.
Who is Motivated, and Who Will Win?
Feeling Motivated to Vote
Likely voters appear quite engaged in the campaign. More than eight in ten (85%) voters say they feel highly motivated to vote this year, while 15% say they do not feel that highly motivated.
Each candidate’s supporters report being about equally motivated to vote this year. More than eight in ten Donald Trump supporters (89%) and Hillary Clinton supporters (86%) say they are highly motivated to turn out.
There are only modest differences in motivations among voters by race and ethnicity. Nearly than nine in ten (88%) white voters, 82% of Hispanic voters, and 76% of black voters say they are highly motivated to vote.
Predicting the Winner
By a margin of nearly two to one, more Americans say Clinton is more likely than Trump to win the presidential election (63% vs. 34%, respectively). Partisans are much more likely to say their respective nominee will win the election, but Democrats are more confident in Clinton’s chances than Republicans are about the likelihood of a Trump victory (86% vs. 64%, respectively). Independents closely resemble Americans overall.
Partisan Segregation
In 2016, Americans’ social networks are strongly segregated by party loyalties. More than three in ten (31%) Americans say there is no one among their close friends and family who is supporting Hillary Clinton, while a similar proportion (36%) say no one among their close friends and family is supporting Donald Trump.
The degree of political segregation varies widely by race and ethnicity. Three-quarters of black Americans (75%) and a majority of Hispanic Americans (56%) report having no close friend or family member who is supporting Trump. In contrast, fewer than one in four (24%) white Americans say their social network does not include a Trump supporter. Whites are more likely to have a member of their immediate social circle who is supporting Trump than Clinton (75% vs. 60%, respectively). However, these patterns vary significantly by class. White college-educated Americans are much more likely than white working-class Americans to have a close friend or family member who is supporting Clinton (76% vs. 50%, respectively). White working-class Americans are more than twice as likely as white college-educated Americans to report that they do not have a single member of their immediate social network who is supporting Clinton (46% vs. 22%, respectively).
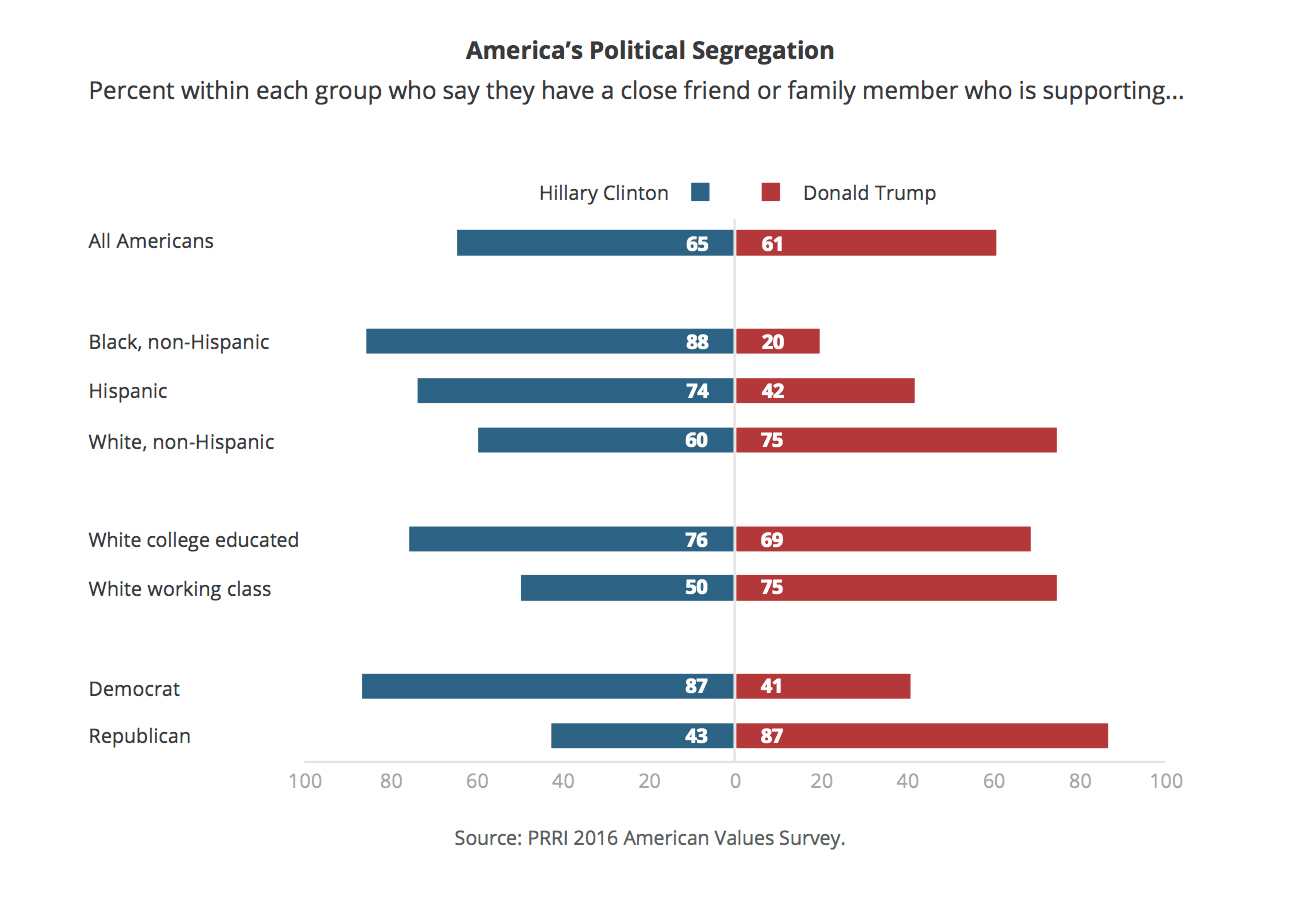 Among religious groups, nearly half (48%) of white evangelical Protestants and more than four in ten white mainline Protestants (41%) say they have no one in their immediate social network who is supporting Clinton. In contrast, nearly eight in ten (77%) black Protestants, 61% of Hispanic Catholics, 45% of religiously unaffiliated Americans, and 43% of members of non-Christian religions say they have no one in their immediate social network who is supporting Trump.
Partisans also have highly segregated social networks. A majority (56%) of Democrats report that they do not have a close friend or family member who is supporting Trump. Similarly, a majority (52%) of Republicans do not have a single close friend or family member who is supporting Clinton.
Democratic and Republican Churches?
Roughly half (45%) of Americans who attend religious services at least a few times a year report that most members of their church or place of worship are supporting Clinton. Nearly an equal number (42%) report that most of their congregation is supporting Trump. However, the politics vary markedly by religious affiliation.
Nearly three-quarters (73%) of white evangelical Protestants and a majority (53%) of white mainline Protestants who attend services at least occasionally say most of their fellow congregants are supporting Trump. By contrast, nine in ten (90%) black Protestants say most of their fellow congregants will be supporting Clinton. More than eight in ten (83%) Trump supporters who attend religious services at least weekly estimate that most of their fellow church members are supporting Trump. Similarly, more than three-quarters (78%) of Clinton supporters who attend religious services at least weekly estimate that most of their fellow church members are supporting Clinton.
III. Progress, Nostalgia, and Cultural Change
Looking Back: Evaluating Cultural Changes Since the 1950s
Americans are divided about whether American culture and way of life have changed for worse (51%) or better (48%) since the 1950s. This assessment has been relatively stable over time, though there are notable differences based on political affiliation, race, class, age, and gender.
Democrats take a decidedly more positive view about the cultural changes that have occurred over the last 60 years. Roughly two-thirds (66%) of Democrats say American culture has generally changed for the better since the 1950s, while roughly two-thirds of Republicans (68%) and a majority of independents (55%) say American society and way of life has only gotten worse. Supporters of each presidential candidate are divided along similar lines. About seven in ten likely voters supporting Donald Trump (72%) say American society and way of life has changed for the worse since the 1950s, while seven in ten likely voters supporting Hillary Clinton (70%) say things have changed for the better.
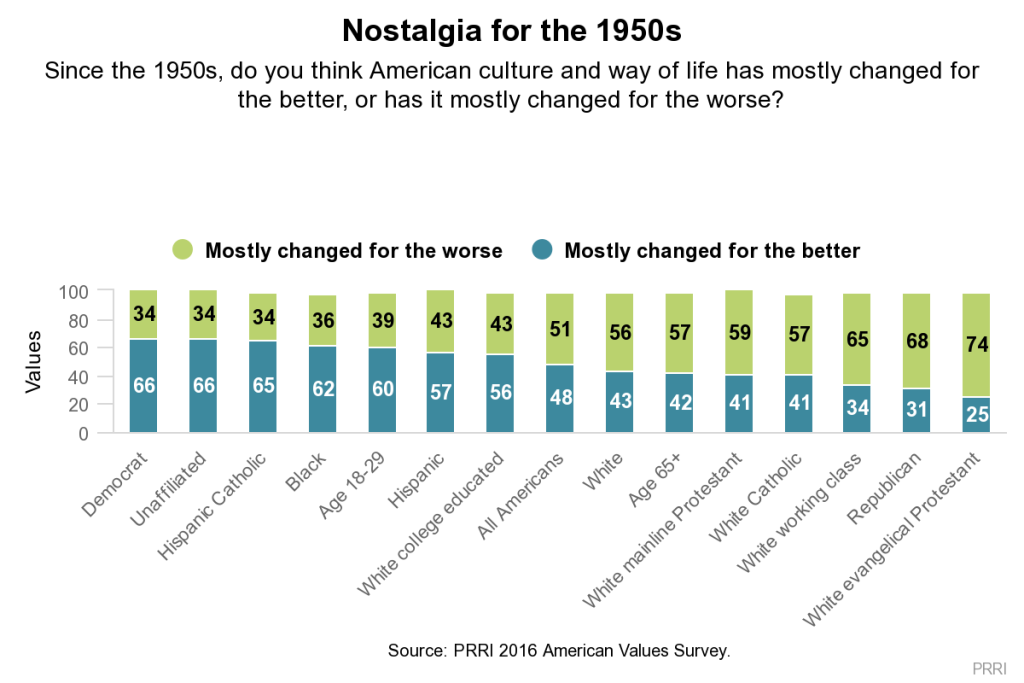 There are profound differences in views about the direction the country has taken since the 1950s by race, ethnicity, and class. A majority (56%) of white Americans say American society has changed for the worse since the 1950s, while roughly six in ten black (62%) and Hispanic (57%) Americans say American society has changed for the better. Class differences among whites are pronounced. A majority (56%) of white college-educated Americans say American society is generally better now than it was in the 1950s, while nearly two-thirds (65%) of white working-class Americans say things are now worse.
White Christians are more likely than members of other religious groups to say recent changes in American culture have been, on balance, bad for the country. No group has a dimmer view of American cultural change than white evangelical Protestants: Nearly three-quarters (74%) say American culture has changed for the worse since the 1950s. Nearly six in ten white mainline Protestants (59%) and white Catholics (57%) also believe the American way of life has taken a turn for the worse over the past 60 years. In contrast, at least six in ten religiously unaffiliated Americans (66%), members of non-Christian religions (66%), Hispanic Catholics (65%), and black Protestants (60%) say American society has mostly changed for the better since the 1950s.
Looking Forward: Evaluating America’s Future
A similar picture emerges when Americans are asked if the country’s best days are ahead of us (48%) or behind us (50%). Views are largely unchanged from late 2015, and divisions in the American public follow expected patterns, with Republicans and the white working class expressing the most pessimistic views about America’s future.
White Americans, especially white working-class Americans, are more likely than black and Hispanic Americans to believe America’s best days are in the past. A majority (54%) of whites say that the country’s best days are behind us, compared to only 47% of Hispanic and 40% of black Americans. The views of white Americans diverge sharply by social class. More than six in ten (61%) white working-class Americans believe America’s best days have passed, a view shared by only 43% of white college-educated Americans. A majority (57%) of white college-educated Americans say country’s best days are yet to come.
Perspectives on America’s future are polarized by partisan identity, with Republicans holding a much bleaker view than Democrats. Sixty-one percent of Republicans and a majority (54%) of independents say America’s best days are in the past, while only 38% of Democrats believe that to be true. More than six in ten (61%) Democrats say the country has yet to experience its best days.
 Women in Political Leadership and Gender-based Double Standards
Most (58%) Americans believe the country would be better off if there were more women serving in public office. Four in ten (40%) Americans disagree that the country would necessarily be better off.
Democrats and Republicans have sharply contrasting views about the importance of women serving in politics. More than three-quarters (77%) of Democrats say the U.S. would benefit from more women serving in political leadership roles. Fewer than four in ten (37%) Republicans—including only 42% of Republican women—believe the country would be better off with more women holding public office. More than six in ten (62%) Republicans disagree.
Predictably, the views of men and women are also substantially different when it comes to the benefits of female leadership in politics. Nearly two-thirds (65%) of women, but only half (50%) of men, say it would be better for the country if more women served in public office.
Americans overall acknowledge that there is an achievement double standard against women. Two-thirds (67%) of Americans agree women often have to be more qualified than men to be considered for the same job. Roughly one in three (32%) disagree.
There is general consensus across the political divide that qualification requirements for women are higher than they are for men, although there is some variation in the strength of agreement. A majority (57%) of Republicans, nearly two-thirds (65%) of independents, and eight in ten (80%) Democrats agree women often need greater qualifications to be considered for the same job as men.
There is a notable gender gap on this question. Eight in ten women (80%), but only 54% of men, agree women often have to be more qualified than men to be considered for the same job.
Evaluating America’s Economic Future and Upward Mobility
Pessimism about Next Generation
Americans express notable but declining pessimism about their children’s economic future. Nearly four in ten (39%) Americans—a plurality—believe their generation is better off financially than their children’s generation will be. More than one-third (36%) say the next generation will be in a similar financial situation and only about one-quarter (24%) say their generation is worse off than their children’s generation will be.
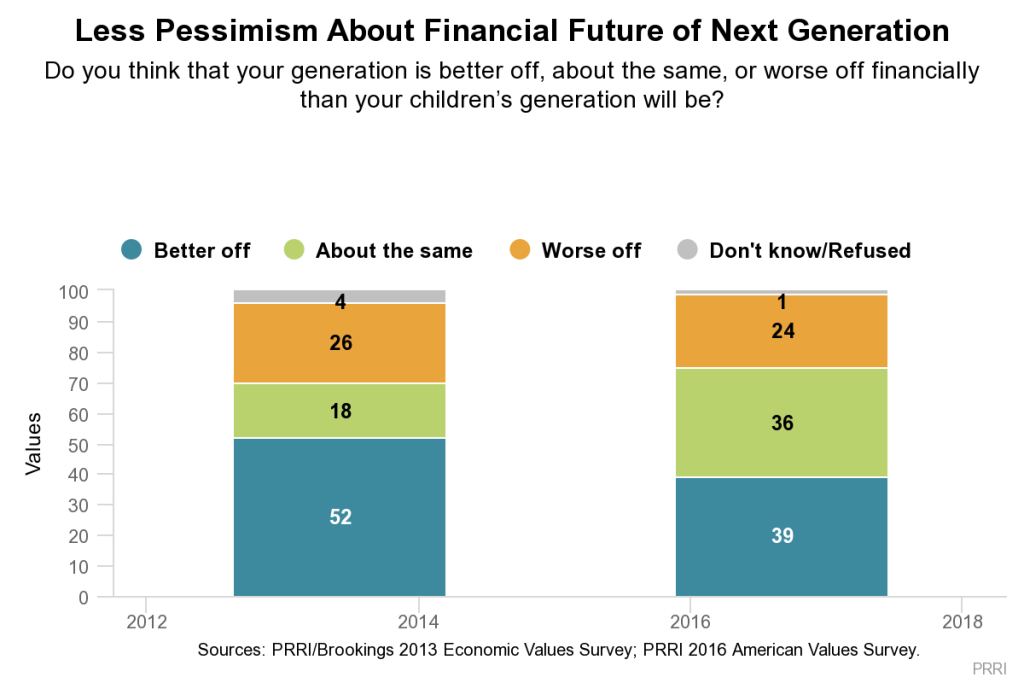 Although relatively few believe that their generation is worse off than their children’s generation will be, the number of Americans saying their generation is better off has declined. In 2013, a majority (52%) of Americans said their generation was better off than their children’s would be, while roughly one in five (18%) said they would be in about the same financial situation. Interestingly, Americans today are not any more likely to think they are worse off than their children will be. In 2013, a similar number (26%) of people reported that their generation was worse off than their children’s generation would be.
Older Americans are more likely than young adults to say their generation is financially better off than the one following it. A slim majority (51%) of seniors (ages 65 and older) believe their generation is in a better financial situation than their children’s generation will be. In contrast, fewer than one in four (23%) young adults (age 18-29) believe their generation is in better shape financially than the one to follow.
*Note: For respondents without children, question was asked about “the next generation of young people.”
Does Hard Work Guarantee Success?
Most Americans express doubts about whether a key element of the American Dream—working hard is enough to get ahead—still holds true. A majority (57%) of Americans say hard work and determination do not guarantee success for most people, while 42% say it does. While this skepticism is widely shared among the public, there are key political, racial, ethnic, and class divisions.
More than six in ten (62%) Democrats and 58% of independents do not believe hard work alone is enough to guarantee success. Fewer than half (46%) of Republicans agree with this pessimistic view. A majority (54%) of Republicans disagree with the idea that hard work does not always yield success.
Skepticism about the connection between hard work and success spans racial and ethnic divides. More than six in ten black (65%) and Hispanic Americans (63%) and a majority of white Americans (54%) agree hard work is not a surefire path to success for most people. Nearly six in ten (58%) members of the white working class agree that hard work doesn’t always result in success. White college-educated Americans are divided in their views; nearly half (49%) agree, while a similar number (50%) disagree.
IV. Trade and Foreign Policy
Americans are closely divided about the benefits of free trade. Forty-three percent of the public say free trade agreements are mostly helpful because they open markets to U.S. companies and allow Americans to buy goods more cheaply. Half (50%) of Americans take the opposite view: free trade agreements are mostly harmful because they send jobs overseas and drive down wages in the U.S.
There are modest differences in views about free trade by race and ethnicity. However, white Americans are divided sharply by class. Six in ten (60%) white working-class Americans say free trade agreements are mostly harmful, a view shared by only about four in ten (42%) white college-educated Americans.
Democrats and Republicans sharply diverge over the benefits of free trade. Nearly two-thirds (64%) of Republicans believe free trade is generally harmful. By contrast, only 40% of Democrats see free trade agreements as mostly harmful, while a majority (54%) say free trade agreements are mostly helpful because they open markets and lower the price of goods. Political independents mirror views of the general public.
Among Democrats, views about free trade vary considerably by region. Midwestern Democrats are much less likely to see the benefit of free trade than those in the Northeast and South (44% vs. 59% and 58%, respectively). Western Democrats are somewhat divided with close to half (49%) expressing a positive view about the benefits of free trade and four in ten (40%) expressing a negative view. Republican views on free trade are not significantly different across regions.
 Most Americans believe the loss of manufacturing jobs in the U.S. is primarily the result of poorly negotiated trade deals and government policy as opposed to the rise of globalization and technological advancements. Nearly six in ten (57%) Americans say the decline in American manufacturing was caused by government policies, while only 37% blame globalization.
A majority of Republicans (71%) and independents (57%) say manufacturing declines in the country are primarily the result of bad trade deals and government policy. Democrats are about equally as likely to blame government decision-making (46%) as they are to blame globalization and technological advances (48%).
There are striking divisions among Americans by educational attainment on this issue. Nearly two-thirds (65%) of Americans with a high school education or less believe government policy is largely responsible for the decline in American manufacturing jobs. Four-year college graduates are evenly divided over the culprit, with as many citing government policy (47%) as globalization (47%). In contrast, six in ten (60%) Americans with a post-graduate degree fault globalization and technological advances for the decline in American manufacturing jobs.
There are also sharp contrasting views among different generations. Young adults (age 18-29) are more likely than any other age group to say that manufacturing jobs have declined due to globalization. Nearly half (48%) of young adults say globalization and technological advancement precipitated the decline, a view shared by only one-third (33%) of seniors (age 65 and older).
Defending NATO Allies
The public is split over whether the U.S., as a member of NATO, should use military force to defend any member country when it is attacked or whether the U.S. should only use military force if its immediate security is threatened (49% vs. 45%, respectively).
There are no significant political differences in views about NATO. The issue divides Republicans, Democrats, and independents about equally. A majority (53%) of Republicans and nearly half of independents (49%) and Democrats (48%) support the use of military force in defense of NATO allies. Fewer than half of Republicans (44%), independents (46%), and Democrats (47%) say military force should only be employed if America’s immediate security is threatened.
There is a pronounced gender divide about when the use of military force is required. A majority (56%) of men say the U.S. should defend any NATO ally with military force, while only 42% of women agree. A majority (52%) of women say the U.S. should only use military force if its own immediate security is threatened.
V. Immigration and Protectionist Policies
Views of Immigrants
Americans are divided over the cultural contributions immigrants make to American society. Close to half (46%) of Americans say the growing number of newcomers from other countries threatens traditional American customs and values, while 44% say these immigrants strengthen our society.
There are notable racial, ethnic, and class divisions in perceptions of immigrants. A majority of Hispanic Americans (56%) say newcomers strengthen American culture, while 37% say they threaten it. Black Americans are evenly divided over the contributions immigrants make to society: equal numbers say immigrants threaten American culture (46%) as say strengthen it (46%). A slim majority (51%) of white Americans say immigrants are a threat to American culture, while 40% believe immigrants contribute positively to American culture. However, whites are divided sharply by class. More than six in ten (62%) white working-class Americans say immigrants threaten American culture, compared to only about one-third (34%) of white college-educated Americans. A majority (54%) of white college-educated Americans believe immigrants are a source of strength for American society.
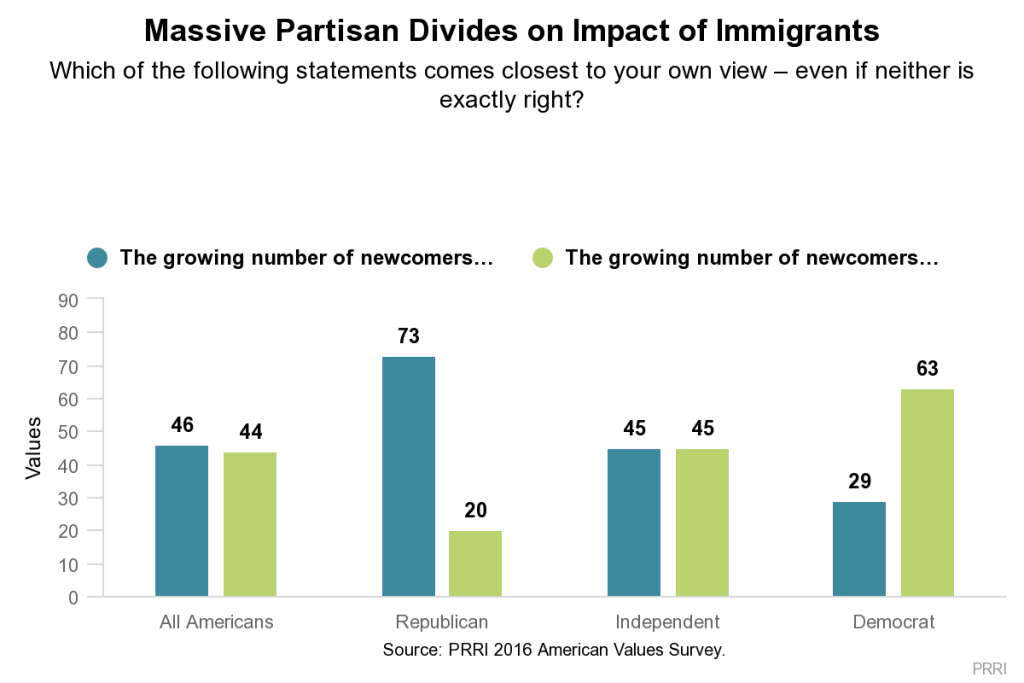 There are stark partisan differences over whether Americans perceive immigrants as a threat or a source of strength. Nearly three-quarters (73%) of Republicans report the growing number of newcomers threatens American customs and values, while only 29% of Democrats say the same. More than six in ten (63%) Democrats say immigrants strengthen American society. Independents mirror the general population.
Protectionist Policies: Building a Wall and Banning Muslims
Building a Wall on the U.S.-Mexico Border
Most Americans reject the proposal that the U.S. should build a wall along the U.S.-Mexico border. Roughly four in ten (41%) Americans favor building a wall, while nearly six in ten (58%) are opposed. Support for this policy has remained unchanged since May 2016.
Public attitudes are highly polarized by race, ethnicity, and class. Roughly three-quarters of Hispanic (76%) and black (74%) Americans are opposed to building a wall. In contrast, white Americans are more divided over the policy: 52% oppose; 47% favor. There is notable disagreement among whites by social class. A majority (56%) of white working-class Americans favor building a wall, a view shared by only 35% of white college-educated Americans. Nearly two-thirds (65%) of white college-educated Americans are opposed to the construction of a wall along the U.S.-Mexico border.
There is a substantial partisan divide in support for building a wall along the Mexican border. Roughly three-quarters (73%) of Republicans favor this policy compared to fewer than four in ten (38%) independents and only about one in five (19%) Democrats who say the same. More than six in ten (62%) independents and eight in ten (80%) Democrats oppose building a wall along the southern U.S. border.
The gap between Donald Trump and Hillary Clinton supporters dwarfs partisan disagreement over the proposal. More than eight in ten (86%) Trump supporters favor the construction of a wall, a position favored by only 12% of Clinton backers. Nearly nine in ten (88%) Clinton supporters say they do not support building a wall along the border, including 61% who strongly oppose it.
Banning Muslims from Entering the U.S.
Most (56%) Americans reject a policy of temporarily banning Muslims from other countries coming to the U.S., although a sizeable minority (43%) express support for the idea.
A similar pattern emerges among Americans by race, ethnicity, and social class. More than seven in ten (72%) black Americans and more than six in ten (62%) Hispanic Americans oppose banning foreign Muslims from other countries from entering the U.S. White Americans are split on the issue, with a slim majority (51%) opposing such a ban and 47% favoring it. Notably, a majority (56%) of white working-class Americans favor a temporary ban on Muslims from entering the U.S., compared to roughly one-third (35%) of white college-educated Americans.
Republicans and Democrats are also deeply divided over the proposal. Seven in ten (70%) Republicans favor a policy of temporarily banning Muslims from other countries from entering the U.S., while fewer than three in ten (29%) oppose such a policy. In contrast, three-quarters (75%) of Democrats oppose banning Muslims from entering the country, while fewer than one in four (23%) favor this policy. Independents mirror the general population on this issue.
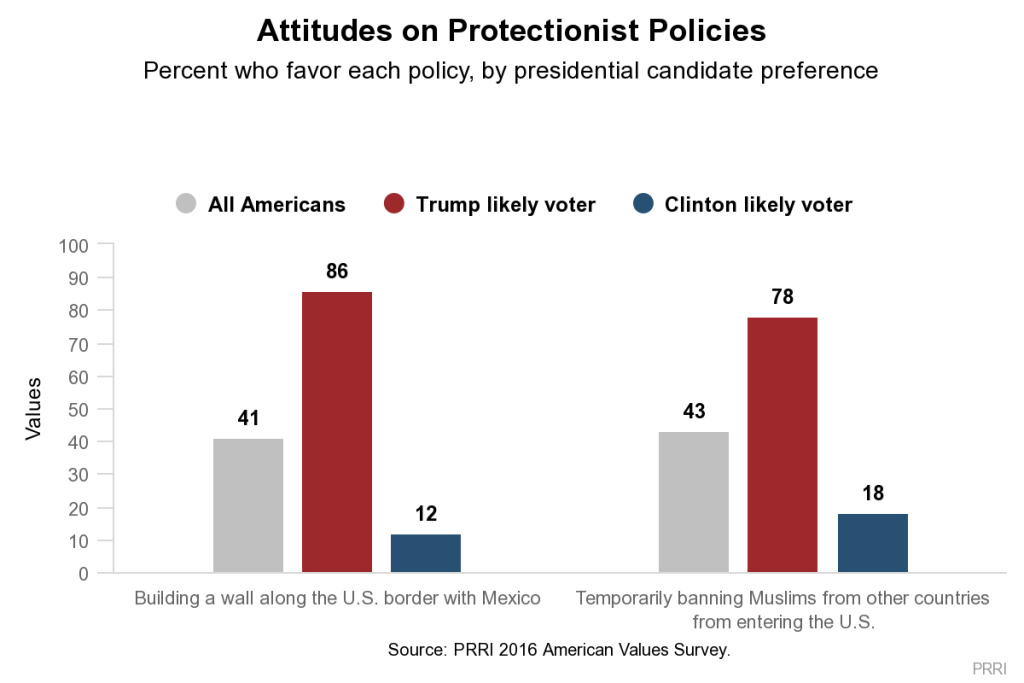 Hillary Clinton and Donald Trump supporters also register diametrically opposed views on this issue. Close to eight in ten (78%) Trump supporters favor a temporary ban on Muslims, while fewer than one in five (18%) Clinton supporters endorse the idea. Eighty percent of Clinton supporters reject such a ban.
The issue also divides Americans by religious affiliation. A majority of white evangelical Protestants (62%) and white mainline Protestants (54%) favor the temporary ban on Muslims. White Catholics are split in their views of the proposal, with about equal numbers expressing support (48%) as opposition (49%). Conversely, a majority of Hispanic Catholics (62%), black Protestants (68%), members of non-Christian religions (70%), and religiously unaffiliated Americans (74%) reject a temporary ban on Muslims.
VI. Raising the Minimum Wage, Free College Tuition, and Taxation
Increasing the Minimum Wage to $15
The public expresses fairly strong support for raising the minimum wage to $15 per hour. Six in ten (60%) Americans favor more than doubling the minimum wage from $7.25 per hour to $15 per hour, while approximately four in ten (39%) are opposed to such a hike. Support for a $15 minimum wage is unchanged from last year.
Support for a minimum wage increase varies considerably by race and ethnicity. Eight in ten (80%) black Americans and nearly three-quarters (73%) of Hispanic Americans support raising the minimum wage to $15 per hour. White Americans, in comparison, are more divided: a majority (53%) favor a $15 minimum wage, while 46% are opposed. Notably, whites’ strength of support for a minimum wage increase is steady across social classes. A majority of both white working-class (55%) and white college-educated Americans (52%) favor raising the minimum wage to $15 per hour.
Eight in ten (80%) Democrats favor increasing the minimum wage from $7.25 per hour to $15 per hour, compared to roughly one-third (35%) of Republicans. Nearly two-thirds (64%) of Republicans oppose such an increase. The views of independents mirror those of the general public.
Americans are also more likely to say raising the minimum wage helps rather than hurts the economy. A majority (54%) of Americans say raising the minimum wage generally helps the economy because it allows more workers to pay for basic goods and services without government help, while four in ten (40%) Americans say minimum wage increases generally hurt the economy by making it more difficult for small businesses to pay and hire new workers.
Democrats and Republicans diverge in their views about the relative economic benefit or harm of raising the minimum wage. Nearly three-quarters (73%) of Democrats say raising the minimum wage helps the economy by allowing workers to pay for basic goods and services, while fewer than three in ten (27%) Republicans say the same. Two-thirds (67%) of Republicans believe minimum wage increases hurt the economy by making it difficult for small businesses to hire new workers.
College Tuition
Americans express strong support for eliminating tuition for public university students whose families make less than $125,000 annually. Nearly two-thirds (65%) of Americans agree tuition to public colleges and universities should be free for all students whose families make less than $125,000 per year; fewer than four in ten (36%) Americans disagree.
More than eight in ten black (83%) and Hispanic Americans (81%) believe students whose families make less than $125,000 annually shouldn’t have to pay tuition at public colleges and universities, while fewer than six in ten (57%) white Americans say the same. There are divides among white Americans by class, however. More than six in ten (62%) white working-class Americans agree tuition to public colleges and universities should be free for those who came from families making less than $125,000 per year, compared to a slim majority (51%) of white college-educated Americans. Half (50%) of the white college educated do not support this policy.
More than eight in ten (83%) Democrats support making tuition free at public colleges and universities for all students whose families make less than $125,000 per year. In contrast, roughly four in ten (42%) Republicans support such a proposal, while a majority (57%) are opposed.
There is considerable support for this policy across generations, although young adults voice the strongest support. Nearly seven in ten (68%) young adults (age 18-29) and a majority (57%) of seniors (age 65 and older) agree tuition should be eliminated for students at public colleges and universities whose families make less than $125,000 annually.
Increasing Taxes on the Wealthy
The public overwhelmingly supports raising taxes on wealthier Americans. More than seven in ten (72%) Americans favor increasing the tax rate on Americans earning more than $250,000 per year, while fewer than three in ten (27%) are opposed. Support for increasing taxes on the wealthy has risen since 2014, when 57% favored such a policy.
VII. Views of the Criminal Justice System
Police Treatment of Black Americans
Americans are divided about whether police officers generally treat blacks and other minorities the same as whites. A majority (52%) of Americans agree that police officers generally treat nonwhite and white Americans the same, while 47% disagree. This represents a notable increase from 2015, when only 41% of the public said police officers treat nonwhite and white people the same.
The racial and ethnic divisions on this issue are profound, while class divisions among white Americans are muted. Roughly eight in ten (79%) black Americans and more than six in ten (62%) Hispanic Americans reject the idea that police officers treat everyone the same. In stark contrast, nearly two-thirds (64%) of white Americans, including strong majorities of the white working class (66%) and the white college educated (59%), agree that police officers are generally evenhanded in their treatment of nonwhite and white Americans.
There are enduring political divisions in views about the behavior of police. Fully eight in ten (80%) Republicans, but only about one-third (32%) of Democrats, agree police officers generally treat blacks, other minorities, and whites the same. In sharp contrast, two-thirds (67%) of Democrats disagree. Notably, a majority (58%) of white Democrats also believe police officers do not treat nonwhite people the same as whites.
 Young Americans and seniors are nearly mirror images of each other on this issue. Nearly six in ten (58%) seniors (age 65 and older), compared to only 43% of young adults (age 18-29), agree police treat white and nonwhite Americans the same. A majority (55%) of young adults disagree with this statement.
Voting Rights for Ex-Felons
Americans overall are strongly supportive of restoring voting rights to people who have been convicted of felonies after they serve their sentences. Nearly three-quarters (74%) of Americans agree that people who have been convicted of felonies should be allowed to vote after they complete their sentences. Roughly one-quarter (26%) disagree.
Support for restoring voting rights for felons after they serve their sentence is high across all segments of American society. Majorities of Democrats (83%), independents (73%), and Republicans (62%) agree with this policy, as do strong majorities of blacks (85%), Hispanics (78%), and whites (71%).
Endnotes
1 PRRI 2012 American Values Survey.
2 PRRI 2014 American Values Survey.
3 All references to Democrats and Republicans in this section refer to Democrats and Democrat-leaning Americans and Republican and Republican-leaning Americans, respectively.
4 The survey was conducted Sept. 1-27, 2016.
5 Likely voters include Americans who are currently registered to vote, and who reported that they are “absolutely certain” to vote this year. Results are based on voters who are currently supporting or leaning towards supporting either candidate. All references to “voters” are “likely voters” in this analysis.
Recommended citation:
Jones, Robert P., Daniel Cox, Betsy Cooper, and Rachel Lienesch. “The Divide Over America’s Future: 1950 or 2050? Findings from the 2016 American Values Survey.” PRRI. 2016. http://www.prri.org/research/poll-1950s-2050-divided-nations-direction-post-election/.
Featured image by Robbie Prieto. Used with permission.


