Executive Summary
 The American religious landscape is marked by significant diversity and fluidity. While Catholics and white mainline Protestants remain two of the largest religious groups in the United States, they have each experienced significant declines in membership.
- Although nearly one-third (31%) of Americans report that they were raised Catholic, only 22% currently identify that way, a net loss of nine percentage points. Notably, 12% of Americans today are former Catholics.
- While 15% of Americans currently identify as white mainline Protestant, 19% report that they were raised in that tradition. This shift represents a net loss of four percentage points.
The religiously unaffiliated represent the fastest growing group in the American religious landscape, and are more complex than previously understood.
While 19% of Americans identify as religiously unaffiliated today, only 7% of Americans report that they were raised religiously unaffiliated, a net increase of 12 percentage points.
While religiously unaffiliated voters support Obama over Romney (73% vs. 22%), religiously unaffiliated Americans are less likely to say they are certain to vote than religiously affiliated Americans (61% vs. 73%).
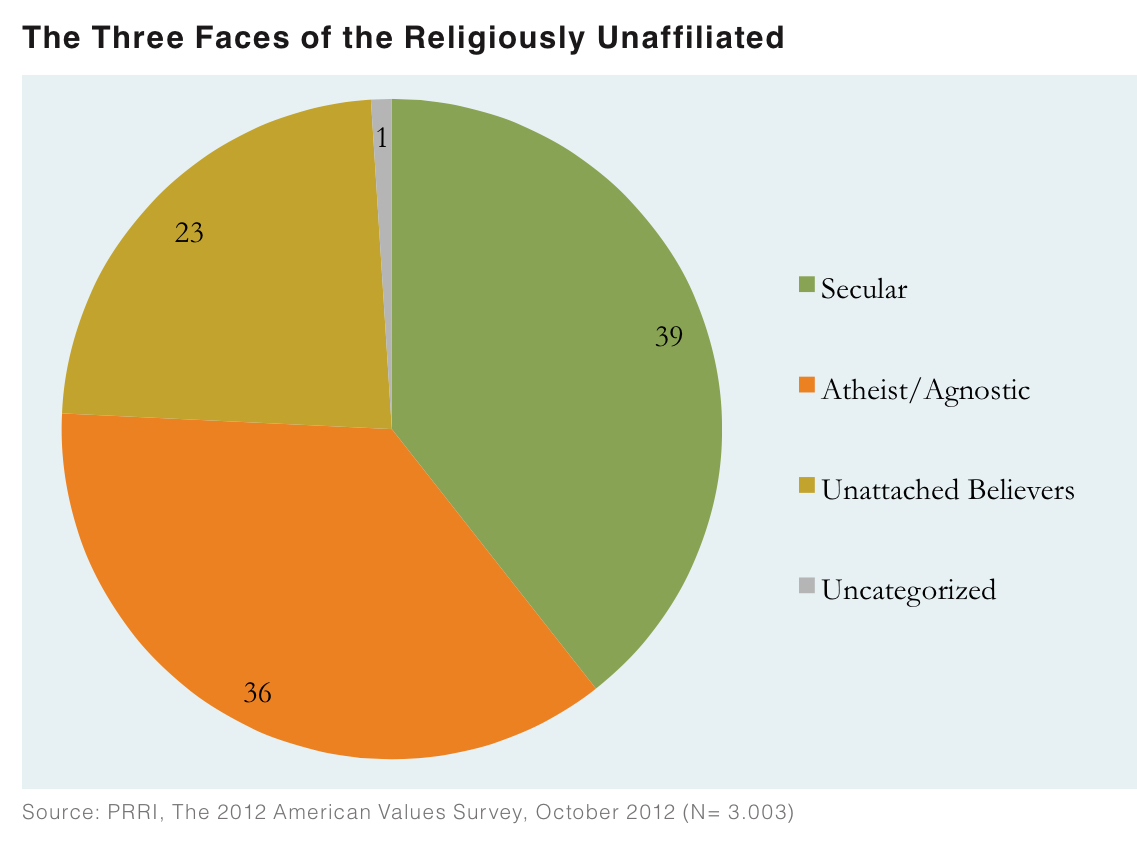
Religiously unaffiliated Americans are comprised of three discrete subgroups, which have distinct religious and demographic profiles:
- “Unattached believers” (23%): describe themselves as religious despite having no formal religious identity, and are more likely than the general population to be black or Hispanic and to have lower levels of educational attainment;
- “Seculars” (39%): describe themselves as secular or not religious, and roughly mirror the general population in terms of racial composition and levels of educational attainment;
- “Atheists and agnostics” (36%): identify as atheist or agnostic, and are more likely than the general population to be non-Hispanic white and to have significantly higher levels of educational attainment.
These three subgroups differ substantially in their opinion profiles, especially on certain social issues like same-sex marriage and religious liberty. Nearly 9-in-10 (89%) atheists and agnostics favor allowing gay and lesbians to marry legally, compared to 7-in-10 (70%) seculars and nearly 6-in-10 (57%) unattached believers. Three-quarters (75%) of atheists and agnostics and nearly 6-in-10 (59%) secular Americans believe that religious liberty is not under threat today. A majority (54%) of unattached believers disagree, saying that religious liberty is being threatened.
Religiously unaffiliated Americans who were raised with a religious identity report a range of different reasons for leaving the religion of their childhood. The most frequently cited reasons are the following:
- Rejection of the teachings of their childhood faith or belief in God (23%);
- Antipathy toward organized religion (16%);
- Negative personal experiences with religion or life experiences in general (11%);
- Perceptions that religion is at odds with scientific principles or logic (8%);
- Perceptions that religion or religious people are hypocritical (8%).
Although Catholics are often viewed as a monolithic group, the survey reveals distinct subgroups that are important for understanding the complexity of Catholics’ public engagement.
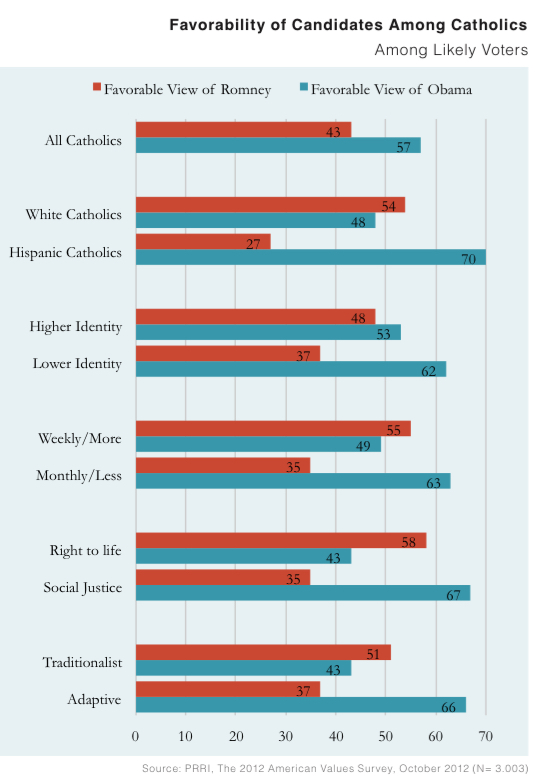
The survey confirms complex opinion divides along ethnic lines between white Catholics (63% of Catholics) and Hispanic Catholics (29% of Catholics).
- Hispanic Catholics are more likely than white Catholics to have a favorable opinion of President Barack Obama (70% vs. 48%), while white Catholics are more likely than Hispanic Catholics to have a favorable view of Governor Mitt Romney (54% vs. 27%).
- White Catholics are more supportive than Hispanic Catholics of both the death penalty (47% vs. 30%) and legal abortion (56% vs. 43%).
On the question of the public engagement of the church, the survey found important divisions between Catholics who prefer a “social justice” emphasis that focuses on helping the poor and Catholics who prefer a “right to life” emphasis that focuses on issues like abortion.
- “Social justice Catholics” (60%): believe that in its statements about public policy, the Catholic Church should focus more on social justice and the obligation to help the poor, even if it means focusing less on issues like abortion and the right to life.
- “Right to life Catholics” (31%): believe that the Catholic Church should focus more on abortion and the right to life in its statements about public policy, even if means focusing less on issues like social justice and the obligation to help the poor.
- Among Catholics who attend church at least once a week, a slim majority (51%) believe the Church’s public policy statements should focus more on social justice and helping the poor, compared to 36% who believe that the Catholic Church should focus more on issues like abortion and the right to life.
- “Social justice” Catholics are more likely than “right to life” Catholics to favor Obama (60% vs. 37%), while “right to life” Catholics are more likely than “social justice” Catholics to favor Romney (67% vs. 27%).
Generational differences in religious affiliation are dramatic and point to the United States’ shifting racial, ethnic, and religious composition.
Seven-in-ten seniors (age 65 and older) are white Christians, such as white evangelical Protestants (30%), white mainline Protestants (20%), and white Catholics (19%).
Three-in-ten Millennials (age 18 to 29) are white Christians, such as white mainline Protestants (12%), white evangelical Protestants (9%), or white Catholics (8%). Nearly one-third (32%) of Millennials report that they are religiously unaffiliated.
In late September, President Barack Obama held a four-point lead over former Governor Mitt Romney (50% vs. 46%) among likely voters.
- Among independent likely voters, the race was a dead heat: 47% supported Romney and 46% favored Obama.
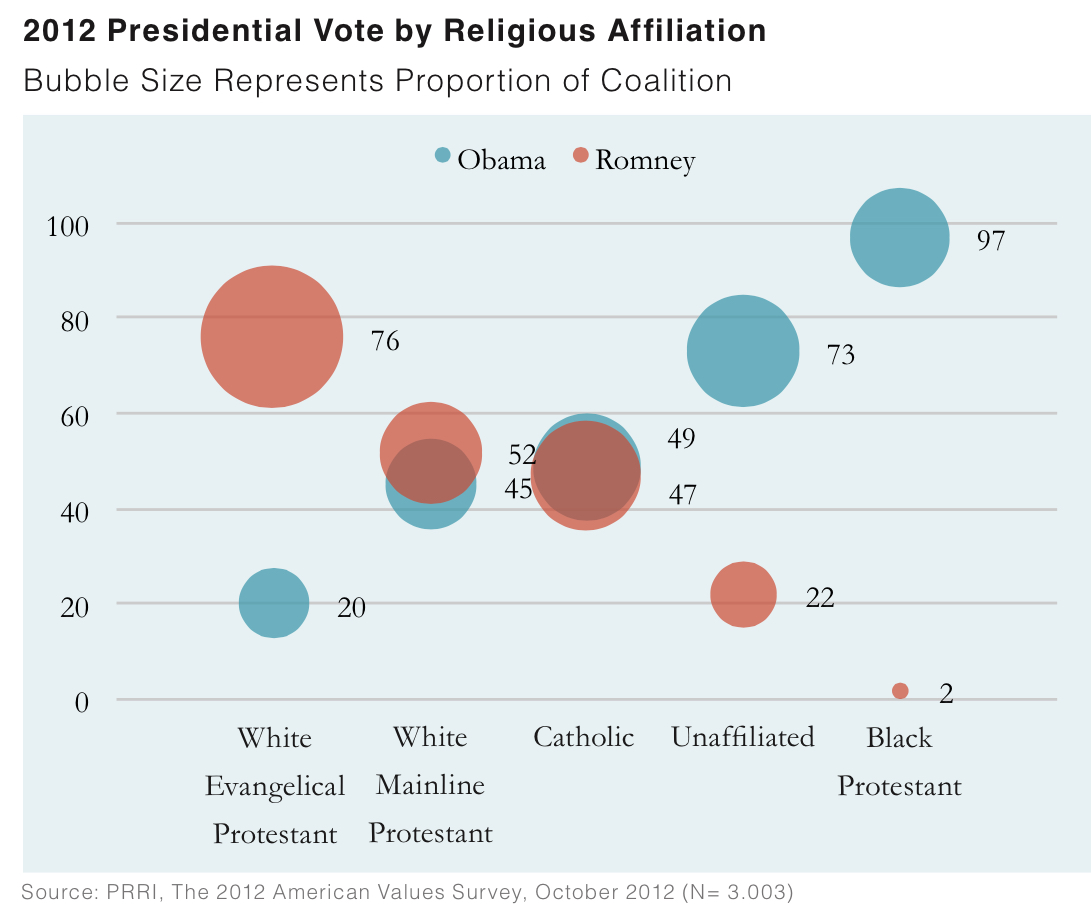
- President Obama garnered overwhelming support among black Protestant likely voters (97%), religiously unaffiliated likely voters (73%), and non-Christian religious likely voters (65%).
- Romney had overwhelming support among white evangelical Protestant likely voters (76%). A slim majority (52%) of white mainline Protestant likely voters also supported Romney, compared to 45% who supported Obama.
- Catholic likely voters overall were divided, with 49% supporting Obama and 47% supporting Romney.
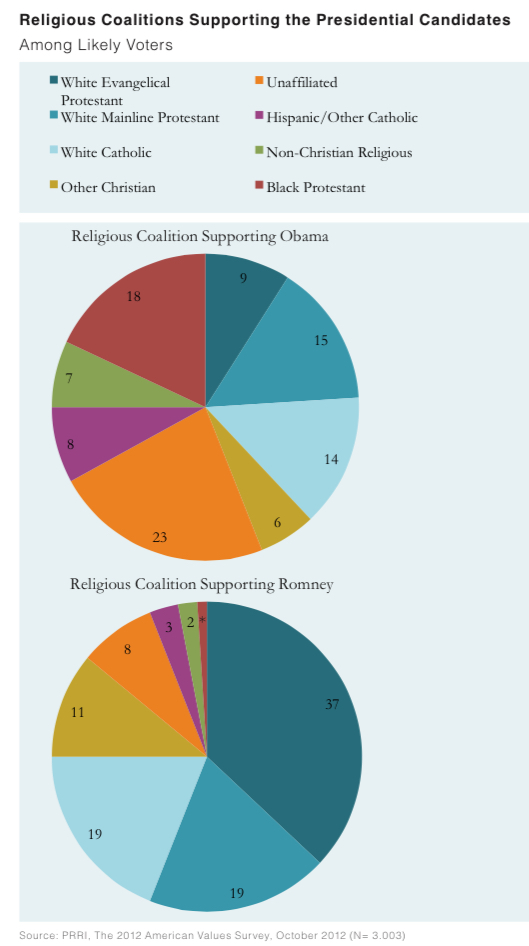
The religious coalitions of Romney and Obama are starkly different.
- Nearly 8-in-10 (79%) likely Romney voters identify as white Christian, including 37% who identify as white evangelical, 19% who identify as white mainline Protestant, and 19% who identify as white Catholic.
- Only about 4-in-10 (39%) likely Obama voters identify as white Christian, while a much larger portion are drawn from the ranks of black Protestants (18%), Hispanic Catholics (6%), non-Christian religious Americans (7%), and religiously unaffiliated Americans (23%).
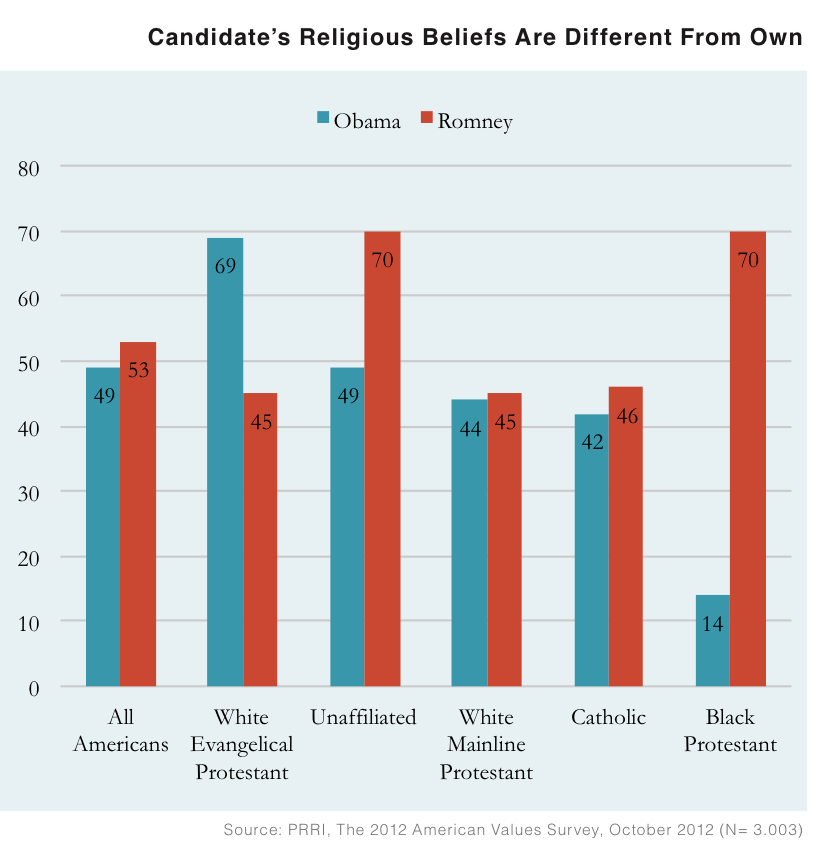
Approximately half of Americans continue to say that both candidates have religious beliefs that are different from their own.
A majority (53%) of Americans say that Romney’s religious beliefs are somewhat or very different from their own, and nearly half (49%) of Americans say that Barack Obama’s religious beliefs are somewhat or very different from their own.
Most Americans agree about the importance of a social safety net, but are divided about whether people who use such programs are genuinely in need of help or are taking advantage of the system.
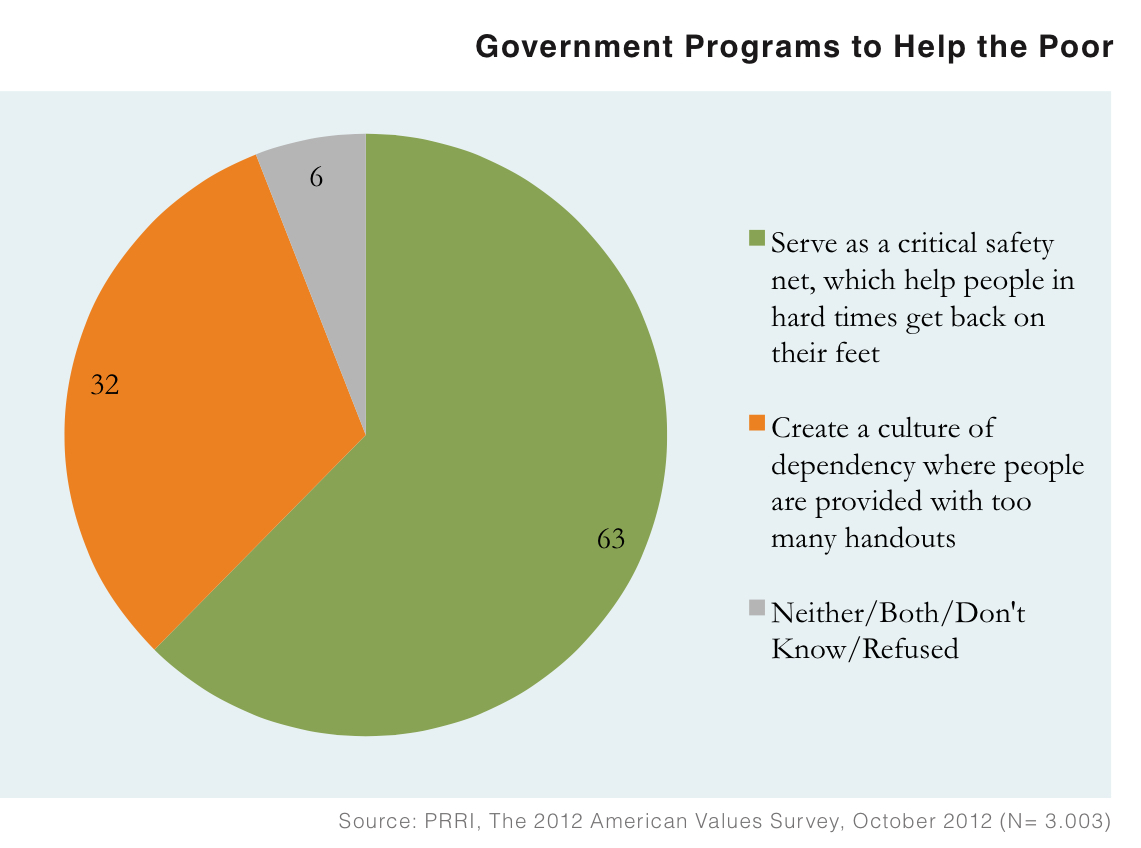
By a margin of nearly 2-to-1, Americans agree that government policies aimed at helping the poor serve as a crucial safety net (63%), rather than creating a culture of dependency where people are provided with too many handouts (32%). However, Americans are divided on whether most people who receive welfare payments are genuinely in need of help (44%) or are taking advantage of the system (46%).
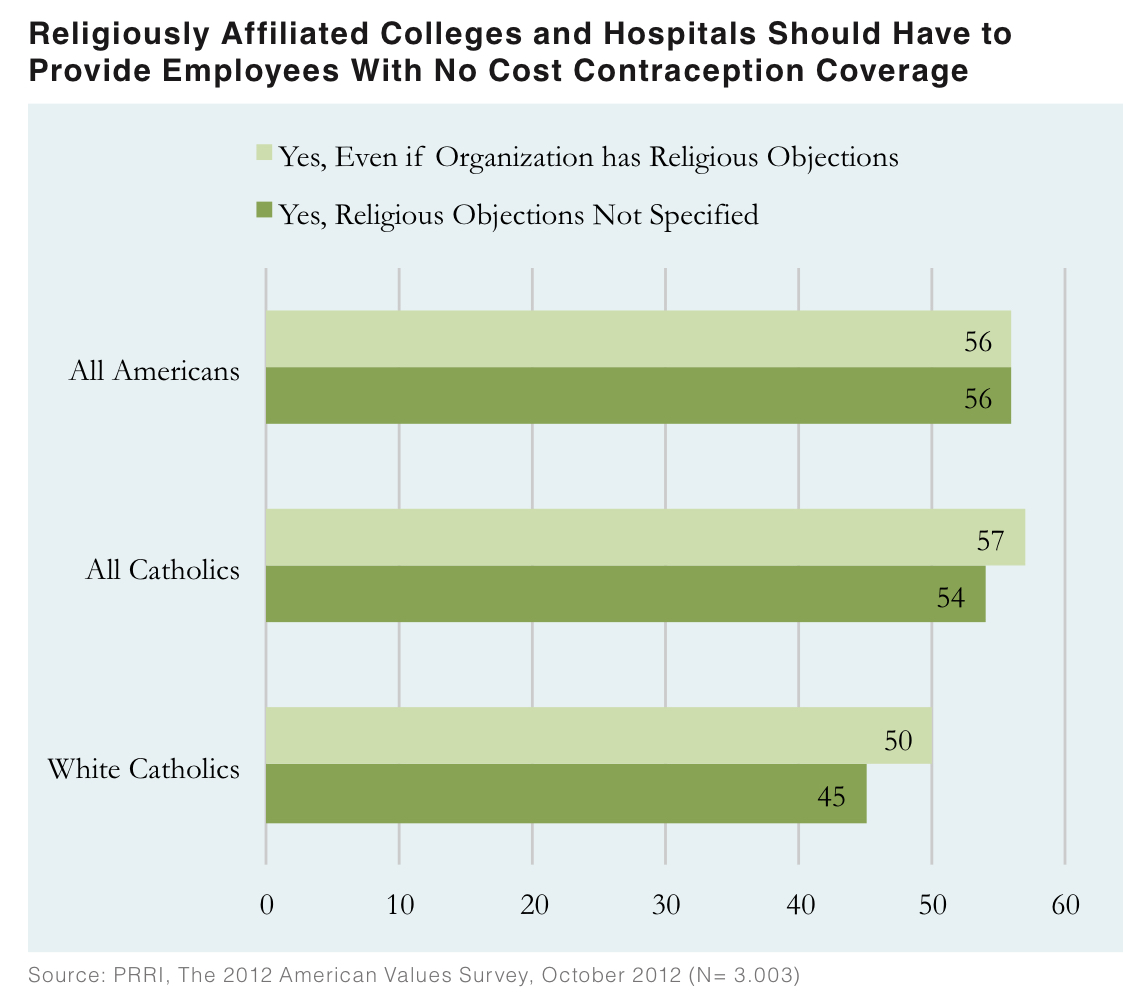
A majority (56%) of Americans agree that religiously affiliated colleges and hospitals should be required to provide their employees with health care plans that that cover contraception or birth control at no cost. Introducing additional information about organizations having religious objections does not result in significant differences in opinion.
Majorities of white mainline Protestants (56%) and Catholics overall (54%) agree with this statement. By contrast, majorities of white evangelical Protestants (56%) and white Catholics (51%) disagree with this statement.
Americans remain divided over traditional gender roles. A majority (54%) of Americans say that women are naturally better suited than men to raise children, while 44% disagree. Overall, women (54%) are equally as likely as men (54%) to believe that women are naturally better suited to raise children. White women who have never been married are one of the few groups to disagree (64%) with this statement.
I. The Changing Face of American Religion in 2012
Religious Change in America
Since the mid-twentieth century, the American religious landscape has been transformed, not just by an increase in diversity as the result of immigration, but by remarkable fluidity in religious affiliation, as Americans move in and out of major faith traditions.(1) In order to understand the current role of religion in public life, it is critical to grasp how these shifting patterns of identity influence the American religious landscape.
Currently, the four largest religious groups in the United States are Catholics (22%), white evangelical Protestants (20%), religiously unaffiliated Americans (19%), and white mainline Protestants (15%). Notably, Catholics are comprised of two subgroups: white non-Hispanic Catholics, who represent 14% of the population, and Hispanic Catholics, who represent 6% of the population.(2) Roughly 1-in- 10 Americans identify as black Protestant (8%), and a similar number identify with some other Christian tradition (10%), a category that includes Mormons, Orthodox Christians, and Hispanic Protestants. Non-Christian faiths represent 6% of the adult population.
Generational differences in religious affiliation are dramatic and point to the United States’ changing racial, ethnic, and religious composition. Nearly 7-in-10 seniors (age 65 and older) are white Christians, such as white evangelical Protestants (30%), white mainline Protestants (20%), and white Catholics (19%). Only 3% of seniors are Hispanic Catholics, and less than 1-in-10 (9%) are religiously unaffiliated.
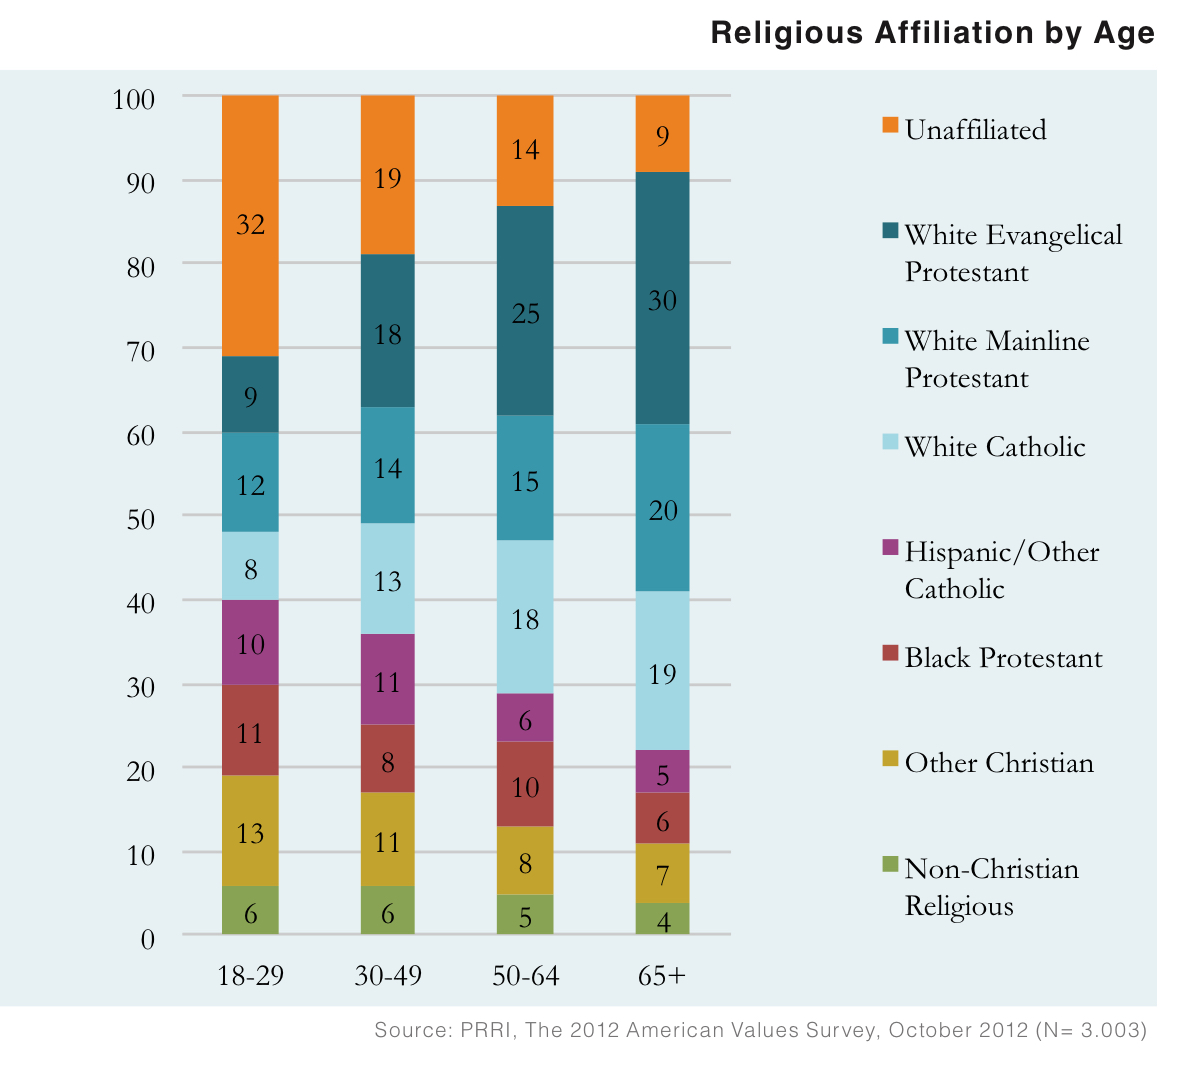
Among Millennials (age 18 to 29), the pattern of religious affiliation is markedly different. Less than 3-in-10 Millennials are white Christians, such as white mainline Protestants (12%), white evangelical Protestants (9%), or white Catholics (8%).
Among Millennials, 9% identify as Hispanic Catholic, three times the proportion among seniors. Nearly one-third (32%) of Millennials report that they are religiously unaffiliated.
Winners and Losers in the Religious Marketplace
The American religious marketplace is marked by significant volatility. Overall, 35% of Americans currently identify with a religious tradition that is different from the tradition in which they were raised.(3)
Two of the largest religious groups in the U.S., Catholics and the religiously unaffiliated, have experienced the largest shifts in membership. Catholics have experienced the largest net loss in adherents. While nearly one-third (31%) of Americans report that they were raised Catholic, only 22% of Americans identify as Catholic today, a net drop of 9 percentage points. Looking more closely, the net loss figure obscures an even larger gross loss in adherents (12 percentage points) that is mitigated by a 2 percentage-point increase as the result of new adherents. In other words, more than 1-in-10 (12%) Americans are former Catholics. Of these former Catholics, half (6%) have joined the ranks of the unaffiliated, while an equal number (6%) have converted and now affiliate with some other religious group.
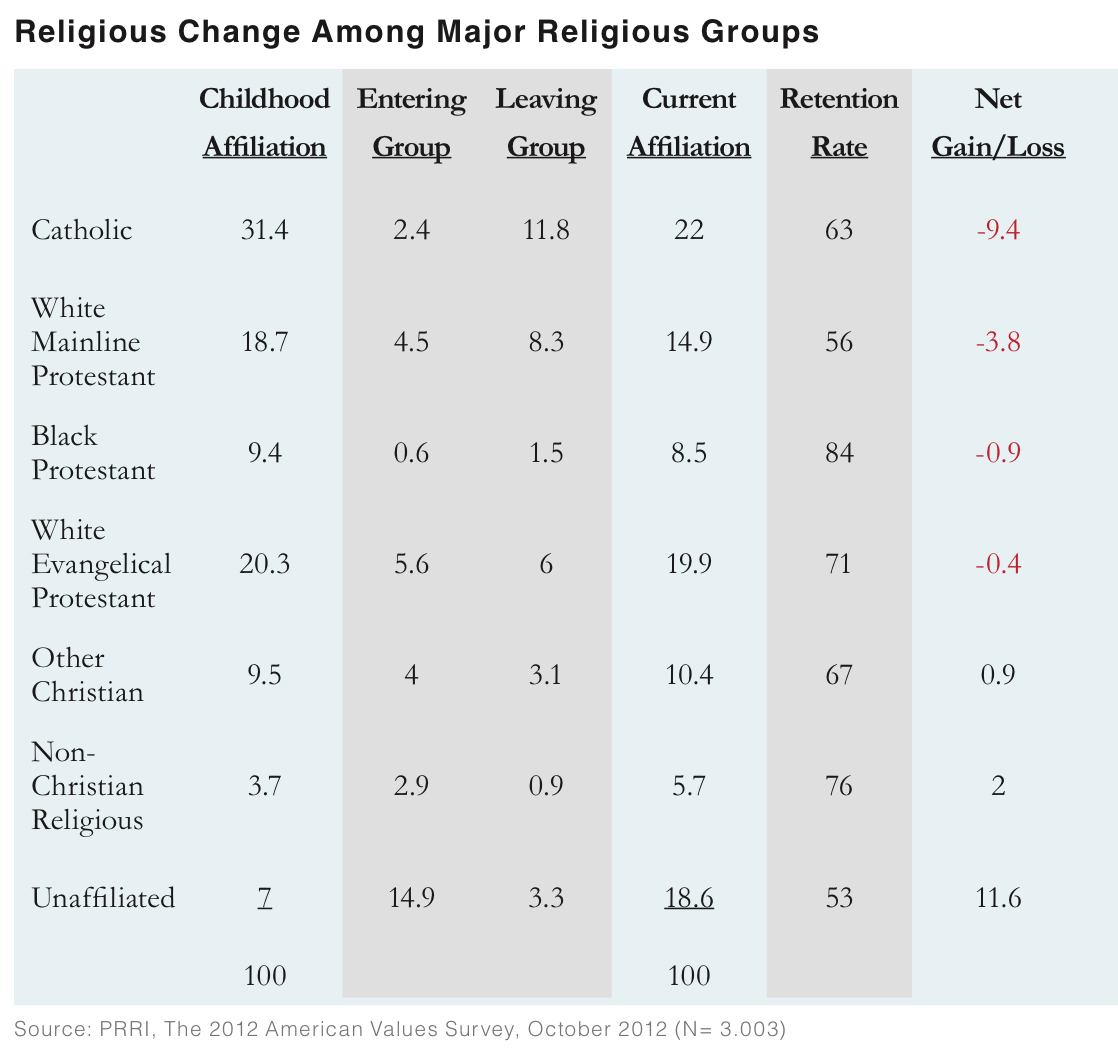
While Catholics have experienced the largest net loss in membership, the religiously unaffiliated have experienced the largest net gain in membership. While only 7% of Americans report that they were raised unaffiliated, 19% of Americans identify as unaffiliated today, a net increase of 12 percentage points.
Like Catholics, white mainline Protestants have witnessed a significant decline in membership. White mainline Protestants have the lowest member retention rate (56%) of any major religious tradition. Nearly 1-in-5 (19%) Americans were raised in a white mainline Protestant household, while only 15% currently identify as white mainline Protestant. However, this net 4-point net loss masks a much larger gross loss (9 percentage points) that is mitigated by a 4-point gain in mainline Protestant adherents.
White evangelical Protestants’ overall numbers have remained relatively stable, but this stability also masks a significant religious churn in identity. Membership losses among white evangelical Protestants have been offset by equivalent gains in new adherents (6 percentage points each).
Profile of Those Leaving the Religion of Their Childhood
Overall, 15% of Americans have left the religious tradition in which they were raised to become religiously unaffiliated. Nearly two-thirds of those who have left their previous religious affiliation to become religiously unaffiliated were raised in either Catholic (38%) or white mainline Protestant (26%) households. More than 1-in-10 were raised white evangelical Protestant (14%) or some other Christian faith (11%).
Americans who have left a faith to become religiously unaffiliated are more likely to be men (63%), politically independent (54%), and young (32% are under the age of 30, and 68% are under the age of 50). They are also more likely than Americans overall to identify as politically liberal (40% vs. 22%). Notably, there are no significant differences by level of education attainment.
When Americans who no longer identify with the religion of their childhood are asked to say in their own words why they left, nearly 1-in-4 (23%) say that they do not believe in the teachings of their childhood faith or no longer believe in God. Sixteen percent say that they dislike organized religion or that they believe religion causes problems in society or contributes to violence. For example, one respondent noted, “I just see religion as separating people, and I don’t believe in separating people.” Many respondents make a clear distinction between religion, with which they disagree, and a belief in God: “Organized religion has nothing to do with spirituality or faith.”
Roughly 1-in-10 (11%) say that they left because of a range of personal experiences that conflicted with religious teachings. One respondent cites his military experience as the reason he left the Catholic Church: “I was raised in a Catholic house, and one commandment is thou shall not kill. In the army, I was a sniper, so for me to do my job, it was something I left behind.”
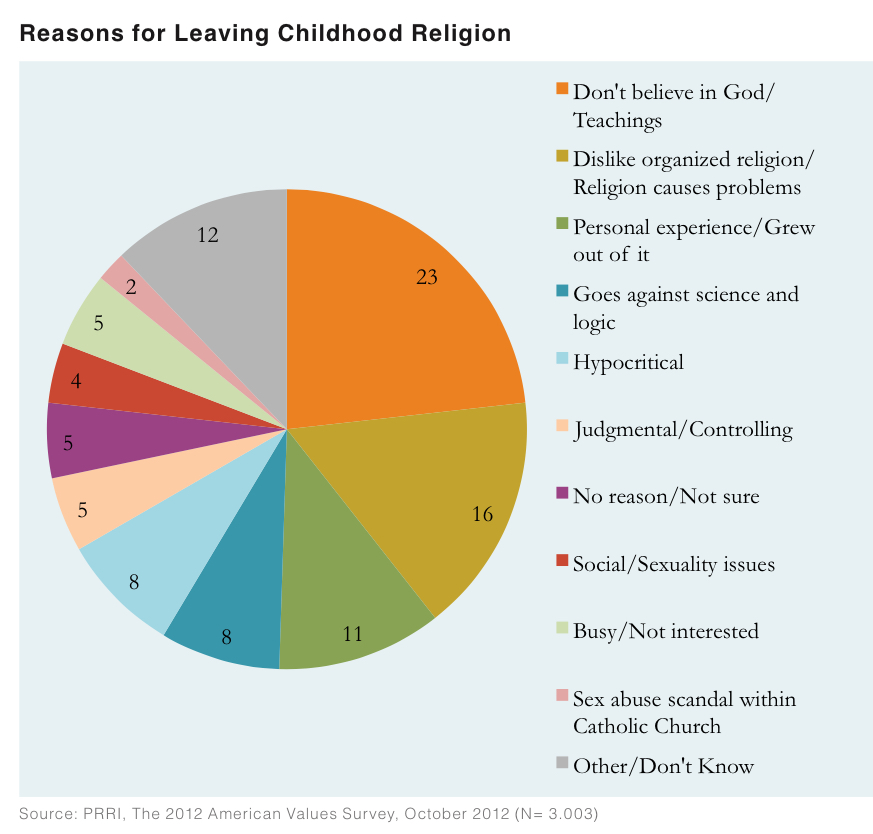
Others say that they left religion behind as they grew older: “I just grew up and saw how the world really is.” Approximately 1-in-10 (8%) disaffiliated Americans report leaving because they perceive a conflict between religion and scientific principles or logic. One respondent explains, “I just guess it’s the inability of religion to cope with scientific findings. A lot of times, when science finds fact, then religions tend to either ignore it or say it’s wrong despite the facts.” A similar number (8%) of disaffiliated Americans say that religion or religious people are hypocritical. One-in-twenty say religion is or religious people are judgmental or controlling (5%), or report that the left because they were too busy or simply not interested (5%). Four percent cite a specific social issue or issue related to sexuality. Only 2% of Americans cite the sex abuse scandal within the Catholic Church.
There are few variations among disaffiliated Americans’ reasons for leaving the religion of their childhood, with some notable exceptions. Former Catholics are more likely to cite social issues or issues related to sexuality than are other formerly affiliated Americans (9% vs. 1%). One respondent notes: “The different stands on sexuality, contraception, divorce, just make it not realistic for me to support the Church.” Only former Catholics mention the sexual abuse scandal among Catholic priests (4%).
There are also differences according to educational attainment. College graduates (29%) are more likely than Americans without a 4-year college degree (20%) to say that no longer believing in the tenets of their faith or God is the most important reason they left.
Seculars, Unattached Believers, and Atheists and Agnostics: Understanding Religiously Unaffiliated Americans
The number of Americans who claim no particular religious affiliation has more than tripled over the last two decades. In 1990, less than 1-in-10 (8%) Americans claimed no formal religious affiliation.(4) Today, roughly 1-in-5 (19%) Americans currently report that they are religiously unaffiliated. No major religious group is growing more quickly.
As the number of religiously unaffiliated Americans has increased, so has the internal diversity of this group. This survey identifies three distinct subgroups among the unaffiliated: about 4-in-10 (39%) who describe themselves as secular or not religious, about 1-in-4 (23%) who describe themselves as religious (“unattached believers”), and more than one third (36%) who identify as agnostic or atheist.(5) Importantly, each of these three groups has a distinct demographic, political, and religious profile.
Gender, Education Level, and Racial Differences
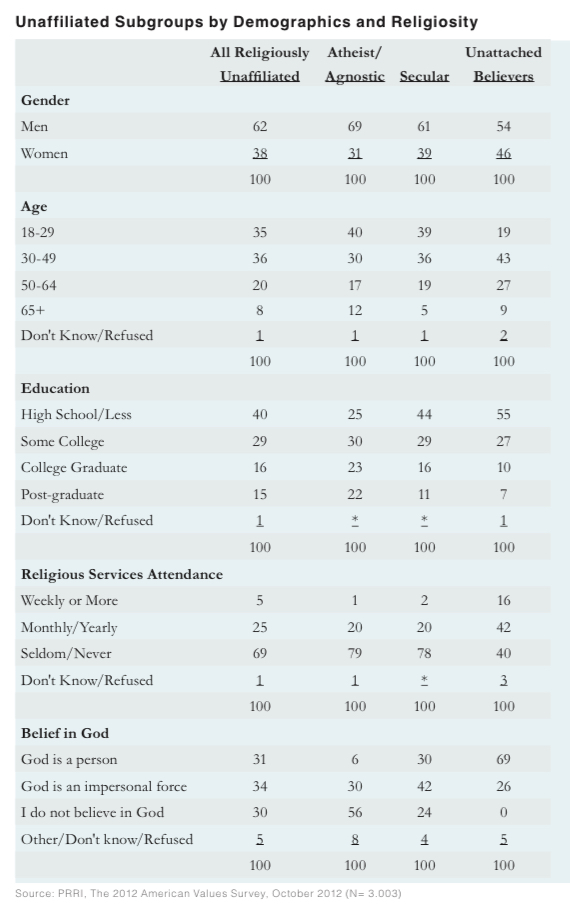
Men are generally overrepresented among the religiously unaffiliated, but they are more highly concentrated among atheists and agnostics (69% male) and secular Americans (61% male) than among unattached believers (54% male). The educational differences between these unaffiliated subgroups are large. Atheists and agnostics are significantly better educated than Americans overall. Close to half (45%) of atheists and agnostics have at least 4-year college degree, and more than 1-in-5 (22%) have a post-graduate degree. The educational profile of secular Americans does not differ significantly from the general public: 16% have a 4-year college degree, and 11% have a post-graduate degree. Unattached believers, by contrast, have much lower levels of educational attainment. While 10% have a 4-year college degree and 7% have a post-graduate degree, a majority (55%) of unattached believers have a high school education or less, compared to 42% of the general population.
The three groups’ racial and ethnic profiles are also distinct. More than three-quarters (76%) of atheists and agnostics are non-Hispanic whites, while 10% are Hispanic, and 2% are black. Among secular Americans, less than two-thirds (64%) are non-Hispanic whites, 14% are Hispanic, and 7% are black. A majority (56%) of unattached believers are non-Hispanic whites, 12% are Hispanic, and nearly 1-in-4 (23%) are black.
Religious Differences: God, the Bible, Attendance, and the Importance of Religious Identity
The religious beliefs of unaffiliated Americans are quite varied. Not surprisingly, a majority (56%) of atheists and agnostics do not believe in God, but 3-in-10 (30%) believe that God is an impersonal force, and 6% believe that God is a person with whom people can have a relationship. About one-quarter (24%) of secular Americans do not believe in God, roughly 4-in-10 (42%) say that God is an impersonal force, and 3-in-10 (30%) say God is a person. Nearly 7-in-10 (69%) unattached believers say God is a person, while more than 1-in-4 (26%) say God is an impersonal force. All unattached believers report that they believe in God.
More than 9-in-10 (92%) atheists and agnostics and nearly two-thirds of secular Americans (66%) say that the Bible is a book written by men and is not the word of God. There is less agreement among unattached believers on their view of the Bible.
Approximately 3-in-10 (31%) unattached believers say that the Bible is a book written by men and is not the word of God. Roughly one-third (31%) of unattached believers say the Bible is the word of God, but not everything in it should taken literally, and roughly one-quarter (26%) believe that the Bible is the word of God and should be taken literally, word for word (a view shared by only 1% of atheists and agnostics and 7% of secular Americans).
Patterns of religious participation also reveal a significant divide between unattached believers, secular Americans, and atheists and agnostics. Approximately 8-in-10 secular Americans (78%) and atheists and agnostics (79%) report that they seldom or never attend religious services. However, unattached believers have a much more varied pattern of religious attendance. Roughly 3-in-10 (29%) unattached believers report that they attend religious services at least once or twice a month, 28% say they attend a few times a year, and 39% report that they seldom or never attend religious services.
These three subgroups of unaffiliated Americans also evaluate the personal importance of their religious identity quite differently. Nearly 6-in-10 unattached believers report that being religious is the most important thing (13%) or very important (44%) in their life. By contrast, only 12% of secular Americans report that being secular is very important in their lives, and only 13% of atheists and agnostics report that being atheist or agnostic is very important in their lives.(6)
Political Engagement, Ideology, and Partisanship
Religiously unaffiliated Americans overall tend to be less politically engaged than religiously affiliated Americans, with the exception of atheists and agnostics. More than 4-in-10 (43%) atheists and agnostics are paying very close attention to the 2012 presidential campaign, compared to 3-in-10 secular Americans (30%) and unattached believers (30%). Atheists and agnostics (73%) are also significantly more likely than secular Americans (53%) or unattached believers (53%) to say they are absolutely certain they will vote.
Majorities of atheists and agnostics (51%), secular Americans (56%), and unattached believers (51%), report that they are politically independent. However, atheists and agnostics (39% vs. 9%), secular Americans (30% vs. 6%), and unattached believers (32% vs. 11%) are also more likely to identify with the Democratic Party rather than the Republican Party. Atheists and agnostics (57%) are, however, much more likely than secular Americans (34%) or unattached believers (23%) to identify as politically liberal.
Understanding the Complexity of American Catholics
As noted above, the Catholic share of the U.S. population has remained relatively stable, despite losing a significant number of adherents (12%) and attracting relatively few converts from other religions (2%). The primary explanation for this paradox is an influx of Catholic immigrants, mostly from central and South America. Nearly half (46%) of all immigrants coming to the U.S. identify as Catholic.(7)
This wave of immigration has transformed Catholicism in the U.S. Nearly 3-in-10 (29%) Catholics living in the U.S. are Hispanic, although the proportion differs significantly by generation and region. A majority (52%) of Catholics aged 18 to 34 are Hispanic, compared to just 11% of Catholic seniors (age 65 and older). A majority (55%) of Catholics living in the West are also Hispanic, compared to 35% of Catholics in the South, 19% of Catholics in the Northeast, and 8% of Catholics in the Midwest.
To put this into perspective, in 1991, the ratio of white Catholics to Hispanic Catholics was roughly 10-to-1: 21% of Americans identified as white Catholic, while 2% identified as Hispanic Catholic.(8) Today, that ratio is only slightly more than 2-to-1: white Catholics make up 14% of the adult population, while Hispanic Catholics constitute 6% of the adult population.
The significant number of Americans who have left the Catholic Church also means that former Catholics who are currently unaffiliated constitute a sizeable constituency, making up 6% of the general population and 5% of likely voters. They also comprise a significant portion (30%) of unaffiliated Americans overall. Among unaffiliated former Catholics, 24% are unattached believers, 36% are secular Americans, and 37% are atheists or agnostics. When combined, white Catholics, Hispanic Catholics, and unaffiliated former Catholics constitute nearly 3-in-10 (28%) Americans. However, each of these groups has a distinct religious and political profile.
Religious Differences: God, the Bible, Attendance, and the Importance of Religious Identity
There is substantial diversity in religious beliefs among American Catholics. Ethnic divisions are particularly notable. Although both Hispanic and white Catholics strongly affirm a belief in God, white Catholics are much more likely than Hispanic Catholics to believe that God is a person with whom one can have a relationship (73% vs. 55%). However, Hispanic Catholics are more likely than white Catholics to agree that it is necessary to believe in God to be moral (71% vs. 50%). Hispanic Catholics are also more likely than white Catholics to have a literal view of the Bible (36% vs. 18%). White Catholics (46%) are somewhat more likely than Hispanic Catholics (35%) to say they attend church weekly or more, although a majority (54%) of Hispanic Catholics say they attend church at least monthly, and only around 1-in-10 (11%) say they attend church seldom or never. A majority of both white Catholics (53%) and Hispanic Catholics (63%) say that being Catholic is very important or the most important thing in their life.
Not surprisingly, unaffiliated former Catholics score lower than affiliated Catholics on each of these measures of religious belief, behavior, and belonging. Unaffiliated former Catholics are less likely to affirm a belief in that God is a person (26%), with 41% believing in an impersonal God. They are also significantly less likely to say it is necessary to believe in God to be moral, and few hold a literal view of the Bible (6%). Unaffiliated former Catholics also attend church at significantly lower rates, with only 2% attending at least once a week, and 26% attending monthly or a few times a year.
Political Engagement, Ideology, and Partisanship
There are also clear differences between the political profiles of Hispanic and white Catholics. White Catholics report much greater political engagement, with nearly 8-in-10 (78%) saying they are absolutely certain to vote, compared to 52% of Hispanic Catholics. White Catholics are also more likely than Hispanic Catholics to say they are paying very close attention to the campaign (43% vs. 26%). Nearly 9-in-10 (88%) white Catholics and more than 6-in-10 (63%) Hispanic Catholics are registered to vote.
The two groups’ political profiles show a similar divide. White Catholics are about equally as likely to identify as Democrats (29%) than they are to identify as Republicans (31%), while a plurality (38%) identify as politically independent. By contrast, Hispanic Catholics are roughly four times more likely to identify with the Democratic Party as with the Republican Party (41% vs. 10%), while a plurality (45%) say they are politically independent. White Catholics are twice as likely to identify as politically conservative (42%) as politically liberal (17%), while 39% identify as politically moderate. Hispanic Catholics are only slightly more likely to identify as conservative than liberal (27% vs. 19%). Nearly half (47%) say they are moderate.
The Religious Composition of the Presidential Candidates’ Coalitions
The religious profiles of the two presidential candidates’ coalitions are unambiguously different. Governor Mitt Romney’s coalition draws heavily from the ranks of white Christians, while President Barack Obama’s coalition draws on a broad cross-section of American religious groups. Nearly 8-in-10 likely Romney voters identify as white Christian, including 37% who identify as white evangelical, 19% who identify as white mainline Protestant, and 19% who identify as white Catholic.
By contrast, Obama’s coalition relies less heavily on white Christians: only about 4-in-10 likely Obama voters identify as white Christian, including 15% who identify as white mainline Protestant, 14% who identify as white Catholic, and 9% who identify as white evangelical Protestant. Obama draws much more heavily on non-white Christians, including black Protestants (18%) and Hispanic Catholics (6%), nonChristian religious Americans (7%), and religiously unaffiliated Americans (23%).
II. Likely Voters and the 2012 Election
Overall, 8-in-10 (82%) Americans report that they are registered to vote, and 62% qualify as likely voters.(9) Generally speaking, likely voters are pessimistic about the way things are going in the country today: they are significantly more likely to say that things in the country have gotten seriously off on the wrong track (58%) than they are to say that things are going in the right direction (37%).
Most Important Issues Influencing Vote for President
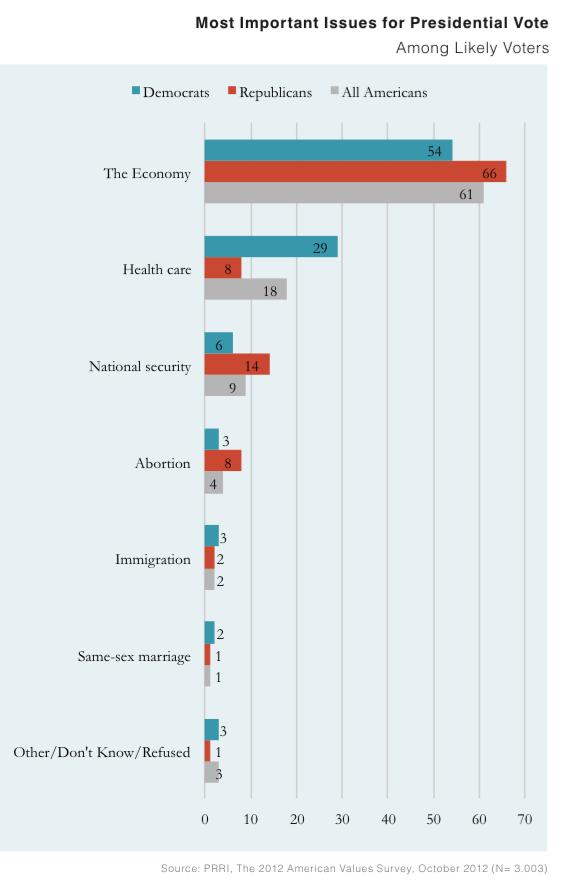
When asked to identify the most important issue for their vote for president this year, more than 6-in-10 (61%) likely voters point to the economy. Less than 1-in-5 (18%) voters mention health care, while about 1-in-10 (9%) cite national security. Less than 1-in-20 voters mention abortion (4%), immigration (2%), or same-sex marriage (1%) as the most important issue for their vote for president.
Among voters who mention the economy as the most important issue for their vote, a plurality (37%) pinpoint the lack of jobs as their most important economic issue. More than one-quarter (26%) mention the budget deficit, 16% cite the gap between right and poor, less than 1-in-10 point to taxes and social security (9%), and welfare (2%).
While there is cross-party agreement that the economy is the most important issue in the presidential election, there are differences in emphasis. Republican (66%) and independent (66%) voters are more likely than Democratic voters (54%) to say that the economy is the most important issue for their vote. Meanwhile, Democratic voters (29%) are more likely than independent (17%) or Republican (8%) voters to say that health care is the most important issue for their vote.
Among voters who cite the economy as the most important issue for their vote, Republicans (39%) and independents (29%) are substantially more likely than Democrats (10%) to point to the budget deficit. Democratic voters (28%), meanwhile, are more likely than independent (17%) and Republican (3%) voters to cite the gap between the rich and the poor.
With the exception of health care, there are few differences by religious affiliation in terms of voters’ issue priorities. Black Protestant voters (33%) are most likely to say that health care is their top issue priority, followed by 22% of religiously unaffiliated voters, 20% of Catholic voters, 15% of white mainline Protestant voters, and 13% of white evangelical Protestant voters.
2012 Presidential Vote Preferences
In late September, President Barack Obama held a four-point lead over former Governor Mitt Romney (50% vs. 46%) among likely voters, while 4% of likely voters preferred another candidate or were undecided. Among independent likely voters, the race was a dead heat: 47% supported Romney and 46% favored Obama.
The voting preference patterns among religious groups look similar to the patterns that appeared in the 2008 election. President Obama garnered significant support among black Protestant voters (97%), religiously unaffiliated voters (73%), and non-Christian religious voters (65%). By contrast, Romney held the support of more than three-quarters (76%) of white evangelical Protestant voters. A slim majority (52%) of white mainline Protestant voters also favored Romney, while 45% favored Obama. Catholic voters overall were divided, with 49% preferring Obama and 47% preferring Romney. There will be a more detailed analysis of religiously unaffiliated and Catholic voters’ preferences later in this section.
There were substantial racial divides. More than 9-in-10 (95%) black voters and roughly two-thirds (66%) Hispanic voters expressed support for Obama. Among white voters, only 41% supported Obama, while a slim majority (54%) supported Romney.
Voters in the Northeast were more likely to support Obama over Romney (55% vs. 41%), as were voters in the West (52% vs. 44%). Voters in the Midwest (48% Obama vs. 47% Romney) and South (48% Obama vs. 49% Romney) were nearly evenly divided.
Female voters were significantly more likely to support Obama (53%) than Romney (44%). Male voters were equally divided, with 48% in favor of Romney and 47% in favor of Obama. There were significant differences among women by marital status. More than three-quarters (76%) of women who have never been married supported Obama, while a majority (55%) of married women supported Romney.
There was also a large generational gap. Seven-in-ten (70%) Millennial voters (age 18-29) said that they supported Obama, while only one-quarter (27%) said they were supporting Romney. All other major age groups, including senior voters (age 65 and up), were divided in their presidential preference. Forty-nine percent of senior voters supported Romney, while 45% supported Obama.
The Catholic Vote
Catholic likely voters were, overall, divided in their support for the presidential candidates: 49% preferred Obama, while 47% favored Romney. However, the Catholic vote is highly complex, and there were significant divisions among Catholics on this question. White Catholic voters were more likely than Catholic voters overall to prefer Romney (54%) over Obama (42%).(10)
Catholics’ voter preferences were also divided by frequency of church attendance. Catholic voters who attend church weekly or more supported Romney over Obama (59% vs. 37% respectively). Catholic voters who attend church once a month or less were a mirror image of Catholic voters who attend church more frequently; about 6-in-10 (59%) reported supporting Obama, while 35% said they supported Romney.
Attitudes toward change and tradition within the Catholic Church are correlated with Catholic voters’ presidential preferences. There were strong differences between the 38% of Catholic voters who say that their church or denomination should preserve its traditional beliefs and practices (“traditionalist Catholics”) and the 57% of Catholic voters who say that their church or denomination should either adjust its traditional beliefs in light of new circumstances or adopt modern beliefs and practices (“adaptive Catholics”). Traditionalist Catholic voters were more likely to support Romney, while adaptive Catholic voters were more likely to support Obama. More than 6-in-10 (61%) adaptive Catholic voters expressed support for Obama, while more than one-third (36%) supported Romney. By contrast, more than 6-in-10 (63%) traditionalist Catholic voters supported Romney, while roughly 3-in-10 (31%) expressed support for Obama.
The relative importance of Catholic identity also divided Catholic voters, although Catholic identity was less correlated with voting preferences than were attitudes toward change and tradition. Nearly 6-in-10 (57%) Catholic voters report that their Catholic identity was either very important or the most important thing in their lives (“higher identity Catholics”), compared to 43% of Catholic voters who say that their Catholic identity is somewhat important, not too important, or not at all important (“lower identity Catholics”). A majority (54%) of higher identity Catholics supported Romney, while 43% supported Obama. By contrast, a majority (56%) of lower identity Catholics favored Obama, while 37% supported Romney.
There has been an ongoing debate within Catholic circles about two kinds of public policy emphasis: one focused on social justice and a tradition of Catholic social teaching (“social justice Catholics”), and one focused on the right to life (“right to life Catholics”). These orientations also divide Catholic voters and are strongly correlated with vote preference. Among all Catholic voters, 63% believe that in its statements about public policy, the Catholic Church should focus more on social justice and the obligation to help the poor, even if it means focusing less on issues like abortion and the right to life. Nearly 3-in-10 (28%) Catholic voters affirm the opposite, saying that in its public statements, the Catholic Church should focus more on abortion and the right to life, even if means focusing less on issues like social justice and the obligation to help the poor. The voting preferences of these two groups were strikingly different. Obama held a 23-point lead over Romney among social justice Catholic voters (60% vs. 37%). By contrast, Romney held a 40-point lead over Obama among right-to-life Catholic voters (67% vs. 27%).
Consistent with the gender gap seen among likely voters overall, Catholic women were more likely to support Obama (54%) over Romney (42%). The reverse was true of Catholic men: more than half (54%) of Catholic men supported Romney, while 42% supported Obama.
The Unaffiliated Vote
Obama (73%) held a large lead over Romney (22%) among religiously unaffiliated likely voters overall. More than 8-in-10 (81%) atheists and agnostic voters supported Obama, as did 67% of secular voters.
Although strong majorities of religiously unaffiliated male and female voters supported Obama over Romney, Obama’s advantage among women was also evident here. More than 8-in-10 (84%) religiously unaffiliated women supported Obama, while 15% supported Romney. Among religiously unaffiliated men, two-thirds (67%) supported Obama, compared to 26% who supported Romney.
The White Working-Class Vote
Among white working-class voters overall, Romney held a 21-point lead over Obama (58% vs. 37%). White college-educated voters were divided: half (49%) supported Obama, while 48% supported Romney.
Romney’s advantage among white working-class voters varied significantly by region. White working-class voters in the South preferred Romney over Obama by a roughly 2-to-1 margin (65% vs. 32%). Romney also held a significant lead over Obama among white working-class voters in the West (60% vs. 36%) and Northeast (54 vs. 38%). The race was a statistical dead heat among white working-class voters in the Midwest (51% vs. 43%).
White working-class voters were also divided by religion. Nearly two-thirds (66%) of white working-class Protestant voters supported Romney, while 3-in-10 (30%) supported Obama. By contrast, neither candidate held a statistically significant lead among white working-class Catholic voters: 53% supported Romney, while 43% supported Obama.
Views of the Candidates
President Obama’s Job Approval
Nearly half (48%) of Americans approve of the way President Obama is handling his job as President, while 43% disapprove of Obama’s job performance. These overall divisions, however, mask deep rifts along partisan and racial lines. Nearly 9-in-10 (87%) Democrats approve of the way Obama is handling his job as president, while a similar percentage of Republicans (86%) disapprove of Obama’s job performance. Independents are divided: 42% approve and 44% disapprove.
Nearly 9-in-10 (89%) black Americans and a majority (56%) of Hispanic Americans approve of President Obama’s job performance. By contrast, a majority (53%) of white Americans disapprove of the way Obama is handling his job as president.
Favorability
The Presidential Candidates
Americans are more likely, overall, to hold a favorable opinion of Obama than they are to hold a favorable opinion or Romney. A majority (56%) of Americans have a favorable opinion of Obama, while 42% hold an unfavorable opinion. By contrast, 43% of Americans have a favorable view of Romney, while a majority (53%) have an unfavorable opinion.
Perhaps unsurprisingly, Americans are highly politically polarized in their views of the two candidates. Nearly 9-in-10 (88%) Republicans have a favorable view of Romney, while a similar number (93%) of Democrats have a favorable view of Obama. Independents are more likely to have a favorable view of Obama (55%) than they are to hold a favorable view of Romney (43%).
There is a clear racial divide in Americans’ views of the two presidential candidates. More than 9-in-10 (94%) black Americans and 7-in-10 (70%) Hispanic Americans say they hold a favorable opinion of Obama. Among white Americans, less than half (47%) hold a favorable view of Obama, while a majority (52%) say they view the president unfavorably. By contrast, a majority (53%) of white Americans have a favorable view of Mitt Romney, while nearly 9-in-10 (86%) black Americans and more than 6-in-10 (63%) Hispanic Americans view the GOP nominee unfavorably.
There is a sharp generational gap in Americans’ views of the two candidates. Millennials (33%) are less likely than seniors (50%) to have a favorable opinion of Romney. By contrast, seniors (49%) are less likely than Millennials (67%) to have a favorable opinion of Obama. There are no differences by gender in candidate favorability.
The Vice Presidential Candidates
Americans are divided in their opinions of the vice presidential candidates. Forty-four percent of Americans hold a favorable opinion of Vice President Joe Biden, while nearly equal numbers (45%) hold an unfavorable view. Forty percent of Americans hold a favorable view of vice presidential candidate Paul Ryan, compared to 43% who hold an unfavorable opinion. Political independents, like Americans overall, are divided: 39% have a favorable view of Biden, while 45% have an unfavorable view. Similarly, 38% of independents have a favorable view of Ryan, while 44% have an unfavorable opinion of the Republican vice presidential nominee.
One unique feature of the 2012 presidential contest is the presence of two Catholic vice presidential candidates. Catholics overall hold divided opinions about both candidates. Pluralities of Catholics say they have an unfavorable view of both Biden (47%) and Ryan (44%). White Catholics are also divided in their opinion of the two vice presidential candidates.
Understanding Americans’ Problems
A majority of Americans (55%) agree that Obama better understands the problems of people like them, while 35% say the same of Romney. There are significant divisions in the perceptions of Americans by party affiliation, race, religious affiliation, and age.
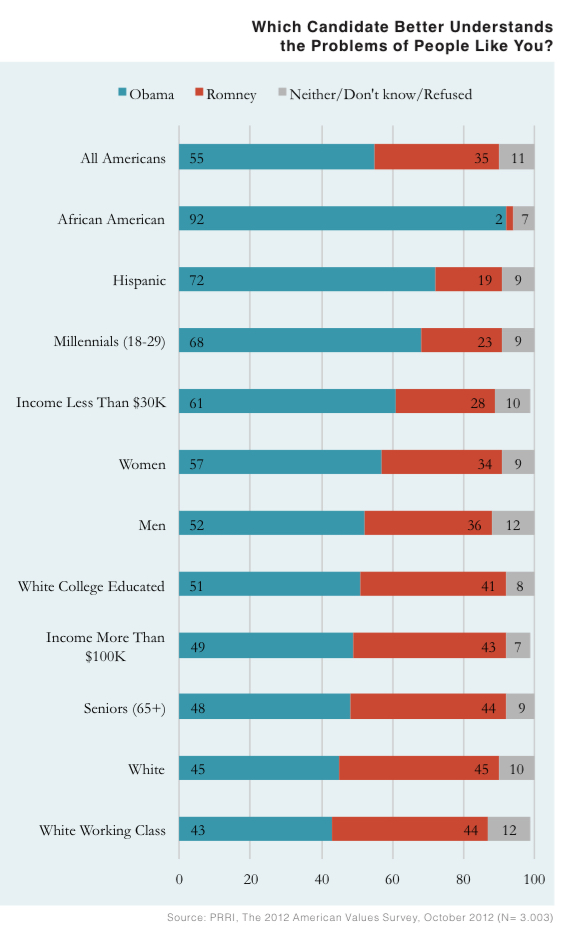
Partisans on both sides of the aisle believe that their nominee better understands the problems of people like them. More than 9-in-10 (92%) Democrats say that Obama better understands the problems of people like them, while nearly 8-in-10 (79%) Republicans say that Romney better understands the problems of people like them. A slim majority (52%) of independents say that Obama better understands the problems of people like them, while one-third (33%) say the same of Romney.
Strong majorities of black (92%) and Hispanic (72%) Americans say Obama best understands the problems of people like them. White Americans overall are divided over whether Obama (45%) or Romney (45%) better understands the problems of people like them. There are some divisions by class: a slim majority (51%) of white college-educated Americans say that Obama better understands the problems of people like them, compared to Romney (41%). White working-class Americans are nearly evenly divided, with 43% saying that Obama better understands the problems of people like them, while 44% say the same of Romney.
Seven-in-ten (70%) religiously unaffiliated Americans say that Obama better understands the problems of people like them. Among religious groups, more than 9-in-10 (92%) black Protestants and 57% of Catholics believe that Obama better understands the problems of people like them. White Catholics are divided: 47% say that Obama better understands the problems of people like them, while 45% say the same of Romney. More than 6-in-10 (62%) white evangelical Protestants say that Romney better understands the problems of people like them.
There are no differences by gender overall. However, white women who have never been married (67%) are more likely than married white women (39%) to say that Obama better understands the problems of people like them. A majority (52%) of married white women say that Romney better understands the problems of people like them.
Millennials (68%) are more likely than seniors (48%) to say that Obama better understands the problems of people like them.
The Candidates’ Religious Beliefs
Americans are more likely to believe that both candidates’ religious beliefs are different from, rather than similar to, their own. Nearly half (49%) of Americans say that Obama’s religious beliefs are somewhat or very different from their own, while approximately 4-in-10 (41%) say that Obama’s beliefs are somewhat or very similar to their own. A majority (53%) of Americans say that Romney’s religious beliefs are somewhat or very different from their own, while 34% say that Romney’s beliefs are somewhat or very similar to their own. Roughly 1-in-10 Americans say they do not know Obama’s religious beliefs (11%) or Romney’s religious beliefs (12%).
Perceptions of the candidates’ religious beliefs track with political affiliation. Nearly 6-in-10 (59%) Republicans say that Romney’s religious beliefs are similar to their own, while nearly two-thirds (66%) of Democrats say that Obama’s religious beliefs are similar to their own. By contrast, majorities of independents say that both Obama’s (52%) and Romney’s (54%) religious beliefs are different from their own.
Black and Hispanic Americans are more likely to see Obama’s beliefs as similar to their own than they are to see Romney’s beliefs as similar to their own. More than three-quarters (76%) of black Americans and a slim majority (51%) of Hispanic Americans say that Obama’s religious beliefs are similar to their own. Nearly 3-in- 10 (29%) Hispanic Americans and 1-in-5 (20%) black Americans say Romney’s religious beliefs are similar to their own. A majority (56%) of white Americans say that Obama’s religious beliefs are different from their own. White Americans are more divided in their views about Romney’s religious beliefs (50% say they are different, 40% say they are similar).
Most religious groups are divided in their assessments of the candidates’ religious beliefs, with two exceptions. A majority (69%) of white evangelical Protestants say that Obama’s religious beliefs are different from their own, while remaining divided about Romney’s religious beliefs (45% different, 46% similar). At the other not of the political spectrum, seven-in-ten (70%) black Protestants say that Romney’s religious beliefs are different from their own, while nearly 8-in-10 (79%) say that Obama’s religious beliefs are similar to their own. White mainline Protestants and Catholics are largely divided in their assessments of both candidates’ religious beliefs.
III. Issues and the 2012 Election
Religious Liberty and the Contraception Coverage Requirement
Earlier this year, the Obama administration mandated that most employers – including religiously affiliated organizations, such as colleges, hospitals, and social service agencies – provide their employees with health care plans that cover contraception or birth control at no cost. This decision sparked a protest from some religious leaders, particularly the American Catholic bishops, who claimed that this policy was a violation of the religious liberty of religiously affiliated organizations who hold theological objections to contraception. To better understand opinions about this debate, the survey asked a general question about religious liberty, along with specific questions about the contraception mandate policy. The survey reveals that while a majority of Americans are concerned about threats to religious liberty in America today, most also believe that religiously affiliated colleges and hospitals should be required to provide health plans that cover contraception at no cost, even if those institutions have religious objections to contraception.
Concerns About Religious Liberty
Nearly 6-in-10 (57%) of Americans agree that the right of religious liberty is being threatened in America today, while 42% disagree.
There are large partisan divides on whether religious liberty is under threat. Approximately 8-in-10 (82%) of Americans who identify with the Tea Party and roughly three-quarters (77%) of Republicans believe that religious liberty is being threatened in America today, compared to 55% of independents and 44% of Democrats.
Among religious groups, white evangelical Protestants (79%) are more likely than white Catholics (58%), white mainline Protestants (56%), black Protestants (54%), and Hispanic Catholics (53%) to say that the right of religious liberty is being threatened in America today, although majorities of all religious groups agree with this statement.
More than 6-in-10 (61%) religiously unaffiliated Americans disagree, saying that religious liberty is not being threatened in America today. However, there are some variations among religiously unaffiliated Americans. A majority (54%) of unattached believers agree that the right of religious liberty is under threat in America today, compared to less than 4-in-10 (39%) secular Americans and less than one-quarter (23%) of atheists and agnostics. Three-quarters (75%) of atheists and agnostics and nearly 6-in-10 (59%) secular Americans believe that religious liberty is not under threat.
Majorities of black Americans (55%), Hispanic Americans (52%), and white Americans (60%) believe the right of religious liberty is under attack in America today. However, white working-class Americans (65%) are significantly more likely than white college-educated Americans (46%) to say that religious liberty is being threatened.
Religiously Affiliated Colleges and Hospitals
Despite the concerns about religious liberty evident above, a majority (56%) of Americans agree that religiously affiliated colleges and hospitals should be required to provide their employees with health care plans that that cover contraception or birth control at no cost, while 4-in-10 (40%) Americans disagree. Notably, even when the question explicitly notes that some colleges and hospitals have religious objections to this policy, the same number of Americans (56%) agree that religiously affiliated colleges and hospitals should be required to provide health care plans that cover no-cost birth control.
There are notable religious differences on this question. Nearly 8-in-10 (77%) black Protestants and approximately two-thirds (66%) of religiously unaffiliated Americans agree that religiously affiliated colleges and hospitals should be required to provide their employees with health care plans that cover birth control at no cost. Majorities of white mainline Protestants (56%) and Catholics overall (54%) also agree with this statement. However, white Catholics are divided, with 45% agreeing that employers should be required to provide employees with plans that cover contraception, while a slim majority (51%) disagree. A majority (56%) of white evangelical Protestants disagree that religiously affiliated colleges and hospitals should be required to comply with this rule, while 40% agree. Across religious traditions, these numbers are virtually unchanged when religiously affiliated colleges and hospitals’ religious objections are taken into account.
There are strong partisan divisions. Three-quarters (75%) of Democrats and a majority (56%) of independents agree that religiously affiliated colleges and hospitals should be required to provide birth control to their employees at no cost through their health insurance plans, while almost two-thirds (65%) of Republicans disagree. When religiously affiliated colleges and hospitals’ religious objections are taken into account, these numbers remain nearly unchanged.
Black (78%) and Hispanic (61%) Americans are more likely than white Americans (50%) to believe that religiously affiliated colleges and hospitals should be required to comply with the contraception coverage requirement. Nearly half (46%) of white Americans say that religiously affiliated colleges and hospitals should be exempt. There are no differences between white working-class Americans and white college-educated Americans on this question.
Women (62%) are more likely than men (50%) to agree that religiously affiliated colleges and hospitals should be required to provide their employees with health insurance plans that provide birth control at no cost. This gap persists even when these institutions’ religious objections are taken into account. There are also differences in intensity among women: women who have never been married (74%) are more likely than married women (56%) to agree that religiously affiliated colleges and hospitals should be required to comply with this rule.
Millennials (ages 18-29) are more likely than seniors (ages 65 and up) to agree that religiously affiliated colleges and hospitals should be required to provide no-cost birth control to their employees (67% vs. 41%). A majority (52%) of seniors disagree, saying that religiously affiliated colleges and hospitals should not be required to provide this service. Similarly, Millennials are no less inclined to believe that religiously affiliated institutions should be exempted from this requirement if they have religious objections.
The belief that religious liberty is under threat does not directly translate into opposition to the contraception coverage rule. Nearly 6-in-10 (59%) of Americans who completely agree that religious liberty is under threat believe that religiously affiliated colleges and hospitals should be exempted from this requirement, compared to only 43% of Americans who mostly agree that religious liberty is under threat. Majorities of Americans who mostly disagree (65%), and completely disagree (74%) that religious liberty is being threatened in America today also believe that religiously affiliated colleges and hospitals should be required to provide their employees with health insurance plans that provide birth control at no cost.
Churches and Other Places of Worship
While most Americans agree that colleges and hospitals should be required to provide their employees with no-cost birth control through their health insurance plans, Americans are divided on whether churches and other places of worship should also be required to provide this coverage to their employees. Half (50%) of Americans say they should not, while 45% disagree. Americans are similarly divided on whether churches and other places or worship should be required to comply with these requirements, even if they have religious objections: 48% agree, while 48% disagree.
Most religiously affiliated Americans, with the exception of black Protestants, agree that churches and other places of worship should be exempted from the contraception coverage requirement. Majorities of white evangelical Protestants (62%), white Catholics (60%), and Catholics overall (53%) agree that churches and other places of worship should not be required to provide no-cost birth control to their employees through their health insurance plans. White mainline Protestants are divided, with half (50%) agreeing that churches and other places of worship should be exempted from this requirement, and 47% saying they should not. Nearly two-thirds (65%) of black Protestants and a slim majority (52%) of religiously unaffiliated Americans agree that churches and other places of worship should not be exempted.
Economic Policies: Entitlement Programs, Taxes, and Health Care Reform
Government Policies to Help the Poor
One of the sharpest points of disagreement in American political debates today hinges on the efficacy of government social welfare programs. Overall, by a margin of nearly 2-to-1, Americans agree that government policies aimed at helping the poor serve as a crucial safety net which helps people in hard times get back on their feet (63%), rather than creating a culture of dependency where people are provided with too many handouts (32%).
Americans from different political backgrounds view the government’s role quite differently. More than 8-in-10 (83%) Democrats and more than 6-in-10 (63%) independents agree that government policies aimed at helping the poor serve as a crucial safety net. A majority of Republicans (55%) and Americans who identify with the Tea Party (57%) say that government policies aimed at helping the poor create a culture of dependency, while roughly 4-in-10 Republicans (40%) and Tea Party members (37%) say these policies serve as a crucial safety net.
Although majorities of Americans from all racial and ethnic backgrounds agree that government policies aimed at helping the poor serve as a crucial safety net, rather than creating a culture of dependency, there are some variations in intensity. More than 8-in-10 (84%) black Americans and 7-in-10 (70%) Hispanic Americans agree that government policies aimed at helping the poor serve as a crucial safety net, compared to approximately 6-in-10 (59%) white Americans. There are no differences between white working-class and white college-educated Americans on this question.
Majorities of Americans from all religious groups agree that government policies aimed at helping the poor serve as a safety net, although there are, once again, varying degrees of intensity. More than 8-in-10 (84%) black Protestants and more than 7-in-10 (71%) Hispanic Catholics agree that government policies aimed at helping the poor serve as a crucial safety net. More than 6-in-10 religiously unaffiliated Americans (67%) and white Catholics (61%) also agree with this statement, as do 6-in-10 (60%) white mainline Protestants. White evangelical Protestants are more divided, with a slim majority (52%) agreeing that government policies aimed at helping the poor serve as a crucial safety net. However, more than 4-in- 10 (42%) white evangelical Protestants believe that these policies create a culture of dependency.
There are no differences between men and women overall on this question. However, women who have never been married (77%) are more likely than unmarried men (67%), married women (59%), and married men (53%) to believe that government policies aimed at helping the poor serve as a critical safety net.
Welfare Recipients
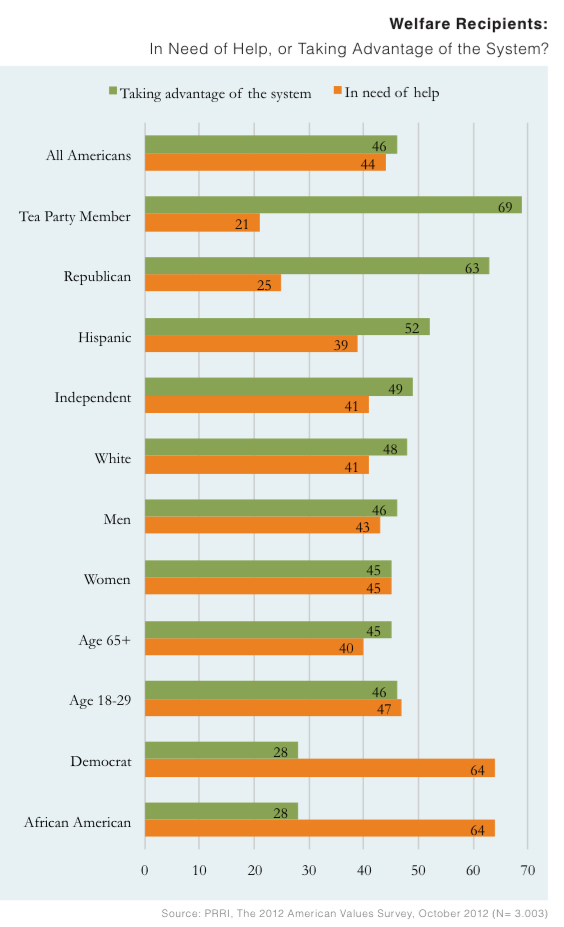
Despite Americans’ overall belief that government policies aimed at helping the poor serve as a crucial safety net, they are divided on whether most people who receive welfare payments are genuinely in need of help (44%) or taking advantage of the system (46%).
There are strong partisan divides in views about the legitimacy of the needs of most welfare recipients. More than 6-in-10 (63%) Republicans believe that most people who receive welfare payments are taking advantage of the system, while a similar number (64%) of Democrats disagree, saying that most people who receive welfare payments are genuinely in need of help. Like Americans overall, political independents are more divided: nearly half (49%) say that most people who receive welfare payments are taking advantage of the system, while 41% believe that most people who receive welfare payments are genuinely in need of help.
Black Americans (64%) are substantially more likely than white (41%) or Hispanic (39%) Americans to say that most people who receive welfare payments are genuinely in need of help. A majority (52%) of Hispanic Americans and nearly half (48%) of white Americans disagree, saying that most people who receive welfare payments are taking advantage of the system.
A majority (54%) of white college-educated Americans say that most people who receive welfare payments are genuinely in need of help, while less than 4-in-10 (36%) say they are taking advantage of the system. By contrast, a majority (53%) of white working-class Americans say that most people who receive welfare payments are taking advantage of the system, while more than one-third (35%) say they are genuinely in need of help.
More than 6-in-10 (61%) black Protestants and a majority (55%) of religiously unaffiliated Americans agree that most people who receive welfare payments are genuinely in need of help. By contrast, a majority (56%) of white evangelical Protestants believe that most people who receive welfare payments are taking advantage of the system. Hispanic Catholics, white Catholics, and white mainline Protestants are divided.
Although there are no differences between the view of men and women, there is a significant marriage gap among women. Nearly 6-in-10 (58%) women who have never been married say that people who receive welfare payments are genuinely in need of help, compared to 4-in-10 (40%) married women.
Increasing the Tax Rate on Wealthy Americans
More than 6-in-10 (61%) Americans support increasing the tax rate on those earning more than $250,000 a year, while 36% disagree.
There are notable political divisions. Six-in-ten (60%) Republicans oppose raising the tax rate on Americans making more than $250,000 a year. By contrast, 8-in-10 (80%) Democrats and more than 6-in-10 (61%) independents support this policy.
Majorities of all religious groups, with the exception of white evangelical Protestants, favor raising the tax rate on wealthier Americans. Strong majorities of religiously unaffiliated Americans (70%), white mainline Protestants (65%), black Protestants (64%), Hispanic Catholics (64%), and white Catholics (59%) favor raising the tax rate on Americans making more than $250,000 a year. White evangelical Protestants are divided: 49% favor this policy, while 47% are opposed.
The 2010 Health Care Law
Americans are divided on whether the 2010 health care law should be repealed and eliminated. Nearly half (49%) of Americans oppose repealing and eliminating the 2010 health care law, while 41% are in favor, and 11% say they do not know.
Among likely voters who say that health care is the most important thing to their presidential vote this year, 63% oppose repealing and eliminating the health care law, compared to 28% who favor repeal.
Nearly 6-in-10 (58%) black Americans oppose repealing and eliminating the 2010 health care law. Roughly half (49%) of Hispanic Americans oppose repealing the health care law while 4-in-10 (40%) say they support this action. White Americans are divided: 47% oppose repealing and eliminating the 2010 health care law, and 44% are in favor.
There are substantial political divisions on whether the 2012 health care law should be repealed and eliminated. Nearly two-thirds (65%) of Democrats oppose repealing and eliminating the 2010 health care law, while more than 6-in-10 Republicans (63%) and Tea Party members (66%) favor this move. Nearly half (49%) of independents oppose repealing and eliminating the 2010 health care law, while 4-in-10 (40%) favor this action.
Nearly 6-in-10 (58%) black Protestants and at least half of religiously unaffiliated Americans (51%) and white mainline Protestants (50%) oppose repealing and eliminating the 2010 health care law. Nearly half (49%) of Catholics overall oppose repealing and eliminating the 2010 health care law, while white Catholics are divided (48% oppose, 44% favor). A slim majority (52%) of white evangelical Protestants favor repealing and eliminating the 2010 health care law.
Social Policies
Same-sex Marriage
Americans are divided on whether gay and lesbian couples should be permitted to marry legally: 49% favor same-sex marriage, while 45% are opposed.
More than 6-in-10 (64%) Democrats and a majority (52%) of independents favor same-sex marriage. By contrast, 7-in-10 Republicans (70%) and Tea Party members (70%) oppose allowing gay and lesbian couples to marry legally.
Half (50%) of white Americans favor allowing gay and lesbian couples to marry legally, while 48% of Hispanic Americans and 39% of black Americans say the same. A majority (54%) of black Americans oppose same-sex marriage. There are also differences by social class among white Americans: roughly 6-in-10 (59%) white college-educated Americans believe that gay and lesbian couples should be allowed to marry legally, compared to less than half (45%) white working-class Americans.
There are religious groups on both sides of the same-sex marriage debate. A majority of white mainline Protestants (56%) and Catholics overall (54%) believe that gay and lesbian couples should be permitted to marry legally. Majorities of both white Catholics (54%) and Hispanic Catholics (57%) support same-sex marriage.
Nearly three-quarters (73%) of white evangelical Protestants and a majority (58%) of black Protestants oppose same-sex marriage. Nearly three-quarters (74%) of religiously unaffiliated Americans favor same-sex marriage. Within this group, however, there are differences in intensity. Atheists and agnostics (89%) are more likely than secular Americans (70%) and unattached believers (57%) to favor allowing gay and lesbian couples to marry legally.
Women (52%) are more likely than men (44%) to believe that gay and lesbian couples should be permitted to marry legally. However, there are substantial differences in intensity by marital status: women who have never been married (73%) are more likely than married women (44%) to favor same-sex marriage.
There is also a sizeable generation gap. Millennials (age 18-29) are more than twice as likely as seniors (age 65 and older) to support allowing gay and lesbian couples to marry legally (68% vs. 31%).
Abortion
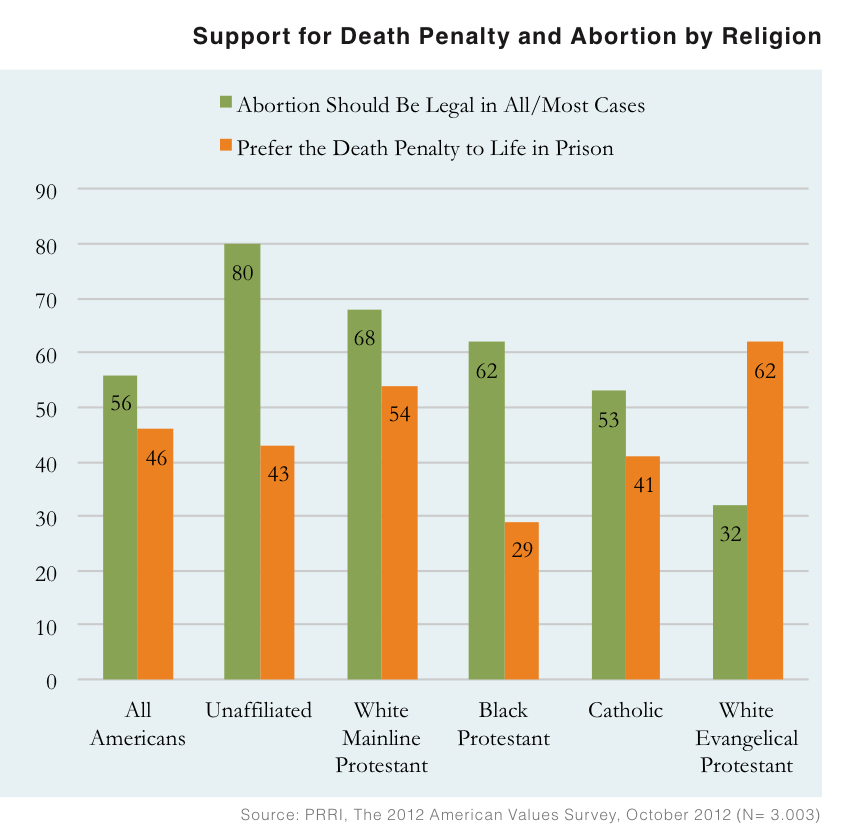
A majority (56%) of Americans believe that abortion should be legal in all or most cases, while nearly 4-in-10 (39%) say that abortion should be illegal in all or most cases.
Nearly three-quarters (74%) of Democrats and a majority (57%) of independents agree that abortion should be legal in all or most cases. By contrast, more than 6-in- 10 (63%) Republicans believe that abortion should be illegal in all or most cases.
Black (64%) and white (57%) Americans are more likely than Hispanic Americans (45%) to believe that abortion should be legal in all or most cases. A slim majority (51%) of Hispanic Americans say that abortion should be illegal in all or most cases. There are also some differences by social class among white Americans. White college-educated Americans (63%) are more likely than white working-class Americans (53%) to believe that abortion should be legal in all or most cases.
With the exception of white evangelical Protestants and Hispanic Catholics, majorities of all religious groups believe that abortion should be legal in all or most cases. Eight-in-ten (80%) religiously unaffiliated Americans, approximately two-thirds of white mainline Protestants (68%), more than 6-in-10 (62%) black Protestants, and a majority of white Catholics (56%) and Catholics overall (53%) believe that abortion should be legal in all or most cases. By contrast, nearly two-thirds (64%) of white evangelical Protestants and a majority (55%) of Hispanic Catholics believe that abortion should be illegal in all or most cases.
Death Penalty vs. Life in Prison
Americans are divided on whether people convicted of murder should be given the death penalty (46%) or life in prison with no chance of parole (47%). Americans’ attitudes toward their preferences are intense: nearly 4-in-10 (39%) Americans say they feel strongly about the death penalty being given to people convicted of murder, while less than 1-in-10 (7%) say they favor the death penalty, but not strongly. Meanwhile, more than one-third (35%) of Americans say they feel strongly about life in prison without parole being given to people convicted of murder, while approximately 1-in-10 (11%) say they favor life in prison without parole, but do not feel strongly about it.
Roughly 6-in-10 Republicans (59%) and Tea Party members (61%) favor the death penalty for people convicted of murder, while around the same number (57%) of Democrats believe that people convicted of murder should receive life in prison with no possibility of parole. Independents are divided: 46% favor the death penalty for people convicted of murder, while 48% prefer the punishment of life in prison with no possibility of parole.
There are sizeable racial divides on the appropriate punishment for people convicted of murder. Majorities of black (64%) and Hispanic (56%) Americans say that people convicted of murder should receive life in prison with no chance of parole, while a majority (53%) of white Americans say that people convicted of murder should receive the death penalty. There are some divisions among white Americans on this question. Nearly 6-in-10 (58%) white working-class Americans prefer the death penalty for people convicted of murder, while more than 4-in-10 (41%) favor life in prison with no chance of parole. By contrast, a majority (54%) of white college-educated Americans favor life in prison with no chance of parole for people convicted of murder, while around 4-in-10 (41%) prefer the death penalty.
More than 6-in-10 (62%) white evangelical Protestants and a majority (54%) of white mainline Protestants prefer the death penalty for people convicted of murder. By contrast, nearly two-thirds (64%) of black Protestants and a majority of Catholics (52%) and religiously unaffiliated Americans (52%) favor life in prison with no chance of parole. Hispanic Catholics (59%) are more likely than white Catholics (48%) to prefer life in prison with no chance of parole for people convicted of murder.
Men (51%) are more likely than women (41%) to say that people convicted of murder should receive the death penalty. A majority (52%) of women say that people convicted of murder should be given life in prison with no chance of parole. There is also a sizeable marriage gap. Women who have never been married (66%) are more likely than men who have never been married (50%), married women (49%), and married men (36%) to favor life in prison with no chance of parole.
Millennials (55%) are more likely than seniors (45%) to believe that people convicted of murder should be given life in prison with no possibility of parole.
Marijuana Policy
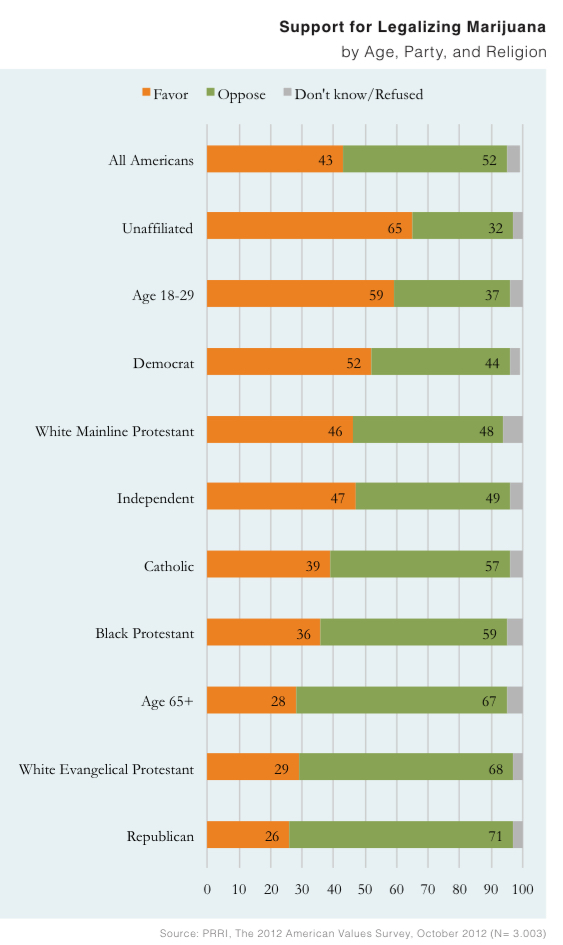
A slim majority (52%) of Americans oppose making marijuana legal in the United States, while 43% favor this move. There are no substantial differences on this question by race or social class.
Democrats (52%) are twice as likely as Republicans (26%) to favor making marijuana legal in the United States. More than 7-in-10 (71%) Republicans oppose legalizing marijuana. Independents are divided: 47% favor legalizing marijuana, while 49% are opposed.
Religiously unaffiliated Americans are substantially more likely than religiously affiliated Americans to favor the legalization of marijuana. Majorities of atheists and agnostics (71%), secular Americans (67%), and unattached believers (55%) favor the legalization of marijuana. By contrast, white mainline Protestants are divided (46% favor, 48% opposed), while majorities of Catholics (57%), black Protestants (59%), and white evangelical Protestants (68%) oppose the legalization of marijuana.
Men (48%) are more likely than women (39%) to favor legalizing marijuana. Men who have never been married are among the most supportive groups: more than 6-in-10 (62%) men who have never been married favor legalizing marijuana, compared to 52% of women who have never been married, 4-in-10 (40%) married men, and one-third (33%) of married women.
Millennials (59%) are more than twice as likely as seniors (28%) to favor making marijuana legal in the United States.
IV. Morality of Issues and Worldview
Morality of Public Policy Issues
Sex Between Two Adults of the Same Gender
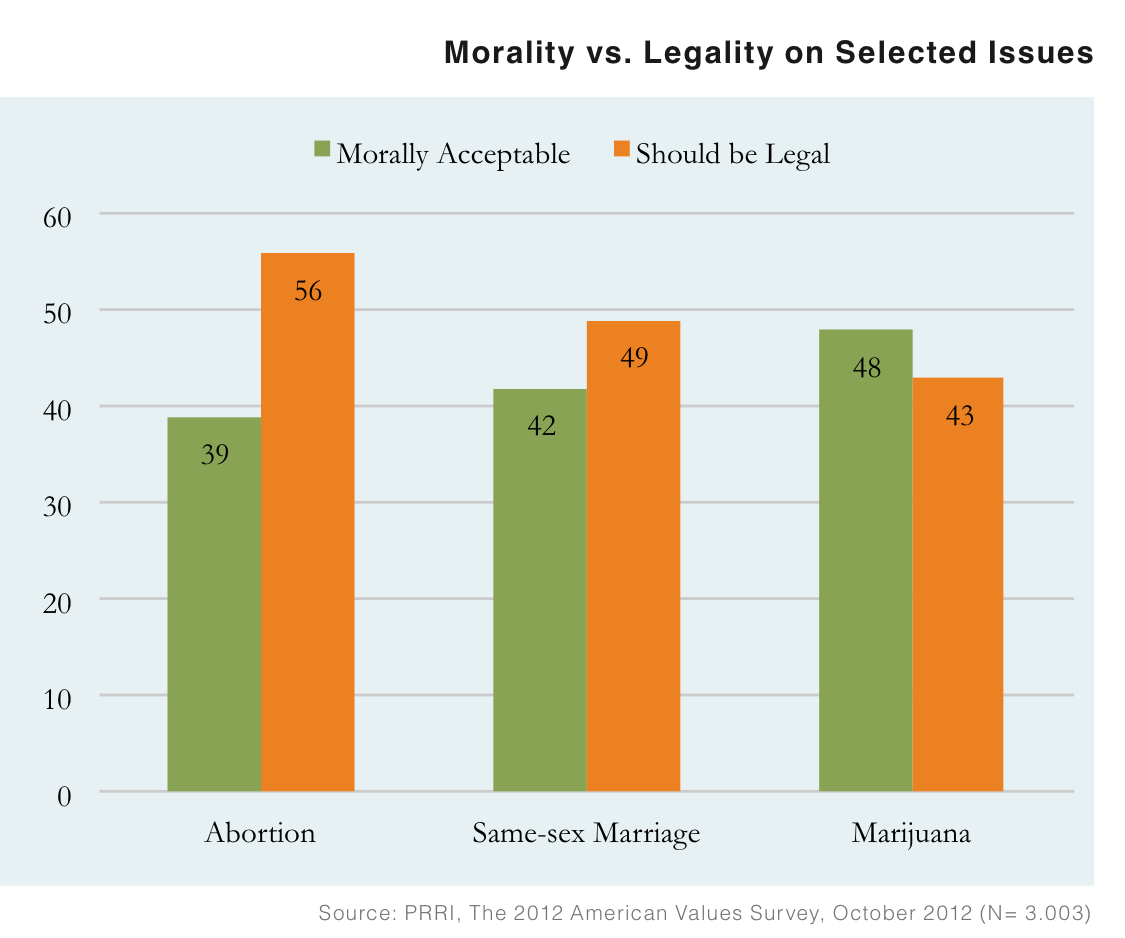
A slim majority (52%) of Americans agree that sex between two adults of the same gender is morally wrong, while 42% say this is morally acceptable. Groups that support the legality of same-sex marriage are also more likely to say they believe sex between two adults of the same gender is morally acceptable, but support for legality is typically higher than support for morality.
Majorities of white evangelical Protestants (80%) and black Protestants (74%) agree that sex between two adults of the same gender is morally wrong, while Catholics (44% morally acceptable, 47% morally wrong) and white mainline Protestants (47% morally acceptable, 44% morally wrong) are divided. Nearly three-quarters (74%) of religiously unaffiliated Americans say that sex between two adults of the same gender is morally acceptable.
Abortion
A slim majority (51%) of Americans believe that having an abortion is morally wrong, while nearly 4-in-10 (39%) believe that having an abortion is morally acceptable. Seven percent volunteer that it depends on the situation. Groups that support the legality of abortion are also more likely to say they believe having an abortion is morally acceptable, but support for legality is uniformly higher than support for morality.
With the exception of white mainline Protestants, who are divided, majorities of all religious groups agree that having an abortion is morally wrong. There are, however, some variations in intensity. Nearly 7-in-10 (69%) white evangelical Protestants, nearly 6-in-10 (57%) Catholics, and a slim majority (51%) of black Protestants believe that having an abortion is morally wrong. Nearly half (46%) of white mainline Protestants agree that having an abortion is morally acceptable, while more than 4-in-10 (42%) say that having an abortion is morally wrong.
In contrast, more than 6-in-10 (63%) religiously unaffiliated Americans believe that having an abortion is morally acceptable.
The Death Penalty
Six-in-ten (60%) Americans say that the death penalty is morally acceptable, while 35% say it is morally wrong.
Nearly three-quarters (73%) of Republicans and 6-in-10 (60%) independents believe that the death penalty is morally acceptable. Democrats are divided: 49% believe the death penalty is morally acceptable, while 46% believe it is morally wrong.
White Americans (67%) are much more likely than black (47%) and Hispanic (42%) Americans to believe that the death penalty is morally acceptable. A majority (52%) of Hispanic Americans believe that the death penalty is morally wrong.
Three-quarters (75%) of white evangelical Protestants and nearly 7-in-10 (69%) white mainline Protestants agree that the death penalty is morally acceptable. Smaller majorities of religiously unaffiliated Americans (55%), black Protestants (51%), and Catholics (51%) also agree that the death penalty is morally acceptable.
Men (65%) are more likely than women (54%) to believe that the death penalty is morally acceptable. There are no differences by age.
Smoking Marijuana
Americans are divided on the morality of smoking marijuana: 48% say that smoking marijuana is morally acceptable, while 45% say it is morally wrong. There are no substantial differences by race or social class, but significant divisions are evident by party affiliation, religious affiliation, gender, age, and marital status.
More than 6-in-10 (63%) Republicans believe that smoking marijuana is morally wrong, while a majority (56%) of Democrats and half (50%) of independents disagree, saying that smoking marijuana is morally acceptable.
Religiously unaffiliated Americans (70%) are more likely than religiously affiliated Americans to believe that smoking marijuana is morally acceptable. Majorities of white evangelical Protestants (59%) and Catholics (53%) agree that smoking marijuana is morally wrong. Black Protestants are divided (48% morally acceptable, 45% morally wrong). Half (50%) of white mainline Protestants agree that smoking marijuana is morally acceptable, while more than 4-in-10 (43%) say that smoking marijuana is morally wrong.
Men (54%) are more likely than women (43%) to believe that smoking marijuana is morally acceptable. Unmarried men stand out on this question: more than 7-in-10 (71%) men who have never been married believe that smoking marijuana is morally acceptable, compared to 52% of women who have never been married, 42% of married men, and 38% of married women.
Millennials (64%) are also more than twice as likely as seniors (27%) to believe that smoking marijuana is morally acceptable.
Using Contraceptives
Nearly 9-in-10 (87%) Americans say that using artificial birth control methods or contraceptives are morally acceptable, while only 1-in-10 (10%) say that contraceptive use is morally wrong. There is near unanimity across American subgroups on this question, with no significant differences by race, ethnicity, social class, political affiliation, religious affiliation, gender, or age. For example, even solid majorities of Catholics and white evangelical Protestants who attend religious services once a week or more say using artificial birth control methods are morally acceptable (70% and 86%).
The Complex Relationship Between Legality and Morality
The relationship between Americans’ moral evaluations of issues and their support for public policy measures related to that issue is complex. On issues like abortion, moral objections do not directly translate into legal opposition. Roughly 3-in-10 (28%) Americans who believe abortion is morally wrong also agree that abortion should be legal in all or most cases. Conversely, on issues like the death penalty, moral acceptance does not translate directly into legal support. Nearly one-quarter (23%) of Americans who agree that the death penalty is morally acceptable still prefer life in prison for convicted murderers.
On issues such as smoking marijuana and same-gender sexual relations, however, views on morality and legality are more closely aligned. Less than half (45%) of Americans believe that smoking marijuana is morally wrong, while a slim majority (52%) believe it should be illegal. Similarly, a slim majority (52%) of Americans believe that sex between two adults of the same gender is morally wrong, and nearly half (45%) oppose allowing gay and lesbian couples to marry legally.
Morality and Worldview
American Catholics: “Social Justice” vs. “Right to Life” Orientations
Over the past year, there has been a substantial amount of intra-Catholic and public debate over the kinds of issues that Catholic Church should prioritize in public engagement. In many debates, the battle lines are drawn between an emphasis on social justice and poverty on the one hand and an emphasis on abortion and right to life on the other. By a margin of more than 2-to-1, Catholics agree that in its statements about public policy, the Catholic Church should focus more on social justice and the obligation to help the poor. Six-in-ten (60%) American Catholics agree that the Catholic Church should focus more on social justice and the obligation to help the poor, even if it means focusing less on issues like abortion and the right to life, while more than 3-in-10 (31%) believe that the Catholic Church should focus more on issues like abortion and the right to life, even if it means focusing less on social justice and the obligation to help the poor.
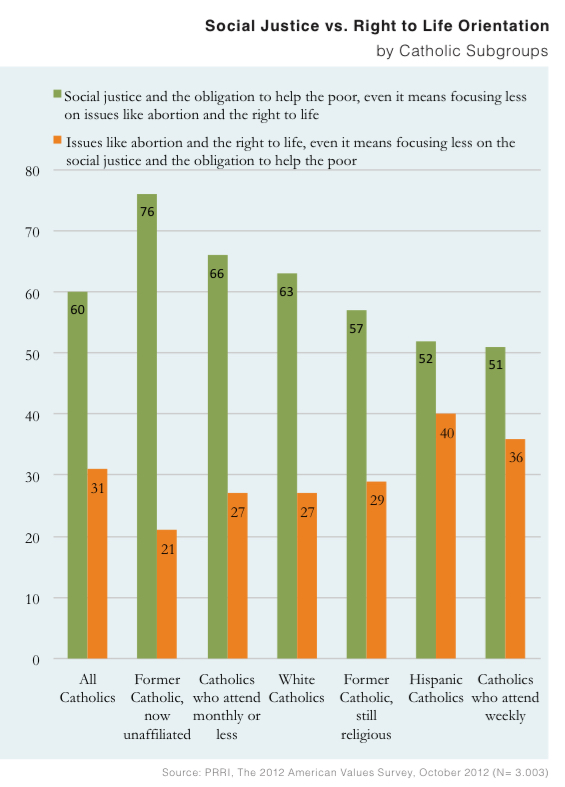
This social justice orientation persists across ethnic lines, although it is stronger among white Catholics than among Hispanic Catholics. More than 6-in-10 (63%) white Catholics agree that the Catholic Church should focus on social justice and the obligation to help the poor, even if it means focusing less on issues like abortion and the right to life, while less than 3-in-10 (27%) believe that the Catholic Church should focus more on issues like abortion and the right to life, even if it means focusing less on social justice and the obligation to help the poor. Similarly, a majority (52%) of Hispanic Catholics agree that the Catholic Church should focus more on social justice, while 4-in-10 (40%) Hispanic Catholics believe that the Catholic Church should focus more on issues like abortion and the right to life.
These patterns are also evident among both infrequent and frequent church attendees. Roughly two-thirds (66%) of Catholics who attend church monthly or less, agree that in its statements about public policy, the Catholic Church should focus more on issues like social justice and the obligation to help the poor, even if it means focusing less on issues like abortion and the right to life. Among Catholics who attend church at least once a week, a slim majority (51%) say the Church should focus more on social justice, compared to 36% who believe that the Catholic Church should focus more on issues like abortion and the right to life.
Views about the Catholic Church’s priorities are strongly correlated with attitudes toward abortion. Among Catholics who say the Church should focus more on social justice, approximately two-thirds (66%) believe abortion should be legal in most cases, compared to nearly one-third (31%) who believe abortion should be illegal in all or most cases. Among Catholics who say the Catholic Church should focus more on abortion and right to life issues, nearly 7-in-10 (69%) believe abortion should be illegal in most cases, while 3-in-10 (30%) say it should be legal in all or most cases.
Root Causes of America’s Current Problems: Moral Decline vs. Unfair Economic System
Overall, Americans believe that the country’s current problems are rooted both in moral decline and continuing inequality. More than 7-in-10 (72%) Americans believe that the primary cause of America’s problems is moral decline and the loss of traditional values. More than 6-in-10 (62%) Americans also agree that the primary cause of America’s problems is an economic system that results in continuing inequality and poverty. A substantial proportion of the population points to both factors. Nearly half (45%) of Americans believe that America’s current problems are rooted in both the loss of traditional values and in an economic system that results in inequality. Fewer Americans believe that America’s problems rooted only in moral decline and the loss of traditional values (27%), or only in an economic system that results in continuing inequality and poverty (17%). Approximately 1-in-10 (11%) Americans do not believe that America’s problems are rooted in either of these causes.
Similar numbers of Republicans (46%), Democrats (47%), and independents (44%) identify both moral decline and an economic system that results in inequality as primary causes of America’s current problems. However, nearly half (45%) of Republicans say that moral decline the loss of traditional values is the primary cause of America’s current problems, while only 3% say the same of an economic system that results in inequality. Meanwhile, one-quarter (25%) of Democrats say that an economic system that results in inequality is the primary cause of America’s current problems, while 15% point to moral decline and the loss of traditional values. Independents are more divided: one-quarter (25%) cite moral decline only, while nearly 1-in-5 (18%) point to economic inequality.
More than 6-in-10 (63%) black Americans, half (50%) of Hispanic Americans, and approximately 4-in-10 (42%) white Americans believe that moral decline and an economic system that results in inequality are both responsible for America’s problems. White (31%) and Hispanic (23%) Americans are more likely than black Americans (11%) to say that moral decline and the loss of traditional values are primarily responsible for America’s current problems. Black (15%), Hispanic (16%), and white (16%) Americans are equally likely to say that an economic system that results in continuing economic inequality is the primary cause of America’s current problems.
There are also differences among white Americans by social class. A majority (53%) of white working-class Americans say that moral decline and an economic system that results in inequality are both responsible for America’s current problems, compared to less than one-quarter (23%) of white college-educated Americans. More than one-third (35%) of white college-educated Americans and nearly 3-in-10 (27%) white working-class Americans agree that moral decline alone is the primary cause of America’s problems. White college-educated Americans (24%) are twice as likely as white working-class Americans (12%) to say that an economic system that results in continuing inequality is the main cause of America’s current predicament. Notably, nearly 1-in-5 (18%) white college-educated Americans say that America’s current problems are rooted in neither cause, compared to less than 1-in-10 (8%) white working-class Americans.
There are sizable divisions by religious affiliation. Nearly two-thirds (65%) of black Protestants, and a majority of white evangelical Protestants (54%) and Hispanic Catholics (55%) point to both moral decline and an unequal economic system as root causes of America’s problems. Similarly, nearly half of white mainline Protestants (45%) and more than 4-in-10 (43%) white Catholics say that moral decline and a flawed economic system are responsible. White evangelical Protestants (37%) are much more likely to identify moral decline rather than economic inequality (5%) as the cause of America’s problems. White Catholics (34% vs. 12%), white mainline Protestants (27% vs. 17%), and Hispanic Catholics (21% vs. 11%) are also more likely to believe America’s problems are rooted in moral decline than in a system that perpetuates economic inequality. Black Protestants are equally as likely to cite moral decline (13%) as the primary cause of America’s problems as economic inequality (13%). Three-in-ten (30%) religiously unaffiliated Americans say both moral decline and economic inequality are responsible for America’s current problems, while roughly one-third (35%) point to economic inequality alone and less than 1-in-5 (16%) believe that moral decline is primarily responsible.
While similar numbers of Millennials (44%) and seniors (44%) believe that both economic inequality and moral decline are responsible for America’s problems, Millennials (28%) are substantially more likely than seniors (9%) to single out economic inequality as the primary cause of America’s problems. By contrast, seniors (34%) are more likely than Millennials (16%) to believe that moral decline is the primary cause of America’s problems. There are no differences by gender on this question.
Women and Traditional Gender Roles
A majority (54%) of Americans say that women are naturally better suited than men to raise children, while 44% disagree.
There are sizeable differences on this question by party affiliation and political ideology. More than 6-in-10 (62%) Republicans, a majority (52%) of Democrats and half (50%) of independents agree that women are naturally better suited to raise children than men.
Majorities of all major racial and ethnic groups agree that women are naturally better suited than men to raise children, although Hispanic Americans (65%) are more likely than black (54%) and white (52%) Americans to agree with this assessment. A majority (53%) of white working-class Americans and half (50%) of white college-educated Americans believe that women are naturally better suited to raise children than men.
Religiously affiliated Americans are more likely than religiously unaffiliated Americans (42%) to believe that women are naturally better suited to raise children than men. Majorities of white evangelical Protestants (64%), black Protestants (57%), Catholics (55%), and white mainline Protestants (51%) believe that women are naturally better suited to raise children than men. Hispanic Catholics (65%) are more likely than white Catholics (49%) to agree with this statement. A majority (56%) of religiously unaffiliated Americans disagree, saying that women are not naturally better suited to raise children than men.
Perhaps the most striking finding is that women (54%) are equally as likely as men (54%) to believe that women are naturally better suited to raise children. However, opinion varies by marital status among white women: a slim majority (51%) of white married women agree that women are naturally better suited to raise children than men, compared to 35% of white women who have never been married. More than 6-in-10 (64%) white women who have never been married believe that women are not naturally better suited to raise children than men.
There are also some differences between parents and non-parents. Men who have children (48%) are less likely than men who do not have children (57%) to believe that women are better suited to raise children than men. However, women who have children (57%) are actually slightly more likely than women with no children (51%) to believe that women are naturally better suited to raise children than men.
Seniors (66%) are more likely than Millennials (49%) to believe that women are naturally better suited to raise children than men. Half (50%) of Millennials believe that women are not naturally better suited to raise children than men.
V. When Polarization Meets Diversity
Demographics and Partisanship in an Evolving Religious Landscape
E.J. Dionne, Jr. and William A. Galston
The American religious landscape has shifted dramatically in recent decades. Immigration and generational shifts are contributing to these changes. More young people are leaving the faith of their childhood, often breaking with organized religion altogether. As a result, the constituent groups making up the two major political parties have also evolved.
Yet the constituent groups that make up the bases of the parties are not entirely at home with their coalition partners. White evangelical Protestants are, for the most part, reliable Republican voters, but their views on economic issues are more centrist than those of many of their Republican counterparts. Similarly, black Protestants are stalwart Democrats, yet they part from the party platform on many social issues and are very religious in both their views and their actions. Democrats thus count on a coalition that includes some of the most and the least religious people in the country.
And the survey sheds important light on a debate among American Catholics over what the public priorities of the Church should be. On the one hand, Catholics who attend Mass regularly are strongly opposed to abortion. But when asked if the Church’s public witness should concentrate primarily on abortion or on social justice, Catholics – including those who regularly attend Church – strongly favor giving priority to the Church’s social justice tradition.
The Debate Among Catholics
Social Justice and Abortion
For the last decade, American Catholics have engaged in a vigorous debate that is not so much about the Church’s formal positions on public issues as it is over which aspects of Catholic teaching should be given the most emphasis in the public debate. Conservative Catholics—with growing support from an increasingly conservative Bishops’ Conference—have argued that the focus should be on abortion and other right to life issues, and opposition to same-sex marriage. More recently, a campaign for religious liberty sparked by opposition to contraception coverage requirements under the new health care law has consumed a great deal of the Church’s energy. Progressive Catholics have argued that the Church’s social teaching, with its emphasis on economic justice and a concern for the poor, should be at the heart of the Church’s public mission. Many in the progressives’ ranks have expressed concern that while the Bishops still formally endorse the Church’s traditional social justice agenda—which is, in conventional terms, broadly progressive—the Church’s energy has been concentrated on abortion, same-sex marriage, and religious liberty.
The conflict over emphasis and focus has played out publicly in the differences between the Vatican and leading organizations of American nuns. The sisters have highlighted social concerns, while the Vatican and conservative Bishops have accused them of playing down the abortion issue. The nation got a glimpse of the different approaches among the Catholic laity in the vice presidential debate between Joe Biden and Paul Ryan. The 2012 election marks the first time in American history that two Catholics are contending for one of the two top elective offices in the land, and moderator, Martha Raddatz, specifically asked them how their faith affects their views.
But where do the faithful stand in this debate, and how much impact have the Bishops had in shaping the views of Catholics in the pews? To test opinion on the argument over the Church’s priorities, the survey gave respondents a choice between two propositions and asked which came closer to their views:
1. In its statements about public policy, the Catholic Church should focus more on social justice and the obligation to help the poor, even if it means focusing less on issues like abortion and the right to life.
2. In its statements about public policy, the Catholic Church should focus more on issues like abortion and the right to life, even if it means focusing less on social justice and the obligation to help the poor.
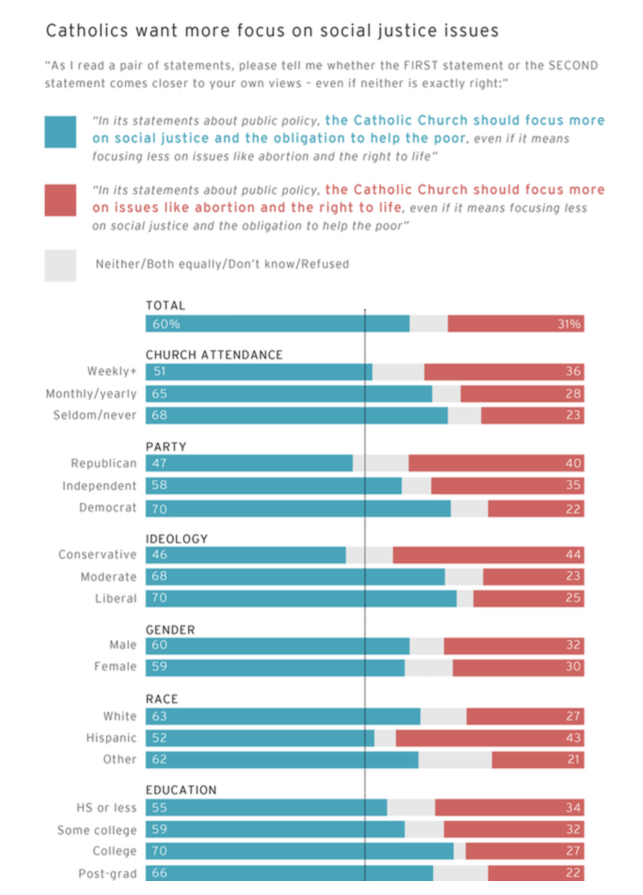
By a margin of 2-to-1—60% to 31%—Catholics say that the Church should focus on social justice and the poor rather than abortion and the right to life. Perhaps not surprisingly, this view is held especially strongly by Catholics who attend church only occasionally or never. But the most striking finding, and one that may surprise many leaders in the Church, is that Catholics who attend church once a week or more also express a strong preference for an emphasis on social justice over abortion. In this group, 51% chose social justice while 36% chose abortion and the right to life.
Liberal Catholics thought the Church should focus on social justice over abortion by 70% to 25%, and moderate Catholics agreed by a 68% to 23% margin. But, again surprisingly, conservative Catholics were closely split, with 46% saying the emphasis should be on social justice and 44% saying it should be on abortion. Catholic Democrats sought an emphasis on social justice by a 70% to 22% margin, but Catholic Republicans did so, too, although by a much smaller 47% to 40% margin. Catholic independents broke 58-to-35% for an emphasis on social justice.
Intriguingly, Hispanic Catholics chose social justice by a much smaller margin (52% to 43%) than did white Catholics (63% to 27%). Perhaps because of the heavy representation of Hispanics in this group, lower-income Catholics—those earning less than $30,000 a year—split almost evenly between social justice and abortion (46% to 43%), while Catholics at all other income levels opted for social justice by margins of greater than 2-to-1.
On the question of whether abortion should be legal in all or most cases, 53% of Catholics said it should, while 44% said it should be illegal in all or most cases. But on this issue, the differences between Catholics who attend church regularly and those who do not was dramatic. Among Catholics who attend church once a week or more, 63% said abortion should be illegal in all or most cases, and a full third (33%) of weekly attenders said it should be illegal in all cases. By contrast, only 32% of those who attend monthly or yearly, and 28% of those who attend seldom or never said abortion should be illegal in all or most cases. The Church’s teaching on abortion clearly has an important influence on Catholics who regularly attend Mass.
Catholic identity has a broader impact on attitudes toward the morality of abortion itself, even among Catholics who attend church less frequently. By a 71% to 23% margin, Catholics who attend church at least once a week say that having an abortion is morally wrong, but a plurality of Catholics who attend monthly or only a few times a year also see abortion as morally wrong, although by a narrower 48% to 38% margin. Among self-identified Catholics who rarely or never attend church, 52% say that having an abortion is morally acceptable, while 37% declare it morally wrong.
Religious Liberty and Same-sex Marriage
The Bishops’ campaign on religious liberty also seems to be having an impact on Catholics who regularly attend Mass. The survey asked respondents if “the right of religious liberty is being threatened in America today.” Overall, Catholic opinion closely matched opinion in the country as a whole: 26% of all respondents and 24% of all Catholics completely agreed; 31% of all respondents and 33% of Catholics mostly agreed. But among Catholics who attend church at least once a week, 36% completely agreed and 34% mostly agreed.
Church teaching against same-sex marriage is having a less powerful impact, even on regular church-goers. Among all Catholics, the margin in favor of allowing gays and lesbians to marry legally is 54% to 36%. This includes 19% of Catholics who strongly favor gay marriage and 20% of Catholics strongly oppose it. Those that attend church once a week or more oppose gay marriage, but by a surprisingly small margin (49% to 40%) given the Church’s position the issue. Catholics who attend Church less often are overwhelmingly in favor of gay marriage.
The issue on which Catholics of all stripes break with Church teaching is contraception. As with the rest of the population, this is an issue on which broad consensus has been reached among Catholics in the pews. Overall, 81% of Catholics say that “using artificial birth control methods also known as contraceptives” is morally acceptable, while only 14% say it is morally wrong. The high level of openness to contraceptive use extends to Catholics who attend church at least once a week: 70% of them say using birth control is morally acceptable.
Perhaps because of this, Catholics are less strongly opposed to requiring religious employers to cover contraception than the Bishops are. In order to gauge sentiment more accurately, the survey split the sample and posed the question on this issue in two different ways. Asked if religiously affiliated colleges and hospitals should be required to provide their employees with health plans that cover contraception at no cost, 56% of all respondents and 54% of Catholics said yes, a difference that is statistically insignificant. Catholics who attend church weekly or more were opposed to the contraception requirement, but not by an overwhelming margin: 52% of them opposed the requirement, while 43% were in favor.
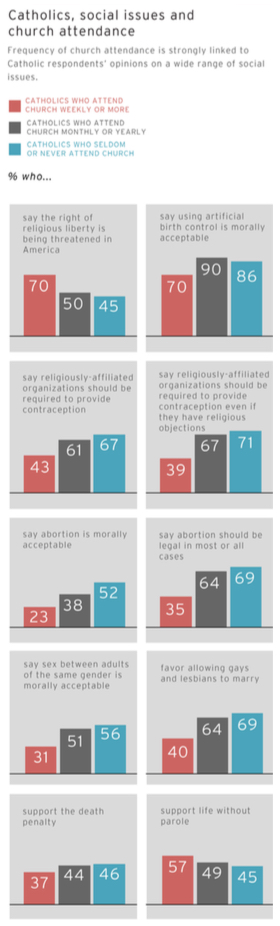 In the version of the question that specifically asked respondents if the contraception requirement should apply even if colleges and hospitals had religious objections to it, 56% of all Americans and 57% of Catholics still favored the contraception requirement. But this wording caused opposition to the requirement to rise slightly among regular Catholic church-goers: among weekly attenders asked this version of the question, 58% opposed the requirement while 39% supported it.
The Death Penalty: A Catholic Difference
The survey found a distinctive Catholic response on the death penalty. Given a choice between the death penalty and life without parole as a punishment for those convicted of murder, the total sample split 47% to 46% in favor of life without parole, while Catholics favored life without parole by a larger margin, 52% to 41%. What was especially striking is that Catholics who attend church once a week or more were even more strongly opposed to the death penalty: they favored life without parole over the death penalty 57% to 37% – and were more strongly opposed to the death penalty than Catholics who attended church less frequently. In conventional terms, if church attendance made Catholics more “conservative” on abortion, it appears to make them more “liberal” on the death penalty.
The Catholic difference on this issue can be seen by a marked difference between Catholic and non-Catholic conservatives. Catholic conservatives favored life without parole over the death penalty by 51% to 44%. Among non-Catholic conservatives, the figures were reversed: only 37% favored life without parole while 56% favored the death-penalty. This is an area where Catholic teaching on life has had a substantial impact.
Religion and Social Values: The African-American Difference
The level of religiosity among African Americans is extraordinarily high. Eighty percent report that being a member of their religion (for most, evangelical Protestants) is either very important or the most important thing in their lives. Thirty-seven percent said “most important,” versus 25% of whites and 18% of Hispanics who answered that way. Eighty-three percent of African Americans affirm that the Bible is the “word of God,” and fully 70% of those say that it is “to be taken literally, word for word.” Seventy-two percent say that rather than being an “impersonal force,” God is a person with whom one can have a relationship. Seventy-nine percent of African Americans, but only 45% of whites, say that it is necessary to believe in God to be moral and have good values. Seventy-six percent say that “if enough people had a personal relationship with God, social problems would take care of themselves.” Only 53% of whites and 58% of Hispanics agree.
On these religious questions, African Americans are much like white evangelicals. Yet differences abound concerning the economy and the role of government. Black Protestants are far more likely to see government policies to help the poor as necessary, and far less likely to perceive them as creating a “culture of dependency.” Sixty-two percent of black Protestants, but only 32% of white evangelicals, think that most people who accept welfare are genuinely in need of help. And by a margin of 20 percentage points, black Protestants are more likely than are white evangelicals to say that an economic system that results in continuing poverty and inequality is a primary cause of America’s problems.
When it comes to specific social policies, African Americans display a distinctive blend of conservative and liberal views. On the one hand, black Protestants are opposed to same-gender sexual relations and marriage, and they reject the legalization of marijuana. On the other, they break with white evangelicals on abortion, the death penalty, and requiring churches and religiously affiliated institutions to provide contraception coverage in their employees’ health insurance. On all these questions, African Americans have more liberal views than white evangelicals.
In short, the survey suggests, the religious convictions of most African Americans reflect both Protestant theological traditionalism and the distinctive historical experience of the African American community. While today’s white evangelicals are for the most part individualistic in both theology and socio-economic attitudes, African Americans combine religious personalism with a communitarian stance toward social policy and governmental activism. From time to time, Republicans can use theological traditionalism to make modest inroads among African-American voters. But the doctrine of fiscal retrenchment and limited government that now dominates the Republican Party finds virtually no resonance among African Americans and as long as it persists, will obstruct Republican efforts to break Democrats’ hold on the African-American electorate.
Women and Children
The survey question concerning men, women, and childrearing offers both intriguing findings and some issues of interpretation. After nearly five decades during which many in the women’s movement and the academy have argued that gender differences are largely “socially constructed,” one might have expected a sizeable majority of respondents (or at least women) to reject the proposition that “women are naturally better suited to raise children than men.” That is not what happened. In fact, 54% of respondents agreed, while 44% disagreed. There were no aggregate differences between men and women, with 54% of each group endorsing the proposition. Fifteen percent of men completely agreed; so did 13% of women. Thirty-nine percent of men “mostly” agreed, as did 41% of women. Partisan and ideological differences were surprisingly small: 62% of Republicans and 59% of conservatives agreed with this proposition. But so did 52% of Democrats and even 44% of liberals.
The difference between the “completely” and “mostly” categories seems significant, however. The vast majority appeared to be cross-pressured. Only 16% of Republicans, 11% of Democrats, 17% of conservatives, and 10% of liberals completely agreed. At the other end of the continuum, only 10% of Republicans, 17% of Democrats, 12% of conservatives, and 21% of liberals completely disagreed. Nearly 7-in-10 respondents saw something to consider seriously in the position they rejected.
Religious differences did not significantly affect attitudes on this question. While 65% of white evangelical Protestants thought that women were naturally better suited to childrearing than men, so did 51% of white mainline Protestants, 57% of black Protestants, and 55% of Catholics. Here again, those who saw some merit in the opposing position vastly outnumbered those who were completely certain.
Nor was race a major factor. Sixty-four percent of Hispanics endorsed the proposition, but so did 54% of blacks and 52% of whites.
Age made some difference. Fully 66% of Americans age 65 and over thought that women are naturally better suited than men to raise children. Still, 55% of those between 50 and 64 also agreed, as did 50% of 30 to 49-year olds and 49% of the youngest adults. Otherwise put, fully 52% of Americans under 65 appear to lean toward “traditional” attitudes about men and women.
With regard to education, the big divide is between the least educated Americans and everyone else. Fifty-nine percent of respondents with a high school education or less thought that women were better suited to childrearing than men. But education made no difference above that threshold. Fifty-one percent of those with some college endorsed the proposition, as did 50% of college graduates, and 50% of those with post-graduate education.
A similar pattern prevailed among women. There was a major gap between women with a high school education or less (62% endorsing different gender-based aptitudes for childrearing) and other women. Still, 48% of women with some college, 44% of women college graduates, and 49% of women with post-graduate education also thought that men and women are “naturally” different in this respect.
Here again, however, the gap between total and preponderant agreement is large. Only 17% of women with a high school education or less, 12% of those with some college, 6% of female college graduates, and 8% of women with post-graduate education expressed complete agreement with the idea that women are better suited than men to raise children. Women who “mostly” agreed constituted 45% of the least educated, 36% of those with some college, 36% of women who completed college, and 38% of the post-graduates. Nonetheless, they were presented with—and declined—the options of mostly or completely rejecting these gender differences. Their choice means something. But what it means cries out for face-to-face qualitative research.
Although college-educated men were more likely to see childrearing differences than were college-educated women, the gap disappears for the most highly educated professionals, with 51% of men joining 49% of women in affirming the difference.
Half a century after the rise of the contemporary women’s movement, amidst vast changes in the role of women in higher education, the workforce, and politics, the persistence of the belief that men and women are different when it comes to children is striking. The wording of the question invited the respondents to consider an alleged intrinsic—as opposed to socially constructed—difference between the sexes. Regardless of age, education, religion, and gender, Americans discerned such a difference. To be sure, a majority of both those endorsing and those rejecting the proposition displayed some uncertainty and ambivalence about their positions. Still, in 21st century America, the idea of innate differences between men and women is still very much alive.
Political Polarization
Divided Over Social Issues
In recent decades, the two major political parties have become more internally homogeneous and have moved farther away from one another on a host of issues. While scholars debate both the extent and causes of this change, it is increasingly hard to deny that polarization is a conspicuous feature of the contemporary political landscape, contributing to the bitterness of public discourse and to the partisan gridlock that thwarts agreement on even pressing issues.
Our survey confirms significant differences between Republicans and Democrats on virtually every social issue examined. On the hot-button issues of abortion and same-sex marriage, the gap is a full 40 percentage points, and the Dream Act is almost as divisive. Intriguingly, the difference between Republican and Democratic identifiers on the death penalty is only half as large, suggesting that many Democrats regard the death penalty as just, while many Republicans are worried by the evidence that many innocent prisoners have ended up on Death Row.
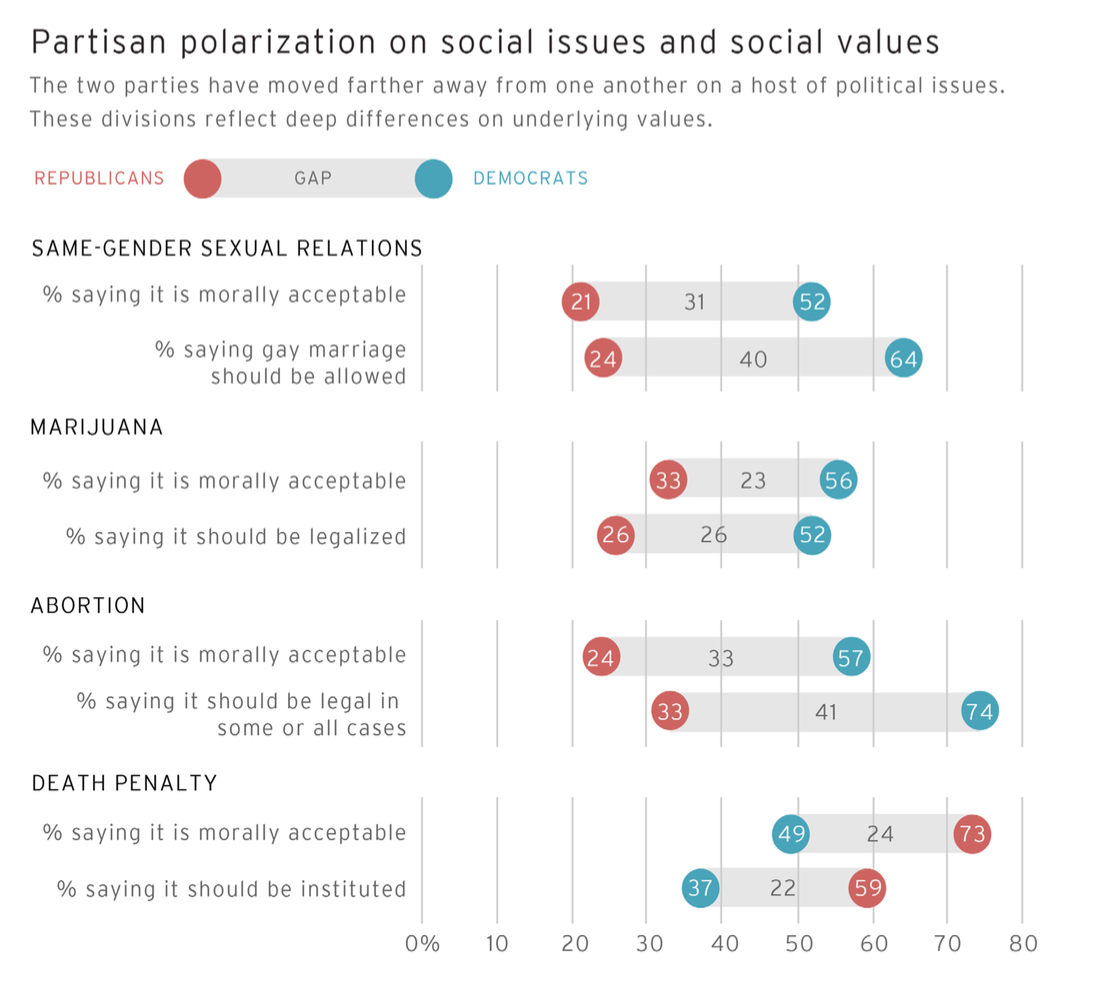
It is not surprising that these divisions on issues reflect deep differences on underlying values. By a margin of 44 points, for example, Republicans believe that abortion is morally wrong; by a margin of 23 points, Democrats think that it is morally acceptable. Still, the share of Republicans who think that abortion should be legal in all or most cases exceeds the share who think abortion is morally acceptable, implying that some Republicans distinguish between what morality dictates and what the law should require. Democrats make the same distinction regarding same-sex issues: while only 52% consider adult male-male or female-female sexual relations to be morally acceptable, fully 64% would permit same-sex marriage.
Over the past four years, universal health insurance has been the most hotly debated national social policy issue, reflecting differences between the parties over the role of government and the priority of health care. More recently, controversy has erupted over the Obama administration’s effort to require religiously affiliated institutions other than churches themselves to provide their employees with health care plans that cover contraception at no cost. Republicans overwhelmingly believe that the religious convictions of institutions that object to this requirement should trump the desires of many employees to receive insurance for contraceptive services. Democrats believe just the reverse, and objections based on religious convictions leave them unmoved. More broadly (and surprisingly), the addition of religious objections doesn’t seem to change positions on the underlying issue on either side of the party divide.
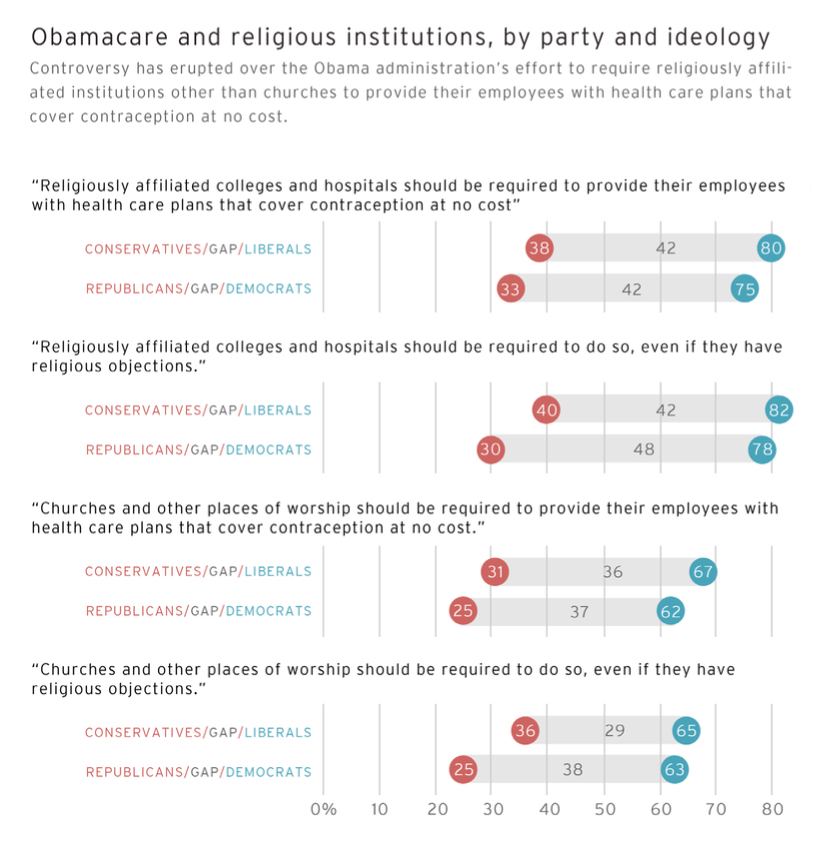
As polarization between the parties has intensified in recent decades, ideology has moved in tandem with partisanship. Most conservatives are now Republicans, and vice versa. A majority of liberals are now Democrats, and the liberal share of Democratic identifiers has risen substantially — though Republicans are more uniformly conservative than Democrats are liberal. And the gaps between conservatives and liberals on social issues, moral values, and the implementation of Obamacare for religious institutions are huge.
Considering how important these partisan and ideological divisions have become, it is reasonable to wonder whether they now constitute a permanent feature of American politics. Based on the evidence in our survey, it depends on the issue. If there are large differences between older and younger Americans on a specific issue, then (all other things equal) we can expect the views of the younger cohorts to become dominant over time. Conversely, if there are no significant differences among the generations, then the issue is likely to persist.
The comparison between abortion and same-gender relations illustrates this difference. Only 40% of Americans age 65 and over consider abortion to be morally acceptable. One might imagine that young adults would have very different beliefs. But in fact, only 42% of 18- to 29-year olds and 38% of those between 30 and 49 think that abortion is morally acceptable. This similarity of views between older and younger Americans suggests that the controversy is likely to persist for at least another generation (as is the ambivalence of the many millions of Americans who believe both that abortion is immoral and that the law should permit it).
Same-gender relations present a very different profile. Sixty-one percent of young adults consider sex between two adults of the same gender to be morally acceptable, compared to only 32% of those 65 and older. These values translate directly into policy: fully 68% of Americans age 18 to 29 favor same-sex marriage, compared to only 31% of the oldest cohort. These generational trends suggest that in coming decades, the weight of opinion is likely to shift significantly in the direction of social and legal acceptance for a range of same-gender relations.
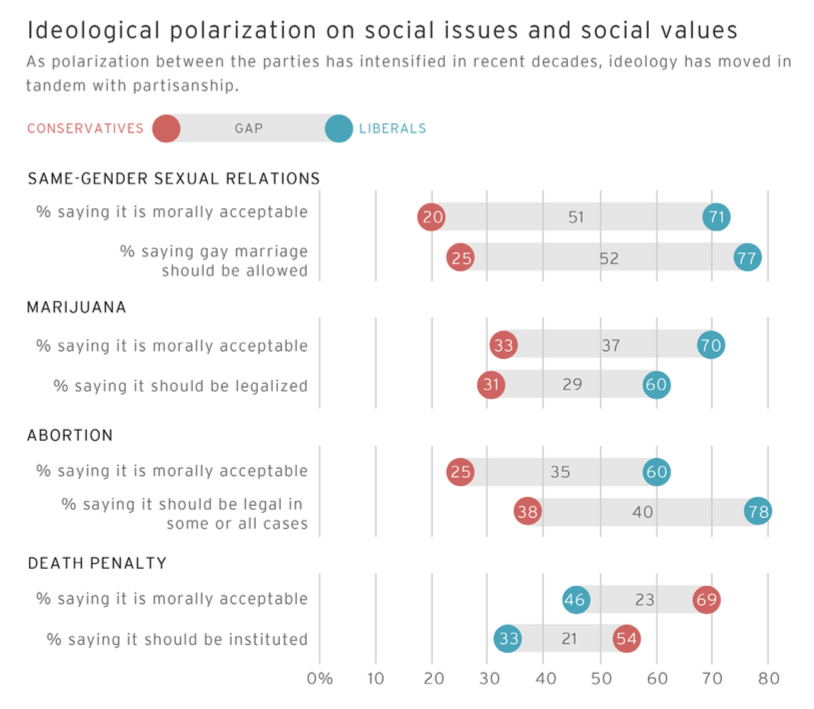
For most of the social issues and values examined in this survey, education has a significant impact on attitudes. Broadly speaking, the higher the level of a respondent’s education, the more likely he or she is to display “liberal” preferences. (Examples include abortion, same-gender relations, immigration, legalizing marijuana, and requiring religious institutions to provide contraception coverage.)
This correlation between education and social attitudes could affect the future partisan and ideological balance. During the 1970s and 1980s, the rates of college completion and post-graduation education rose sharply. Since then, these increases have slowed (and in the case of young men, may even have reversed). If the economic pressures of globalization produce another wave of higher education, as some now predict, then a new shift toward more liberal social attitudes could occur as well.
It is natural to assume that in a diverse society, few if any morally laden debates will ever come to an end. Surprisingly, many do. As recently as the end of World War Two, most Americans opposed interracial marriage and admitted that they would hesitate to support members of ethnic and religious minority groups for President of the United States. Today, most of these debates seem antique. Interracial marriage is now enshrined in our laws, and during the past half-century, we’ve had a Catholic president, an African-American president, and a Jewish vice-presidential candidate on a ticket that received a plurality of the popular vote. True, a woman has yet to be elected to one of the two top offices, and there is open opposition to atheists and even some religious minority groups that are relative newcomers, like Muslims, but there is no doubt the country has become significantly more open in recent decades.
Contraception is another such example. Hotly debated in localities and courts across the nation just fifty years ago, it now enjoys nearly unanimous public support across partisan and ideological lines. And despite doctrinal differences among religious dominations, there is no evidence that religious identity and affiliation make much difference either.
Education, gender, and race are also not a factor. Across all those demographics there is strong support for the use of birth control. Nor is there much difference between White Catholics (84%) and Hispanic Catholics (78%). Even if official church doctrine remains unchanged, there is no reason to believe that the hierarchy will change the attitudes of rank-and-file Catholics. And as we know from other sources, belief and behavior are closely aligned when it comes to contraception.
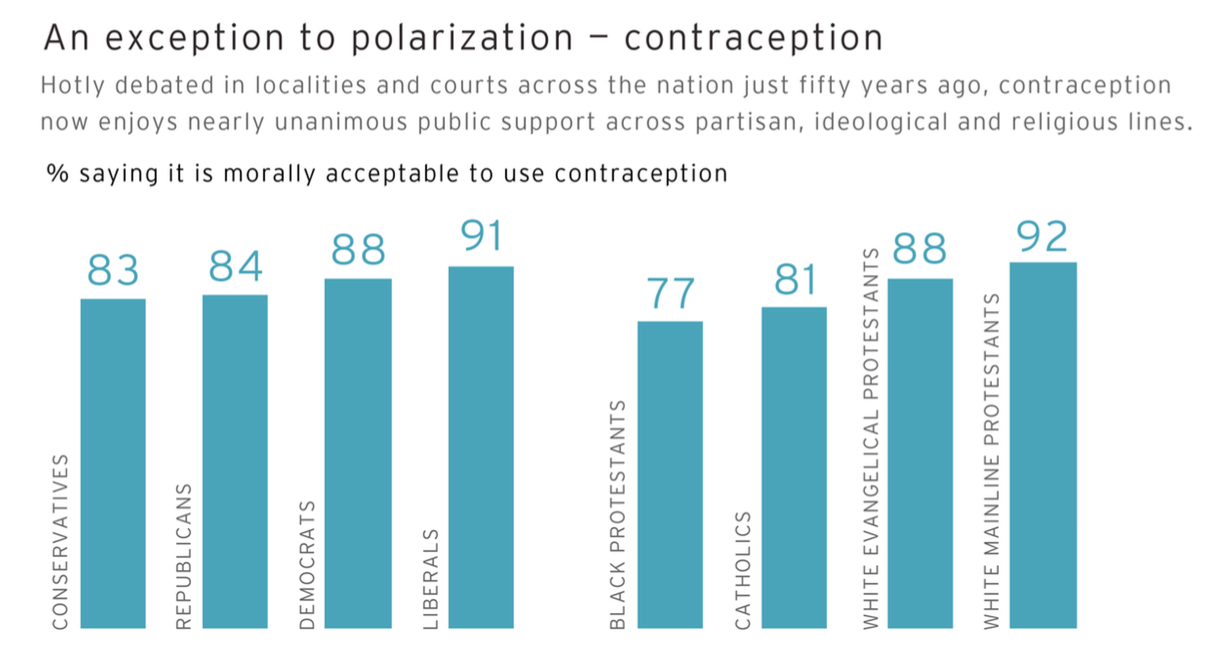
Divided Over Economics and the Role of Government
In light of the debate over Mitt Romney’s comments about the 47% of the population who pay no federal income tax and whom he described as dependent on government programs, the survey found fascinating shifts in opinion, depending upon how the issues at stake were framed. A large majority gave strong support to the social safety net and rejected the idea that it promoted dependency. The survey offered respondents a choice between two statements:
1. Government policies aimed at helping the poor serve as a critical safety net, which help people in hard times get back on their feet.
2. Government policies aimed at helping the poor create a culture of dependency where people are provided with too many handouts.
Among all respondents, the first, pro-safety net statement was favored by a 63% to 32% margin over the second. That percentage held roughly across all religious groups, although black Protestants were notable for their especially strong support for the safety net idea (84%), while white evangelicals were somewhat less supportive, although a majority (53%) still favored the first statement. The gap between the parties is as pronounced on this question as it is on many of the cultural issues. While 83% of Democrats saw government programs as providing a critical safety net, 55% of Republicans said they created a culture of dependency.
But when respondents were posed a question that included the word “welfare,” the response was quite different. The survey asked: “In your view, are most people who receive welfare payments genuinely in need of help or are they taking advantage of the system?” This divided the sample into almost equal halves: 44% said that welfare helped the genuinely needy, while 46% said welfare recipients were taking advantage of the system. This question also split the parties: 64% of Democrats said welfare payments help those who are genuinely in need, while 63% of Republicans said those who receive welfare were taking advantage of the system. There were splits along racial and religious lines as well: 62% of black Protestants said welfare helped those in need, while 56% of white evangelicals said recipients were taking advantage of the system.
These figures point to a close but not complete match between the views of Republicans and white evangelicals. There is, of course, a large overlap between these groups, but white evangelicals as a group are slightly to the left of Republicans as a group. An example of this is white evangelicals’ openness to raising taxes on high-income earners. Overall, Americans favored increasing the tax rate on those earning more than $250,000 a year (61% favor, 36% oppose). The party split on this issue is dramatic: Democrats favored the tax increase (80% favor, 16% oppose); Republicans opposed it (60% favor, 36% oppose). White evangelicals found themselves positioned between the two parties, favoring the tax increase but by a narrow margin (49% favor, 46% oppose).
Conclusion
Polarization seems, for now, to be the rule in American politics. Yet it may not be the nation’s fate—at least not across the board. Younger voters are changing the political landscape, notably on issues related to the rights of gays and lesbians. Latino immigrants are transforming politics in states across the nation. White evangelicals are reliably conservative, yet show signs of moderation on economic questions – even as black Protestants, staunchly progressive on matters related to economic and social justice, are highly traditional in their religious views. Catholics, in the meantime, are engaged in a vigorous dialogue over the meaning of the Church’s commitment to life. Our debates may thus become more nuanced – perhaps even more interesting – after the 2012 election is over.
Endnotes
1 Robert Wuthnow was one of the first to thoroughly document these shifts in The Restructuring of American Religion (Princeton, NJ: Princeton University Press, 1990). More recently, these themes have been taken up by Robert Putnam and David Campbell in American Grace: How Religion Divides and Unites Us (New York: Simon & Schuster, 2012).
2 Two percent of Catholics are non-white and non-Hispanic.
3 This figure does not include denominational switching (i.e. Baptist to Methodist).
4 National Survey of Religious Identification 1990 (Kosmin, Barry A., and Seymour P. Lachman. 1993. One Nation Under God: Religion in Contemporary American Society. New York: Harmony Books.)
5 The “Unattached Believers” category also includes a small number of respondents (n=17) who described themselves as something other than religious or secular or refused to answer the question.
6 Self-identified atheists and agnostics were asked how important being atheist or agnostic is in their life, while religiously unaffiliated Americans who identify as secular were asked how important being secular is in their life.
7 Pew Forum on Religion & Public Life, Religious Landscape Survey, 2007.
8 Pew Research Center on the People & the Press, Political Values Survey, 1991.
9 Likely voters are defined as Americans who are registered to vote, who say they are absolutely certain to vote, and who voted in the 2008 election. If voters are younger than 22 (indicating that they were not eligible to vote in 2008), they must be registered, absolutely certain to vote, and report that they are following the election “very closely.” All references to “voters” in this section refer to likely voters as defined here. The vote preference figure includes voters who are undecided but are leaning toward one of the two candidates.
10 Because of lower rates of voter registration and engagement among Hispanic Americans, there were not enough cases of Hispanic Catholic likely voters to analyze. There were also not enough cases to analyze unaffiliated former Catholic likely voters. The following numbers for these groups are among registered voters and are provided here for reference only. Hispanic Catholic registered voters strongly preferred Obama (71%) over Romney (23%). Among unaffiliated former Catholic registered voters, 78% supported Obama, compared to 19% who supported Romney. Note that the number of cases for Hispanic Catholic registered voters is less than 100 (n=98) and should be interpreted with caution.
Recommended citation:
Jones, Robert P., Daniel Cox, E.J. Dionne Jr., William A. Galston, and Juhem Navarro-Rivera. “The 2012 American Values Survey: How Catholics and the Religiously Unaffiliated Will Shape the 2012 Election and Beyond.” PRRI. 2012. http://www.prri.org/research/american-values-survey-2012/.