In all recent presidential elections, women have consistently shown up to the polls at higher rates than men. According to Rutgers’ Center for American Women and Politics, 68.4% of eligible adult women voted in the 2020 presidential election, compared with 65% of eligible adult men. While a majority of women voters have cast their ballot for the Democratic presidential candidate in recent elections, women are still a fairly divided demographic group.
This Spotlight Analysis focuses on women’s religious and partisan affiliations and considers how American women view the two likely presidential nominees, President Joe Biden and former President Donald Trump, by race, education level, age, and religious affiliation. While the share of American women who view Biden favorably has declined across all groups of women over recent years, the share of women who view Trump favorably has fluctuated in both directions across groups. Finally, it examines how women’s party affiliation impacts the importance of a candidate’s stance on issues for voting, finding that there is considerable variation by partisan affiliation.
Religious Affiliation Among American Women From 2013 to 2023
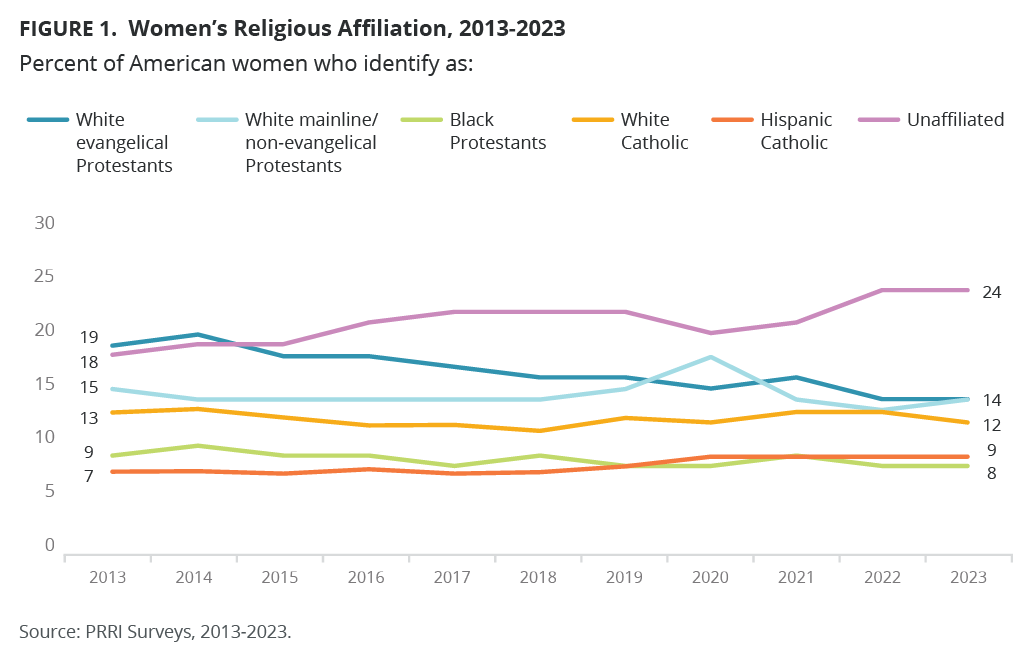
PRRI’s American Values Atlas has been tracking Americans’ demographic shifts since 2013. In the past decade, the most significant changes we have seen in terms of women’s religious affiliation are among white evangelical Protestant women and religiously unaffiliated women. The percentage of white evangelical Protestant women decreased by 5 percentage points from 19% in 2013 to 14% in 2023. Additionally, the percentage of women who identify as religiously unaffiliated increased by 7 points from 18% in 2013 to 25% in 2023.
Partisanship Among American Women From 2013 to 2023
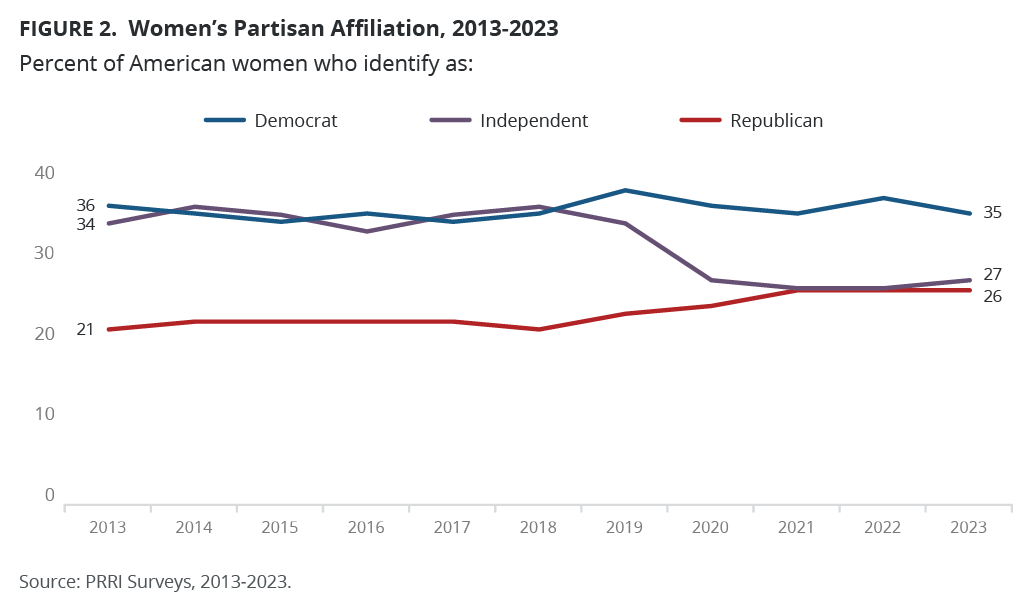
While the percentage of women who identify as Democrats has stayed about the same over the last decade (36% in 2013 and 35% in 2023), the percentage of independent women decreased from 34% to 27%. In 2013, Republicans accounted for 21% of American women. Since then, Republican women have increased by 6 percentage points to 26% in 2023.[1]
Partisanship Among American Women by Religious Tradition
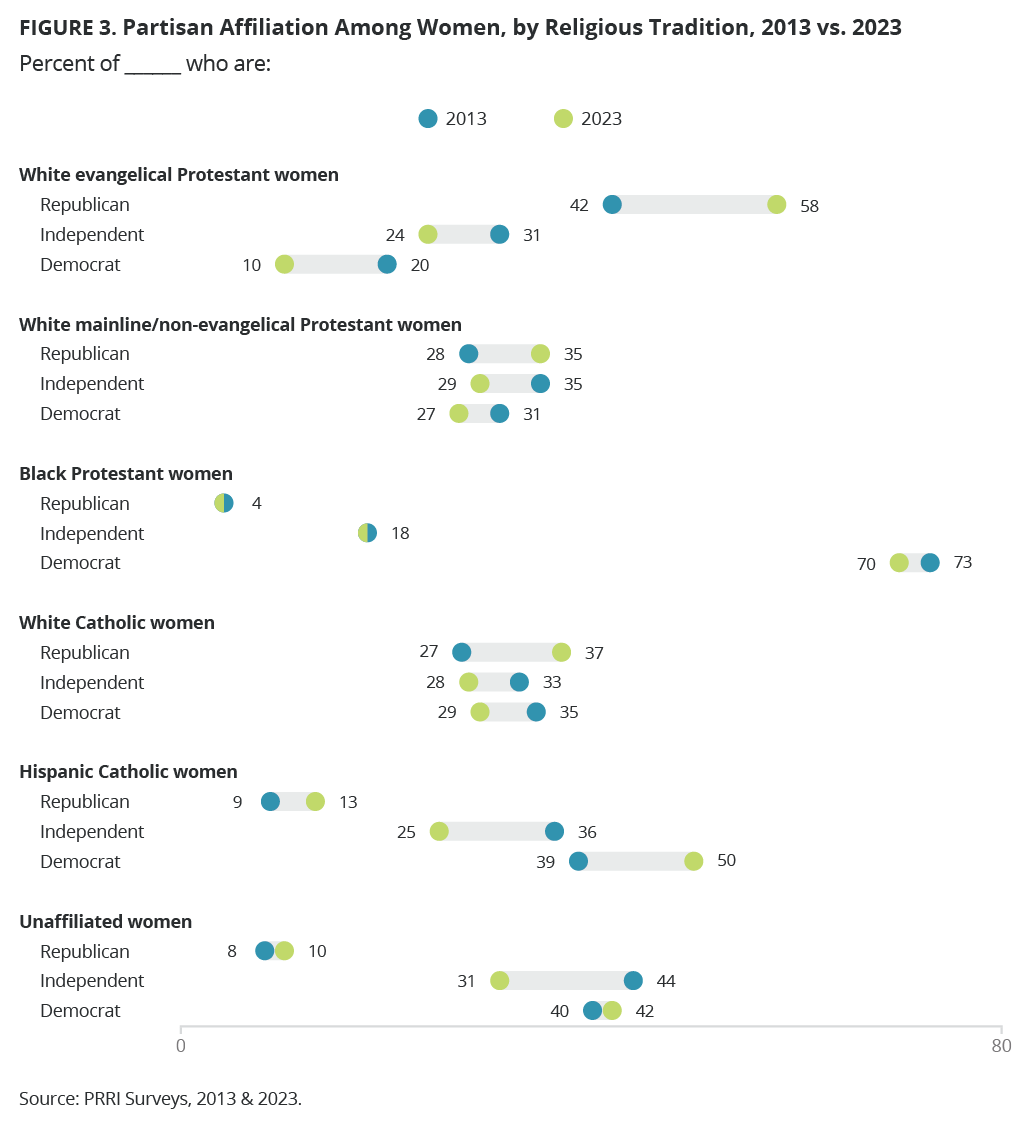
Over the last decade, there have been many shifts in partisanship among women within their respective religious traditions. Among white Protestant women, the percentage of those who identify as Republican has increased significantly from 42% in 2013 to 60% in 2023. By contrast, over the past decade, the percentage of white evangelical Protestant women who identify as independent decreased from 31% to 22%, as has the percentage who identify as Democrats (from 20% in 2013 to 11% in 2023).
As for white mainline/non-evangelical Protestant women, the share in this category who identify as Republicans has increased since 2013 from 28% to 36%, while independents have decreased from 35% to 29%, and Democrats have decreased from 31% to 27%.
Historically, Black women have been the group least likely to identify as Republican, and in recent elections, they have been one of the strongest voting blocs for Democratic presidential candidates. Black Protestant women, however, are slightly less likely to identify as Democrats in 2023 (69%) than they were a decade ago in 2013 (73%). The percentages of both independents and Republicans in this category has stayed the same over the last decade.
Partisanship among white Catholic women has shifted slightly since 2013. The share of those who identify as Republican increased slightly from 27% to 35%, while the share of those who identify as independents and Democrats decreased from 33% and 35%, respectively, in 2013, to 29% in 2023.
Among Hispanic Catholic women, the share of those who identify as Republicans increased slightly from 9% to 13%, the share of Democrats increased from 39% to 46%, and the share of those who identify as independent declined from 36% to 29% in the 2013-2023 period.
The percentages of religiously unaffiliated women who are Republican and Democrats have stayed about the same over the past decade. The percentage of independents in this category has decreased, from 44% in 2013 to 29% in 2023.[1]
Candidate Favorability Among Women Voters
Joe Biden
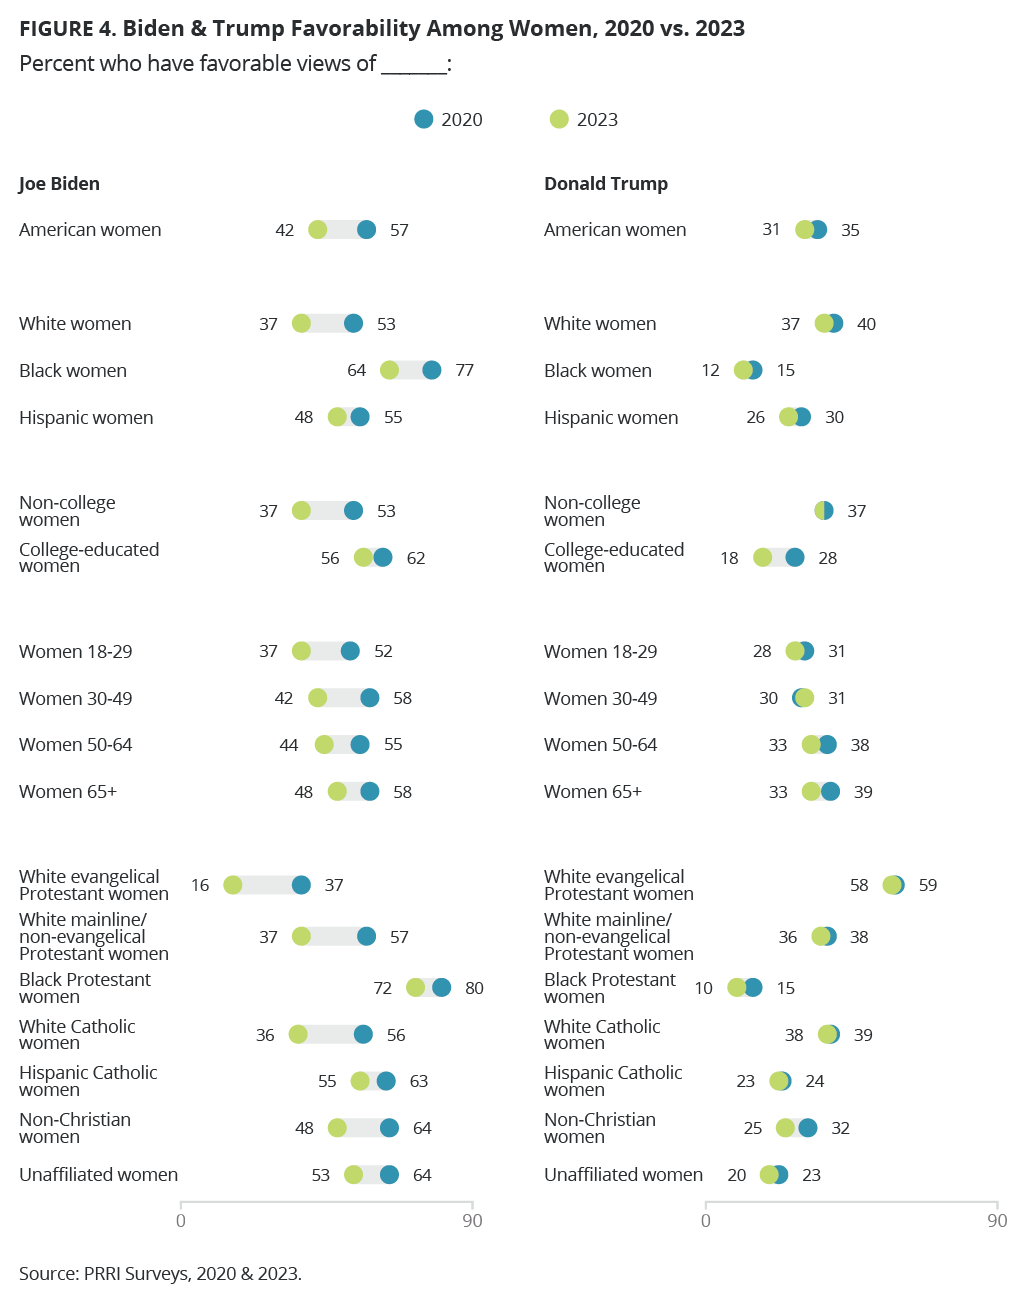
Among American women overall, President Joe Biden’s favorability has dropped in the last three years. In 2023, 42% of women viewed Biden very or somewhat favorably, while the majority of women did in 2020 (57%).
Regardless of race, Biden’s favorability dropped among women across the board. Among white women, Biden’s favorability was 37% in 2023, but in 2020, it was 53%. Among Black women, his favorability has dropped from 77% to 64% in the past three years. The percentage of Hispanic women who view Biden very or somewhat favorably has also dropped from 55% in 2020 to 48% in 2023. As of 2023, Biden’s favorability among AAPI women and multiracial women is 52% and 44%, respectively.[1]
There are also significant declines in women’s Biden favorability among women by other demographics. Among college educated women, Biden’s favorability dropped from 62% to 56% as it did for non-college educated women. Across age groups, and religious groups, Biden favorability has also declined including among white evangelical Protestant women, white mainline/non-evangelical Protestant women, white Catholic women, Black Protestant women Hispanic Catholic women, and women who belong to non-Christian religions.
Donald Trump
While former President Donald Trump’s favorability among women has always been lower than Biden’s, Trump’s favorability has continued to drop slightly over the past three years. In 2023, 31% of women viewed Trump as very or somewhat favorable, a 4-percentage point drop from 35% in 2020.
There are no meaningful changes in Trump favorability by race or religious groups among women, except for Black Protestant women whose Trump favorability decreased from 15% to 10% and non-Christian women whose Trump favorability decreased from 32% to 25%. While there are no differences in Trump favorability among women without a college degree, it declined by 10 percentage points, from 28% 2020 to 18% in 2023, among college educated women. Trump favorability also decreased among senior women (from 39% to 33%) and women ages 50-64 (from 38% to 33%) between 2020 and 2023.
Women’s Litmus Test Issues by Party Affiliation
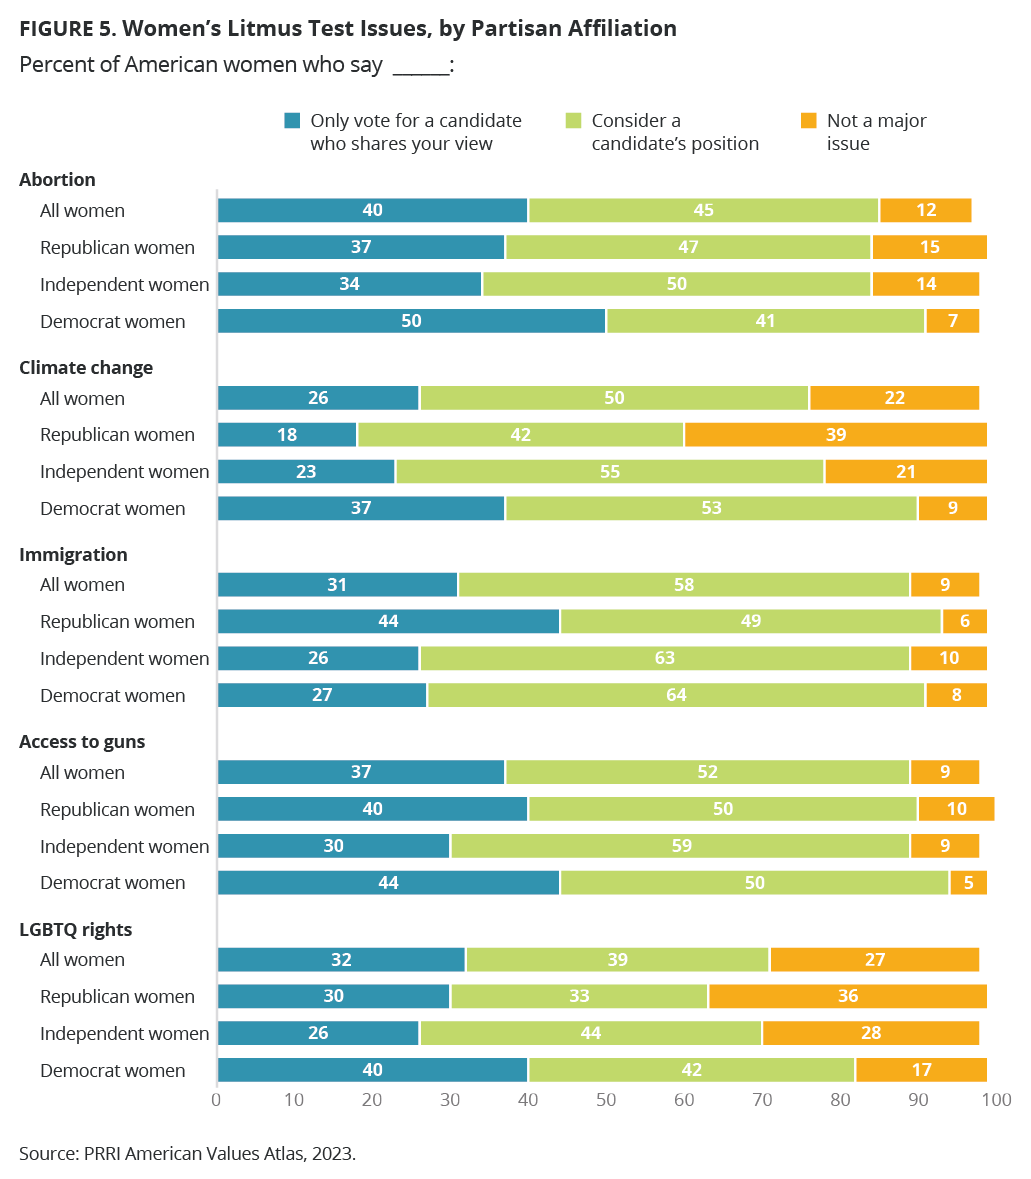
PRRI asked Americans whether they would only vote for a candidate who shares their views on a certain issue, they consider the candidate’s opinion on that issue as one of many important factors, or they do not consider that topic as a major issue.
The possible litmus test issues PRRI asked about include abortion, climate change, immigration, access to guns, and LGBTQ issues. Overall, American women are the most likely to say that a candidate’s position on abortion is non-negotiable (40%) when considering which candidate to support and least likely to say the same about climate change (26%).
When it comes to abortion, 40% of American women say they would only vote for a candidate who shares their views on this issue, compared with 45% who consider the candidate’s position on abortion as one of many important factors, and only 12% who do not view abortion as a major issue. Around one-third of Republican women and independent women (37% and 34%, respectively) say they would only vote for a candidate who shares their views on this topic. In comparison, Democratic women (50%) are roughly 15 percentage points more likely than Republican and independent women to say they would only vote for a candidate who shares their views on abortion.
When it comes to access to guns, 37% of all women would only vote for a candidate who shares their views on this topic. On the other hand, 52% would consider the candidate’s position and 9% do not view access to guns as a major issue. Independent women (30%) are less likely than Republican (40%) or Democratic women (44%) to say they would only vote for a candidate who shares their views on guns.
Roughly one-third of women (32%) would only vote for a candidate who shares their views on LGBTQ rights, compared with 39% of women who would consider the candidate’s opinion, and 27% who do not consider LGBTQ rights a major issue. Democratic women (40%) are more likely than Republican women (30%) and independent women (26%) to say they would only vote for a candidate who shares their views on LGBTQ rights.
When it comes to immigration, 31% of women would only vote for a candidate who shares their views on this topic, compared with 58% of women who would consider the candidate’s position and 9% who do not view immigration as a major issue. Republican women (44%) are more likely than independent women (26%) and Democrat women (27%) to say that immigration is a litmus test issue for them.
Finally, just over one in four women (26%) say they would only vote for a candidate who shares their views on climate change, compared with 50% who consider the candidate’s position, and 22% who do not view climate change as a major issue. Almost four in ten Democratic women (37%) would only vote for a candidate who shares their views on climate change (37%), compared with 23% of independent women and only 18% of Republican women.
[1] The percentage of women who identify with another political party or refused to answer has slightly increased from 9% to 12%.
[2] The percentage of women who are religiously unaffiliated who identify with another party or refused to answer has increased fourfold over the past decade from 5% to 19%.
[3] Numbers for AAPI and multiracial women in 2020 are too small to report.