

Asian American, Native Hawaiian, and Pacific Islander Heritage Month began as a single week of commemoration in May and has evolved into a month-long celebration to honor and promote Asian American and Native Hawaiian and Pacific Islander voices. May was selected because of two important dates at the beginning of the month: May 7 honors the first Japanese American immigrant’s arrival to the United States in 1843 and May 10 marks the 1869 completion of the transcontinental railroad, which was constructed primarily by Chinese immigrants. According to the 2020 Census, today Asian Americans account for 6.2% of the U.S. population, which is more than 20 million Americans.[1]
AANHPI Heritage Month has been particularly important to celebrate for the past few years as discrimination and hate crimes against Asian Americans drastically increased due to the COVID-19 pandemic. PRRI found in our 2022 American Values Survey that six in ten Americans (60%) say there is a lot of discrimination in the United States today against Asian people. Similarly, PRRI found in our 2022 Religious and Inclusive Spaces Survey nearly four in ten AAPI Americans (38%) said they have personally experienced hostility or discrimination based on their race over the past few years. This spotlight dives into a general profile of AAPI Americans, their views on key social issues, and their feelings toward Christian nationalism.
AAPI Americans’ Political and Religious Affiliations and Education Levels
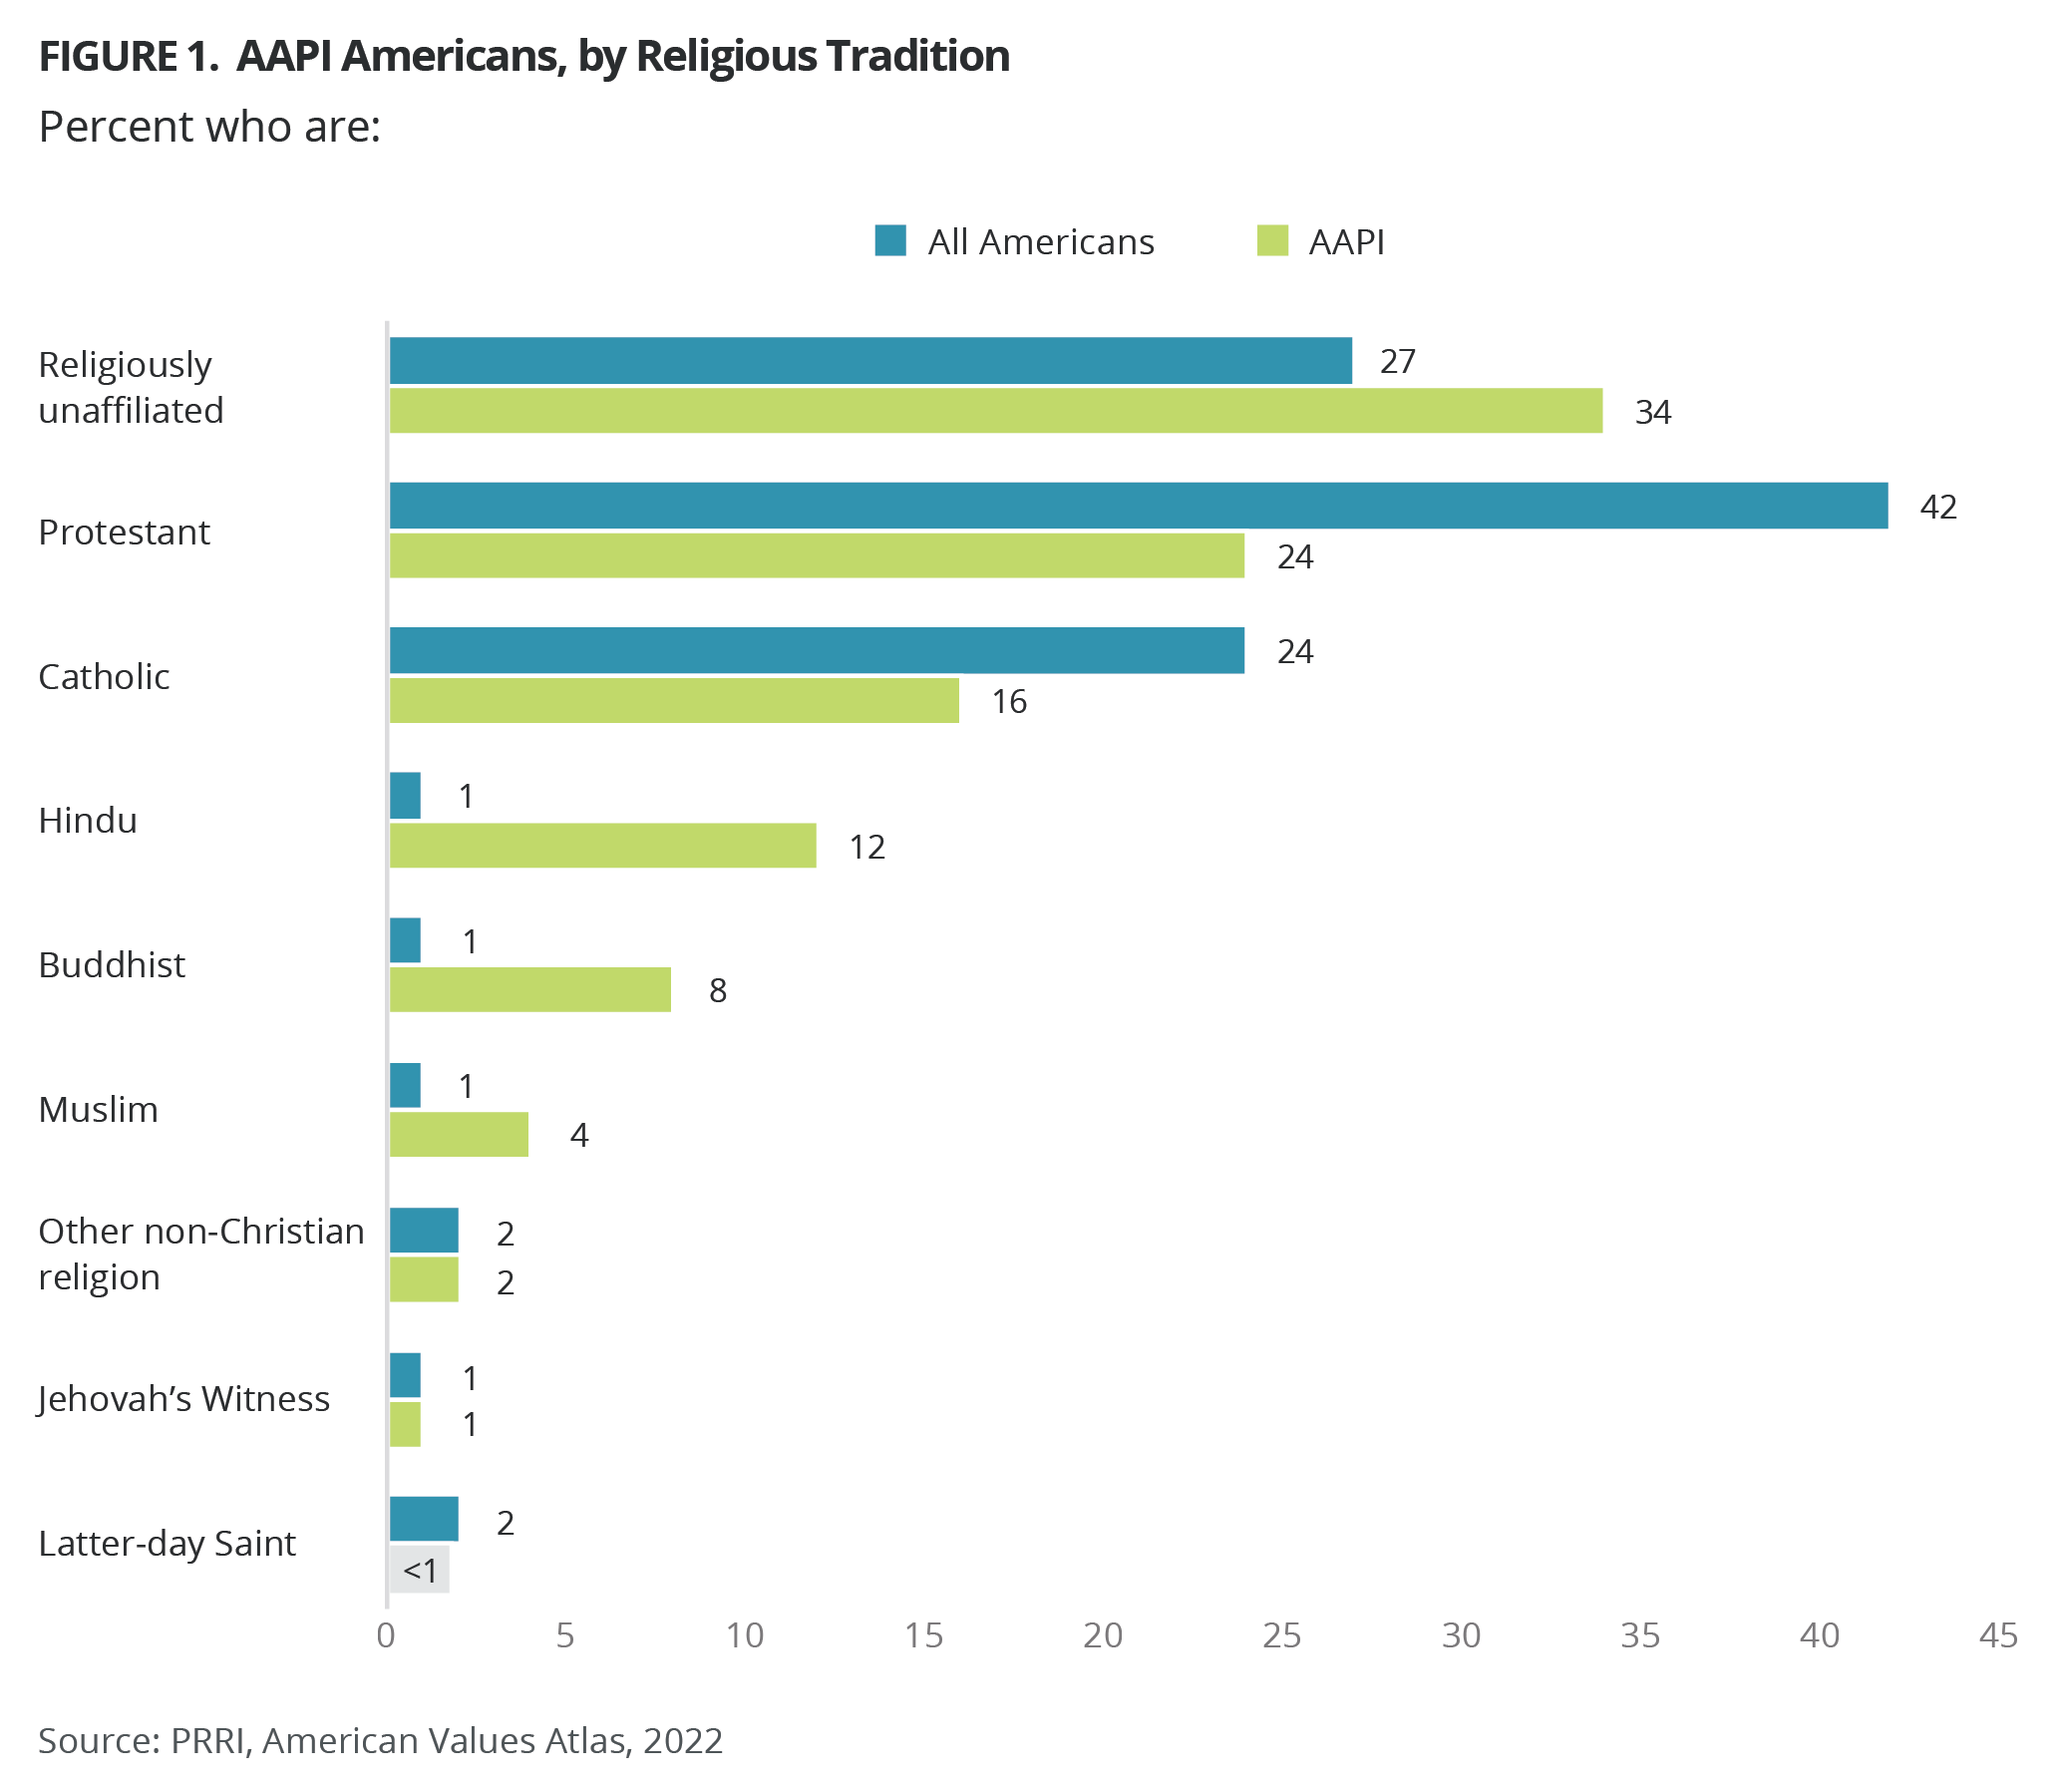
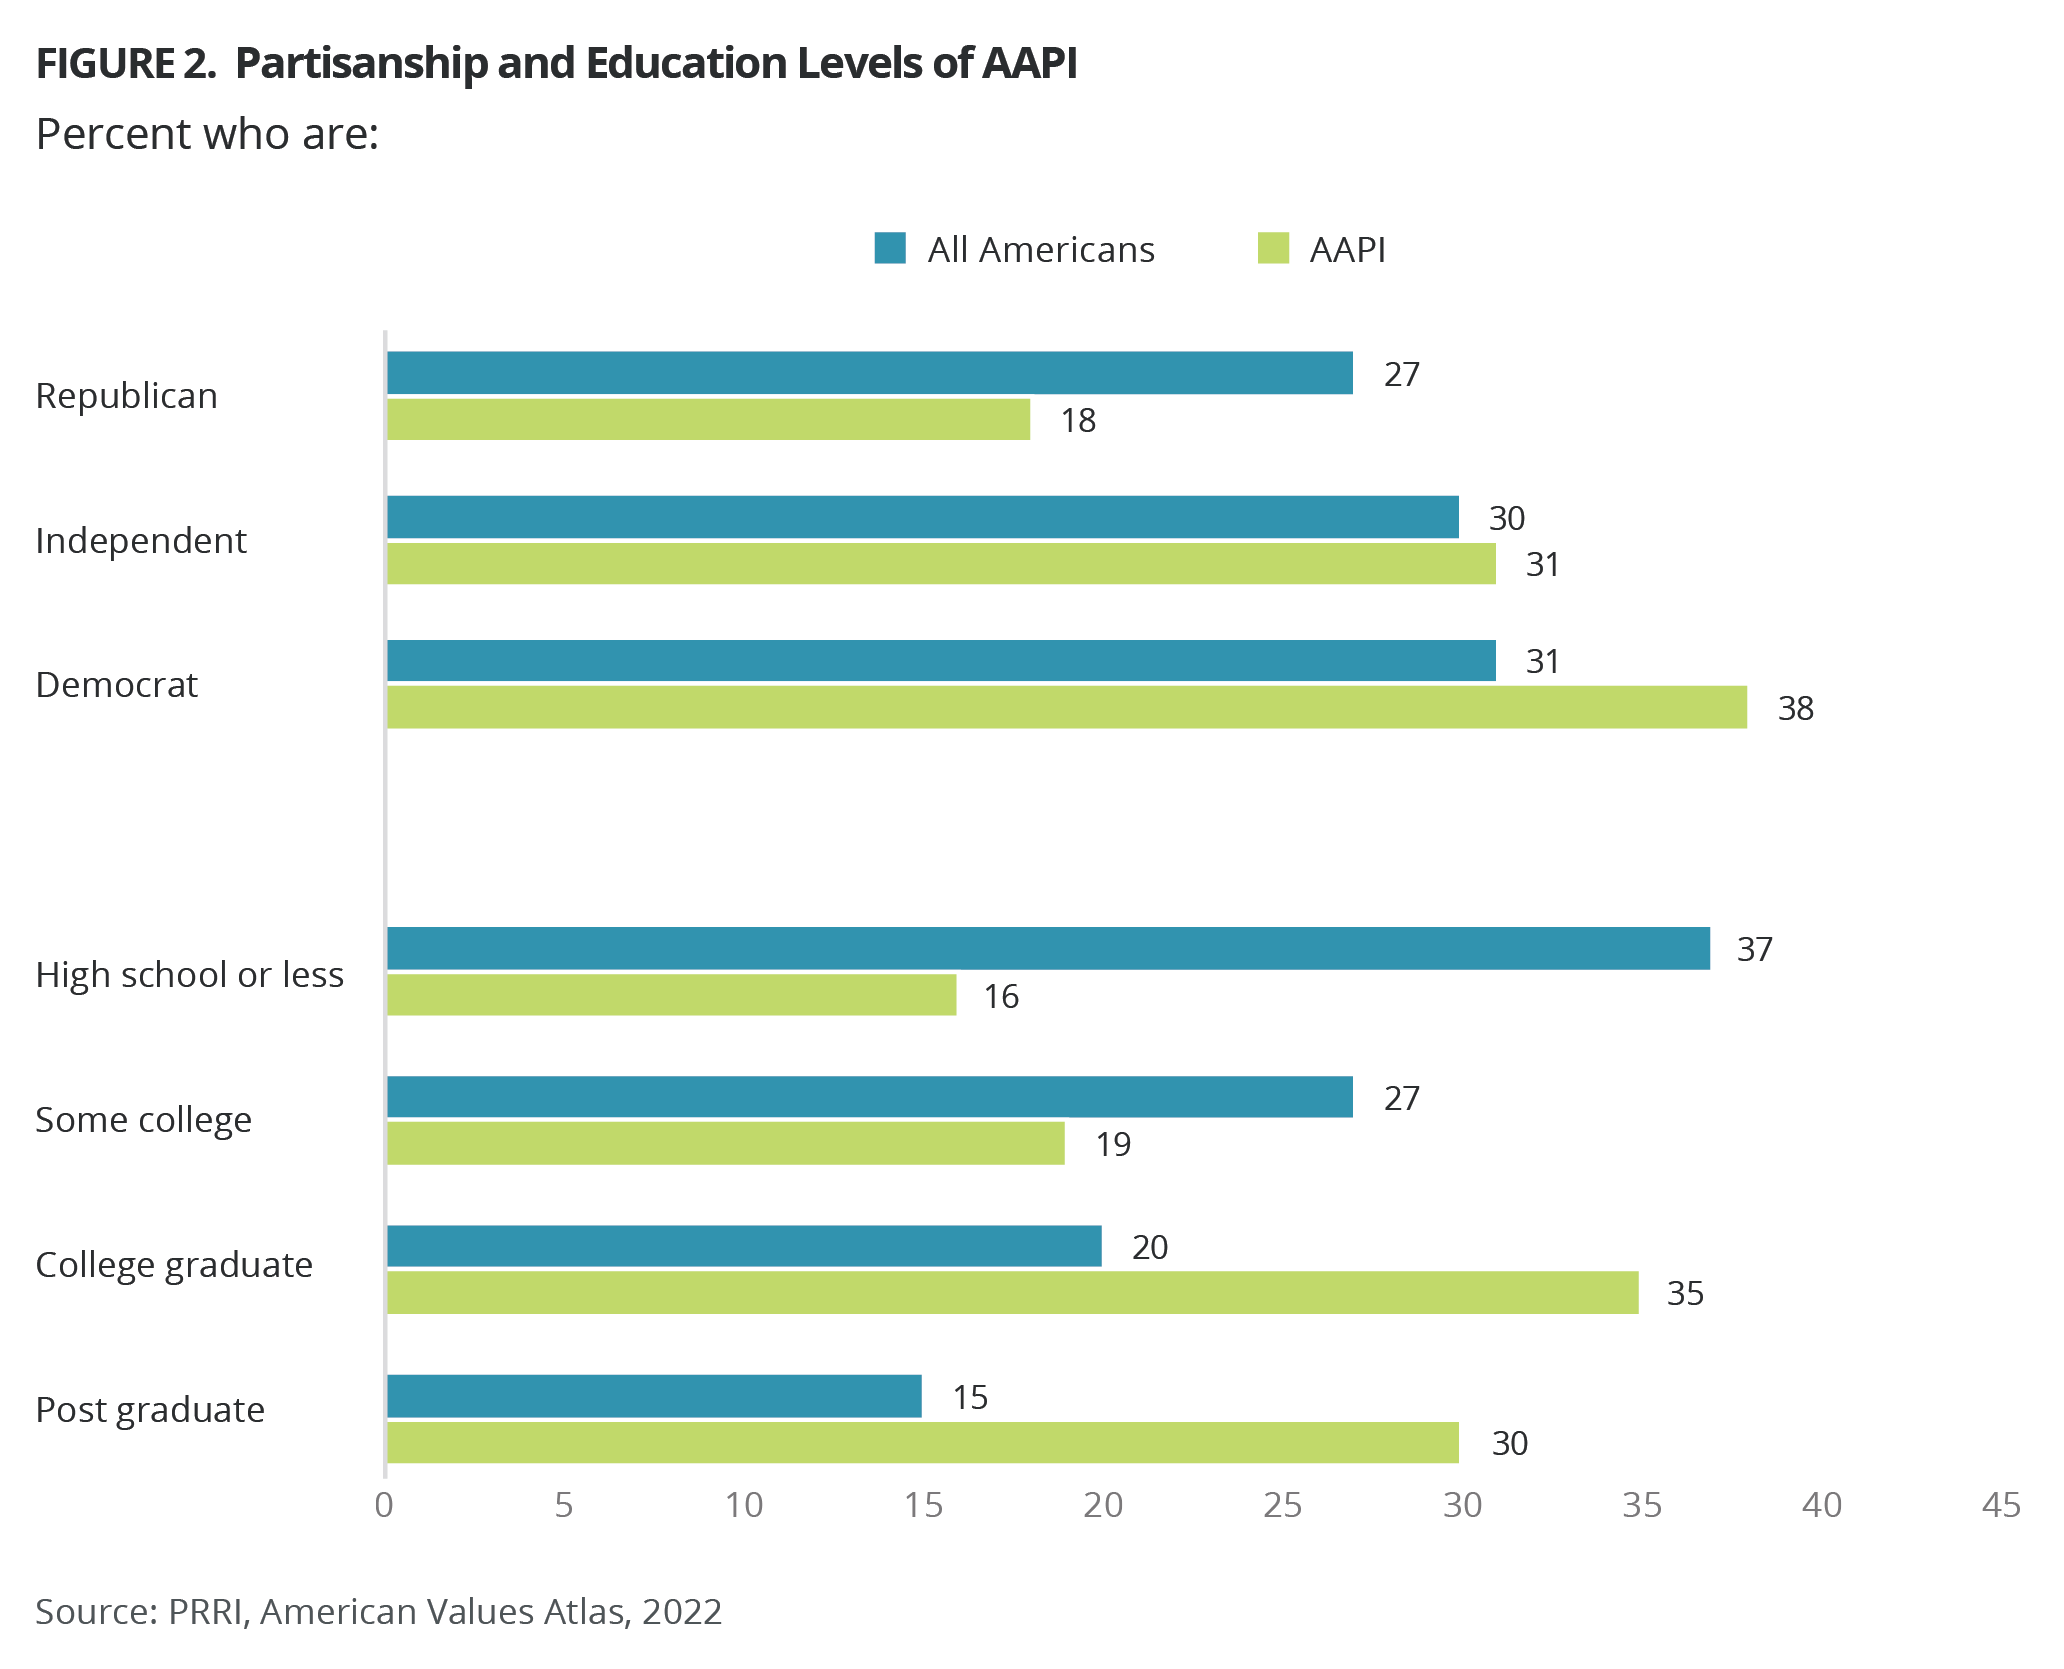
Nearly four in ten AAPI Americans (38%) identify as Democrats, with another three in ten (31%) identifying as independent. Fewer than two in ten AAPI Americans (18%) say they are Republicans. Around a third of AAPI Americans (34%) are religiously unaffiliated and another quarter practice a non-Christian religion, including 12% who are Hindu, 8% who are Buddhist, 4% who are Muslim, and 2% who identify with another non-Christian religion. One in four are Protestant (24%), with 14% saying they identify as evangelical. Fewer than two in ten AAPI Americans (16%) practice Catholicism, and less than 2% practice another form of Christianity. One-third of AAPI Americans (35%) have a college degree and another three in ten (30%) have a post-graduate degree. Around one-third have either some college education (19%) or only a high school education or less (16%).
AAPI Americans’ Views on LGBTQ Issues and Abortion Legality
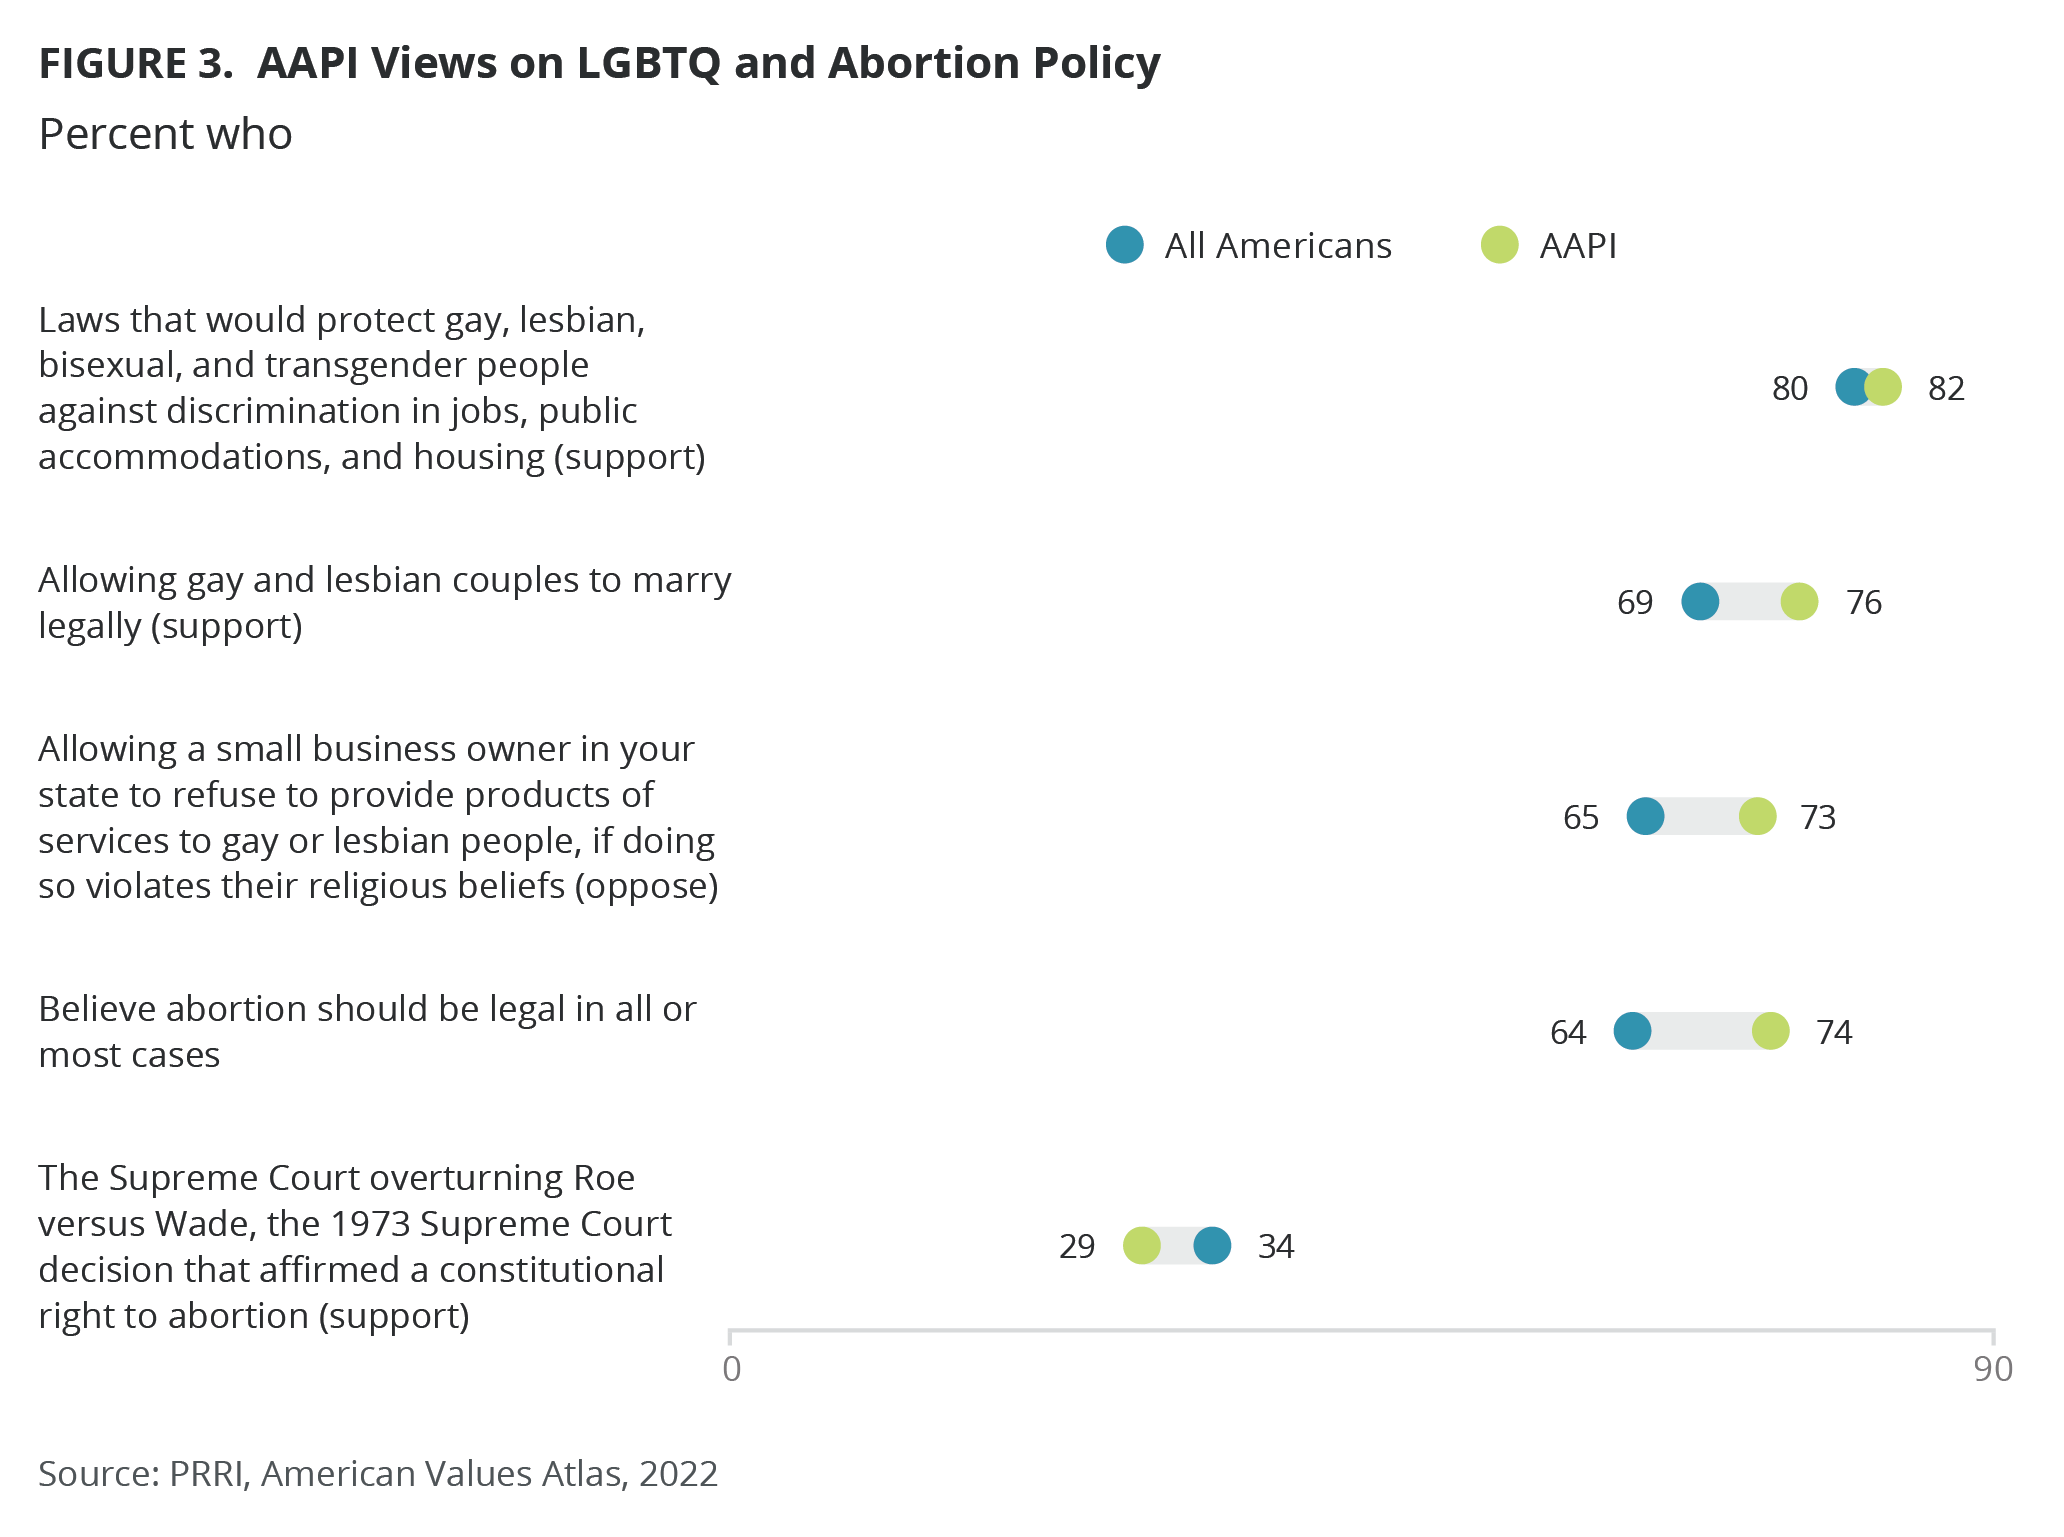
More than eight in ten AAPI Americans (82%) favor laws that protect LGBTQ people from discrimination, aligning closely with all Americans on the issue (80%). AAPI Americans are more likely than all Americans to oppose allowing businesses to refuse goods or services to LGBTQ Americans on religious grounds (73% vs. 65%, respectively). Similarly, around three-fourths of AAPI Americans (76%) favor the legality of same-sex marriage compared to 69% of all Americans.
AAPI Americans are more likely than all Americans to believe abortion should be legal in all or most cases (74% vs. 64%, respectively) and only 5% of AAPI Americans believe abortion should be illegal in all cases. They are also less likely to favor the overturn of Roe v. Wade (29% vs. 34%), with half of AAPI Americans (50%) being strongly opposed to the overturn.
AAPI Americans and Christian Nationalism
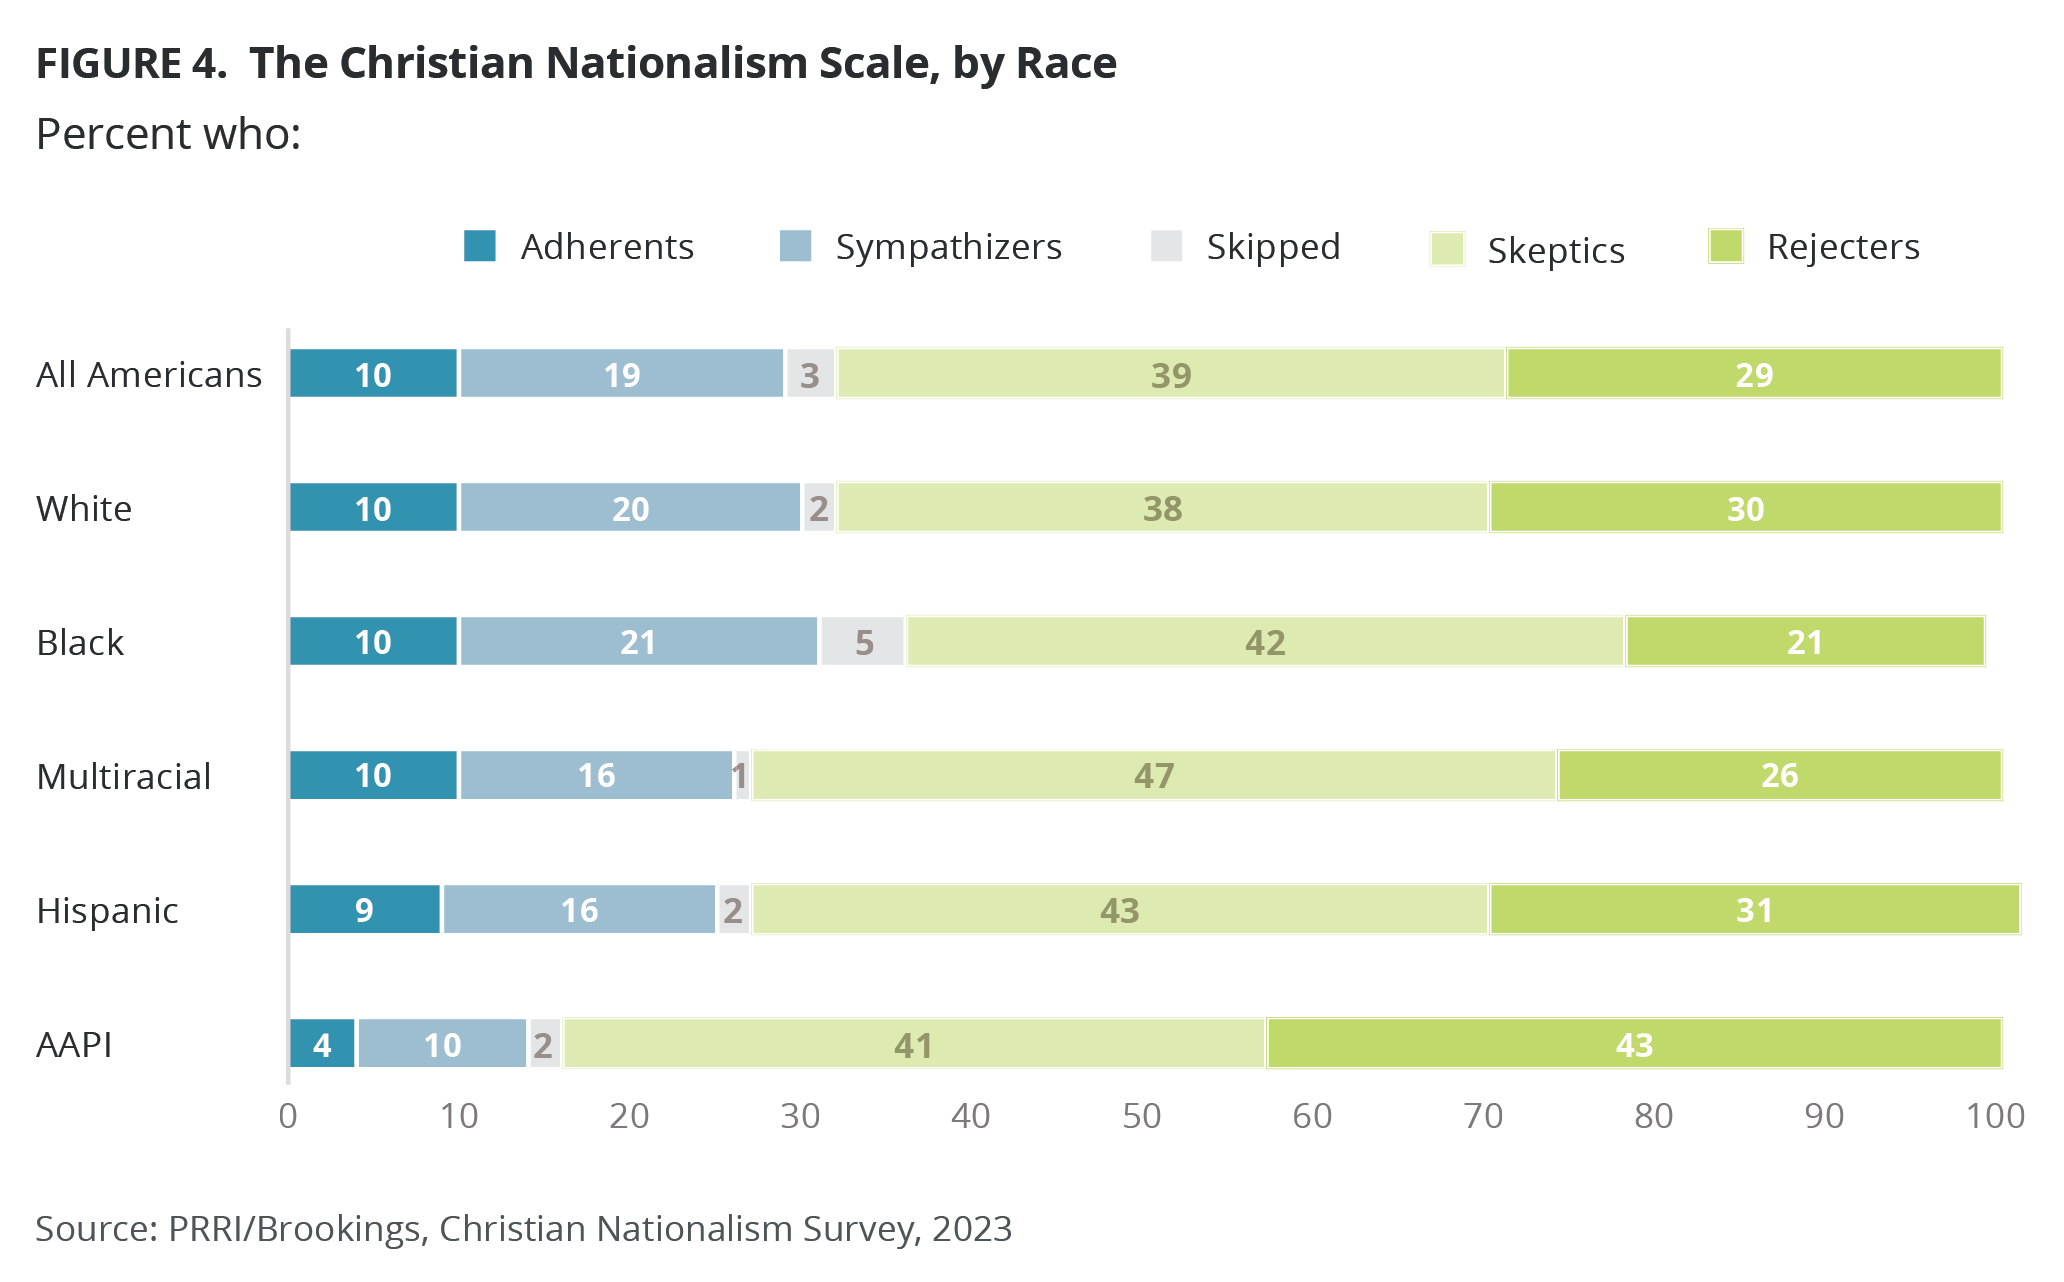
PRRI’s recent Christian nationalism survey asked a series of five questions to measure adherence to Christian nationalism. The survey found one in ten Americans (10%) to be Christian nationalism adherents, with that percentage staying consistent across almost every racial group, except for AAPI Americans (4% of AAPI Americans vs. 10% of white Americans, 10% of Black Americans, 10% of multiracial Americans, and 9% of Hispanic Americans). AAPI Americans are also less likely to be sympathizers of Christian nationalism compared to other racial groups (10% vs. 21% of Black Americans, 20% of white Americans, and 16% of multiracial and Hispanic Americans). In fact, AAPI Americans are the most likely to completely reject Christian nationalism (43% vs. 31% of Hispanic Americans, 30% of white Americans, 26% of multiracial Americans, and 21% of Black Americans).
[1] https://www.census.gov/library/stories/2022/05/aanhpi-population-diverse-geographically-dispersed.html


