Download this fact sheet as a PDF.
 This fact sheet describes the demographics, political leanings, and religious makeup of Generation Z Americans based on data from PRRI’s American Values Atlas, which surveys more than 20,000 adults across the country annually. This fact sheet examines how Gen Z adults[1] compare with older generations and takes a deeper dive into differences between Gen Z subgroups on these measures.
In January 2024, PRRI published a report based on both a national survey and nationwide focus groups to better understand Generation Z’s motivations, concerns, and behavior.
Read the report at: prri.org/research/generation-z.
Gen Z’s Racial and Ethnic Makeup and LGBTQ Identity
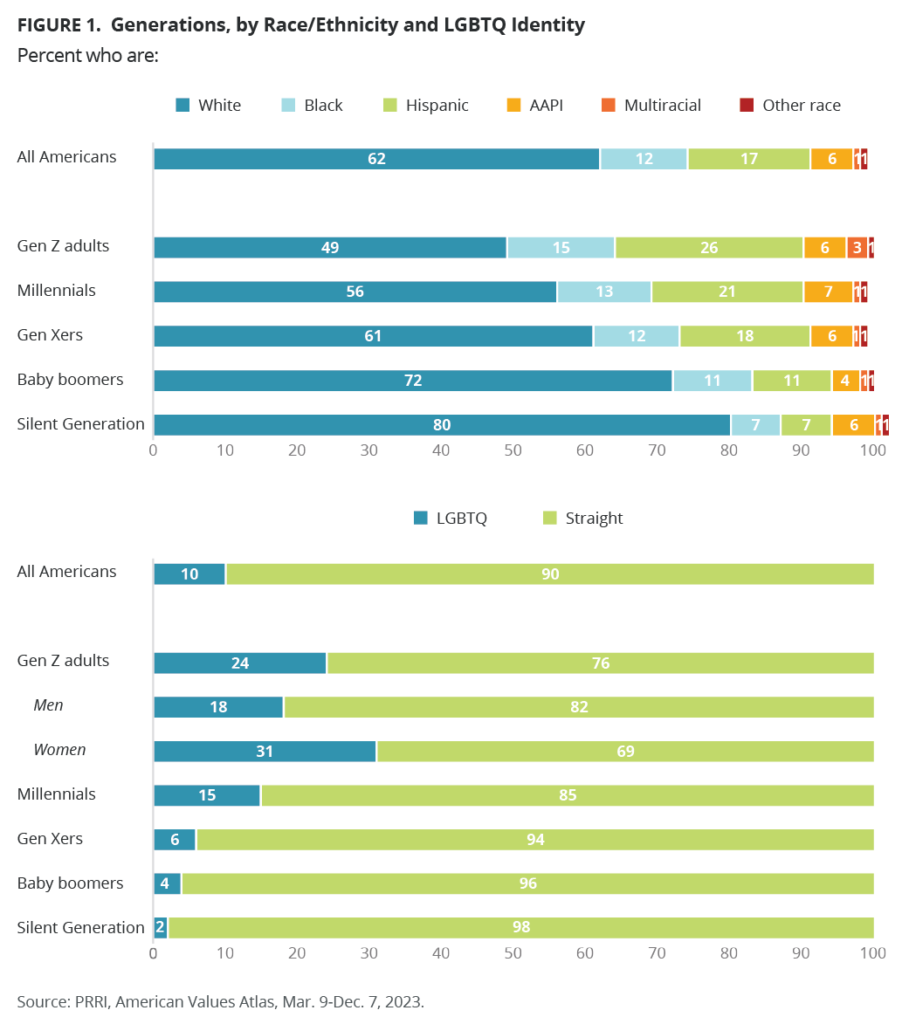
Gen Z is the only generation in which less than half of its members are white and more Gen Zers identify as LGBTQ than any other generation.
- Gen Z is 49% white compared to 56% of millennials, 61% of Gen Xers, 72% of baby boomers, and 80% of the Silent Generation.
- One-quarter of Gen Zers identify as Hispanic (26%) compared with 21% of millennials, 18% of Gen Xers, 11% of baby boomers, and 7% of the Silent Generation.
- Nearly a quarter of Gen Zers (24%) identify as LGBTQ followed by millennials at 15%, Gen X at 6%, baby boomers at 4%, and the Silent Generation at 2%.
- Within Generation Z, Gen Z women (31%) are more likely to identify as LGBTQ than Gen Z men (18%).
Gen Z’s Partisan Affiliation and Political Ideology
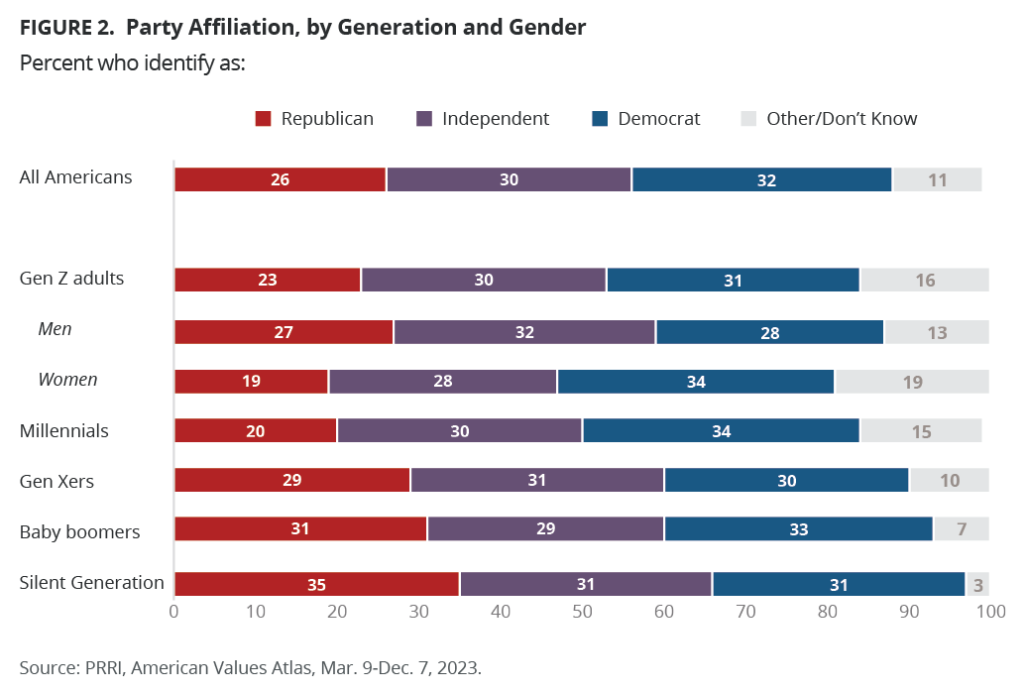
Gen Zers are less likely than older generations (except for millennials) to identify as Republican, but equally likely to identify as independent or Democrat.
- Nationally, 31% of Gen Zers identify as Democrats, 30% as independents, and 23% as Republicans. Notably, 16% of Gen Z adults answer with “other” or “don’t know.”
- Within Gen Z, women are more likely than men to identify as Democrats (34% vs. 28%, respectively) and less likely to identify as Republicans (19% vs. 27%, respectively). Around three in ten Gen Z men (32%) and women (28%) identify as independent.
- Gen Z’s partisan breakdown is closest to that of millennials (34% Democrats, 30% independent, and 20% Republican).
- Compared with Gen Z, Generation X, baby boomers, and the Silent Generation include similar percentages of Democrats and independents, but greater percentages of Republicans (by 6 percentage points, 8 points, and 12 points, respectively).
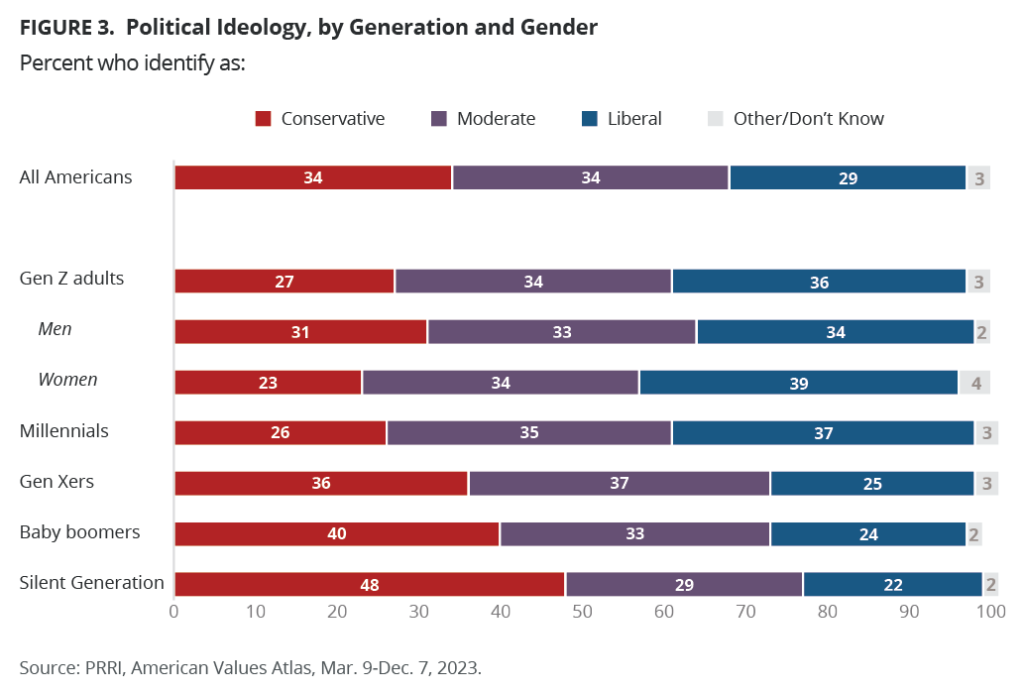
- Among Gen Z adults, 36% identify as liberal, 34% as moderate, and 27% as conservative.
- Gen Z men (31%) are more likely than Gen Z women (23%) to identify as conservative, while Gen Z women (39%) are slightly more likely than Gen Z men (34%) to identify as liberal.
- Gen Zers’ political ideology looks similar to millennials’. Both groups are less likely to identify as conservative and more likely to identify as liberal than older generations.
The Importance of Different Political Issues to Gen Z’s Vote
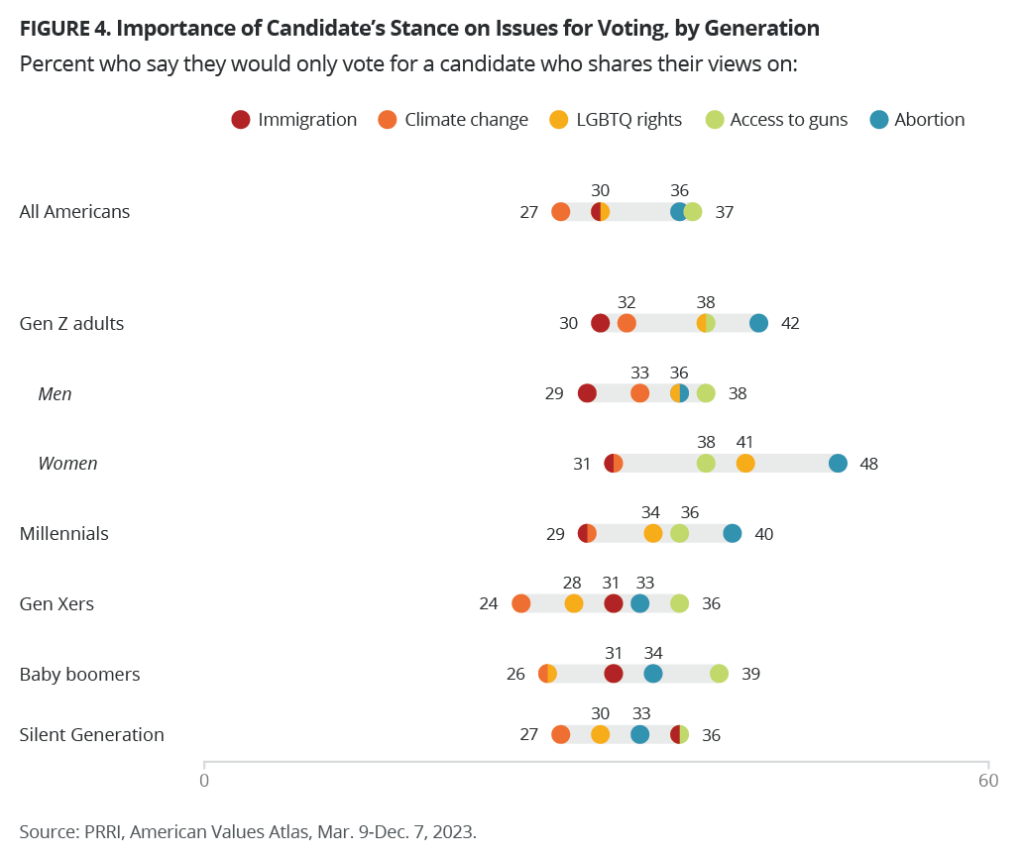
Between abortion, access to guns, LGBTQ rights, climate change, and immigration, abortion is the issue that the highest percentage of Gen Zers say is critical for a candidate to share their views.
- Gen Zers (42%) and millennials (40%) are more likely than older generations (33% of Gen Xers and the Silent Generation, and 34% of baby boomers) to only vote for a candidate who shares their views on abortion by several percentage points.
- Across all generations, a similar percentage — nearly four in ten —say they would only vote for a candidate that shares their views on access to guns.
- At 38%, Gen Z is the generation whose members are most likely to only vote for a candidate who shares their views on LGBTQ rights.
- Aside from the Silent Generation (36%), around three in ten members of all other generations would only vote for a candidate who shares their stance on immigration.
- Around three in ten Gen Zers (32%) and millennials (29%) would only vote for a candidate who shares their views on climate change compared with around a quarter of Gen Xers, baby boomers, and members of the Silent Generation.
- Gen Z women are more likely to vote for a candidate based on their positions on abortion (48%) and LGBTQ rights (41%) than Gen Z men (36% on both issues). Gen Z men and women share similar levels of importance when it comes to access to guns, climate change, and immigration.
Generation Z’s Views on LGBTQ Rights
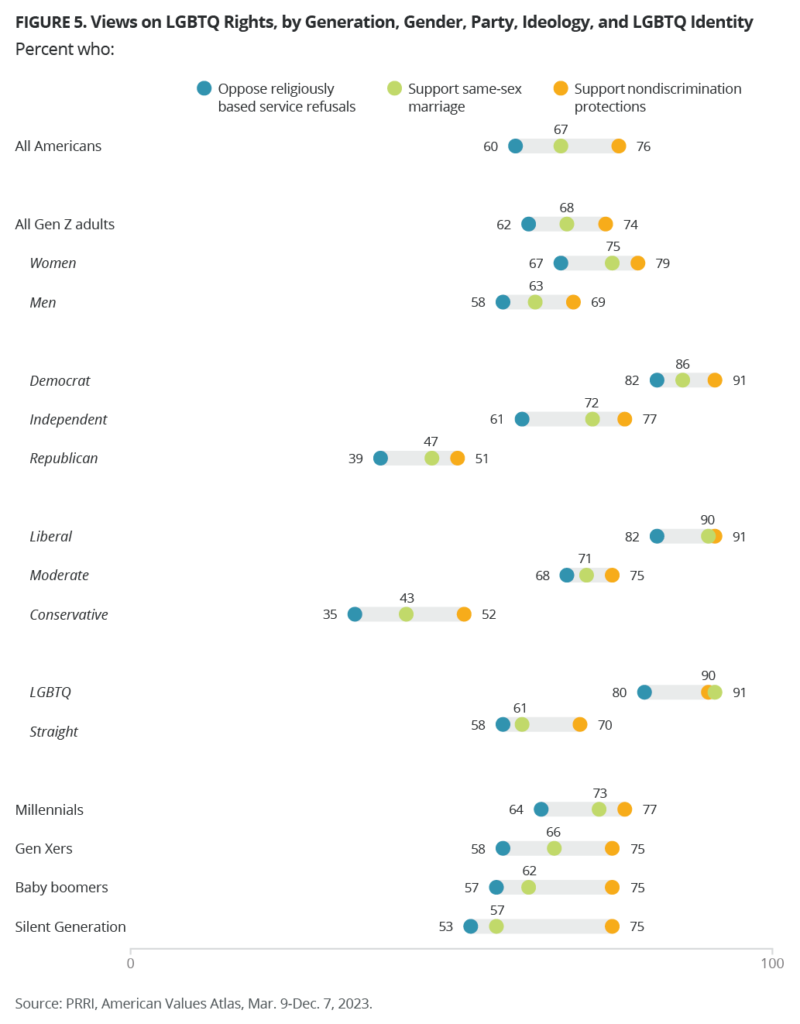
Gen Zers support nondiscrimination protections and same-sex marriage and oppose allowing small business owners to refuse service to LGBTQ people at rates comparable to those of all Americans.
- Similar to older generations, around three in four Gen Z adults (74%) support nondiscrimination protections for LGBTQ Americans, while 22% of Gen Zers oppose this policy.
- Gen Z women (79%) are more likely than Gen Z men (69%) to support LGBTQ nondiscrimination laws.
- Gen Z Democrats (91%) have the highest support for nondiscrimination protections compared with 77% of independents and 51% of Republicans.
- Unsurprisingly, the vast majority of Gen Zers who identify as LGBTQ (90%) support nondiscrimination protections compared with 70% of straight Gen Zers.
- Around six in ten Gen Z adults (62%) oppose allowing a small business to refuse to provide goods or services to LGBTQ people, if doing so goes against their religious beliefs, compared with 64% of millennials, 58% of Gen Xers, 57% of baby boomers, and 53% of the Silent Generation.
- Slightly more Gen Z women (67%) oppose allowing religiously based refusals than Gen Z men (58%).
- Gen Z Democrats (82%) are more than twice as likely to oppose religiously based service refusals than Gen Z Republicans (39%).
- Eight in ten Gen Zers who identify as part of the LGBTQ community (80%) and the majority of Gen Zers who identify as straight (58%) oppose allowing religiously based refusals.
- More than two-thirds of Gen Zers (68%) support allowing same-sex couples to marry legally, while 28% oppose. Millennials have the highest support for same-sex marriage at 73%, followed by 66% of Gen Xers, 62% of baby boomers, and 57% of the Silent Generation.
- Three-fourths of Gen Z women (75%) support same-sex marriage, compared with 63% of Gen Z men.
- The majority of Gen Z Democrats (86%) and independents (72%) support same-sex marriage, compared with less than half of Gen Z Republicans (47%).
- More than nine in ten Gen Zers who identify as LGBTQ (91%) and six in ten Gen Zers who identify as straight (61%) support same-sex marriage.
Generation Z’s Religiosity and Religious Affiliation
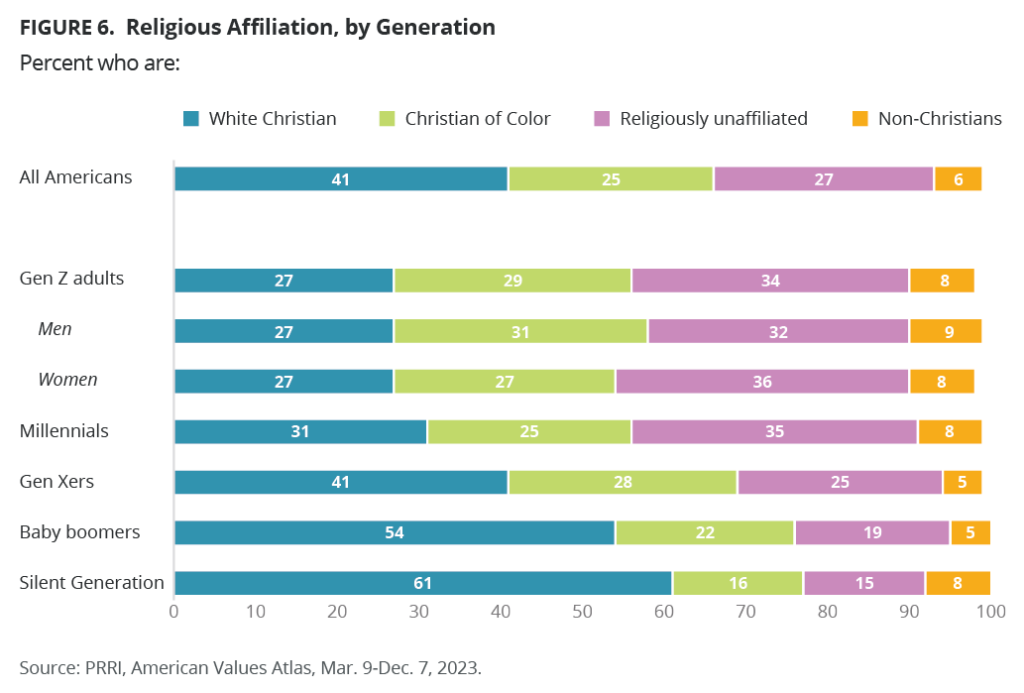
Gen Z includes more religiously unaffiliated Americans and fewer white Christians than older generations, with the exception of millennials.
- Around one-third of Gen Zers (34%) and millennials (35%) identify as religiously unaffiliated, compared with 25% of Gen Xers, 19% of baby boomers, and 15% of the Silent Generation.
- Less than half of Gen Zers, millennials, and Gen Xers identify as white Christians (27%, 31%, and 41%, respectively), compared with a majority of baby boomers (54%) and the Silent Generation (61%).
- Around three in ten Gen Zers (29%) and Gen Xers (28%), one-quarter of millennials (25%) and baby boomers (22%), and 16% of members of the Silent Generation identify as Christians of Color. Less than one in ten of each generation identifies as non-Christian.
- Two-thirds of Gen Zers are religious, this includes 10% of Gen Zers who identify as white evangelical Protestants, followed by 9% Hispanic Catholic, 8% white mainline/non-evangelical Protestant, 7% Black Protestant, 7% white Catholic, and 6% Hispanic Protestant. Just 3% of Gen Zers identify as other Protestants of Color, 2% as other Catholics of Color, 2% as Latter-day Saints, 1% as Jehovah’s Witnesses, and 1% as Orthodox Christians. The remaining religious Gen Zers belong to non-Christian religions: 2% of Gen Zers are Jewish, 2% are Muslim, 1% are Buddhist, less than 1% are Hindu, and another 2% are other non-Christian religions.
- In a shift from previous generations, Gen Z women are more likely to be religiously unaffiliated than Gen Z men (36% vs. 32%, respectively).
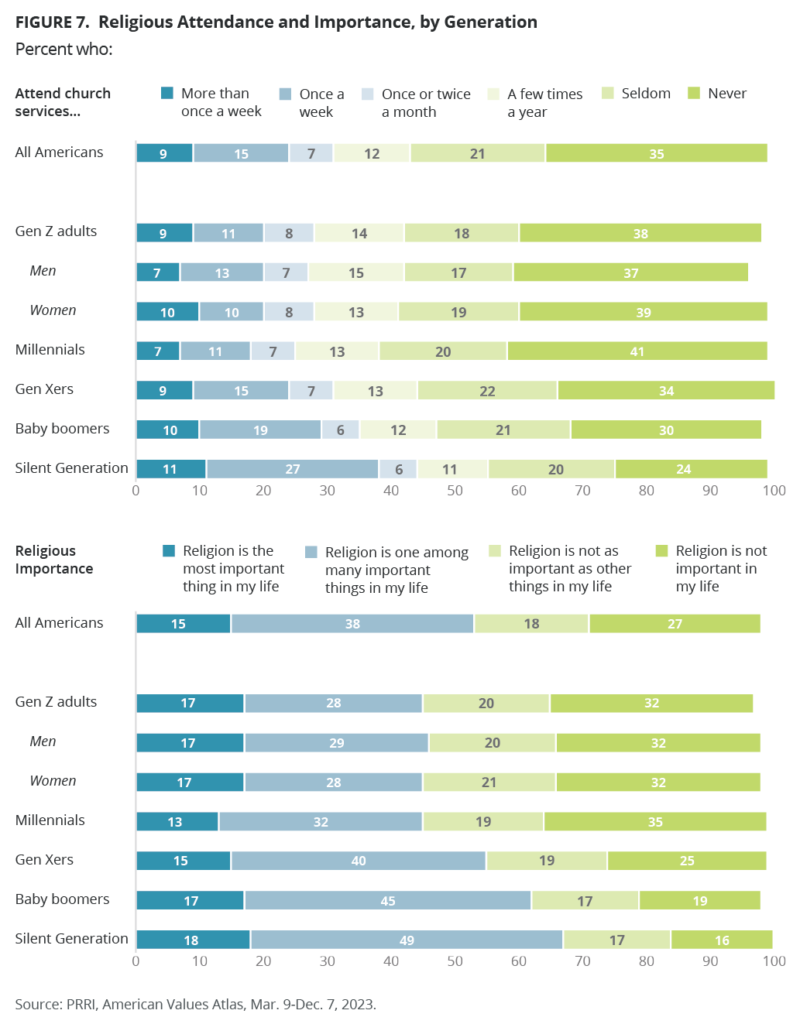
- Gen Zers (20%) are almost 20 percentage points less likely than members of the Silent Generation (38%) to attend religious services at least once a week.
- Around one in ten Gen Zers (11%) say they attend religious services once a week. Gen Zers (38%) and millennials (41%) are both more likely than older generations to say they never attend religious services.
- Fewer than half of Gen Zers and millennials say that religion is important in their life, compared with the majority of Gen Xers (55%) and baby boomers (62%) and two-thirds of the Silent Generation (67%).
- The majority of Gen Zers say religion is either not at all important (32%) or not as important as other things (20%). Fewer than two in ten Gen Zers (17%) say that religion is the most important thing in their life.
Generation Z and Christian Nationalism
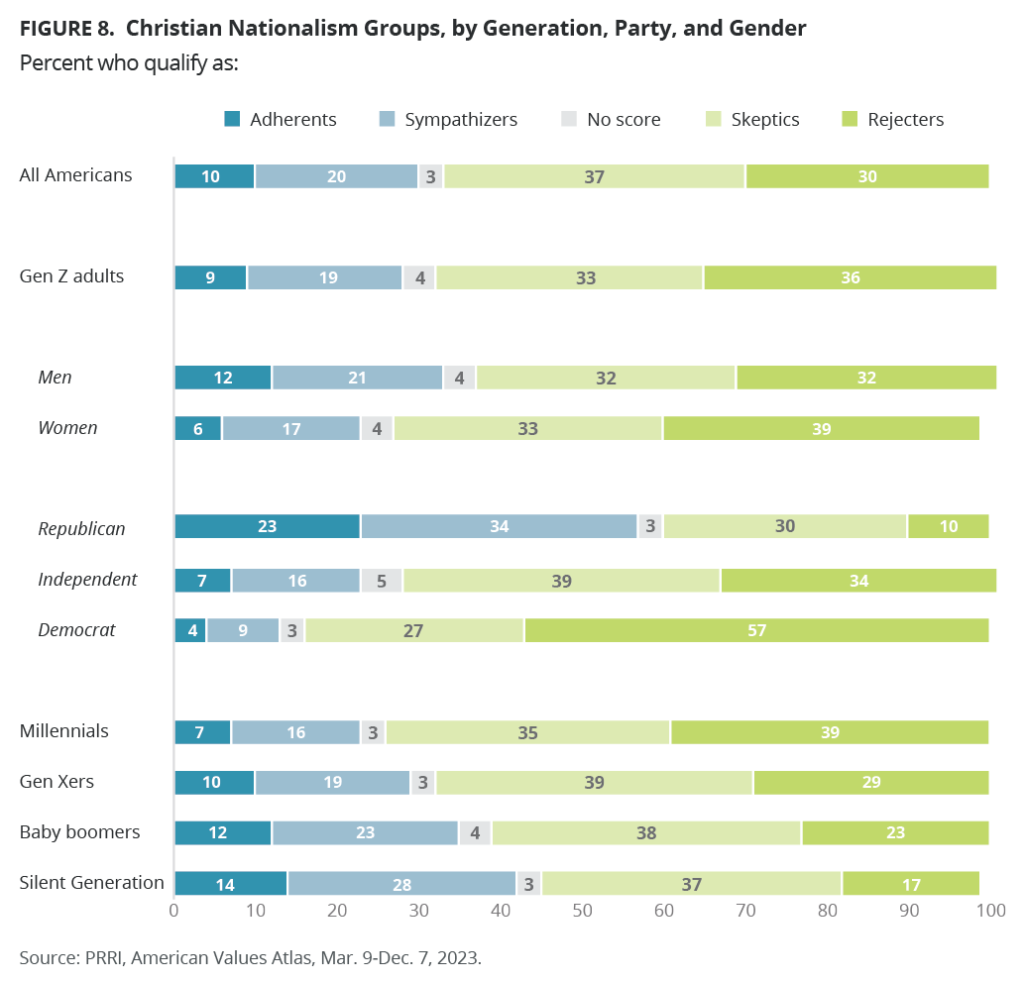
PRRI’s Christian nationalism scale places Americans into four categories (adherents, sympathizers, skeptics, and rejecters) based on their responses to five statements about the perceived relationship between Christianity, American identity, and the U.S. government.
- Around three-fourths of millennials (74%) followed by 69% of Gen Zers, 68% of Gen Xers, 61% of baby boomers, and 54% of the Silent Generation qualify as either Christian nationalism rejecters or skeptics. More than four in ten members of the Silent Generation (42%) qualify as Christian nationalism adherents or sympathizers, compared with 35% of baby boomers, 29% of Gen Xers, 28% of Gen Zers, and 23% of millennials.
- Gen Z Republicans (57%) are more than twice as likely as independents (23%) and more than four times as likely as Democrats (13%) to qualify as Christian nationalism adherents or sympathizers.
- Gen Z men (33%) are 10 percentage points more likely than Gen Z women (23%) to qualify as Christian nationalism adherents or sympathizers.
Generation Z’s Approval of President Biden and Former President Trump
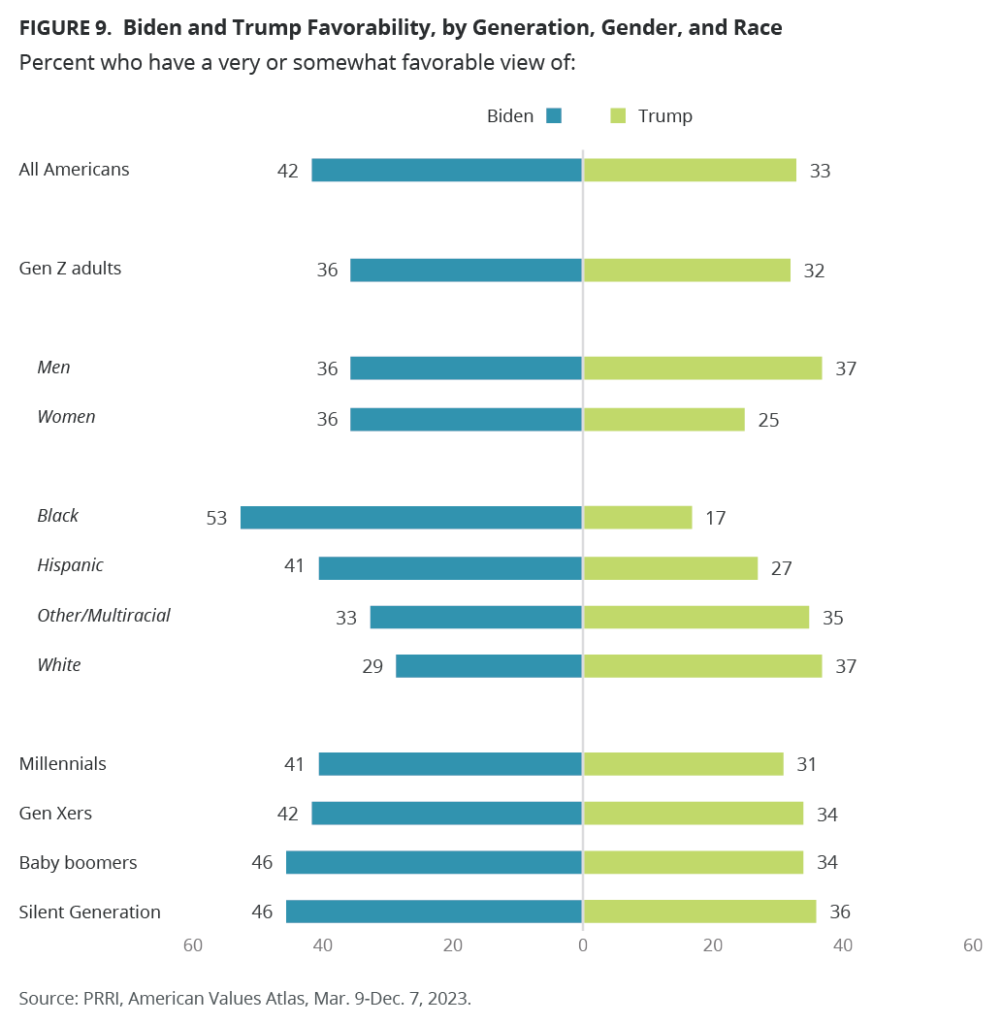
Gen Zers are less likely than members of older generations to hold favorable views of President Biden. Former President Trump’s favorability among Gen Z is similar to that of older generations.
- Fewer than four in ten Gen Zers (36%) hold favorable views of Biden, while the majority (59%) hold an unfavorable view of him.
- Within Gen Z, there is no difference by gender when it comes to Biden’s favorability.
- At 53%, Black Gen Zers are the most likely to view Biden favorably, compared with 41% of Hispanic Gen Zers, 33% of Gen Zers of other races, and 29% of white Gen Zers.
- Nearly one-third of Gen Zers (32%) have a favorable view of Donald Trump, while 63% view him unfavorably.
- Gen Z men are 12 percentage points more likely than Gen Z women to hold a favorable view of Trump (37% vs. 25%, respectively).
- White Gen Zers (37%) and Gen Zers of other racial groups (35%) are more likely than Hispanic (27%) and Black Gen Zers (17%) to hold favorable views of Trump.
About the Data
This data comes from PRRI’s American Values Atlas, an annual survey designed and conducted by PRRI. In 2023, PRRI’s American Values Atlas surveyed a random representative sample of 22,465 adults (age 18 and up) living in all 50 states and the District of Columbia. Among those, 20,799 are part of Ipsos’s KnowledgePanel and an additional 1,666 were recruited by Ipsos using opt-in survey panels to increase the sample sizes in smaller states. Interviews were conducted online between March 9 and December 7, 2023. The margin of error for the national survey is +/- 0.82 percentage points at the 95% level of confidence, including the design effect for the survey of 1.56.
[1] In this fact sheet, PRRI classifies Gen Zers as Americans ages 18-25. The terms Gen Zers and Gen Z adults are used interchangeably.