Overview of the Study
Mainline Protestant denominations have played an outsized role in America’s history, given that most of the nation’s founders were members of what we now refer to as mainline Protestant churches. Until the 1960s, more than half of American adults identified with the largest seven mainline Protestant traditions.[1] Since that time, mainline Protestant denominations have suffered significant declines in membership, although their membership numbers have stabilized somewhat in the past few years.
Mainline Protestants remained arguably the most neglected of the major religious groups in the American landscape. Unlike white evangelical Protestant clergy and clergy from predominately Black Protestant denominations, mainline Protestant clergy historically are less politically aligned with their congregants and face congregations that are more ideologically diverse.[2]
The perspectives of mainline Protestant clergy merit more consideration for several reasons, including their role as leaders within their churches and their local communities. Studies show that clergy often have a significant role in influencing their congregants’ religious and cultural views.
Moreover, PRRI’s 2022 American Values Atlas shows that white mainline Protestants remain one of the country’s largest religious groupings, comprising approximately 14% of the United States population today. Mainline Protestants are the only major Protestant denominational family that holds significant numbers of both Democrats and Republicans within its ranks — and they represent a potential swing constituency in many states in an increasingly divided and polarized electorate.
This study considers the perspectives of mainline Protestant clergy from the seven largest mainline Protestant denominations on the cultural and political divides facing the nation, and how such divides may be impacting their own congregations. We consider the extent to which mainline Protestant clergy are discussing political and cultural issues in their churches, the political challenges they see within their churches, and the overall well-being of their congregations. We also consider how these views among mainline Protestant clergy compare with many of the same issues among white mainline Protestants nationally who are regular churchgoers, drawing from our May 2023 Health of American Congregations study, as well as all regular churchgoers from Christian traditions. [3] This study also considers differences among clergy based on urbanization to determine if clergy from rural areas are distinct from clergy in suburban or urban areas. This analysis will help shed light on where clergy and mainline congregants align on political and cultural values, revealing both the challenges facing the vitality of America’s churches and potential opportunities for bridging divides.
A Brief Note About Methodology
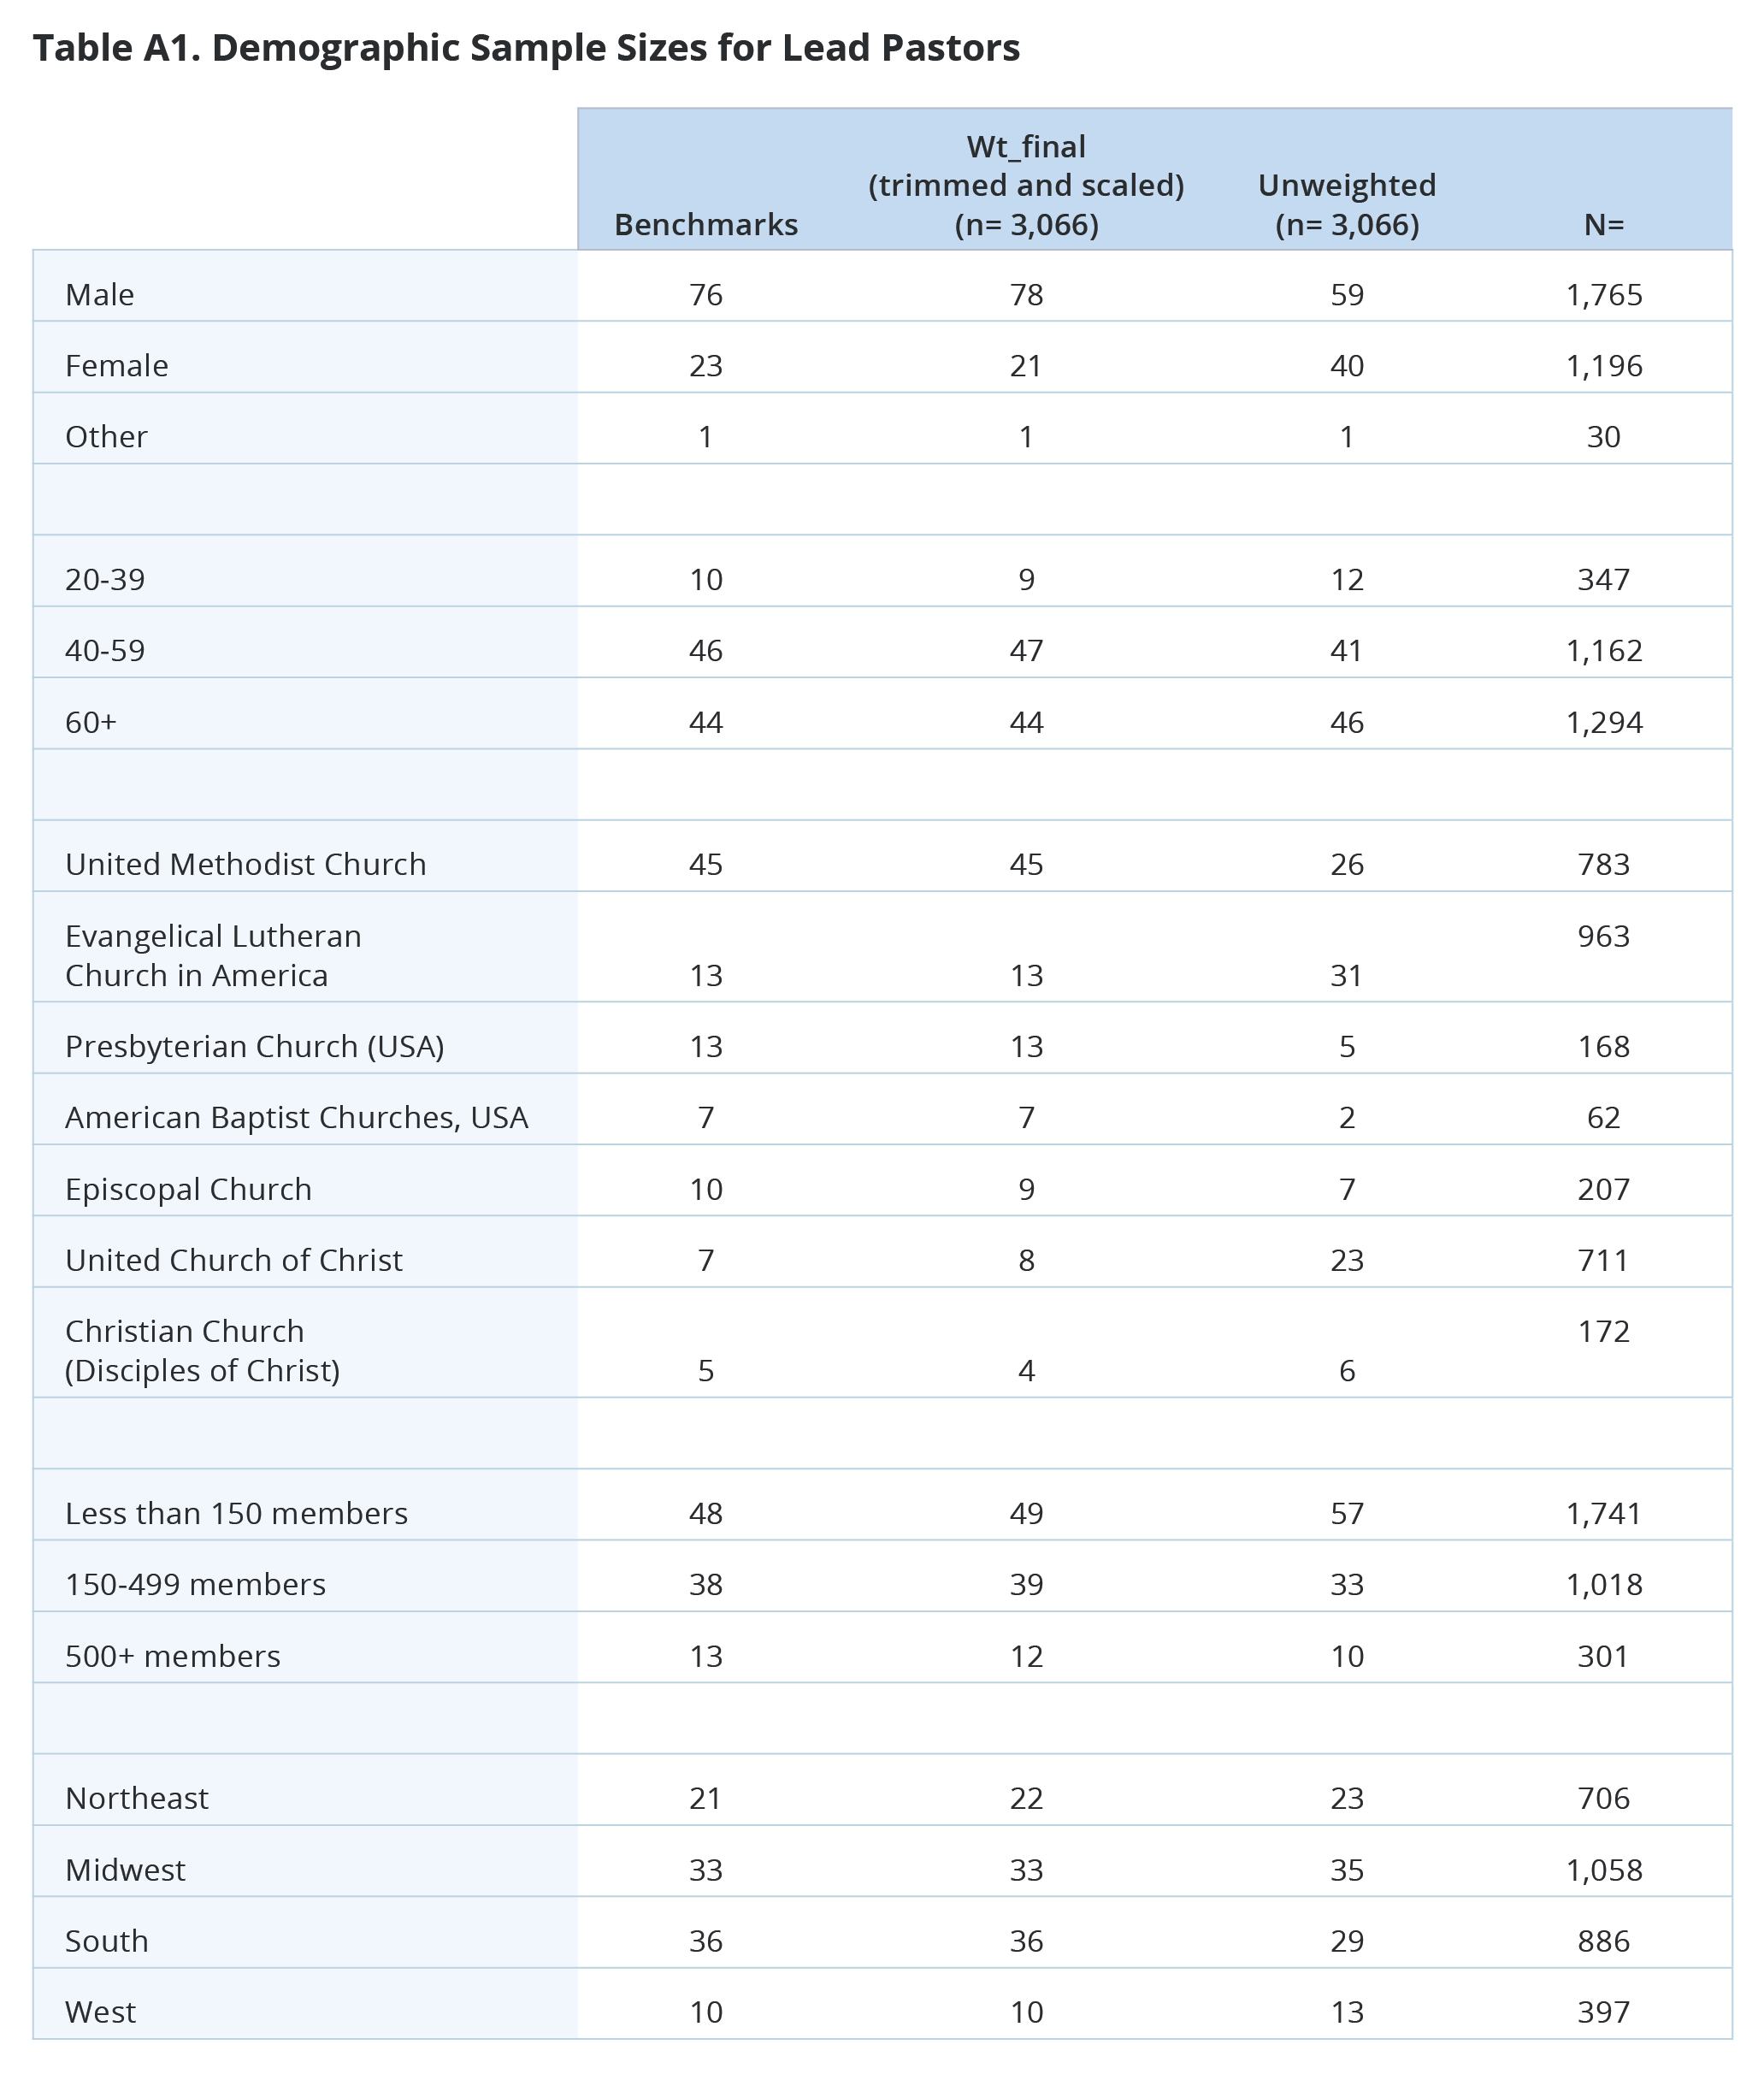
For this study, we surveyed 3,066 mainline clergy who lead congregations from each of the seven largest mainline Protestant denominations: The United Methodist Church (UM), the Evangelical Lutheran Church in America (ELCA), the American Baptist Churches USA. (ABCUSA), the Presbyterian Church (USA) (PCUSA), the Episcopal Church, the United Church of Christ (UCC), and the Christian Church (Disciples of Christ) (DOC). In most cases, we worked with denominational offices, who sent our survey to all clergy who lead congregations. In the case of the United Methodist Church, we compiled a sample of United Methodist clergy through a variety of methods, resulting in a primary sampling frame of approximately two-thirds of active clergy in the denomination and we contacted those clergy via email. We weighted the data to adjust for age, gender, race/ethnicity, Census region, congregation size, and denomination to reflect the relative size of each denomination in the general population. This strategy allows us to have a sense of the relative influence of clergy from each denomination on the population of clergy from these denominations as a whole. [4] We discuss the methodology in detail in the appendix.
Clergy Profile
Clergy Demographics
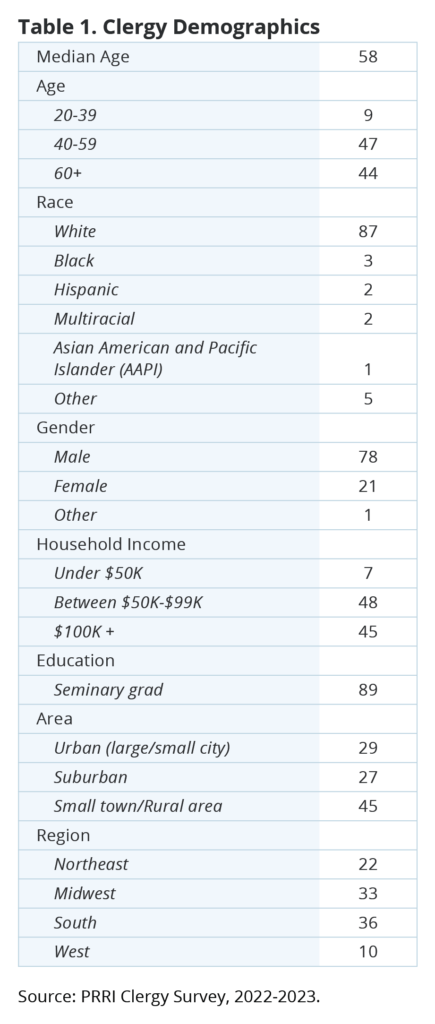
Mainline clergy in our study are overwhelmingly white (87%) and male (78%) with a median age of 58.[5] Mainline clergy are highly educated, with 89% holding either a seminary degree or a post‐seminary graduate degree. Reflecting their higher educational levels, household incomes are fairly high compared to the general population, with 45% of clergy having household incomes $100,000 or higher.
About one‐third of clergy reside in the South and Midwest (36% and 33%, respectively), 22% live in the Northeast, and 10% are found in the West. A plurality (45%) of mainline clergy lives in rural areas or small towns. About three in ten (29%) live in large or small urban areas and 27% live in suburban areas.
Seventeen percent of mainline clergy say they serve more than one church. [6] United Methodist (UM) clergy are the most likely to say they serve more than one church (26%). Sixteen percent of Evangelical Lutheran Church in America (ELCA) clergy as well as 10% of Episcopal clergy say they serve more than one church. Fewer than one in ten Presbyterian Church in the USA (PCUSA) (7%), United Church of Christ (UCC) (7%), American Baptist (ABCUSA) (5%), and Disciples of Christ (DOC) (4%) clergy say they serve more than one church.[7]
Church Demographics and Attendance
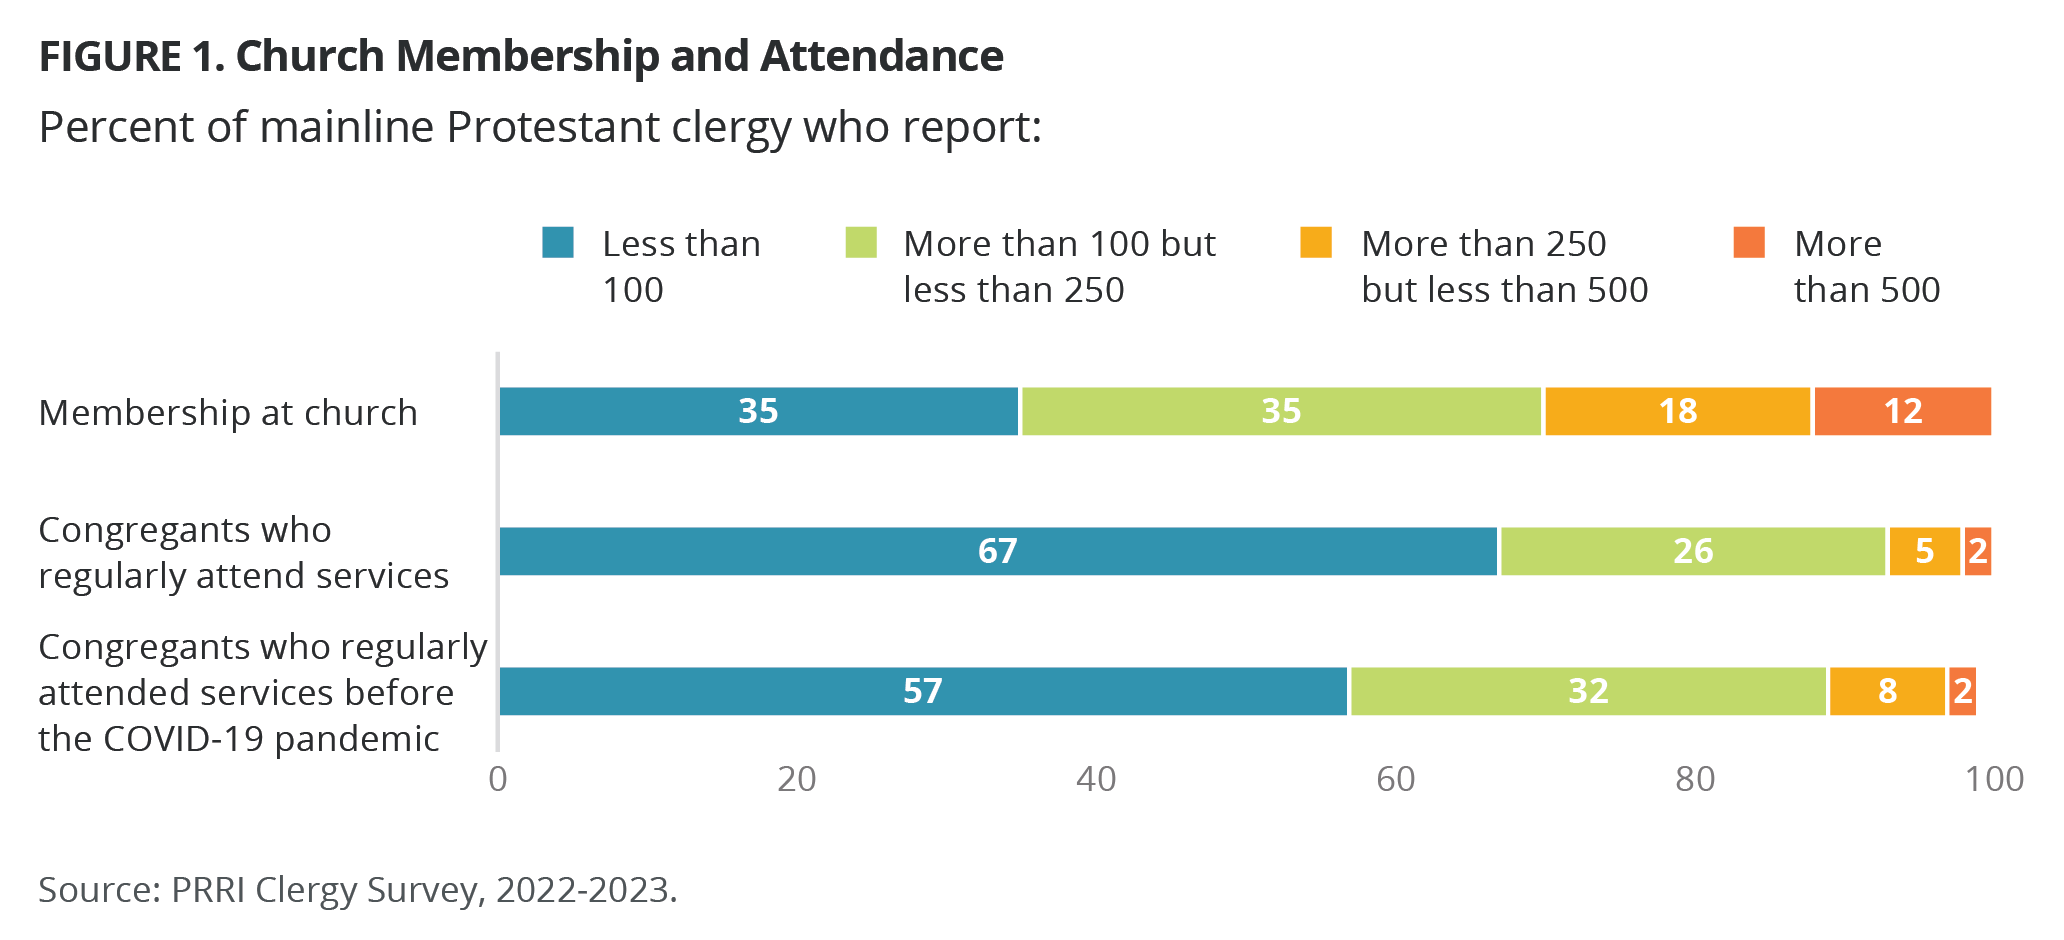
Over one-third (35%) of mainline clergy in our survey preach to modestly sized congregations between 100 and 250 members. The same proportion of mainline clergy (35%) report smaller average membership of less than 100. About two in ten clergy (18%) say they have 250 to 500 members, and 12% of clergy say they have more than 500 members.
Two-thirds of mainline clergy (67%) say less than 100 people regularly attend services at their church. About one in four clergy (26%) say between 100 and 250 people, while 7% say 250 or more people attend services regularly at their church. The distribution of these numbers differs from those before the COVID-19 pandemic began in March 2020. Nearly six in ten mainline clergy (57%) say less than 100 people regularly attended services at their church before the pandemic, about one-third (32%) say between 100 and 250 people and only 10% say 250 or more people attended services regularly before the pandemic.
 Nine in ten clergy in the study (90%) report that their congregations are primarily white, while 5% say their congregation is multiracial, 2% say it is primarily Black, 1% say it is primarily Hispanic or Latino, and 1% say it is primarily another race or ethnicity.
Forty-five percent of clergy classify their congregations as upper-middle class, 24% as lower-middle class, and 3% classify their congregations as either working class/poor or upper class/wealthy. By contrast, 25% of mainline clergy report working in congregations that are mixed in terms of socio‐economic status.
About one‐fourth (23%) of clergy have been at their present church for ten or more years. Among those who serve in an ordained ministry role at their current church, 14% say they have served less than a year, 37% say they have served more than one year but less than five years, 26% say they have served more than five years but less than 10 years. With the exception of ABCUSA clergy (54%), about one-quarter of mainline clergy across denominations have served more than 10 years in their current congregations. This includes 29% of PCUSA and UCC, 27% of ELCA, 23% of Episcopalian, 20% of DOC, and 14% of UM clergy.
Party Affiliation and Political Ideology
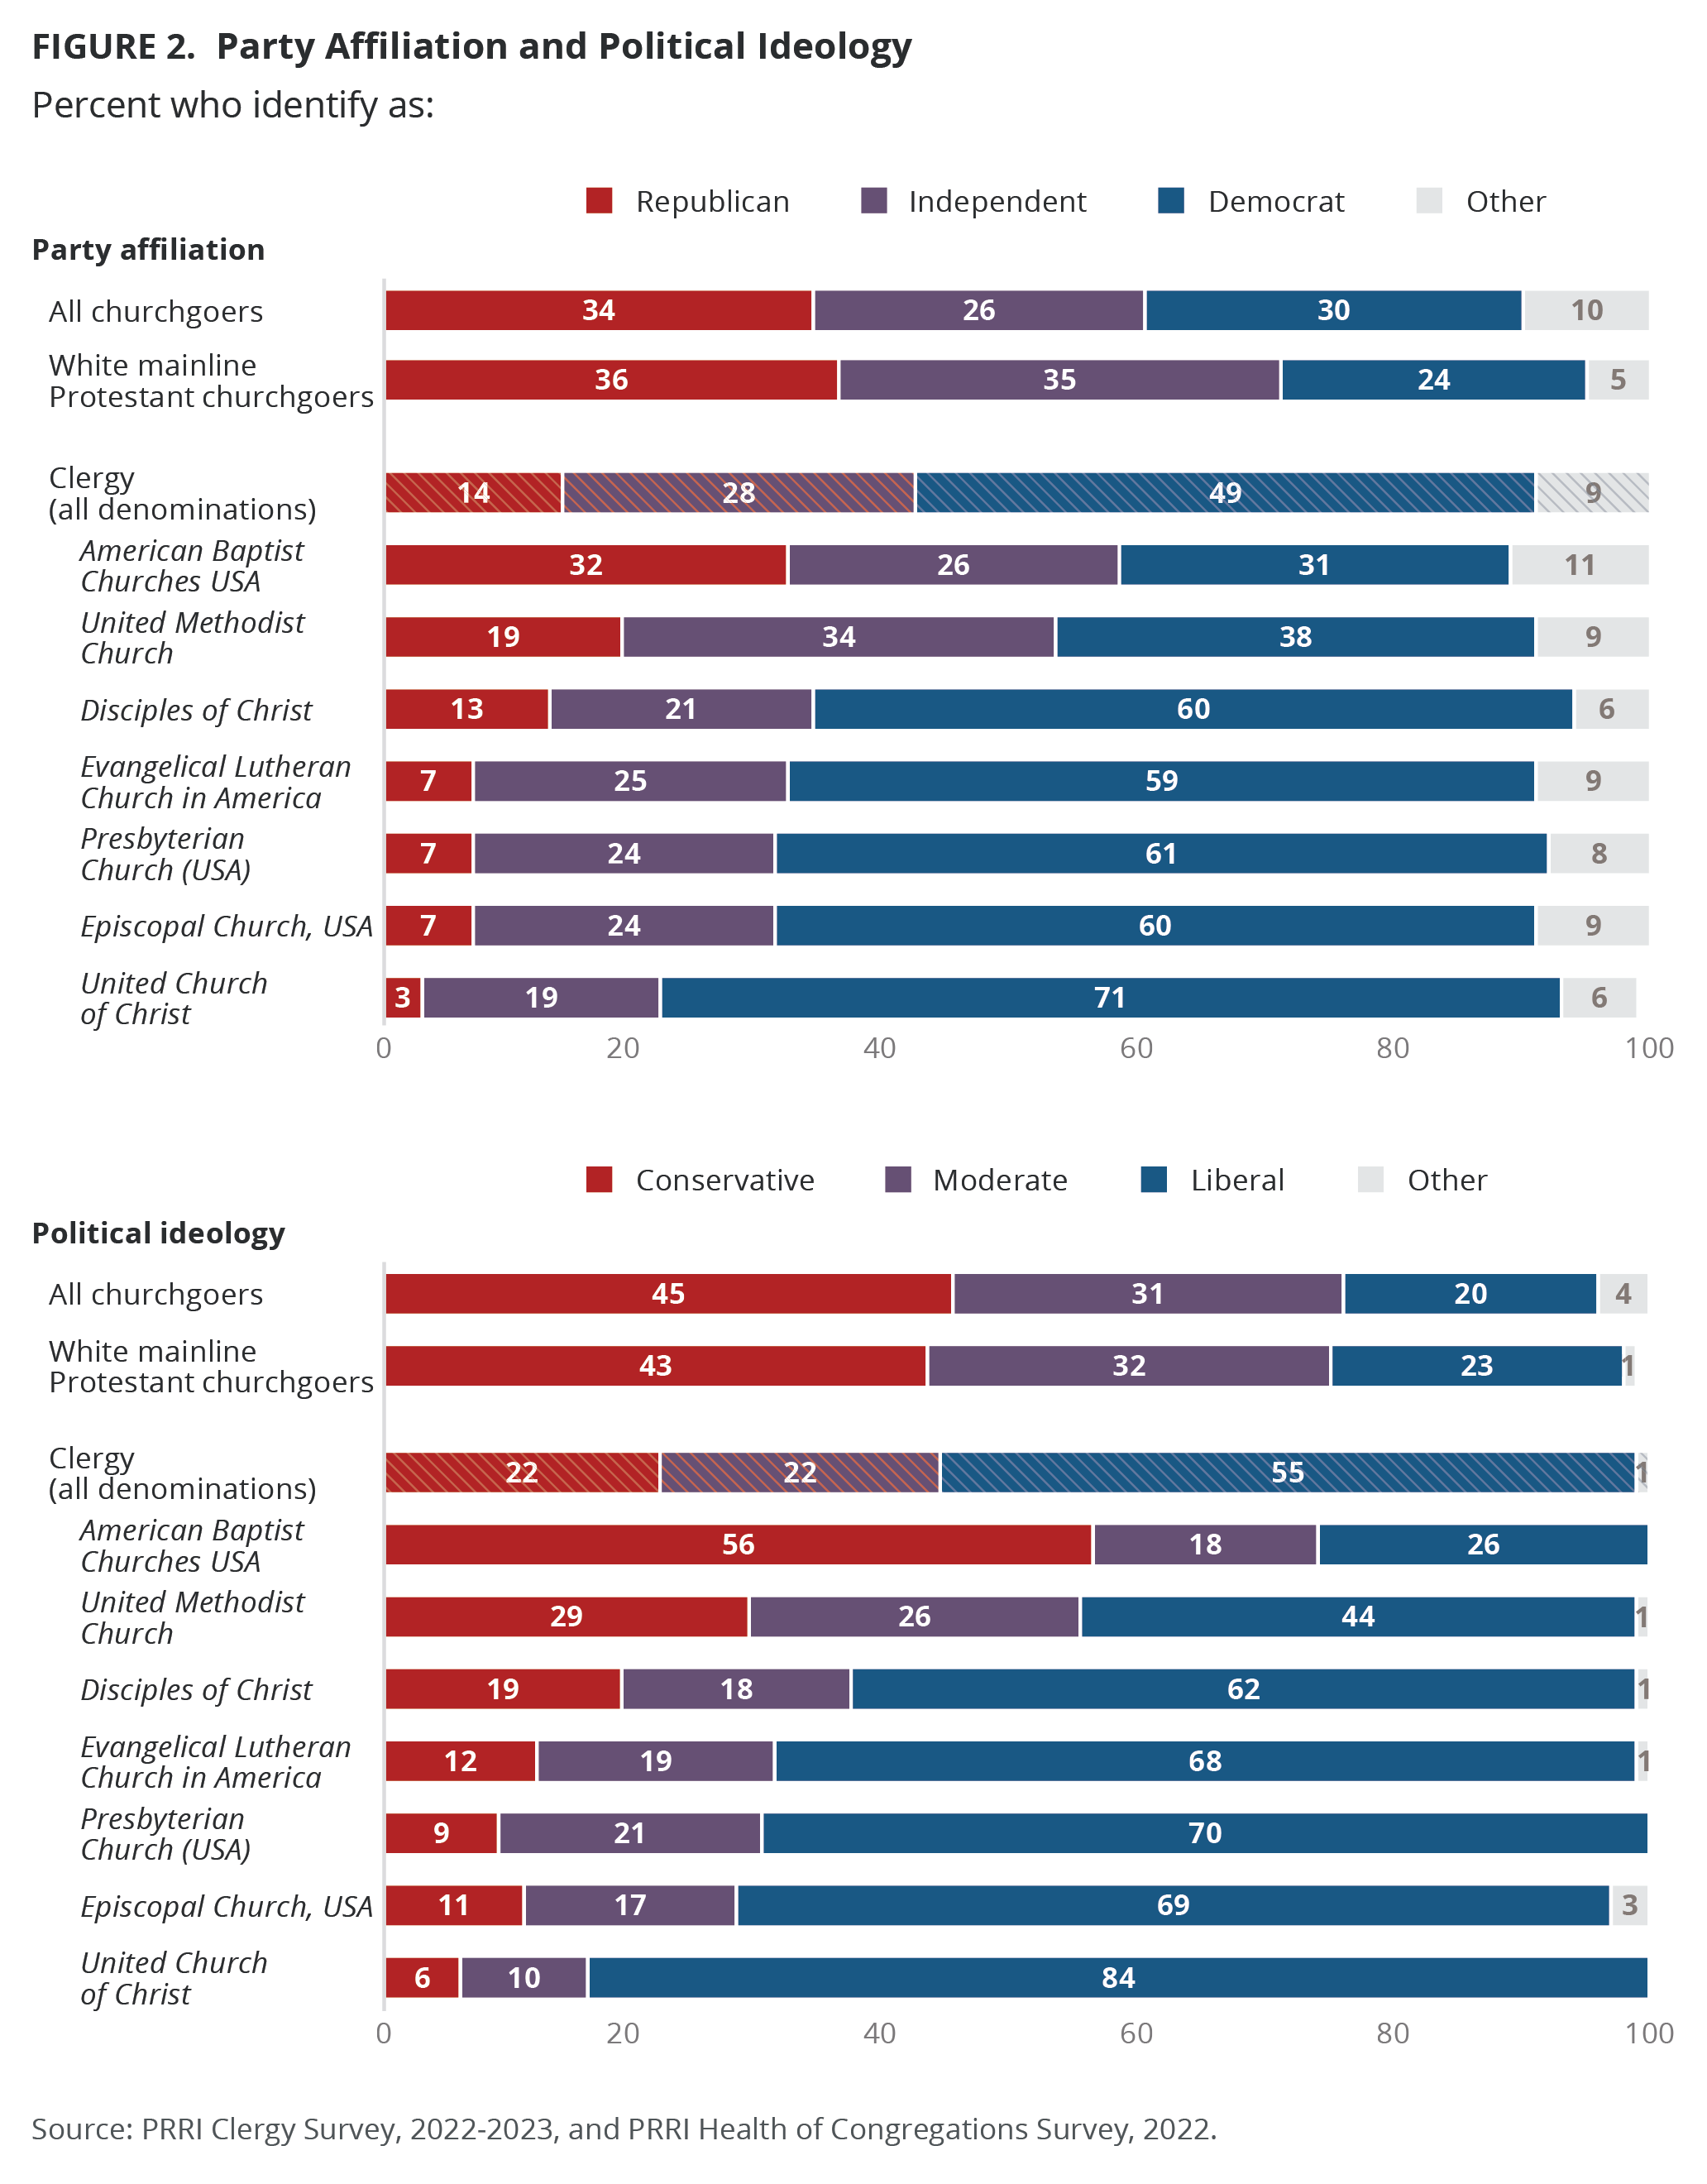
Overall, mainline clergy are much more likely to identify as Democrat than as Republican. About half identify with the Democratic Party (49%), compared to only 14% who identify with the Republican Party. More than one in four clergy identify as independent (28%). The UCC has the highest share of clergy who identify as Democrat (71%), followed by PCUSA (61%), Episcopalian (60%), DOC (60%), and ELCA clergy (59%). UM (38%) and ABCUSA (31%) clergy are the least likely to identify as Democrat. About one-third of ABCUSA clergy (32%) identify with the Republican party, while 26% identify as independent. By contrast, about one-third of UM clergy (34%) identify as independent and 19% as Republican. Clergy from urban (57%) and suburban areas (56%) are more likely to identify as Democrats than clergy from rural areas (39%). About one in five rural clergy (19%) identify as Republican, compared with 14% of clergy from suburban areas and 7% of clergy from urban areas.
There are large differences between clergy denominations in terms of ideological self‐identification, with UM clergy (44%), and particularly ABCUSA clergy (26%), being far less likely to identify as liberal compared with clergy from other denominations. By contrast, strong majorities of clergy in most denominations self‐identify as liberal: UCC (84%), PCUSA (70%), Episcopal (69%), ELCA (68%), and DOC (62%).
White mainline Protestant churchgoers in the general population tend to identify more as Republican (36%) or independent (35%), compared to one in four who identify as Democrat (24%). Mainline clergy are less likely to identify as Republican than white mainline Protestant (14% vs. 36%). The majority of clergy (55%) identify as liberal, 22% identify as moderate, and 22% as conservative, in stark contrast to white mainline churchgoers and all churchgoers who are notably more conservative (43% and 45%, respectively) than liberal (23% and 20%, respectively). About one-third of white mainline churchgoers (32%) and all churchgoers (31%) identify as moderate. Close to half of rural clergy (47%) identify as liberal, compared with 63% of urban clergy and 61% of suburban clergy; 28% of rural clergy identify as conservative, compared with 20% of suburban and 15% of urban clergy, respectively.
That mainline Protestant clergy are more likely to identify as Democratic and ideologically liberal is well-established in earlier studies that consider the political orientations of mainline Protestant clergy, including in earlier work by PRRI, which conducted a 2008 survey of clergy from the same seven mainline Protestant denominations featured here. Compared with our 2008 analysis, we find that mainline Protestant clergy have become both more likely to identify as Democratic and less likely to identify as Republican; mainline clergy are also more ideologically liberal and/or more moderate than in our 2008 survey, with fewer clergy identifying as conservative.[8]
Emotional Well-Being and Satisfaction with Work as Religious Leader
About one-third of mainline clergy (32%) report feeling emotionally drained from work every day or at least once a week, compared to three in ten (30%) who feel the same once or a few times a month. Over one-third (36%) report feeling drained a few times a year or never. With the exception of ABCUSA clergy (26%), about one-third of other mainline clergy denominations report feeling emotionally drained from work every day or at least once a week, including 37% both PCUSA and UCC clergy, 36% both ELCA and DOC clergy, 32% of Episcopal, and 31% of UM clergy.
About one in four mainline clergy (27%) report feeling frustrated with their job every day or at least once a week, compared to 32% who feel the same once or a few times a month. Over four in ten (41%) say they feel frustrated with their job a few times a year or never. With the exceptions of ABCUSA (19%), UM (23%), and DOC (26%) clergy, about three in ten or more of other mainline clergy denominations report feeling frustrated with their job every day or at least once a week, including 36% of ELCA, 35% of Episcopal, 31% of UCC, and 29% PCUSA.
At the same time, the vast majority of mainline clergy (76%) across all denominations say they feel every day or at least once a week that they are positively influencing other people’s lives through their work, they feel energetic (74%), and feel that they have accomplished many worthwhile things in their job (65%).
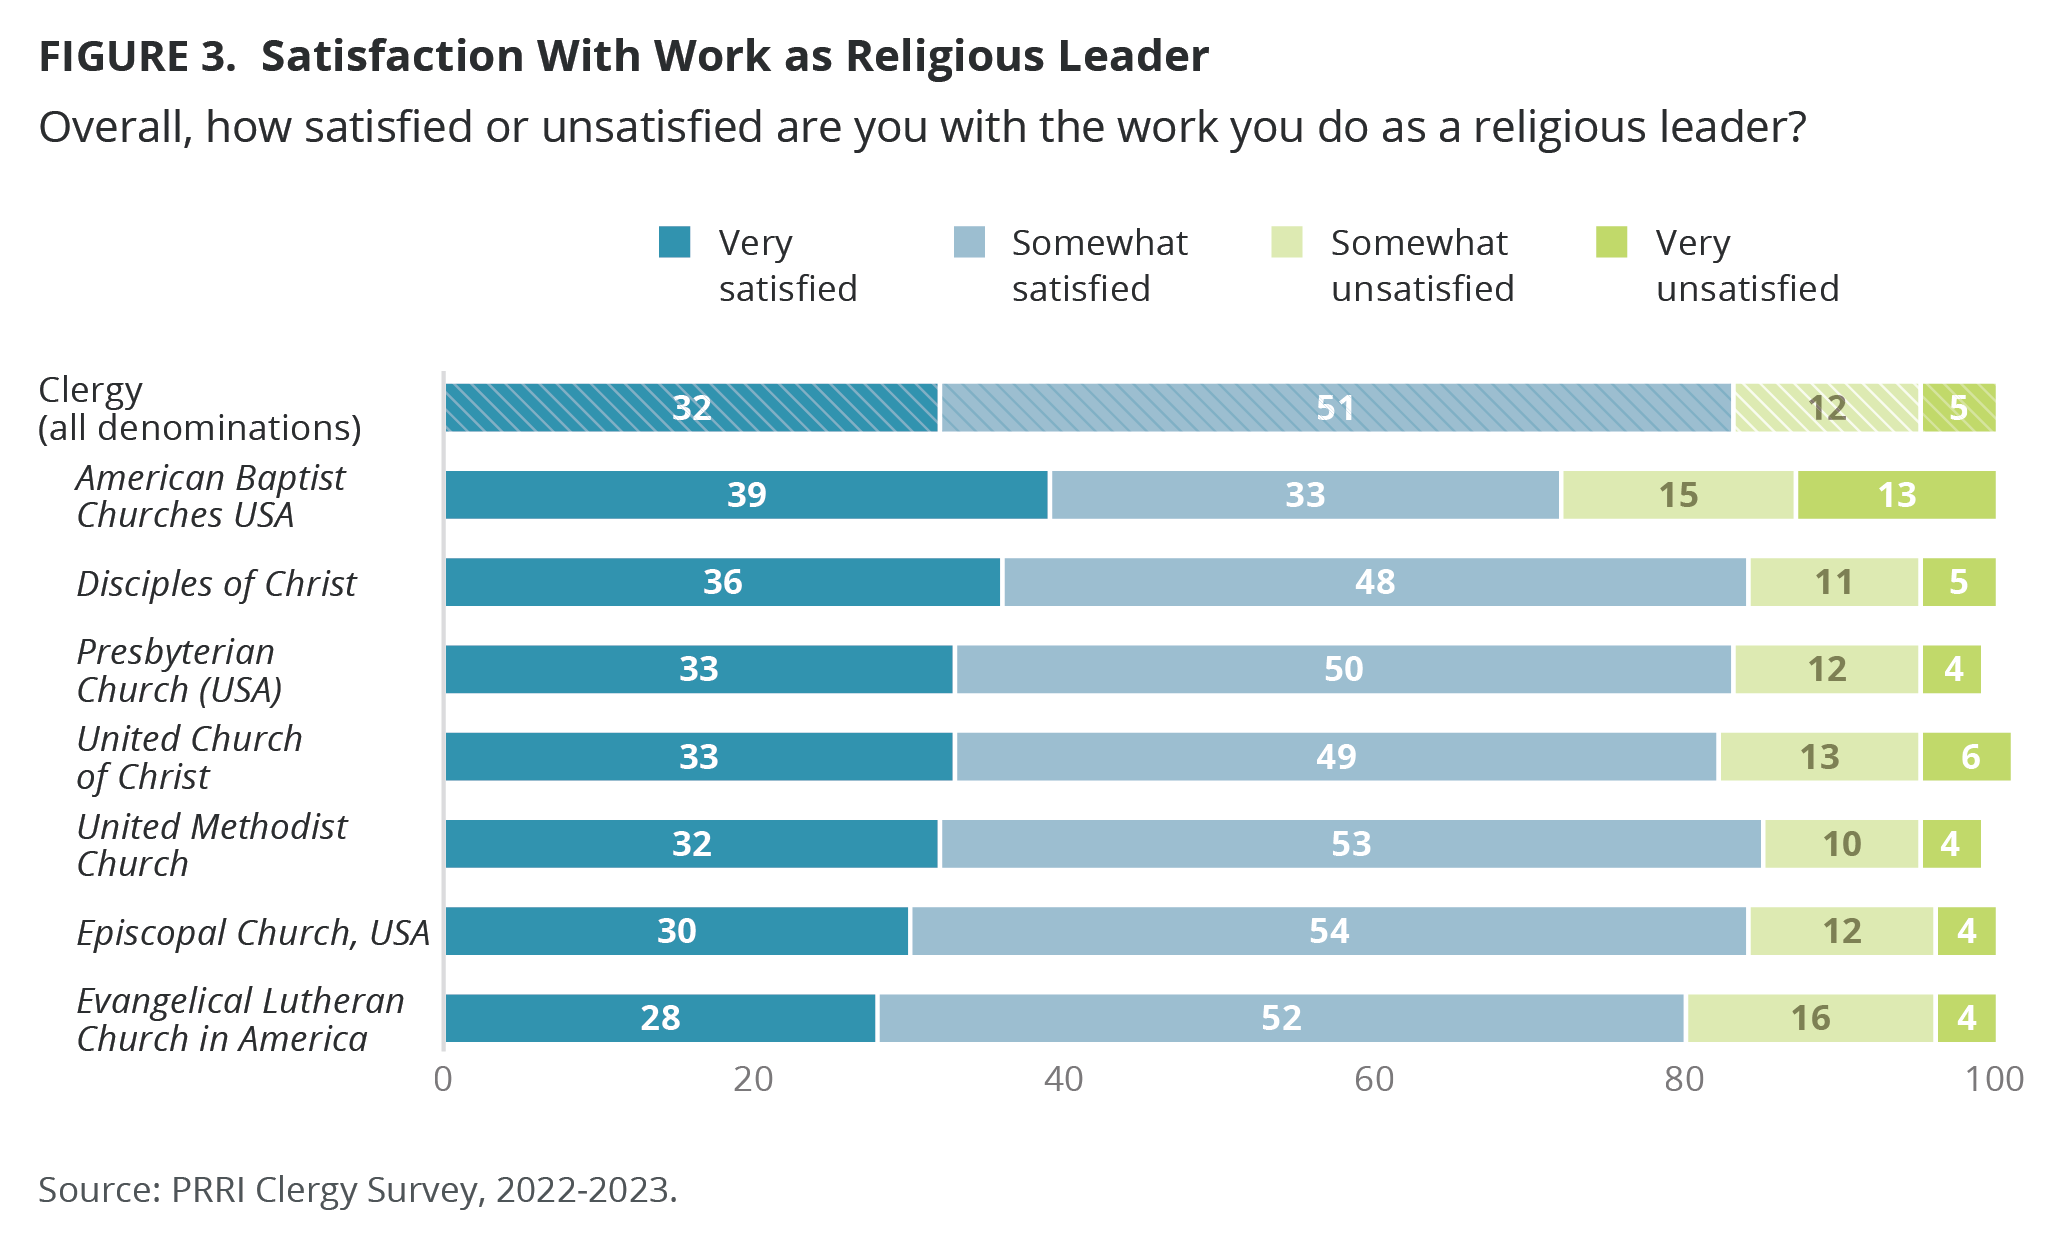
In fact, with the only exception of ABCUSA clergy (72%), at least eight in ten mainline clergy across all denominations (83%) say they are very or somewhat satisfied with the work they do as a religious leader: UM (85%), Episcopal (84%), DOC (84%), PCUSA (83%), UCC (82%), ELCA (80%).
While there are no differences between rural, suburban, and urban clergy when they report feeling emotionally drained from work or feeling frustrated, rural clergy are less likely than suburban and urban clergy to report feeling every day or at least once a week that they are positively influencing other people’s lives through their work (73% rural vs. 78% suburban and 78% urban), but do not differ from suburban clergy when they report feeling energetic (73% rural vs. 73% suburban). Both rural and suburban clergy are significantly less likely to report feeling energetic at least weekly compared with urban clergy (78%).
Views on Political Issues, Christian Nationalism, and Religious Pluralism
LGBTQ Rights
Discrimination Protections for LGBTQ People
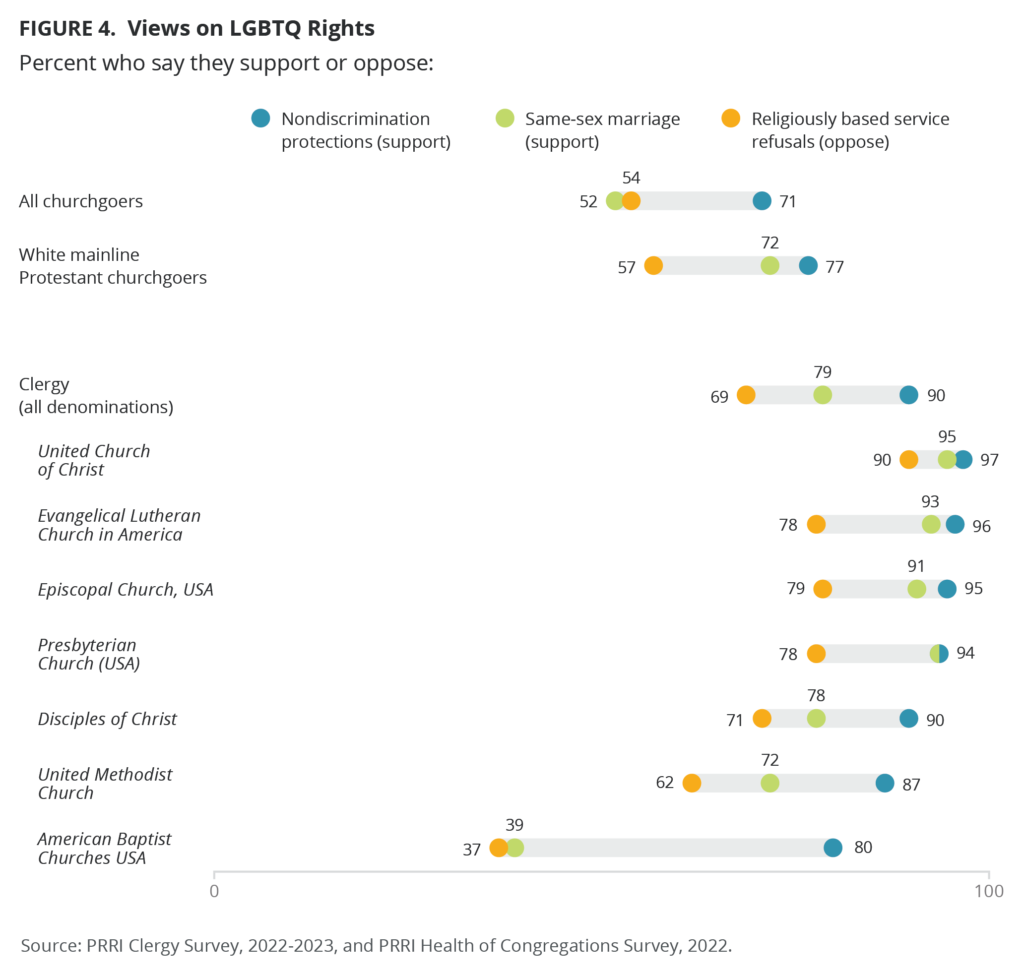
Nine in ten clergy among all denominations (90%) favor laws that would protect gay, lesbian, bisexual, and transgender people against discrimination in jobs, public accommodations, and housing. Aside from ABCUSA clergy (80%), clergy from individual denominations align similarly in favoring these laws: 87% of UMs, 90% of DOC, 94% of Presbyterians, 95% of Episcopalians, 96% of ELCAs, and 97% of UCC clergy. Mainline clergy (90%) are notably more in favor of nondiscrimination laws for LGBTQ people than white mainline Protestant churchgoers (77%) and all churchgoers (71%). Rural clergy (86%) are less likely than suburban (93%) and urban clergy (95%) to favor nondiscrimination laws for LGBTQ people, including 66%, 81%, and 84%, respectively, who strongly favor it.
Religiously Based Service Refusals
Similarly, mainline clergy are also more likely than mainline Protestant churchgoers to oppose religiously based service refusals. Nearly seven in ten of mainline clergy (69%) oppose allowing a small business owner to refuse to provide products or services to gay or lesbian people if doing so violates their religious beliefs. UCC clergy (90%) overwhelmingly oppose religiously based service refusals, as do the majority of Episcopalian (79%), ELCA (78%), PCUSA (78%), DOC (71%), and UM (62%) clergy. However, only four in ten ABCUSA clergy (37%) oppose religiously based refusals against LGBTQ people. Both all churchgoers (54%) and white mainline Protestant churchgoers (57%) are less likely than mainline clergy (69%) to oppose religiously based service refusals. Rural clergy (60%) are less likely than suburban (73%) and urban clergy (76%) to oppose religiously based service refusals. Among those who strongly oppose it, 41% of rural clergy do so, compared with the majority of suburban (52%) and urban clergy (56%).
Same-Sex Marriage
Around eight in ten of all clergy (79%) favor allowing same-sex couples to marry, yet on this issue there is large variance. While the vast majority of UCC clergy (95%), PCUSA (94%), ELCA (93%) and Episcopalian clergy (91%) favor the legality of same-sex marriage, fewer DOC (78%) or UM (72%) clergy do. ABCUSA clergy are notably distinct from other mainline Protestants in that only 39% support same-sex marriage rights.[9] While substantial majorities of clergy (79%) and white mainline Protestant churchgoers (72%) support same-sex marriage, a slim majority of all American churchgoers (52%) do so. Rural clergy (72%) are less likely than suburban (83%) and urban clergy (86%) to favor same sex marriage, including 57%, 71%, and 77%, respectively, who strongly favor it.
Overturning Roe v. Wade
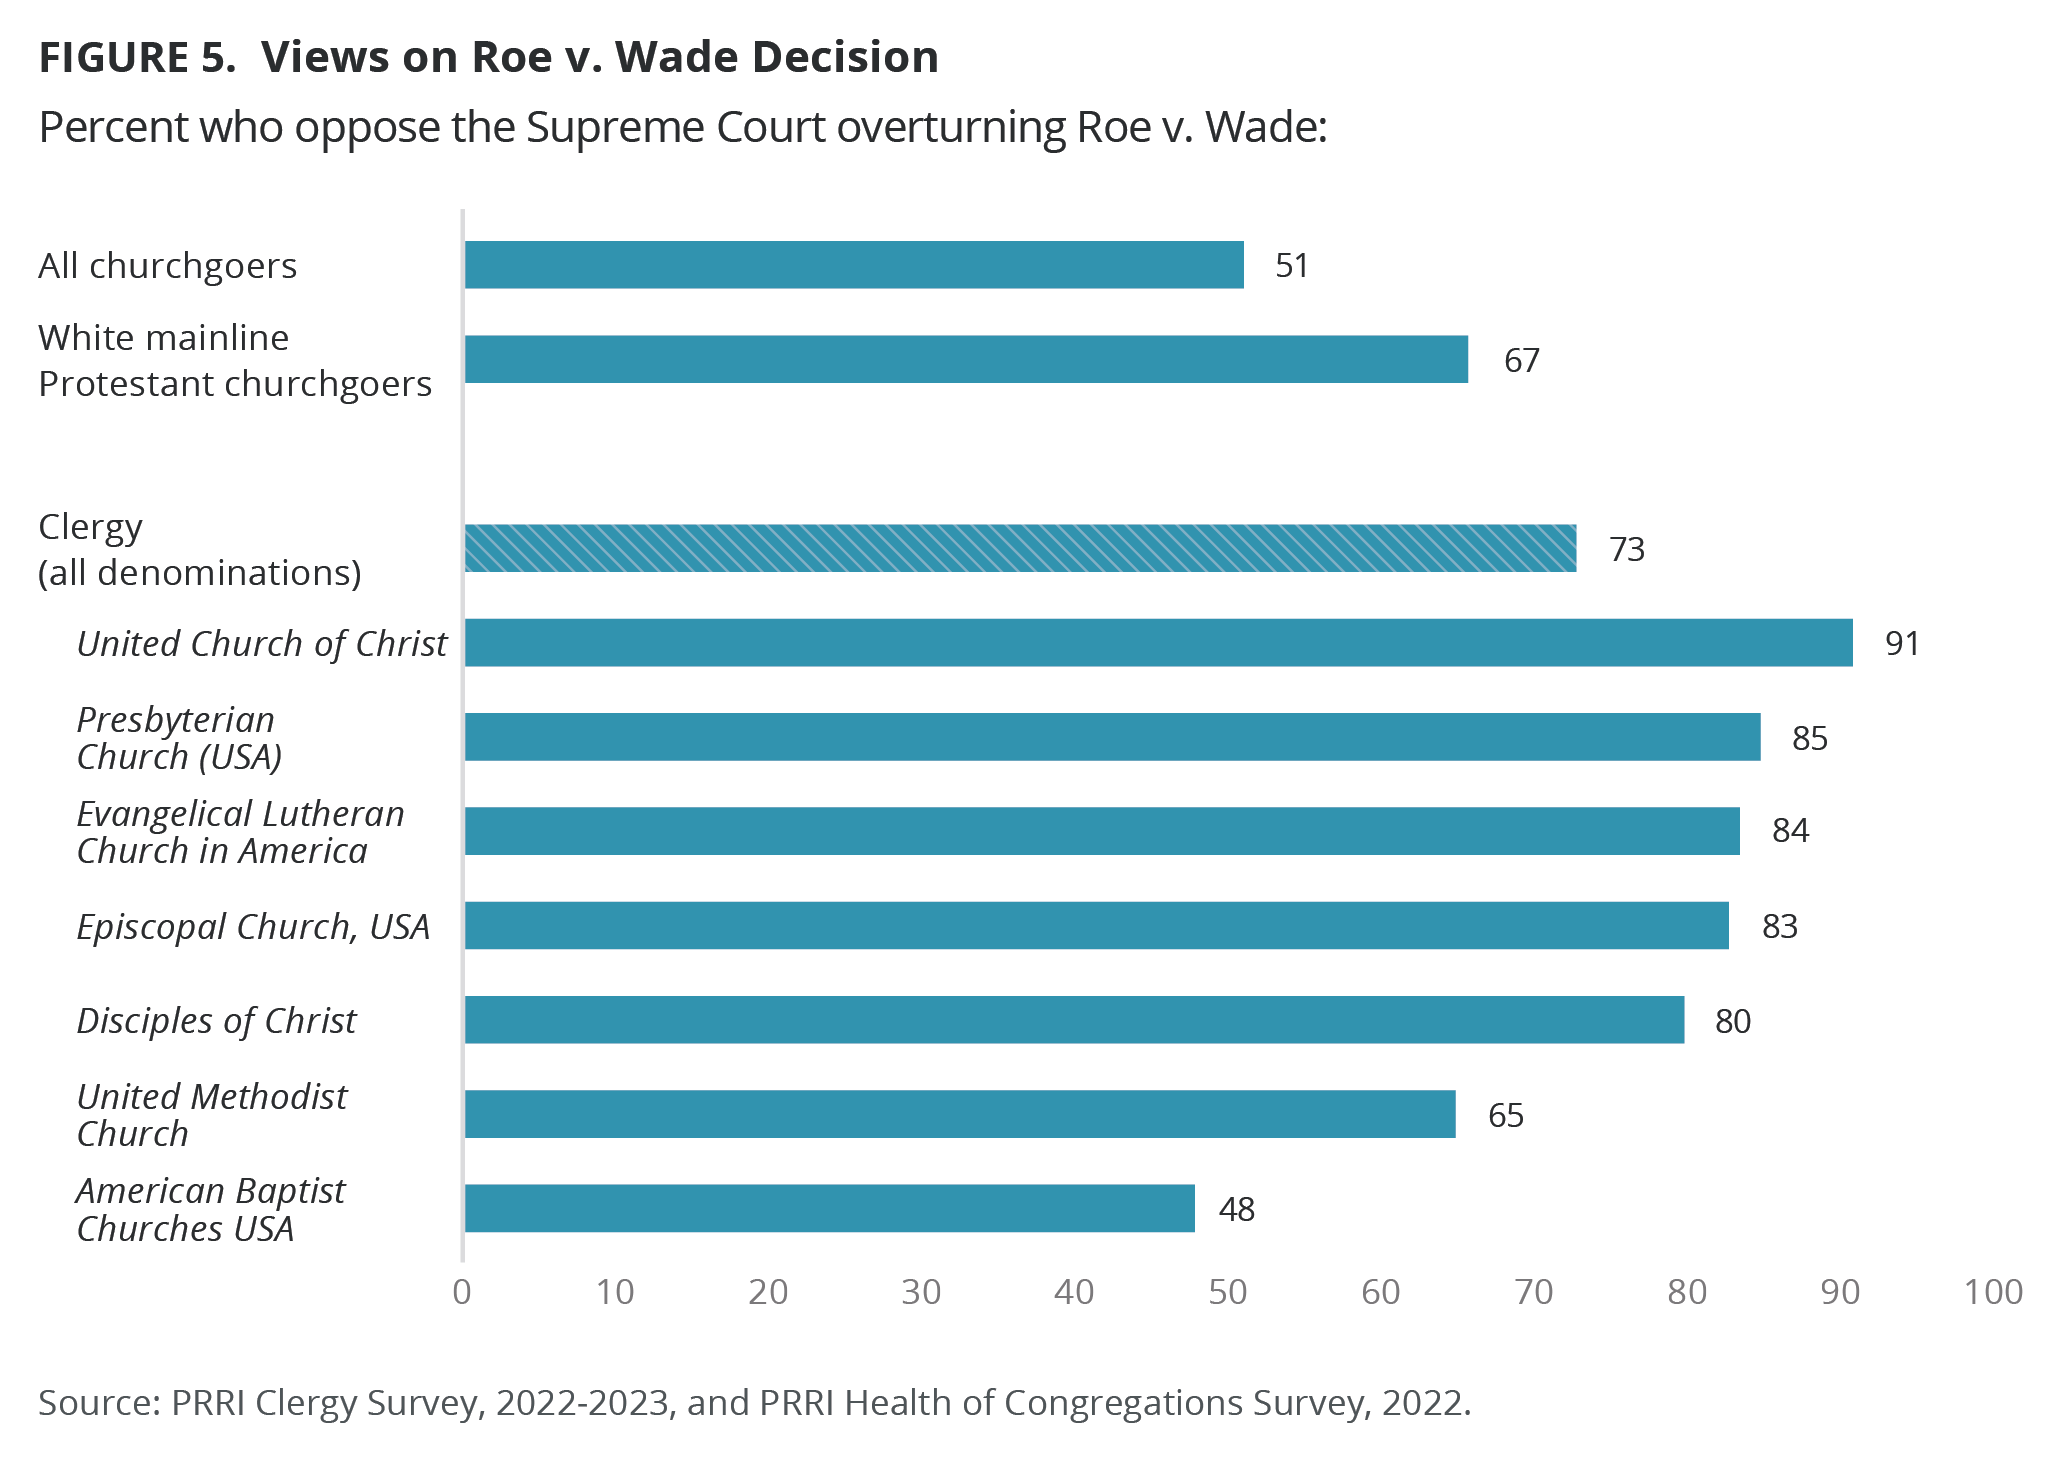
Nearly three-fourths of clergy (73%) say they oppose the U.S. Supreme Court overturning Roe v. Wade. Vast majorities of UCC (91%), ELCA (84%), PCUSA (85%), Episcopalian (83%), and DOC clergy (80%) oppose the Supreme Courts’ ruling. Around two-thirds of UMs (65%) and under half of ABCUSA clergy (48%) are against the overturning of Roe.
The majority of mainline clergy (73%) oppose the overturn of Roe v. Wade by the Supreme Court, compared to 51% of all churchgoers and under six in ten white mainline Protestant churchgoers (67%).[10] Rural clergy (67%) are less likely than suburban (77%) and urban clergy (78%) to oppose the Supreme Courts’ ruling, including 53%, 66%, and 66%, respectively, who strongly oppose it.
Views on American Identity, Christian Nationalism, and Religious Pluralism
America Losing Its Identity
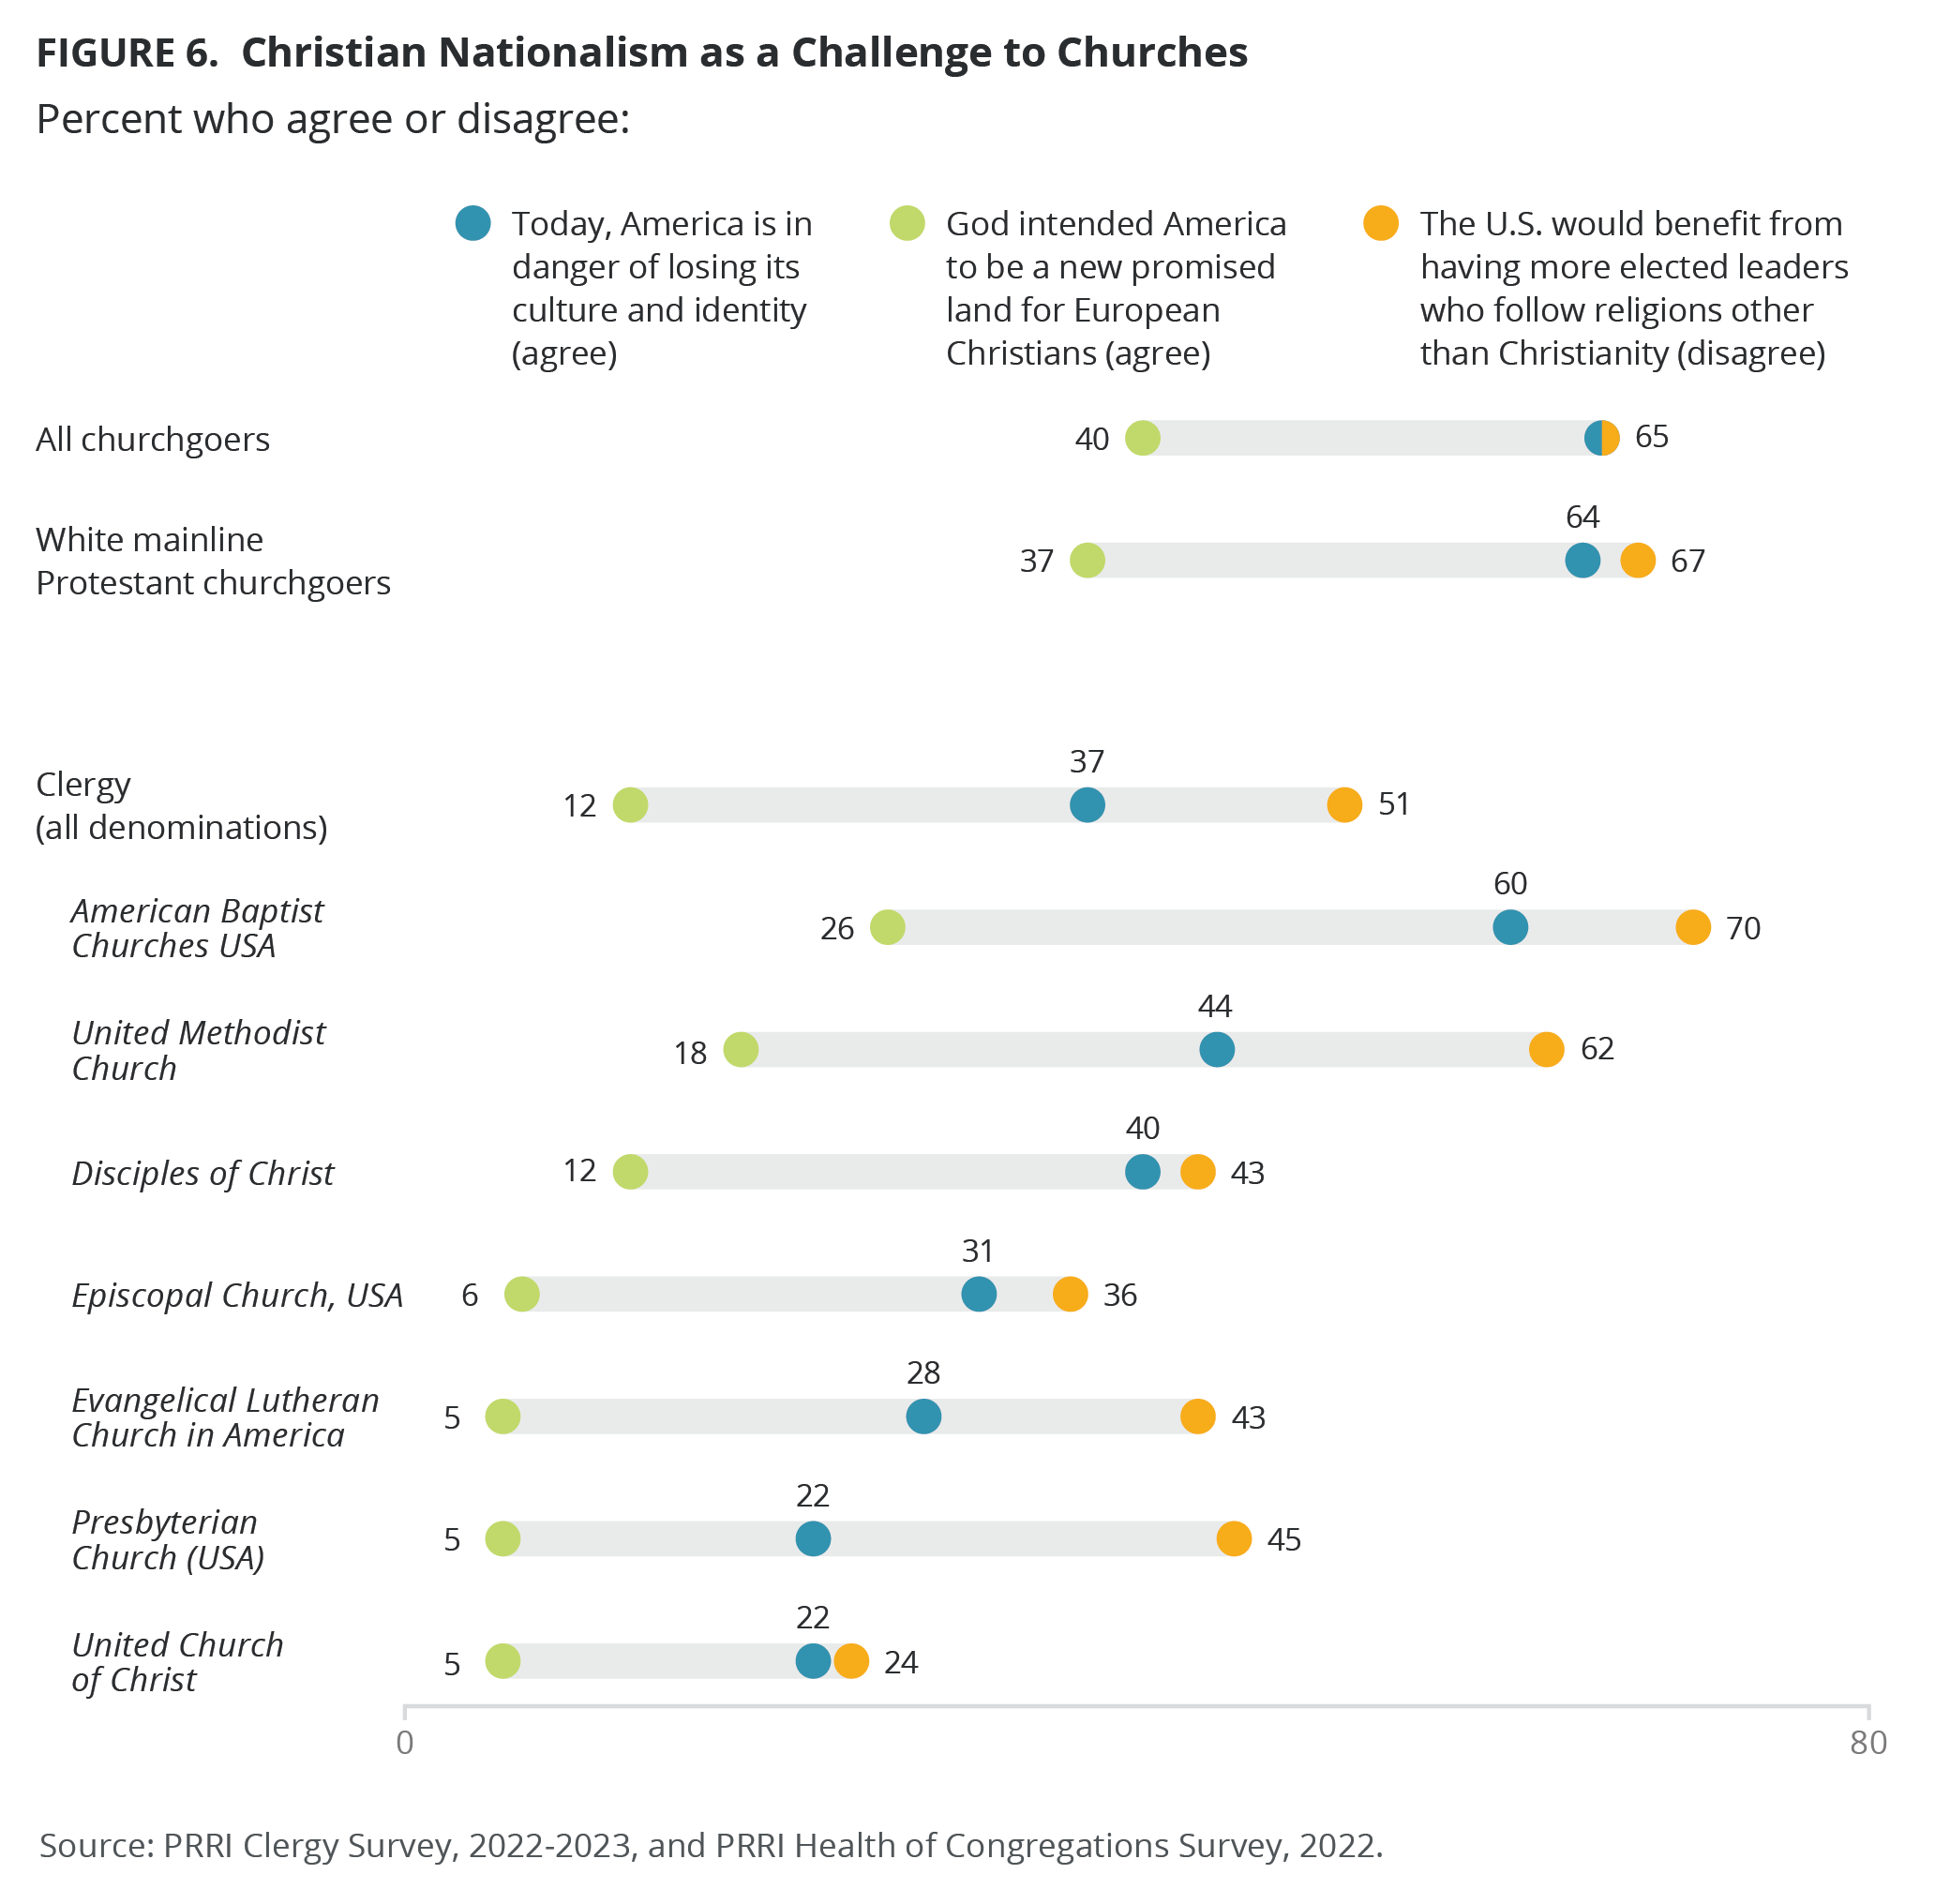
Nearly one in four mainline clergy (37%) agree with the statement, “Today, America is in danger of losing its culture and identity.” ABCUSA clergy are the most likely (60%) to agree with this statement. Around four in ten UM (44%) and DOC (40%) clergy agree with that statement, compared with about three in ten Episcopal (31%) and ELCA (28%) clergy. By contrast, just 22% of PCUSA and UCC clergy agree that America is in danger of losing its culture and identity. About two-thirds of all American churchgoers (65%) and white mainline Protestant churchgoers (64%) agree with this statement. Rural clergy (46%) are notably more likely than urban (31%) and suburban clergy (30%) to agree that America is in danger of losing its culture and identity. Among those who strongly agree with this statement, 17% of rural clergy strongly agree compared with just 7% of urban clergy.
God Intended America to be a Promised Land
Only 12% of mainline clergy agree with the statement, “God intended America to be a new promised land where European Christians could create a society that could be an example to the rest of the world.” About one in four ABCUSA clergy (26%), as well as 18% of UM clergy, agree with this statement. While DOC clergy match the national average on agreement with this statement, far fewer ELCA, PCUSA and Episcopal clergy agree that God intended America to be a new promised land for European Christians. American churchgoers (40%) and white mainline congregants (37%), however, are substantially more likely than mainline clergy (12%) to agree with this statement. Rural clergy (16%) are notably more likely than urban (10%) and suburban (8%) clergy to agree that God intended America to be a new promised land for European Christians.
U.S. Would Benefit From Having More Elected Leaders Who Follow Religions Other Than Christianity
Mainline clergy are somewhat divided over the statement, “The U.S. would benefit from having more elected leaders who follow religions other than Christianity or who are not religious at all” (47% agree vs. 51% disagree). Disagreement with religious pluralism is highest among ABCUSA (70%) and UM clergy (62%). Significantly lower percentages of PCUSA (45%), ELCA (43%), DOC (43%), and Episcopalian (36%) clergy also disagree. UCC (24%) are the least likely to disagree. Instead, three in four UCC clergy agree with religious pluralism (75%). About two-thirds of all churchgoers (65%) and white mainline congregants (67%) disagree nationally. Rural clergy (57%) are more likely than suburban (49%) and urban (45%) clergy to disagree with the U.S. benefiting from having more religiously diverse elected leaders.
Fluidity in the Clergy Religious Landscape
Religious Switching
Nearly four in ten mainline clergy (38%) report they were a follower or practitioner of a different religious tradition or denomination than the one they currently practice now, compared to 29% of their white mainline congregants, and 23% of all American churchgoers.
A slim majority of clergy in the UCC (56%) and Episcopal (51%) traditions say they previously followed another tradition as do about four or less clergy in the DOC (41%), UM (37%), PCUSA (34%), ABCUSA (32%), and ELCA (29%) churches.
Thinking About Leaving Current Religion
Among mainline clergy, 44% said they have thought about leaving their current religious tradition, compared to 23% of their white mainline congregants and only 15% of American churchgoers.
The UMs (53%) is the only denomination where the majority of clergy report thinking about leaving their tradition. About four in ten PCUSA (40%), DOC (39%), and ELCA clergy (38%) and around three in ten UCC (32%), ABCUSA (30%), and Episcopal clergy (30%) say they have thought about leaving their religious tradition.
Thoughts of leaving their current religious tradition or denomination are linked to partisanship and ideology. Two-thirds of Republican clergy say they have thought about leaving their current religious tradition (64%), compared to half of independent clergy (50%), and one-third of Democrat clergy (32%). Among UM clergy, this partisan effect is more pronounced: 74% of Republican clergy have thought about leaving their current religious tradition or denomination compared with just 37% of UM Democrat clergy.[11]
More than two-thirds of conservative clergy (68%) say they thought about leaving their current religious tradition; four in ten moderate (40%) and liberal clergy (36%) also agree. Again, among UM clergy, thinking about leaving is highest among conservative clergy (77%), compared with their moderate (43%) or liberal counterparts (44%).
Debates about allowing same-sex couples to marry are also related to such considerations. Among mainline clergy who oppose allowing same-sex couples to marry, 63% say they have thought about leaving their current religious tradition, compared with just 39% of clergy who support allowing gay and lesbian couples to marry legally. Among UM clergy who oppose same-sex marriage, 73% have considered changing their faith tradition or denomination, far higher than those UM clergy who are more supportive of allowing gay and lesbian couples to marry (at 46%).[12]
While there are no differences between rural, urban, and suburban clergy indicating that they were a follower or practitioner of a different religious tradition or denomination than the one they currently practice now (39%, 37%, 37%, respectively), rural clergy (48%) are more likely than urban (41%) and suburban (38%) clergy to say they have thought about leaving their current religious tradition.
Experiences Within the Church
Topics of Discussion by the Clergy
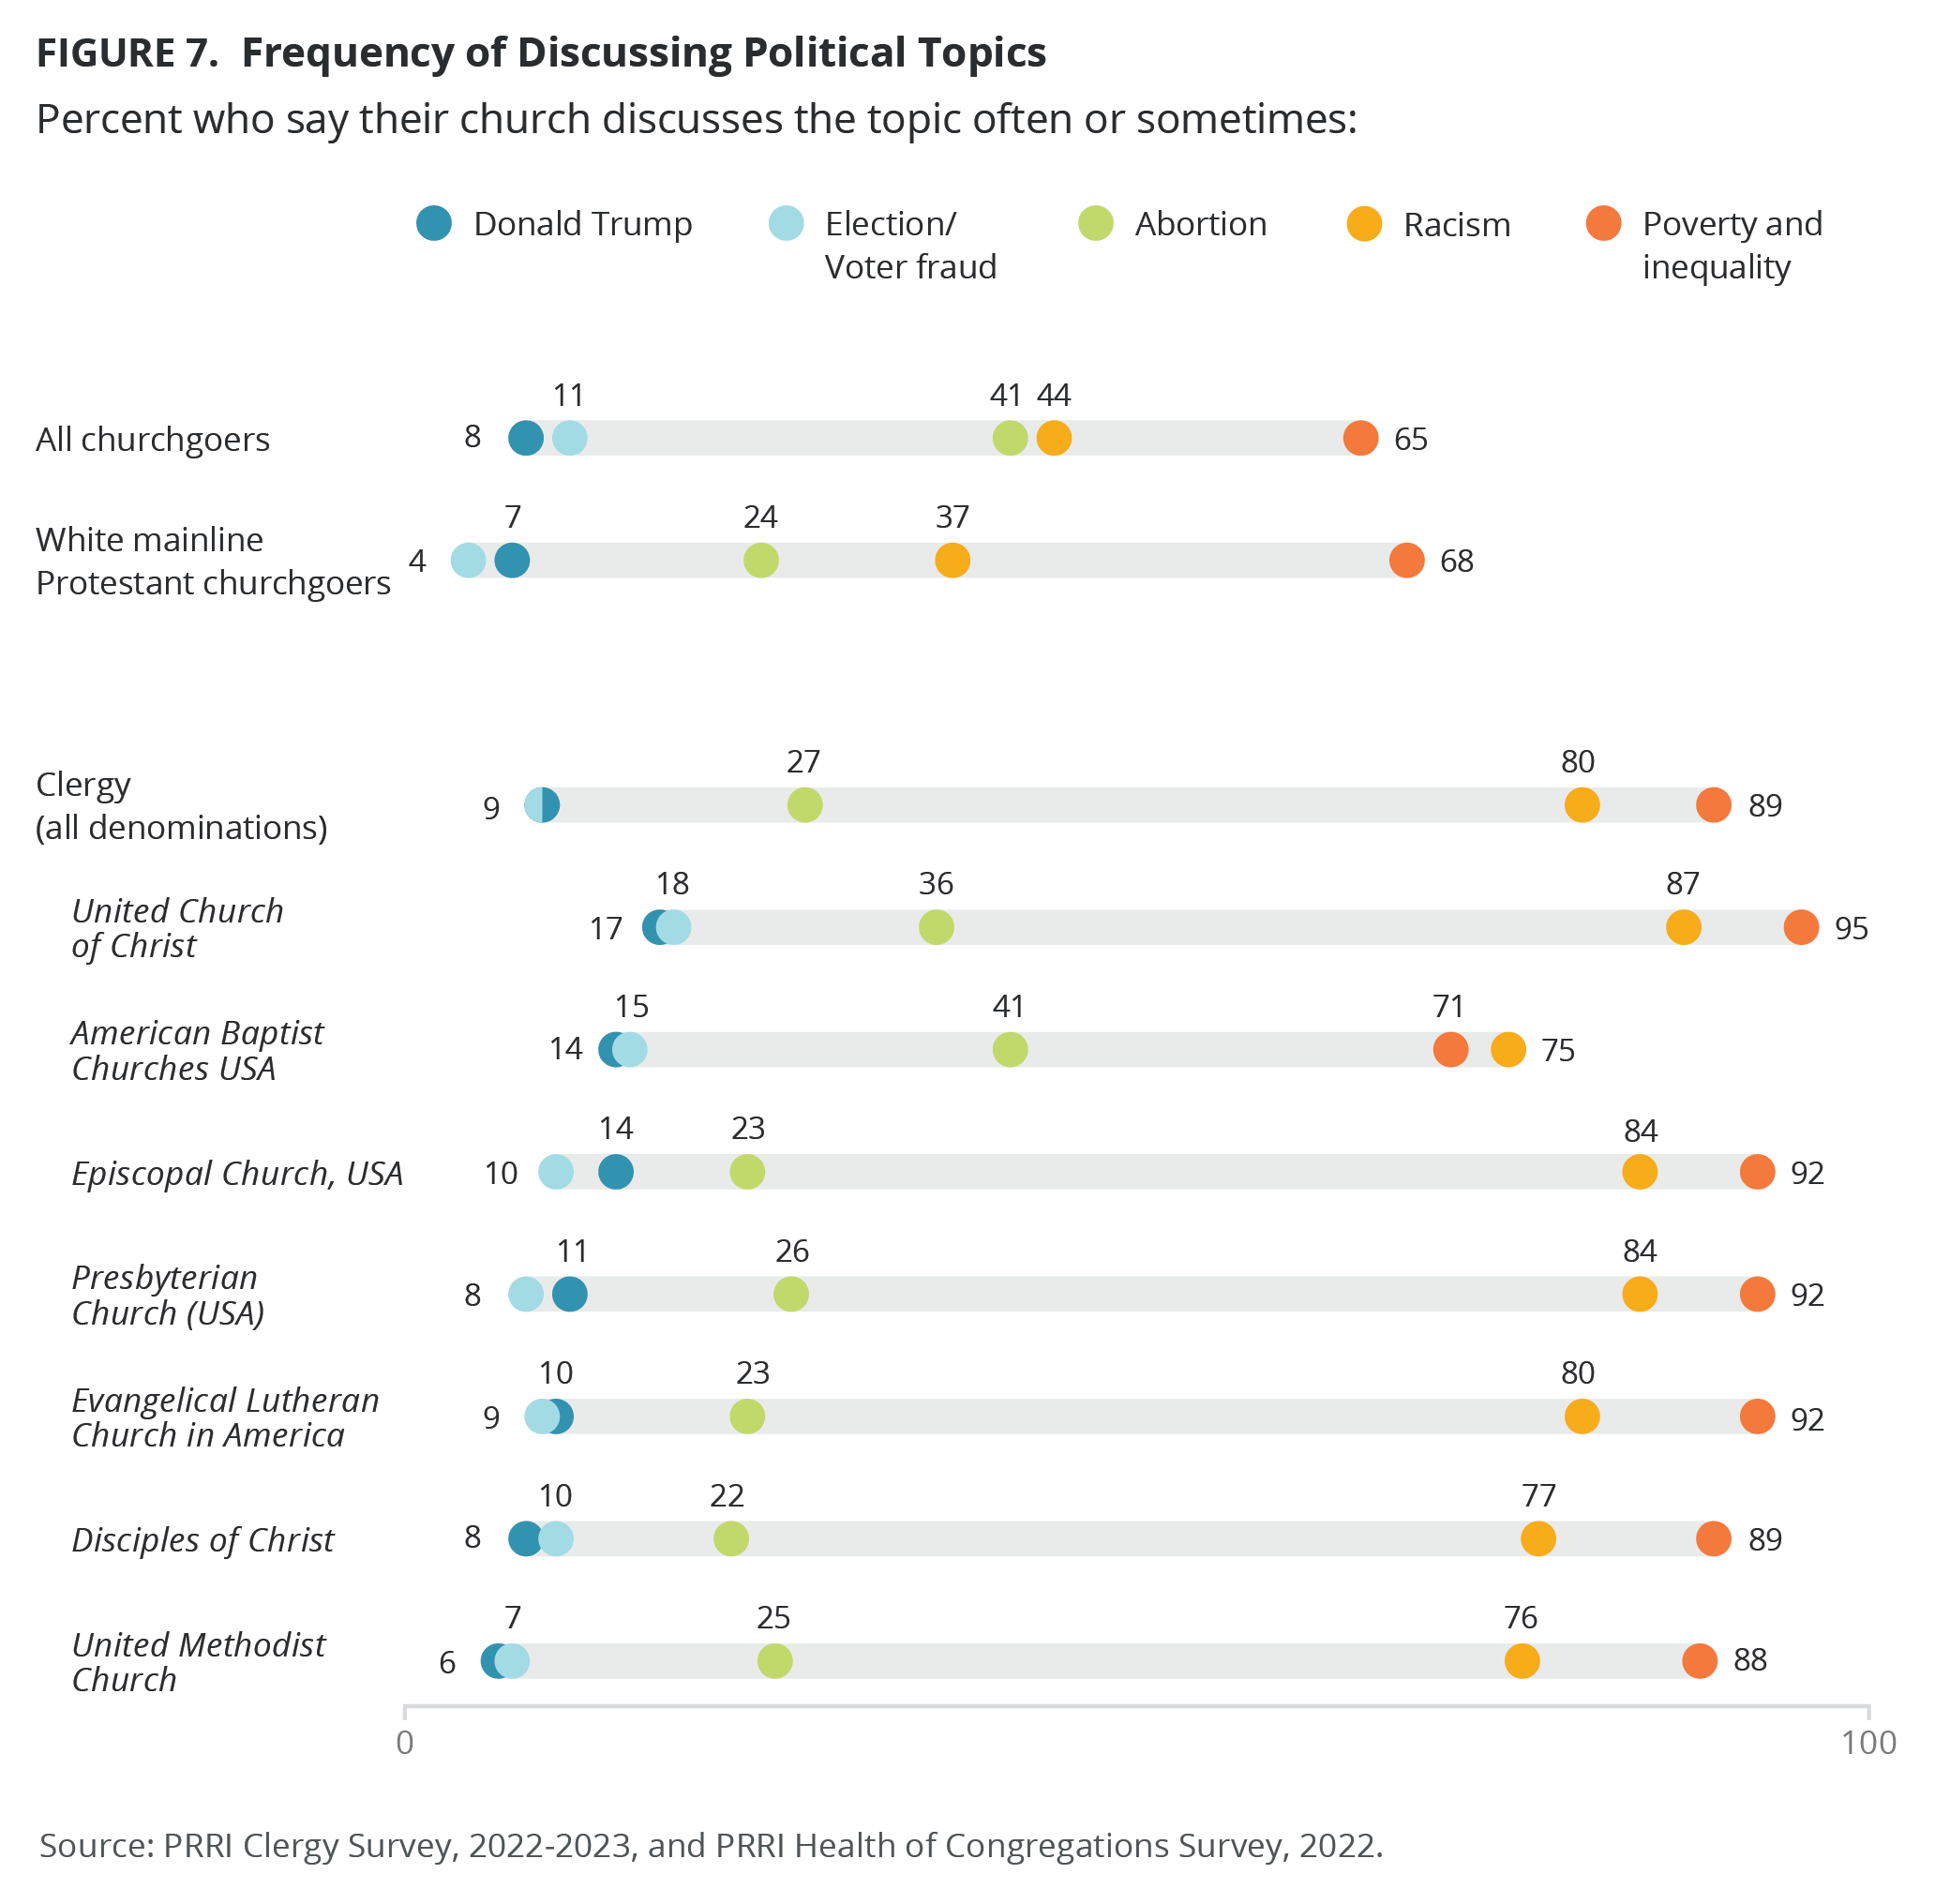
Overall, around one-fourth of mainline clergy (27%) say abortion is a topic that their congregations discuss sometimes or often; however, ABCUSA (41%) and UCC (36%) clergy report that their congregations discuss abortion sometimes or often at higher rates. White mainline Protestant churchgoers (24%) are similarly likely to say that their congregations sometimes or often discuss abortion, but they are less likely than all churchgoers (41%) to say this.[13]
On the topic of electoral politics, few mainline clergy sometimes or often discuss election and voter fraud (9%) or Donald Trump (9%) with their congregations. Clergy are aligned with white mainline Protestant churchgoers and all churchgoers with respect to how likely they are to talk about election and voter fraud (4% and 11%, respectively) or Donald Trump (7% and 8%, respectively). While there is little difference regarding discussion of election and voter fraud based on the urbanization of their congregations, rural clergy (6%) are half as likely as urban (12%) and suburban clergy (12%) to say their church discusses Donald Trump sometimes or often.
While less likely to discuss abortion, election fraud, or Donald Trump, the vast majority of mainline clergy say they sometimes or often discuss poverty and inequality (89%) and racism (80%) with their congregations.[14] It does not appear, however, that white mainline Protestant churchgoers always hear these discussions. Though a majority of white mainline Protestant churchgoers report hearing about poverty and inequality in their churches (68%), mainline Protestant churchgoers are far less likely to report discussing racism in their churches (37%). Among all churchgoers, a comparable number report discussing poverty and inequality in their churches (65%) and a slightly higher percentage say their church often or sometimes discusses racism (44%).
Rural clergy are less likely than urban and suburban clergy to often or sometimes discuss poverty and inequality (86% vs. 91% and 89%, respectively) and racism (71% vs. 86% and 85%, respectively) in their congregations. Rural clergy are less likely to say they discuss poverty and inequality often (39%), compared with 48% of suburban and 58% of urban clergy. Similarly, only 19% of rural clergy say they often discuss racism, compared with 31% of suburban and 38% of urban clergy.
The majority of mainline clergy (62%) say they sometimes or often discuss discrimination against LGBTQ+ people in their congregations.[15] ABCUSA clergy (33%) are the least likely to talk about discrimination against LGBTQ+ people, compared to UCC clergy (83%), who are the most likely to discuss it. Rural clergy (53%) are less likely than urban (74%) and suburban clergy (65%) to discuss discrimination against LGBTQ+ people often or sometimes within their congregations. Only 12% of rural clergy say they discuss this topic often, compared with 20% of suburban and 29% of urban clergy. [16]
Aside from UM (42%) and ABCUSA clergy (34%), the majority of clergy from other mainline denominations sometimes or often discuss white supremacy with their churches. Similarly, with the exception of UM (44%) and ABCUSA (42%) clergy, the majority of clergy in all other mainline denominations say that antisemitism is sometimes or often discussed. Rural clergy are less likely than urban and suburban clergy to often or sometimes discuss white supremacy (42% vs. 58% and 55%, respectively) and antisemitism (44% vs. 59% and 53%, respectively) in their congregations. Less than one in ten rural clergy often discuss white supremacy (7%) compared with 18% of urban clergy and 13% of suburban clergy. Urban clergy (13%) are also more likely to often discuss antisemitism than their suburban (8%) or rural (6%) counterparts.
Solid majorities of mainline clergy across all denominations say that hatred toward immigrants is sometimes or often discussed in their churches. Rural clergy, however, are notably less likely than urban and suburban clergy to discuss the topic of hatred toward immigrants often or sometimes in their congregations (57% vs. 72% and 71%, respectively). Only one in ten rural clergy often discuss hatred toward immigrants in their congregations, compared to 17% of suburban and 22% of urban clergy.
Discussing Difficult Issues
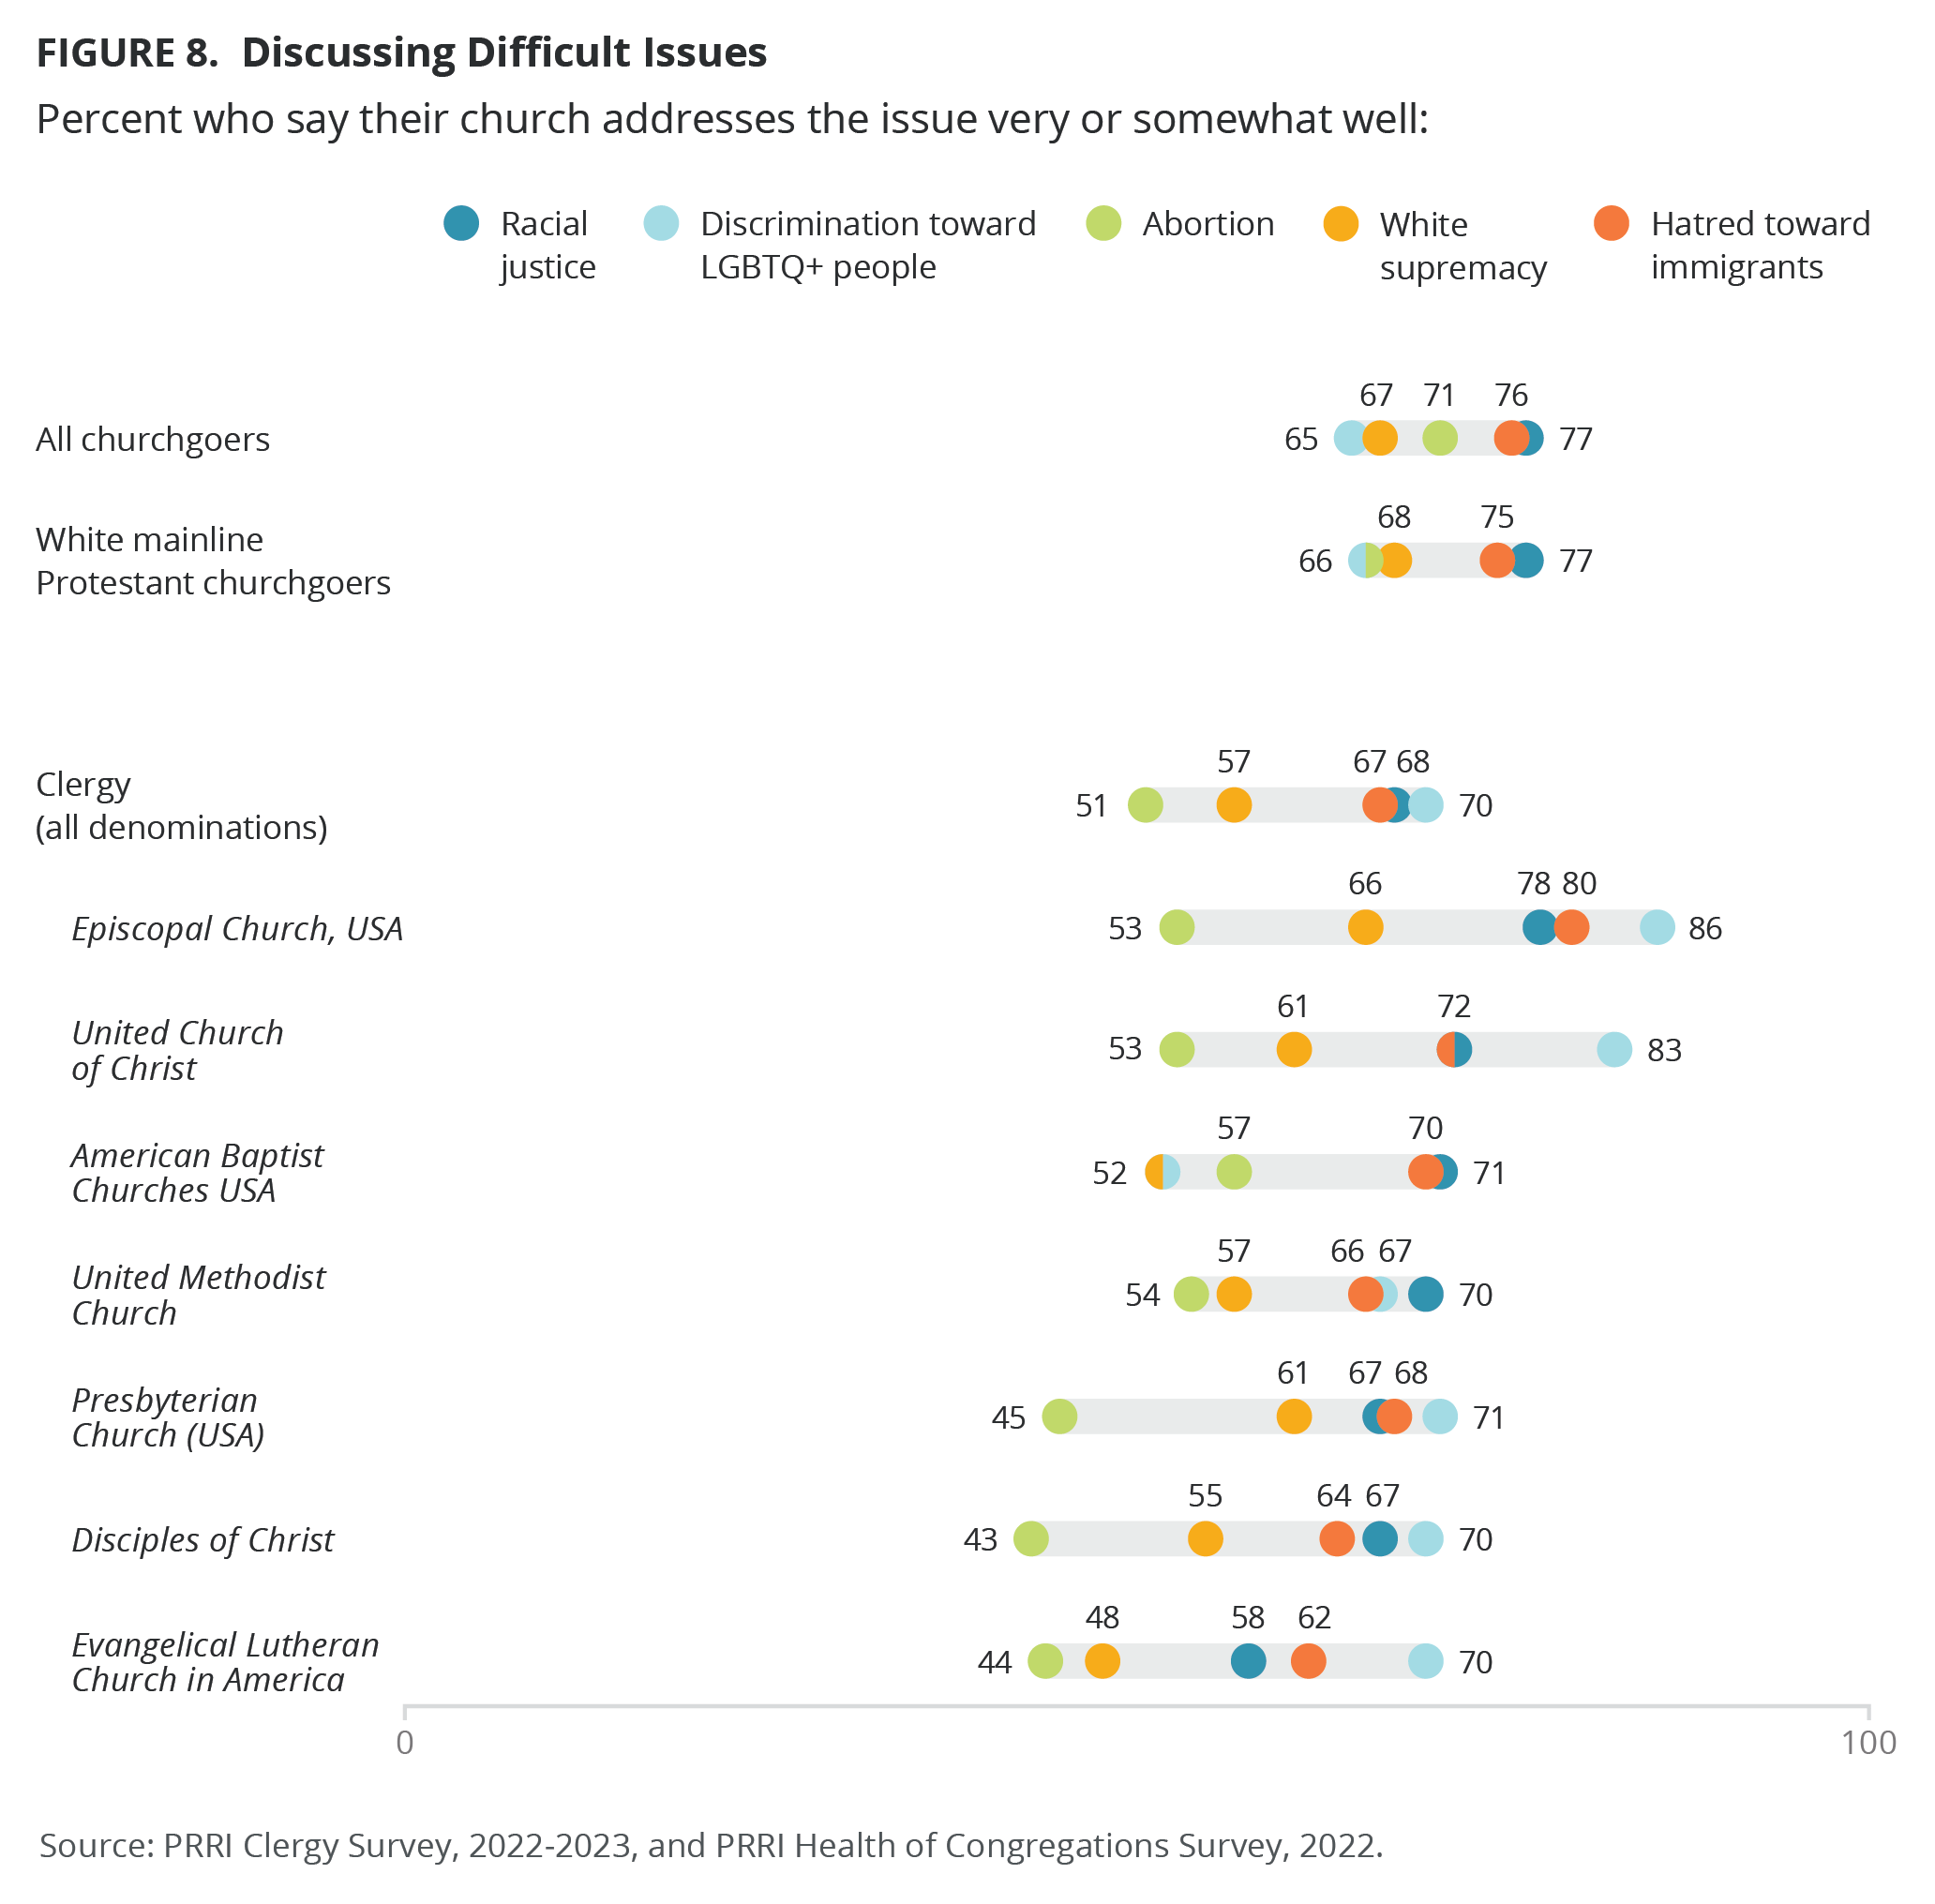
The majority of nearly all clergy denominations and churchgoers feel their congregations discuss difficult issues well, including more than two-thirds of all clergy (68%) who believe their church discusses the topic of racial justice well. With the exception of ABCUSA (71%) and Episcopal (78%) clergy, around seven in ten clergy from all other denominations say their church talks about racial justice well. Mainline clergy (68%) are somewhat less likely than their white mainline Protestant congregants (77%) and all churchgoers (77%) to say their church addresses racial justice somewhat or very well. Rural clergy (64%) are less likely than urban (74%) and suburban (73%) clergy to say their congregations discuss racial justice well, and just 14% of rural clergy and 17% of suburban clergy say this is done very well, compared with 21% of urban clergy.
Among all clergy, seven in ten say their congregation does somewhat or very well at addressing discrimination against LGBTQ+ people. A slim majority of ABCUSA (52%) as well as around seven in ten UM (67%), ELCA (70%), DOC (70%), and PCUSA clergy (71%) and more than eight in ten UCC (83%) and Episcopal clergy (86%) say discrimination against LGBTQ+ people is addressed well in their congregations. Nearly two-thirds of all churchgoers (65%) and white mainline Protestant churchgoers (66%) say this about their church. Urban clergy (80%) are more likely than suburban (69%) and rural clergy (64%) to believe their church discusses the issue of discrimination against LGBTQ+ people well, and urban clergy are twice as likely as rural clergy to say their congregations address this issue very well (39% vs. 20%, respectively), with suburban clergy falling in the middle (26%).
Hatred toward immigrants is another issue that nearly seven in ten mainline clergy (67%) say their church does somewhat or very well at discussing. Aside from Episcopal clergy (80%), between around six in ten and seven in ten clergy from other mainline Protestant denominations say that hatred toward immigrants is addressed well in their congregation. All churchgoers (76%) and white mainline Protestant churchgoers (75%) are slightly more likely to say their churches address this issue well than mainline Protestant clergy. Rural clergy (63%) are less likely than urban (71%) and suburban (71%) clergy to say their congregations discuss the issue of hatred toward immigrants well. Similarly, rural (15%) and suburban clergy (17%) are less likely than urban clergy (25%) to say their congregations discuss this topic very well.
Nearly six in ten mainline clergy (57%) believe that the issue of white supremacy is addressed well in their congregations. With the exception of ELCA clergy (48%), the majority of clergy from other mainline denominations see white supremacy as a topic that is discussed somewhat or very well in their church. Yet, mainline clergy are less likely to say this compared with their congregants (68%) and all churchgoers (67%). Clergy in urban areas (61%) are more likely than those in suburban (57%) and rural (53%) areas to say their congregations discuss the issue of white supremacy well.
Around half of clergy (51%) say that the issue of abortion is discussed somewhat or very well at their churches, including 57% of ABCUSA, 54% of UM, 53% of Episcopal, 53% of UCC, 45% of PCUSA, 44% of ELCA, and 43% of DOC clergy. Mainline clergy are less likely than their congregants (66%) and all churchgoers (71%) to say their church does well at addressing this issue.
Solid majorities of clergy (63%) across all denominations say antisemitism is an issue that is addressed somewhat or very well in their congregations. Rural clergy (61%) are less likely than urban clergy (67%) to say the topic of antisemitism is discussed well in their congregations, but do not differ from suburban clergy (63%).[17]
Acceptance of Political Differences
Overall, the majority of mainline clergy say their congregations are accepting of political differences, whether it is the clergyperson’s views or another congregant’s views. The percentage of clergy who report that their own political differences are accepted by congregants, however, is slightly lower than the percentage who report that differences between fellow church members are accepted.[18]
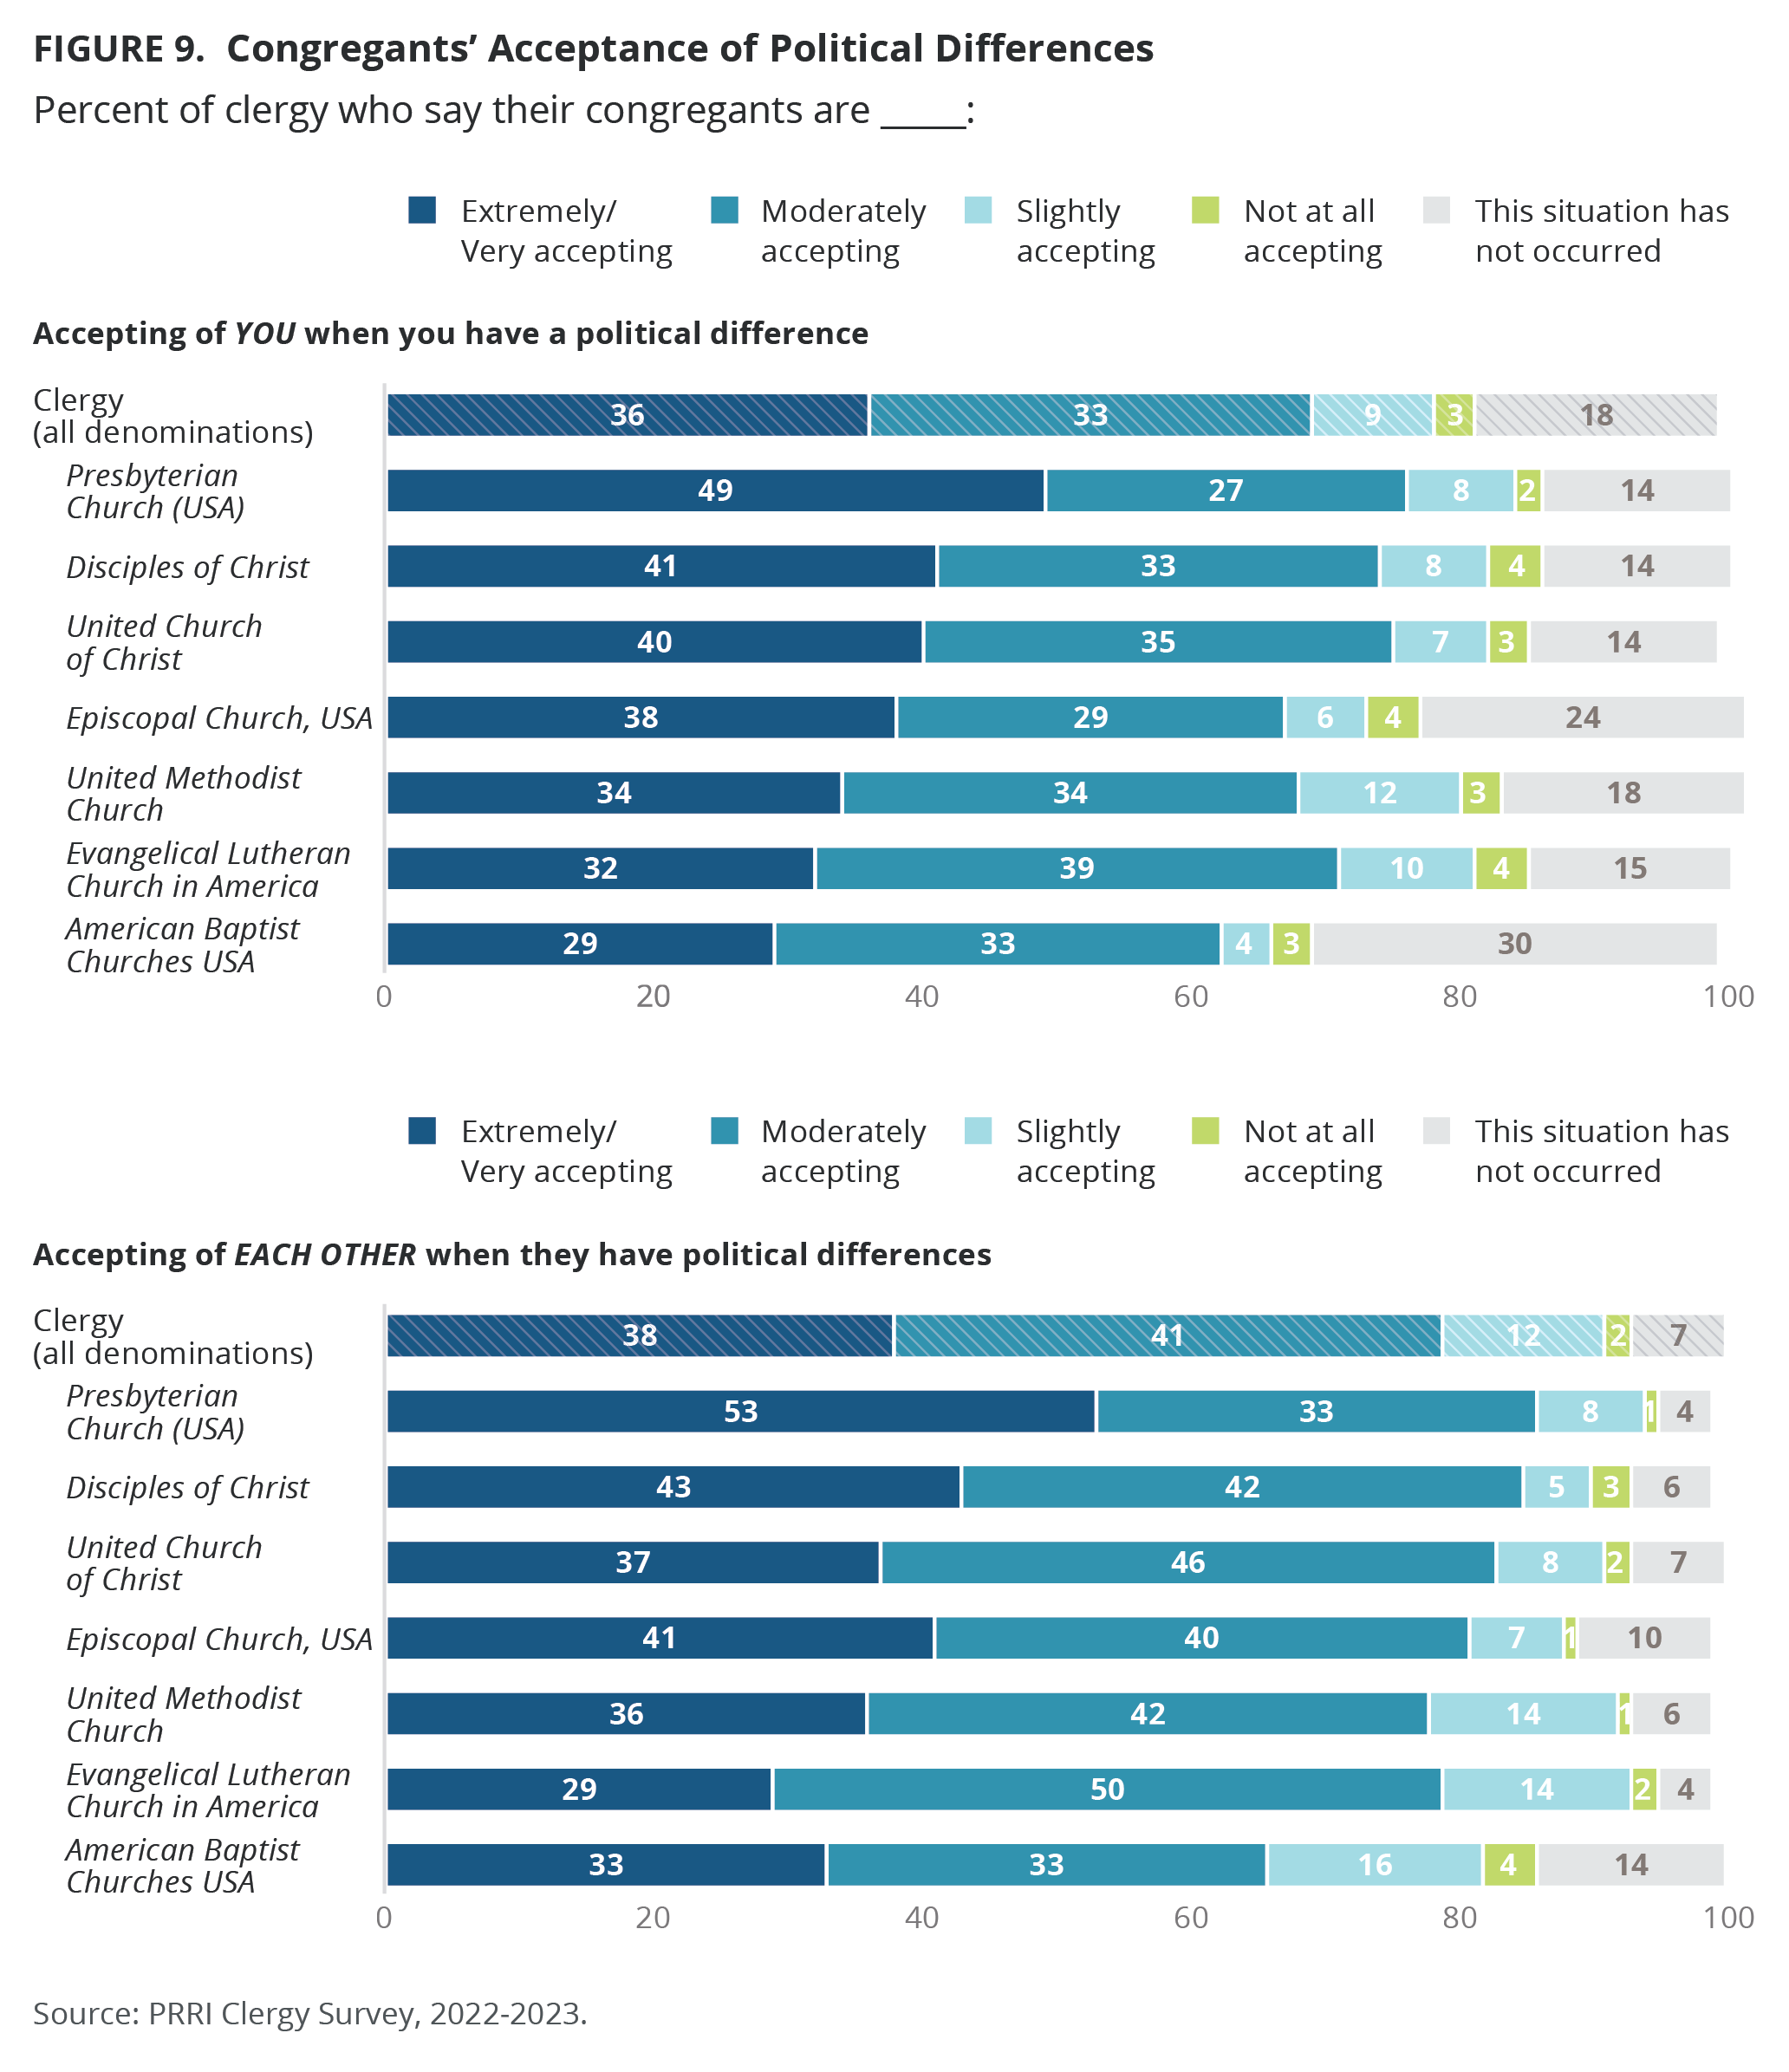
Nearly seven in ten clergy (69%) say their congregations are at least moderately accepting of them when they have a political difference, with 36% saying their congregants are very or extremely accepting and 33% saying moderately accepting. Beyond that, 9% of clergy say their congregations are slightly accepting and only 3% say their congregants are not at all accepting of them when they have a political difference; 18% of clergy say this situation has not occurred. These views are similar across denominations, with PCUSA clergy (49%) being particularly likely to say that their congregants are extremely or very accepting when they have a political difference.
Serving a congregation that does not accept their political differences can take a toll on clergy wellbeing. Among clergy who say their congregants are slightly or not accepting of their political differences, 50% report feeling emotionally drained from work every day or at least once a week, compared to 28% of clergy whose congregants are moderately or very accepting of their political differences. Moreover, among those clergy who say their congregants are slightly or not at all accepting of their political differences, 47% report feeling frustrated with their job every day or at least once a week, compared with 21% of clergy whose congregations are more accepting of their political differences.
When it comes to accepting political differences between members of their congregation, only 2% of clergy say their congregants are not at all accepting of each other’s political differences and 7% say these political differences have not occurred. These views are similar across mainline denominations, with the majority of PCUSA clergy (53%) saying that their congregants are extremely or very accepting of each other’s political differences, compared to 43% of DOC, 41% of Episcopal, 37% of UCC, 36% of UM, 33% of ABCUSA, and 29% of ELCA clergy.
Rural clergy (32% and 35%, respectively) are less likely than urban (39% and 41%, respectively) and suburban clergy (41% and 40%, respectively) to say their congregants are extremely or very accepting when they have a political difference and of each other’s political differences.
Changes Within the Church
Church Divided by Politics
Among mainline Protestant clergy, 37% agree that their church is more divided by politics than it was five years ago. Almost half of clergy (47%) disagree and 16% are unsure. ELCA clergy (46%) are the most likely to report that their church is now more divided by politics, compared to 40% of UM, 33% of PCUSA, 31% of UCC, 28% of ABCUSA, 28% of DOC, and 27% of Episcopal clergy. Clergy are about twice as likely as white mainline Protestant churchgoers (17%) and about three times as likely as all churchgoers (13%) to say that their church is more divided by politics now than it was five years ago. Urban clergy (30%) are less likely than rural (40%) and suburban clergy (37%) to say their church is more divided by politics than five years ago.
Church Is More Racially Diverse
Almost three in ten mainline clergy (27%) think their church is more racially diverse than it was ten years ago, while 64% say it is not and 9% say they are unsure. Episcopal clergy report the highest perception of change, with 38% saying their church is more diverse. Three in ten PCUSA clergy (30%) and about one in four UM (27%), DOC (26%), ABCUSA (24%), UCC (24%) and ELCA clergy (23%) say there their church’s racial diversity has increased. Meanwhile, 31% of white mainline Protestant churchgoers and 36% of all churchgoers say they have seen this increase as well. Rural clergy (17%) are about half as likely as urban (39%) and suburban clergy (30%) to say their church is more racially diverse than it was ten years ago.
The Church’s Role on Social Issues
Faith Perspective on Social Concerns
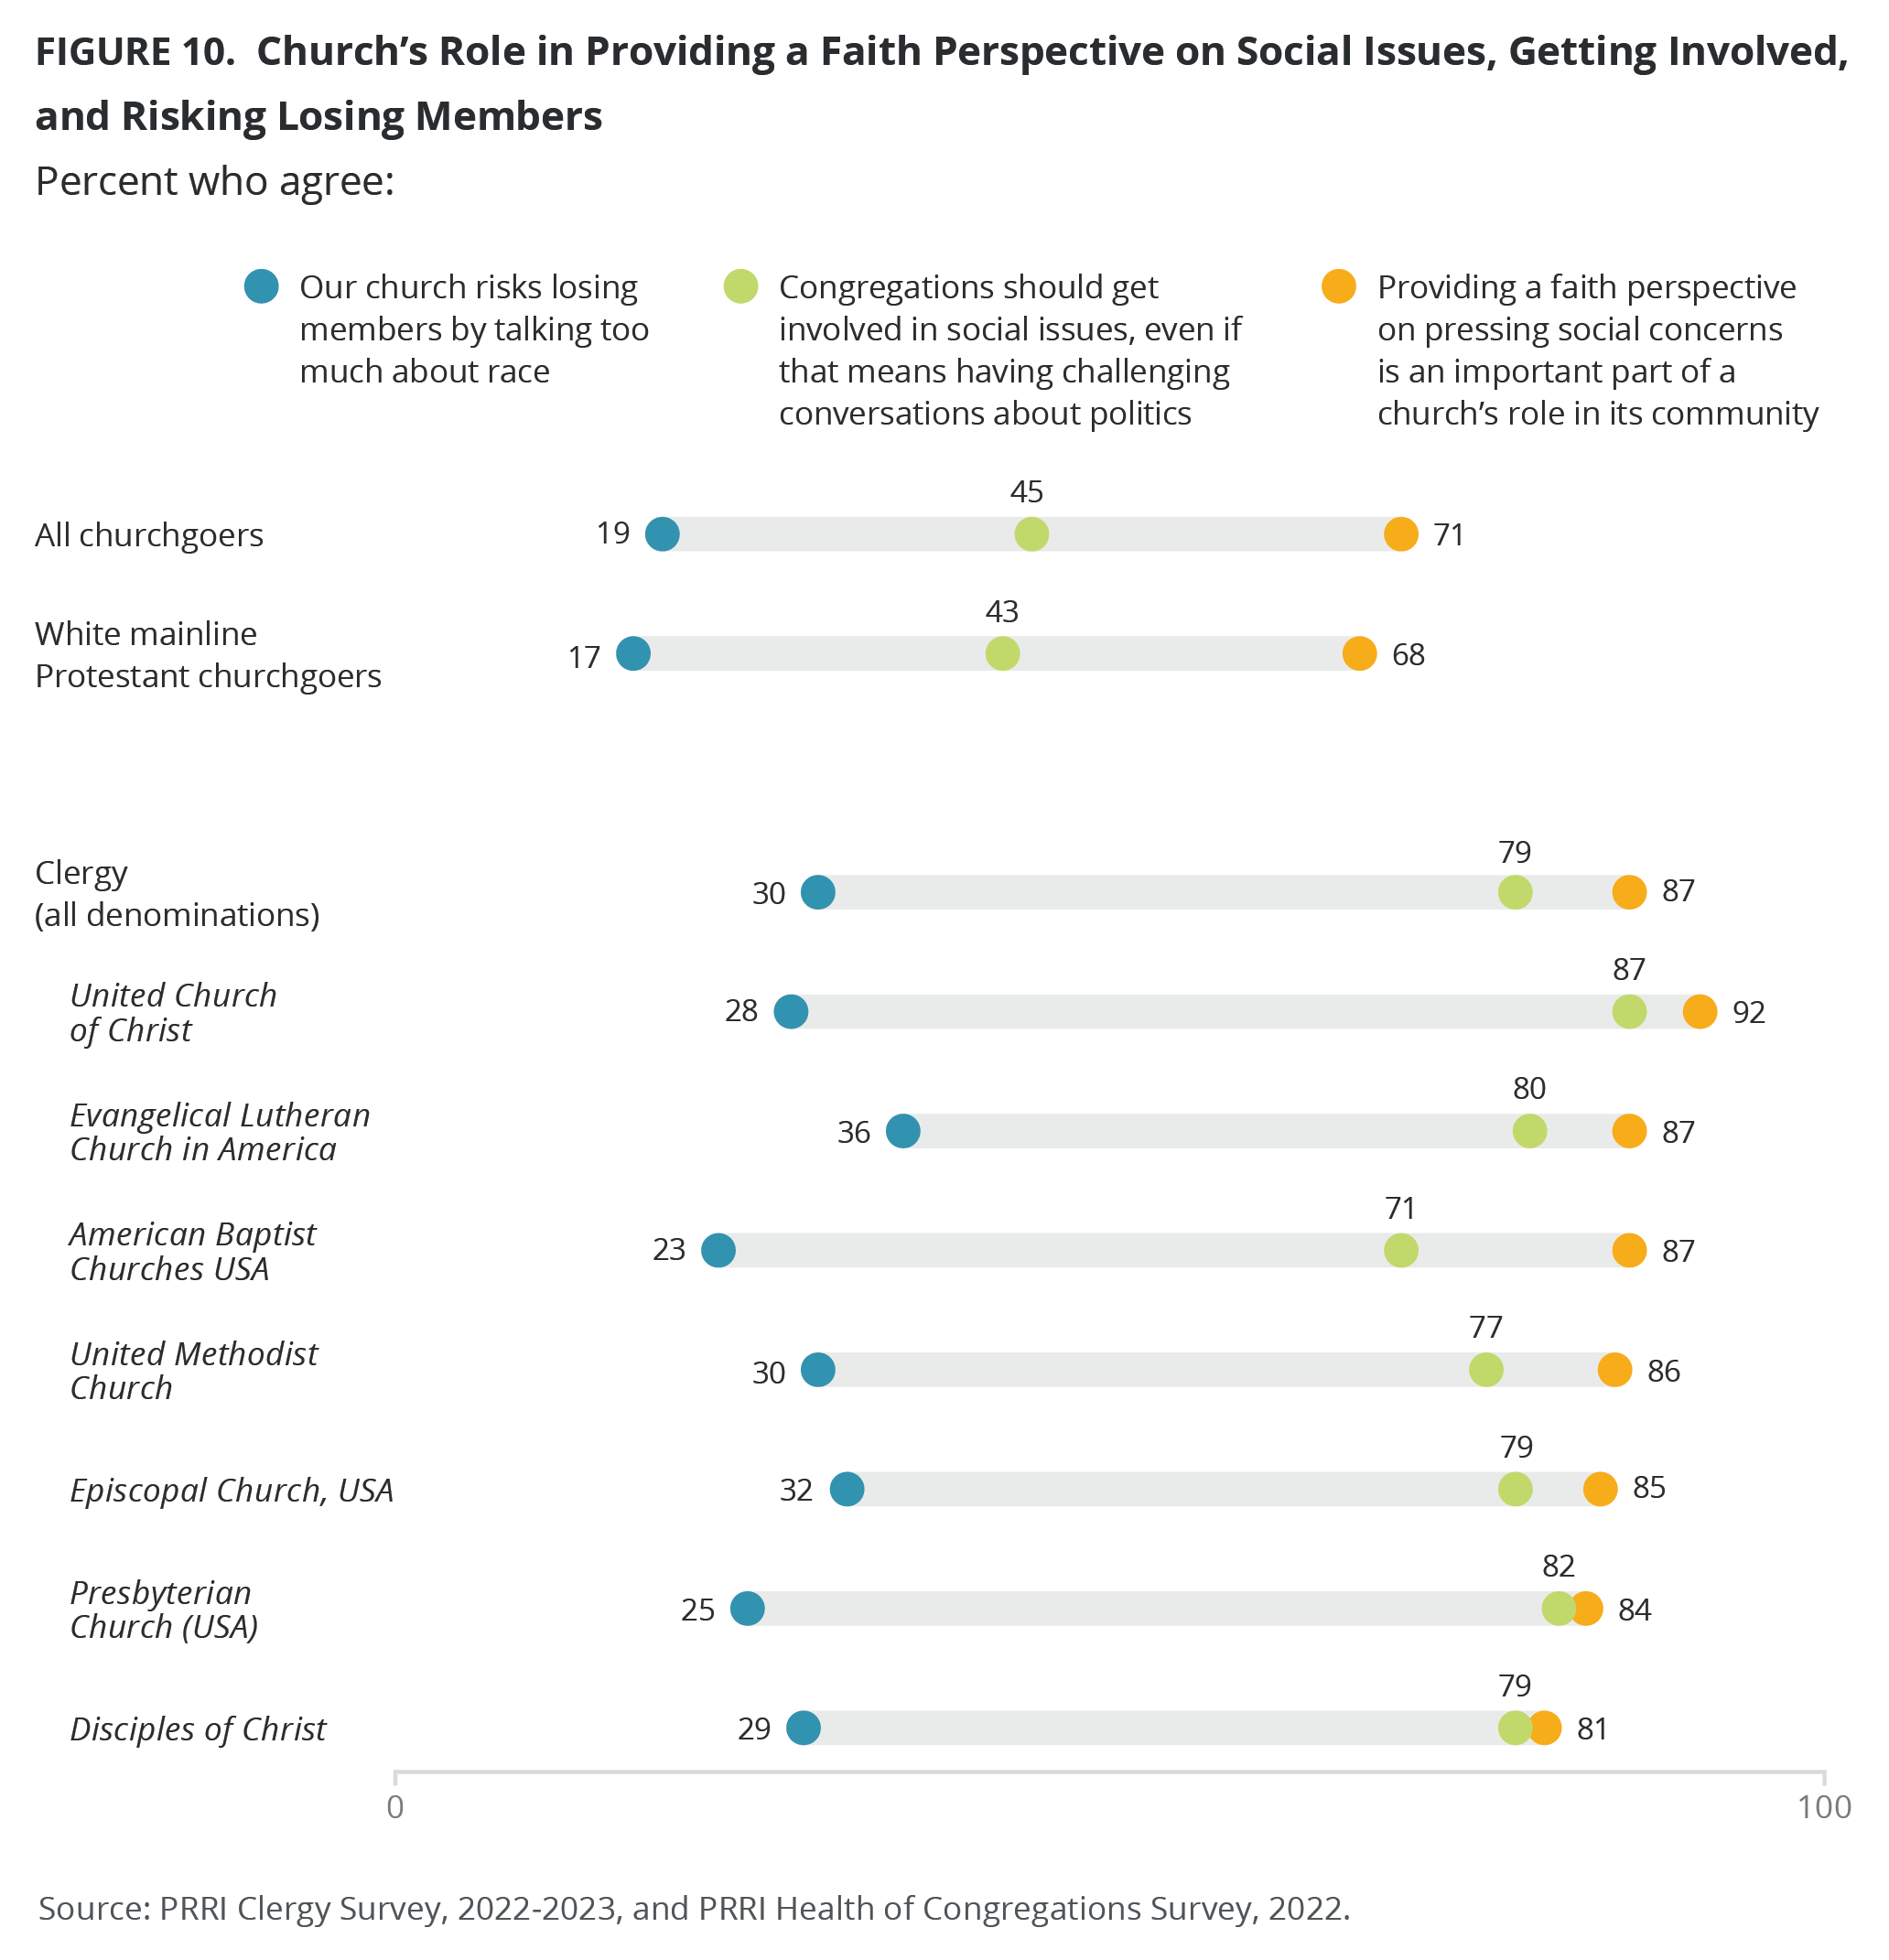
Nearly nine in ten mainline clergy (87%) agree that providing a faith perspective on pressing social concerns is an important part of a church’s role in its community. UCC clergy (92%) are the most likely to agree with this statement, followed by ELCA (87%), ABCUSA (87%), UM (86%), Episcopal (85%), PCUSA (84%) and DOC clergy (81%). Notably, mainline clergy (87%) are substantially more likely than white mainline Protestant churchgoers (68%) and all churchgoers (71%) to agree with this statement.
Congregations Should Get Involved in Social Issues
Almost eight in ten mainline clergy (79%) agree with the statement “Congregations should get involved in social issues, even if that means having challenging conversations about politics.” The highest percentage of UCC clergy (87%) agree with this statement, followed by PCUSA (82%), ELCA (80%), Episcopal (79%), DOC (79%), UM (77%), and ABCUSA clergy (71%). By contrast, all churchgoers (45%) and white mainline Protestant churchgoers (43%) are about half as likely to agree with this statement as mainline clergy. Rural clergy (74%) are less likely than suburban (80%) and urban clergy (82%) to agree that congregations should get involved in social issues, including those who strongly agree (28%, 36%, and 39%, respectively).
Risk Losing Members by Talking Too Much About Race
Three in ten mainline clergy (30%) agree with the statement “our church risks losing members by talking too much about race.” Nearly four in ten ELCA clergy (36%) agree with this statement, compared to 23% of ABCUSA clergy. About three in ten Episcopal (32%), UM (30%), UCC (28%), DOC (29%), and PCUSA clergy (25%) perceive a risk in talking about race. All churchgoers (19%) and white mainline Protestant churchgoers (17%) are notably less likely than mainline clergy (30%) to agree that their church risks losing members by talking too much about race. Urban clergy (25%) are less likely than suburban (30%) and rural clergy (33%) to agree with this statement.
The Financial Health of Their Church
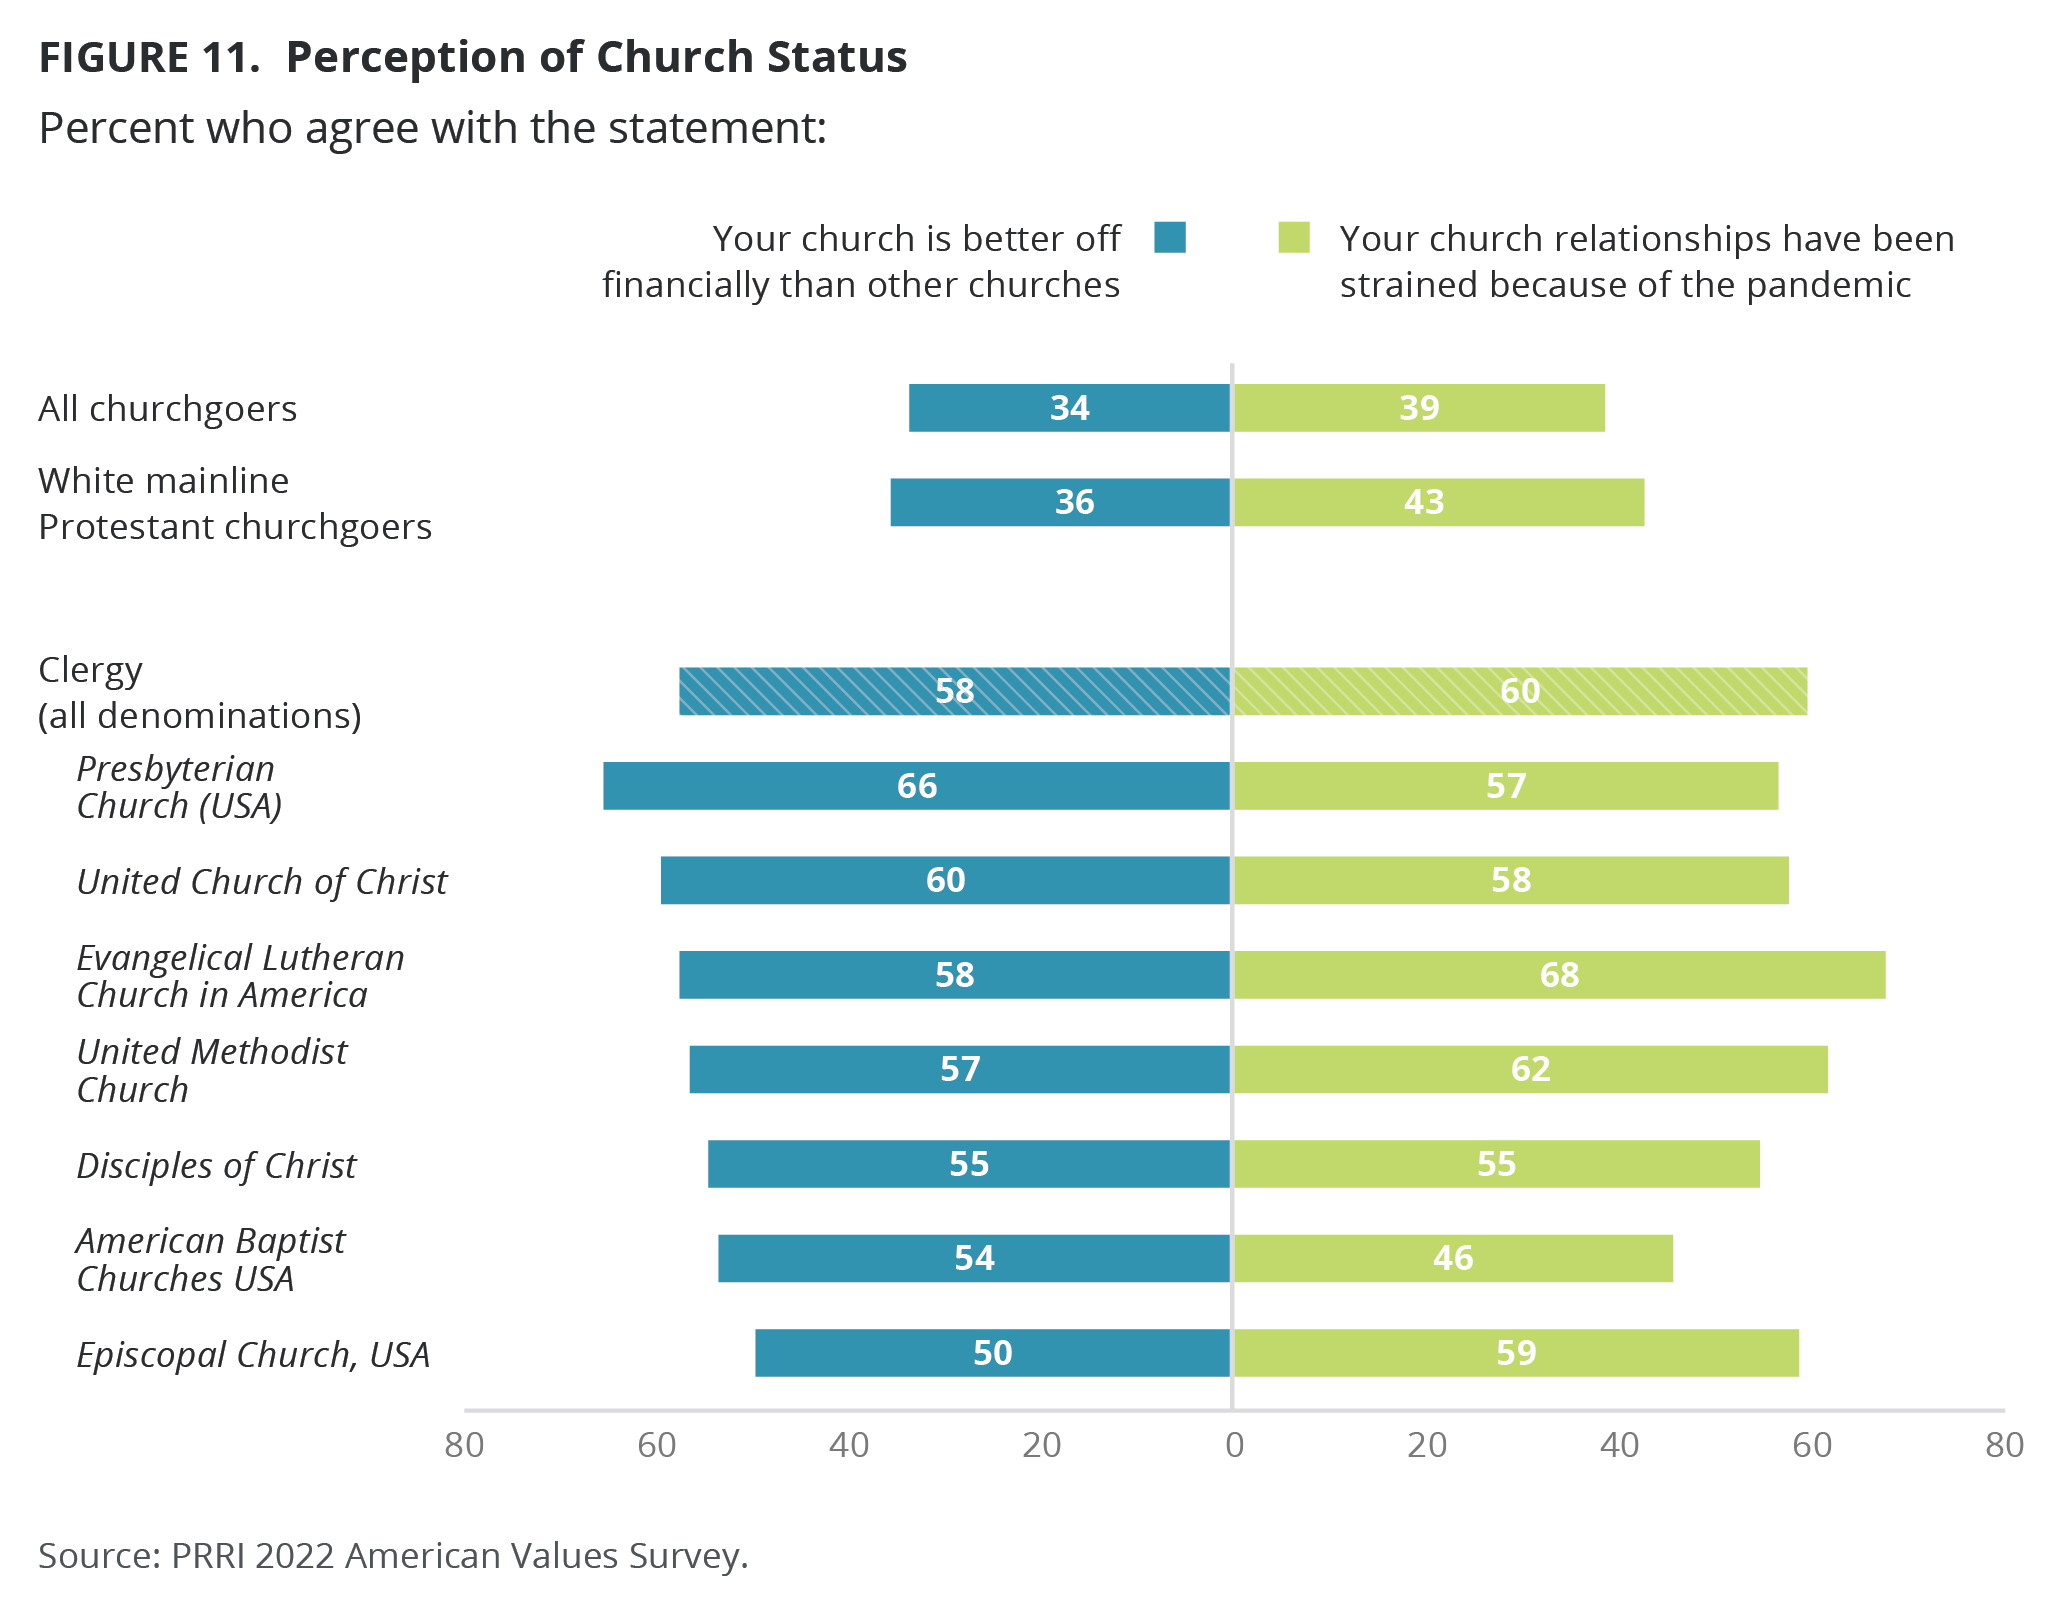
Nearly six in ten mainline clergy (58%) think their church is better off financially than other churches, with 28% saying they are not and 14% who say they are unsure. Clergy in the PCUSA church report this the most, with 66% saying their church is better off financially. About six in ten clergy in the UCC (60%), ELCA (58%), UM (57%), and DOC (55%) churches say the same. In the ABCUSA (54%) and Episcopal tradition (50%), about half of clergy say their church is better off financially than other churches. American churchgoers are distinct from mainline clergy, with only 34% saying this is the case. Similarly, only 36% of white mainline Protestant churchgoers report their church’s financial status this way.
Church Relationships and the Pandemic
Six in ten mainline clergy (60%) report their church relationships have been strained because of the pandemic, including 68% of ELCA, 62% of UM, 59% of Episcopal, 58% of UCC, 57% of PCUSA, and 55% of DOC clergy. ABCUSA clergy had the lowest reported strain at 46%. In contrast, about four in ten white mainline congregants (43%) and American churchgoers (39%) say the pandemic caused strained relationships in their church.
Optimism About the Future of Their Church
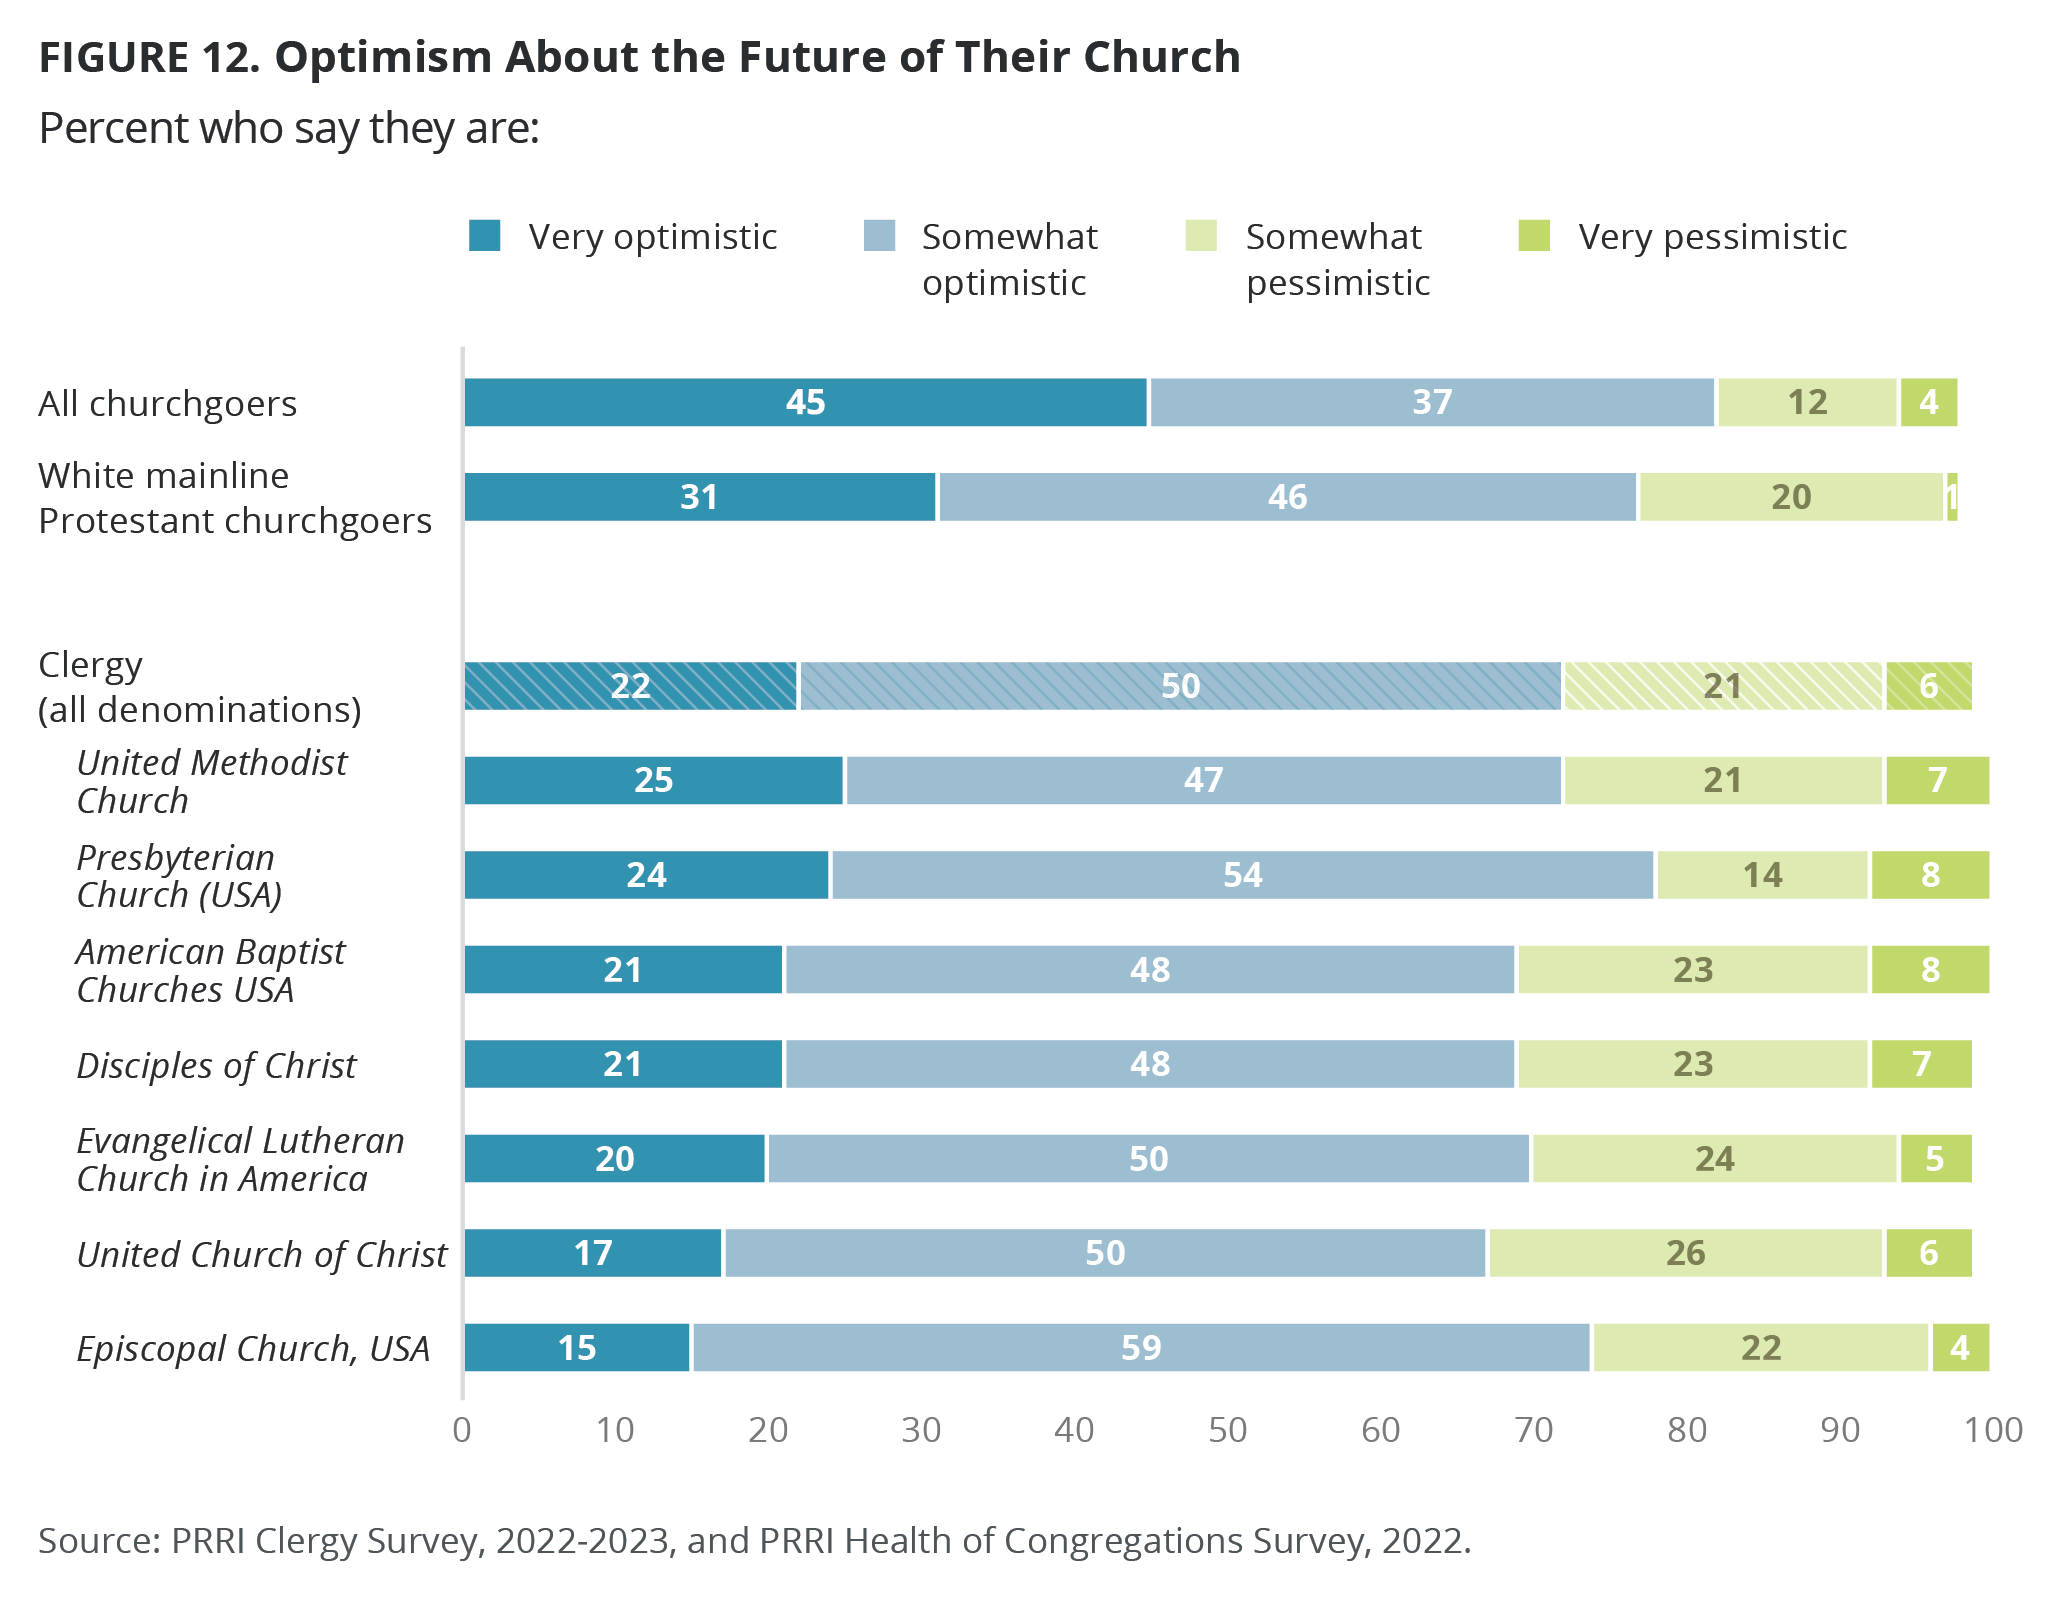
More than seven in ten mainline clergy (72%) say they are optimistic about the future of their church. The rate of optimism is similar across denominations, including 78% of PCUSA, 74% of Episcopal, 72% of UM, 70% of ELCA, 69% of ABCUSA, 69% of DOC, and 67% of UCC clergy. All churchgoers (82%) are somewhat more likely to be optimistic about the future of their church than white mainline Protestant churchgoers (77%) and clergy. Forty-five percent of American churchgoers nationally are very optimistic about the future of their church, compared with 31% of white mainline churchgoers and 22% of mainline Protestant clergy. Rural clergy (69%) are slightly less optimistic about the future of their church than suburban (73%) and urban clergy (74%), including 19%, 22%, and 25%, respectively, who are very optimistic.
Current Leadership of Denomination
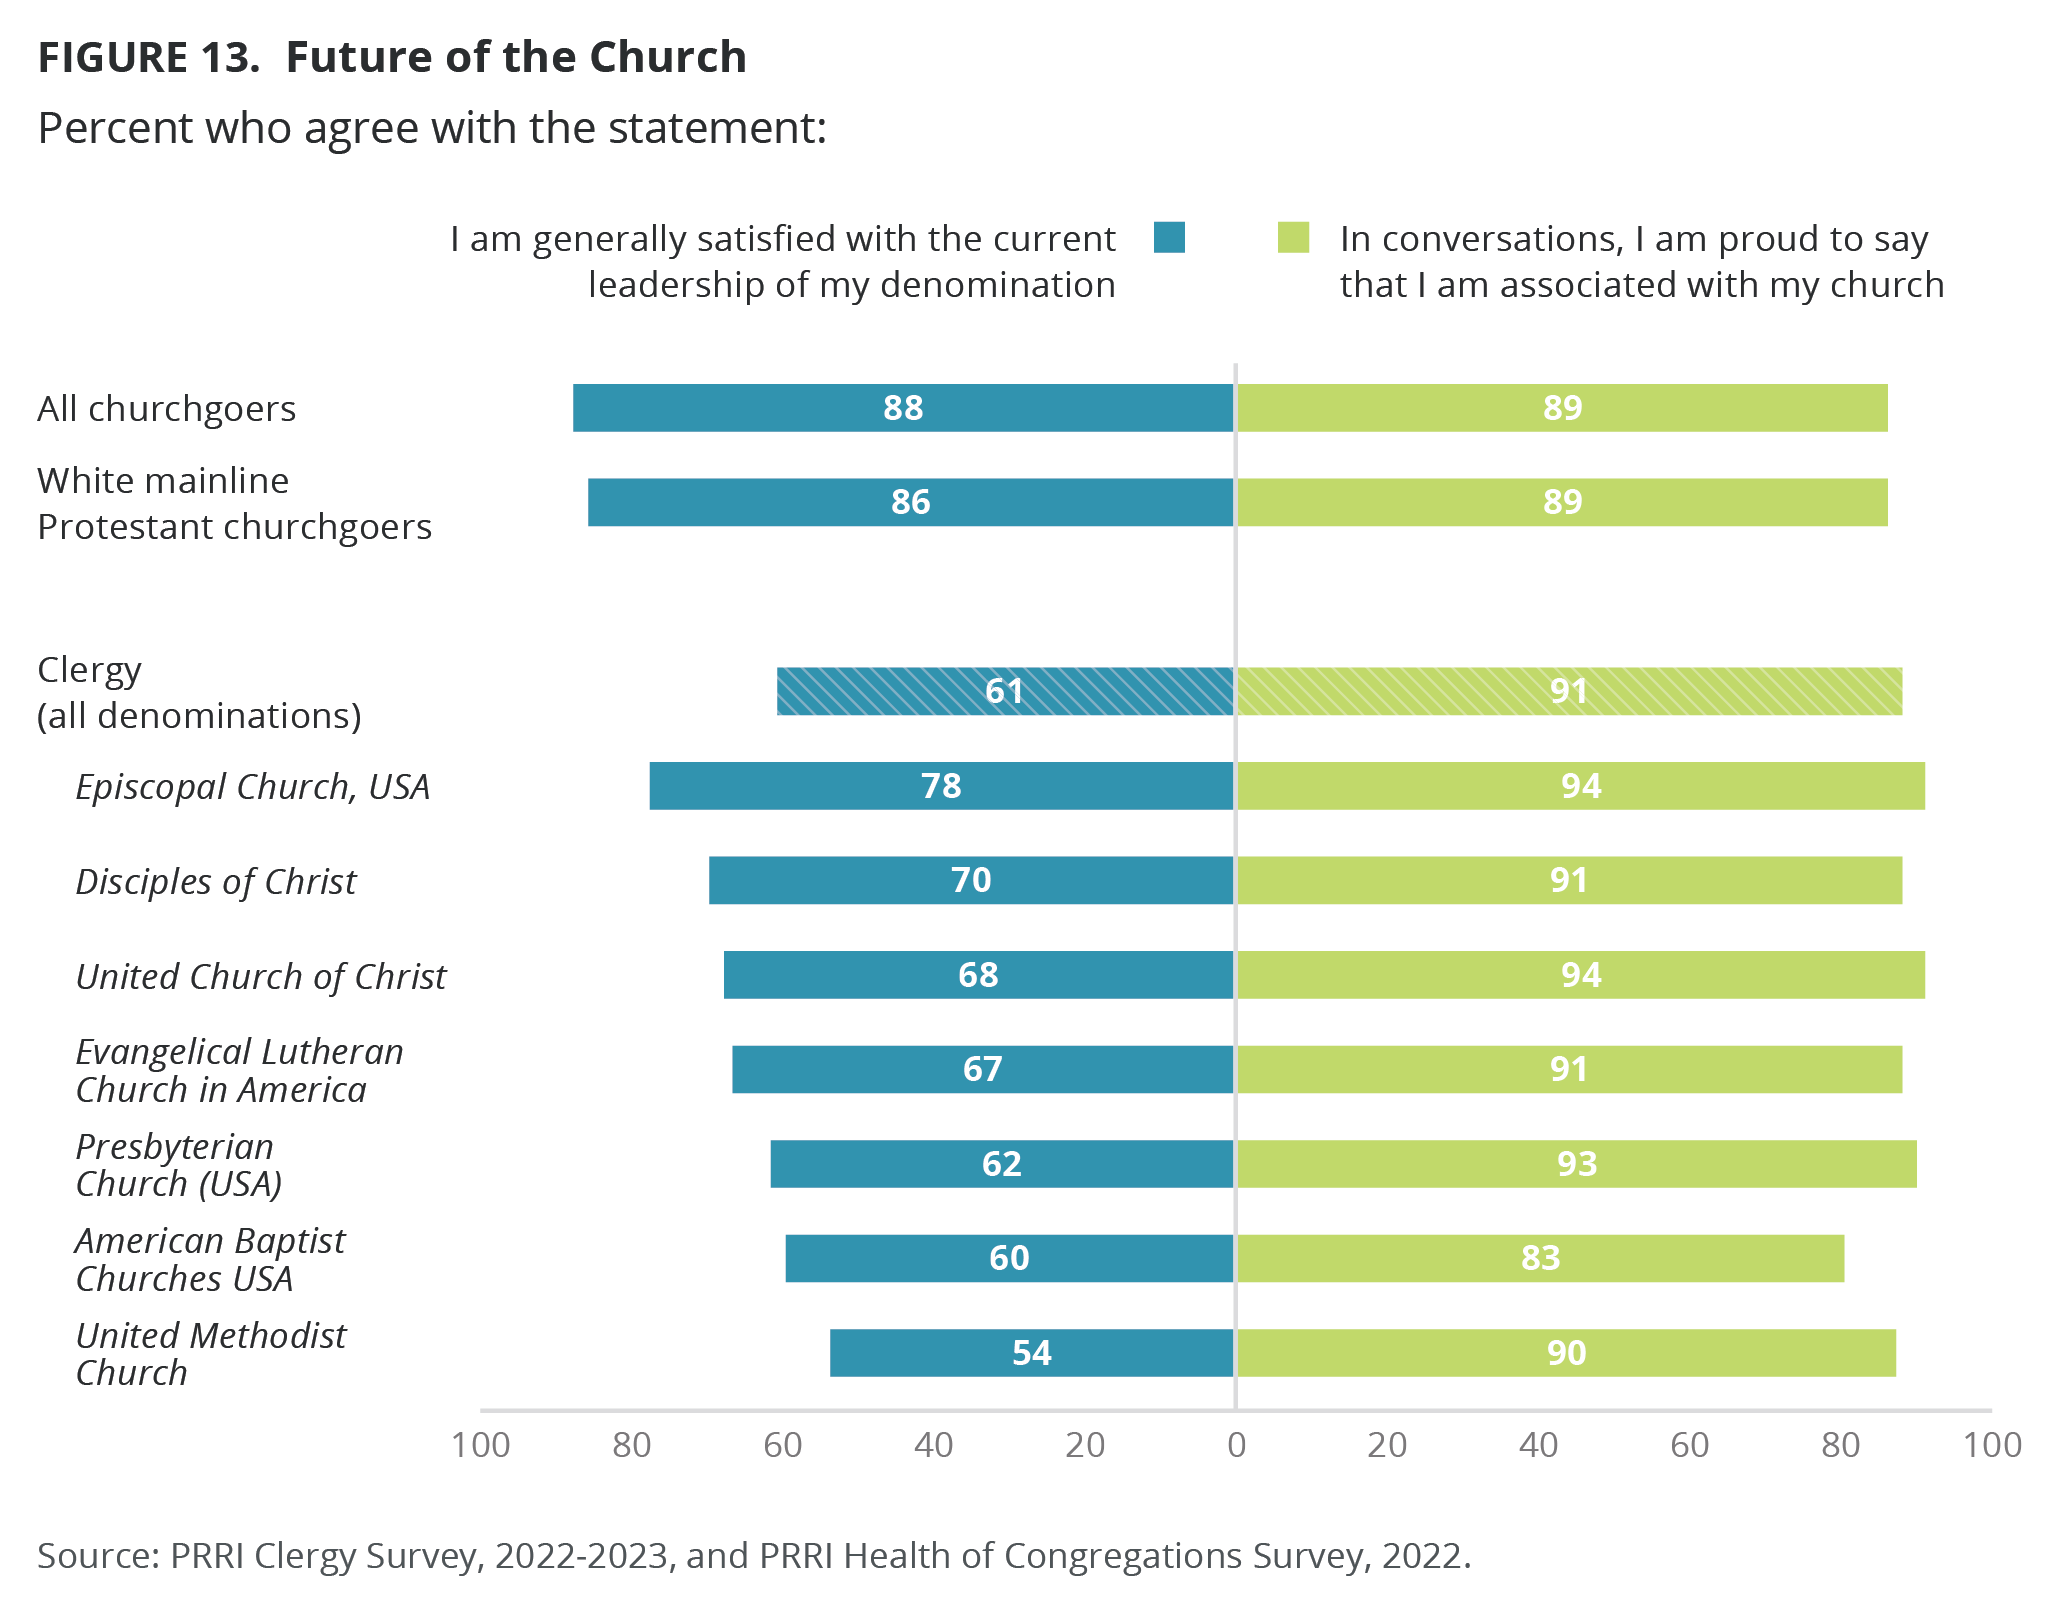
More than six in ten mainline clergy (61%) agree with the statement “I am generally satisfied with the current leadership of my denomination,” with 12% completely agreeing. Episcopal clergy (78%) are the most likely to agree. Around seven in ten DOC (70%), UCC (68%), and ELCA clergy (67%) agree with the statement as do 62% of PCUSA, 60% of ABCUSA clergy and a slim majority of UM clergy (54%). These numbers stand in contrast to American churchgoers (88%) and white mainline congregants (86%), who express far more satisfaction with the current leadership of their denominations.
Notably, satisfaction with denominational leadership among UM clergy is lower among those clergy who identify as Republican (36%) than those who identify as Democratic (73%). Similarly, UM clergy who say they are conservative (27%) are notably less likely to be satisfied with the current leadership of their denomination than liberal UM clergy (71%).[19]
Proud of Being Associated With Their Church
Nine in ten mainline clergy (91%) agree with the statement “In conversations, I am proud to say that I am associated with my church,” with a majority (56%) completely agreeing. Solid majorities of clergy across denominations agree with this statement and are closely aligned with white mainline Protestant churchgoers (89%) and all American churchgoers (89%).
Diversifying Churches and Congregations
Diversifying Church Leadership
People of Color in Leadership
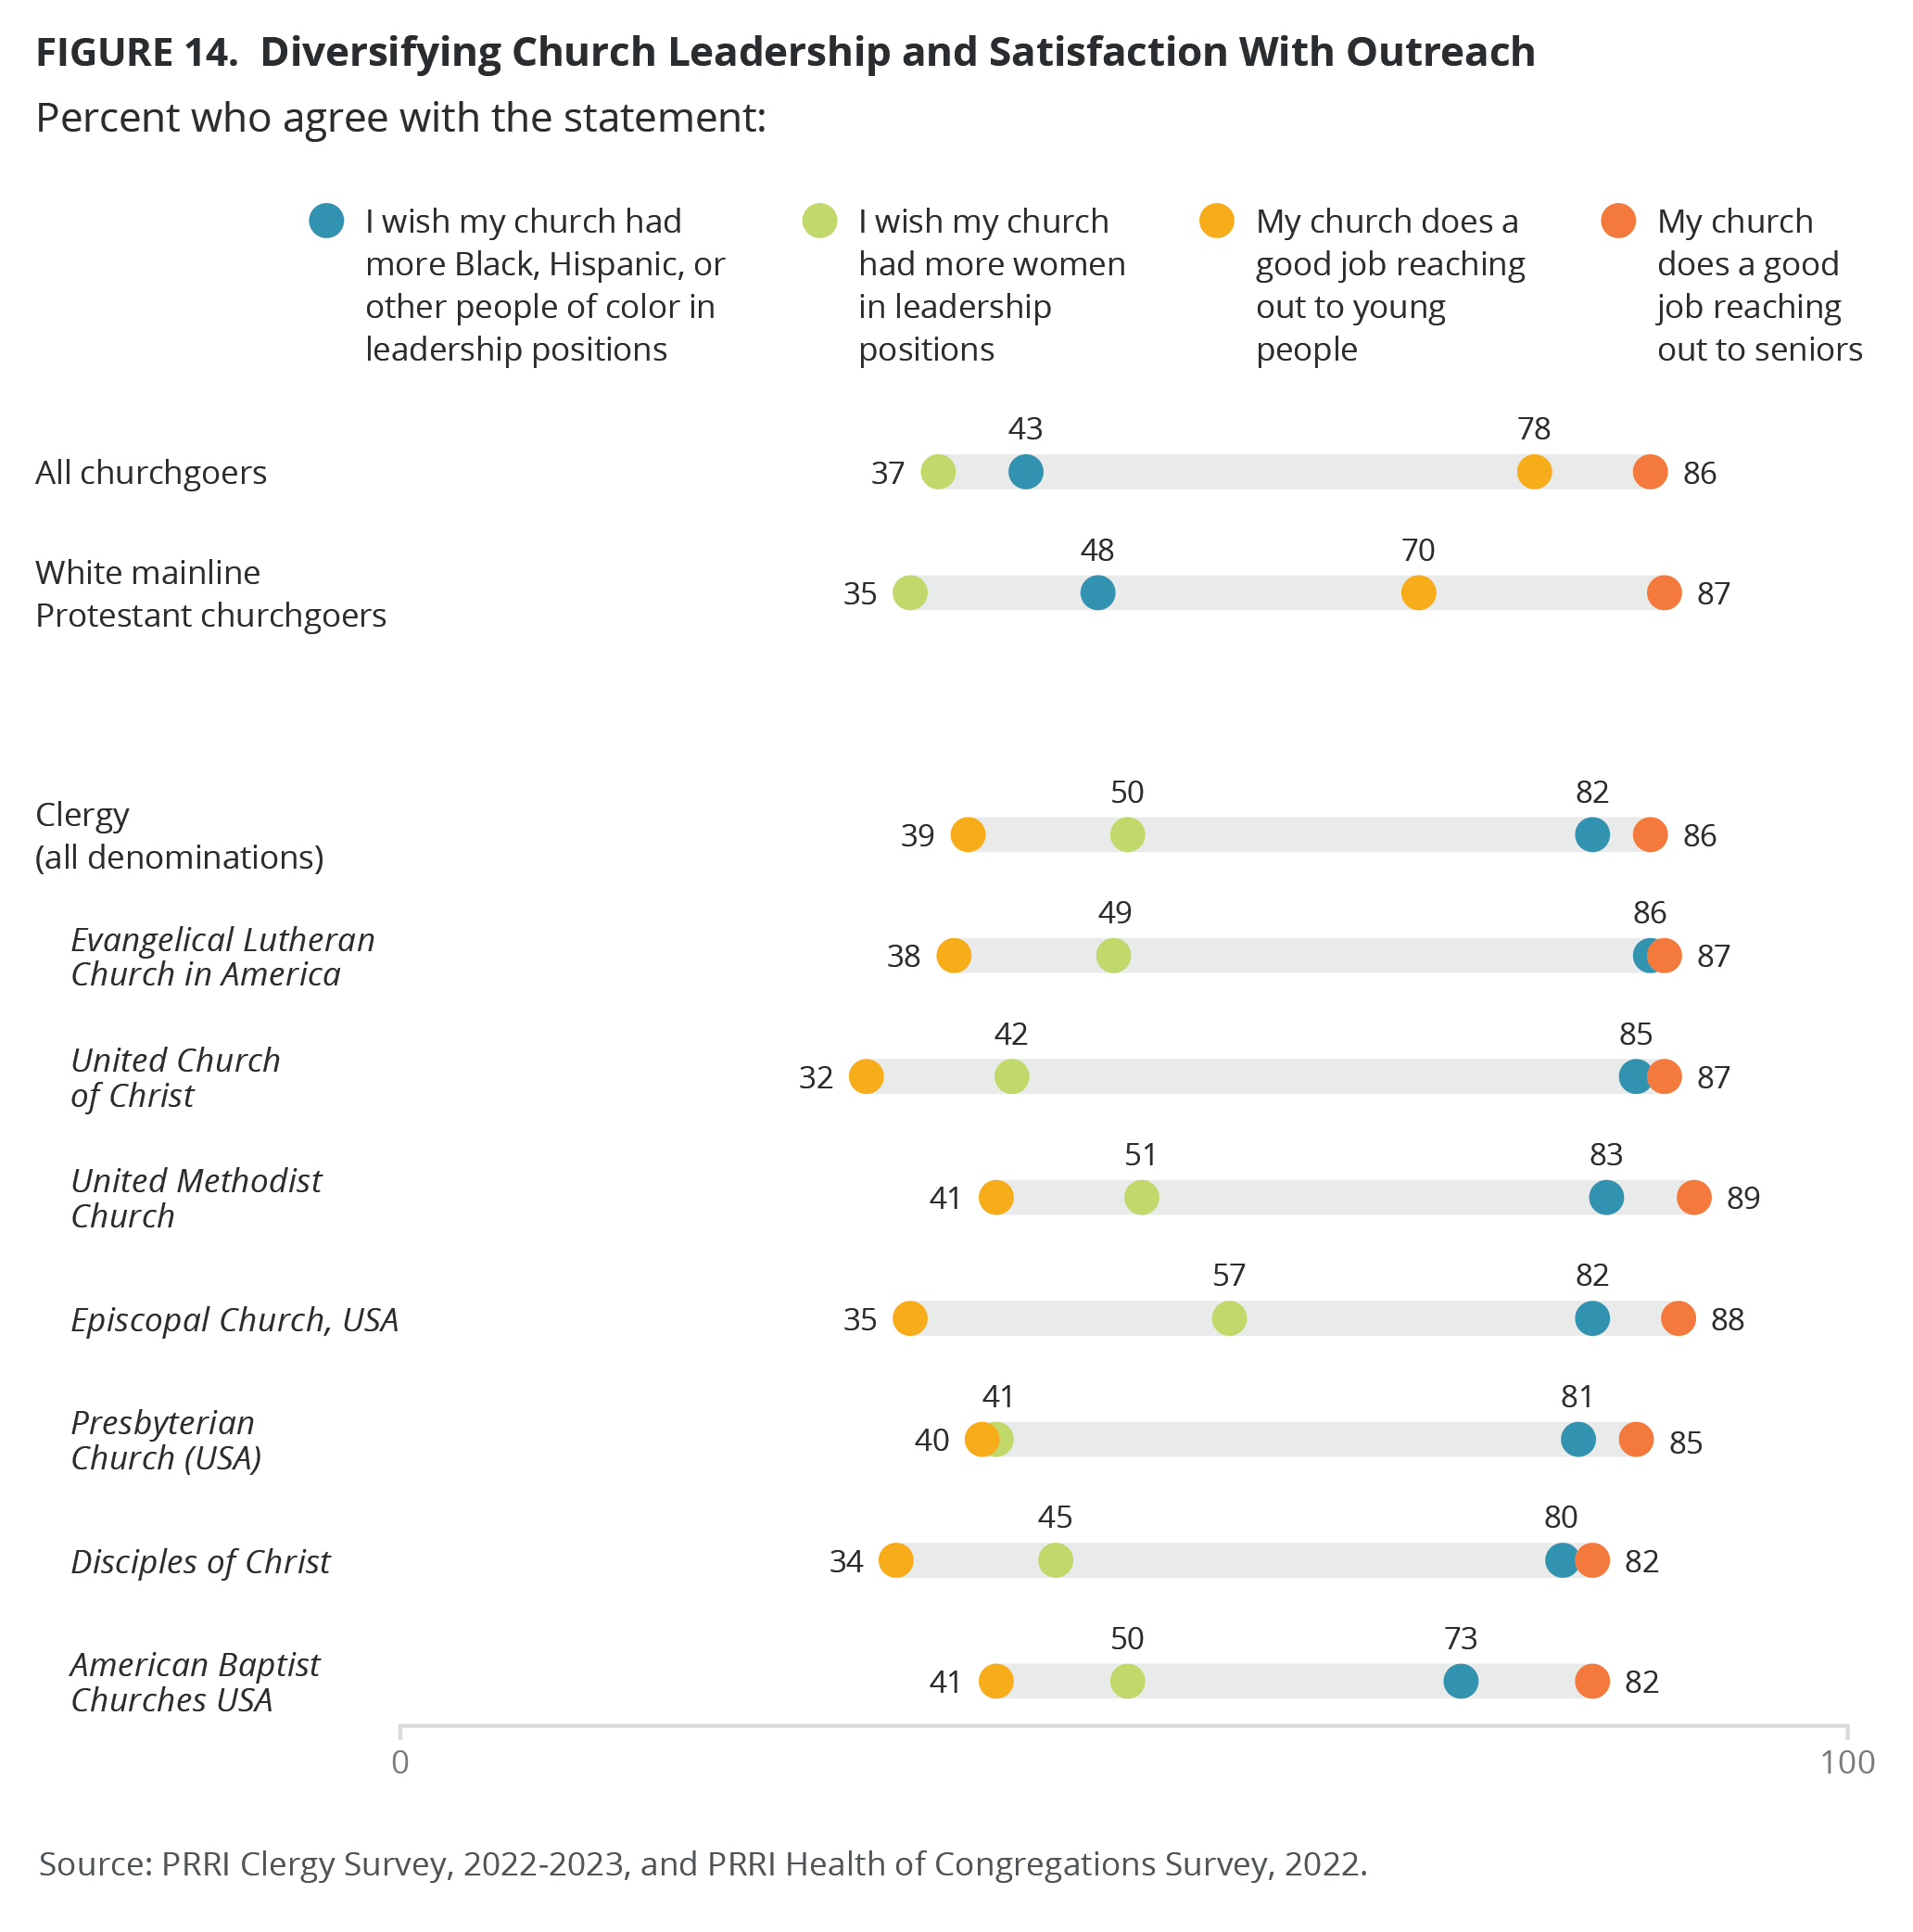
More than eight in ten mainline clergy (82%) agree with the statement “I wish my church had more Black, Hispanic, or other people of color in leadership position.” At least eight in two ELCA (86%), UCC (85%), UM (83%), Episcopal (82%), PCUSA (81%), and DOC clergy (80%) agree with this statement. Out of the mainline denominations, ABCUSA clergy agreed with the statement the least (73%). American churchgoers (43%) and white mainline congregants (48%) are notably less likely than clergy to say they wish more people of color served in their church leadership. Notably, Rural clergy (78%) are less likely than urban (85%) and suburban clergy (88%) to agree with this statement, including 35%, 47%, and 44%, respectively, who strongly agree.
Women in Leadership
While all denominations featured in this report have long ordained women as pastors, half of mainline clergy (50%) agree with the statement “I wish my church had more women in leadership positions.” Episcopal clergy agree with this statement the most out at 57%. Around half of UM (51%), ABCUSA (50%), ELCA clergy (49%) and around four in ten DOC (45%), UCC (42%) and PCUSA clergy (41%) also agree. By contrast, only 37% of American churchgoers and 35% of white mainline congregants wish their churches had more women in leadership positions.
Just over four in ten women clergy (41%) agree with the statement “I wish my church had more women in leadership positions,” compared to 57% who disagree. By contrast, male clergy are equally divided on this question (52% agree, 48% disagree).
Church Outreach to Different Age Groups
Church Does Good Job Reaching Out to Young People
Nearly four in ten mainline clergy (39%) agree with the statement “My church does a good job reaching out to young people,” with 60% disagreeing. About four in ten UM (41%), ABCUSA (41%), PCUSA (40%), and ELCA (38%) clergy agree with this statement. About three in ten Episcopal (35%), UCC (32%) and DOC clergy (34%), agree. On the other hand, 78% of American churchgoers and 70% of white mainline Protestant churchgoers say their church does well reaching out to young people.
Church Does Good Job Reaching Out to Seniors
Nearly nine in ten mainline clergy (86%) agree with the statement “My church does a good job reaching out to seniors.” Solid majorities across all mainline clergy agree with this statement. Churchgoers and white mainline Protestants agreed at similar rates (86% and 87%, respectively). Rural clergy (90%) are more likely than urban (86%) and suburban clergy (82%) to say their church does a good job reaching out to seniors.
What Can the Church Talk More About?
Addressing Political Divisions
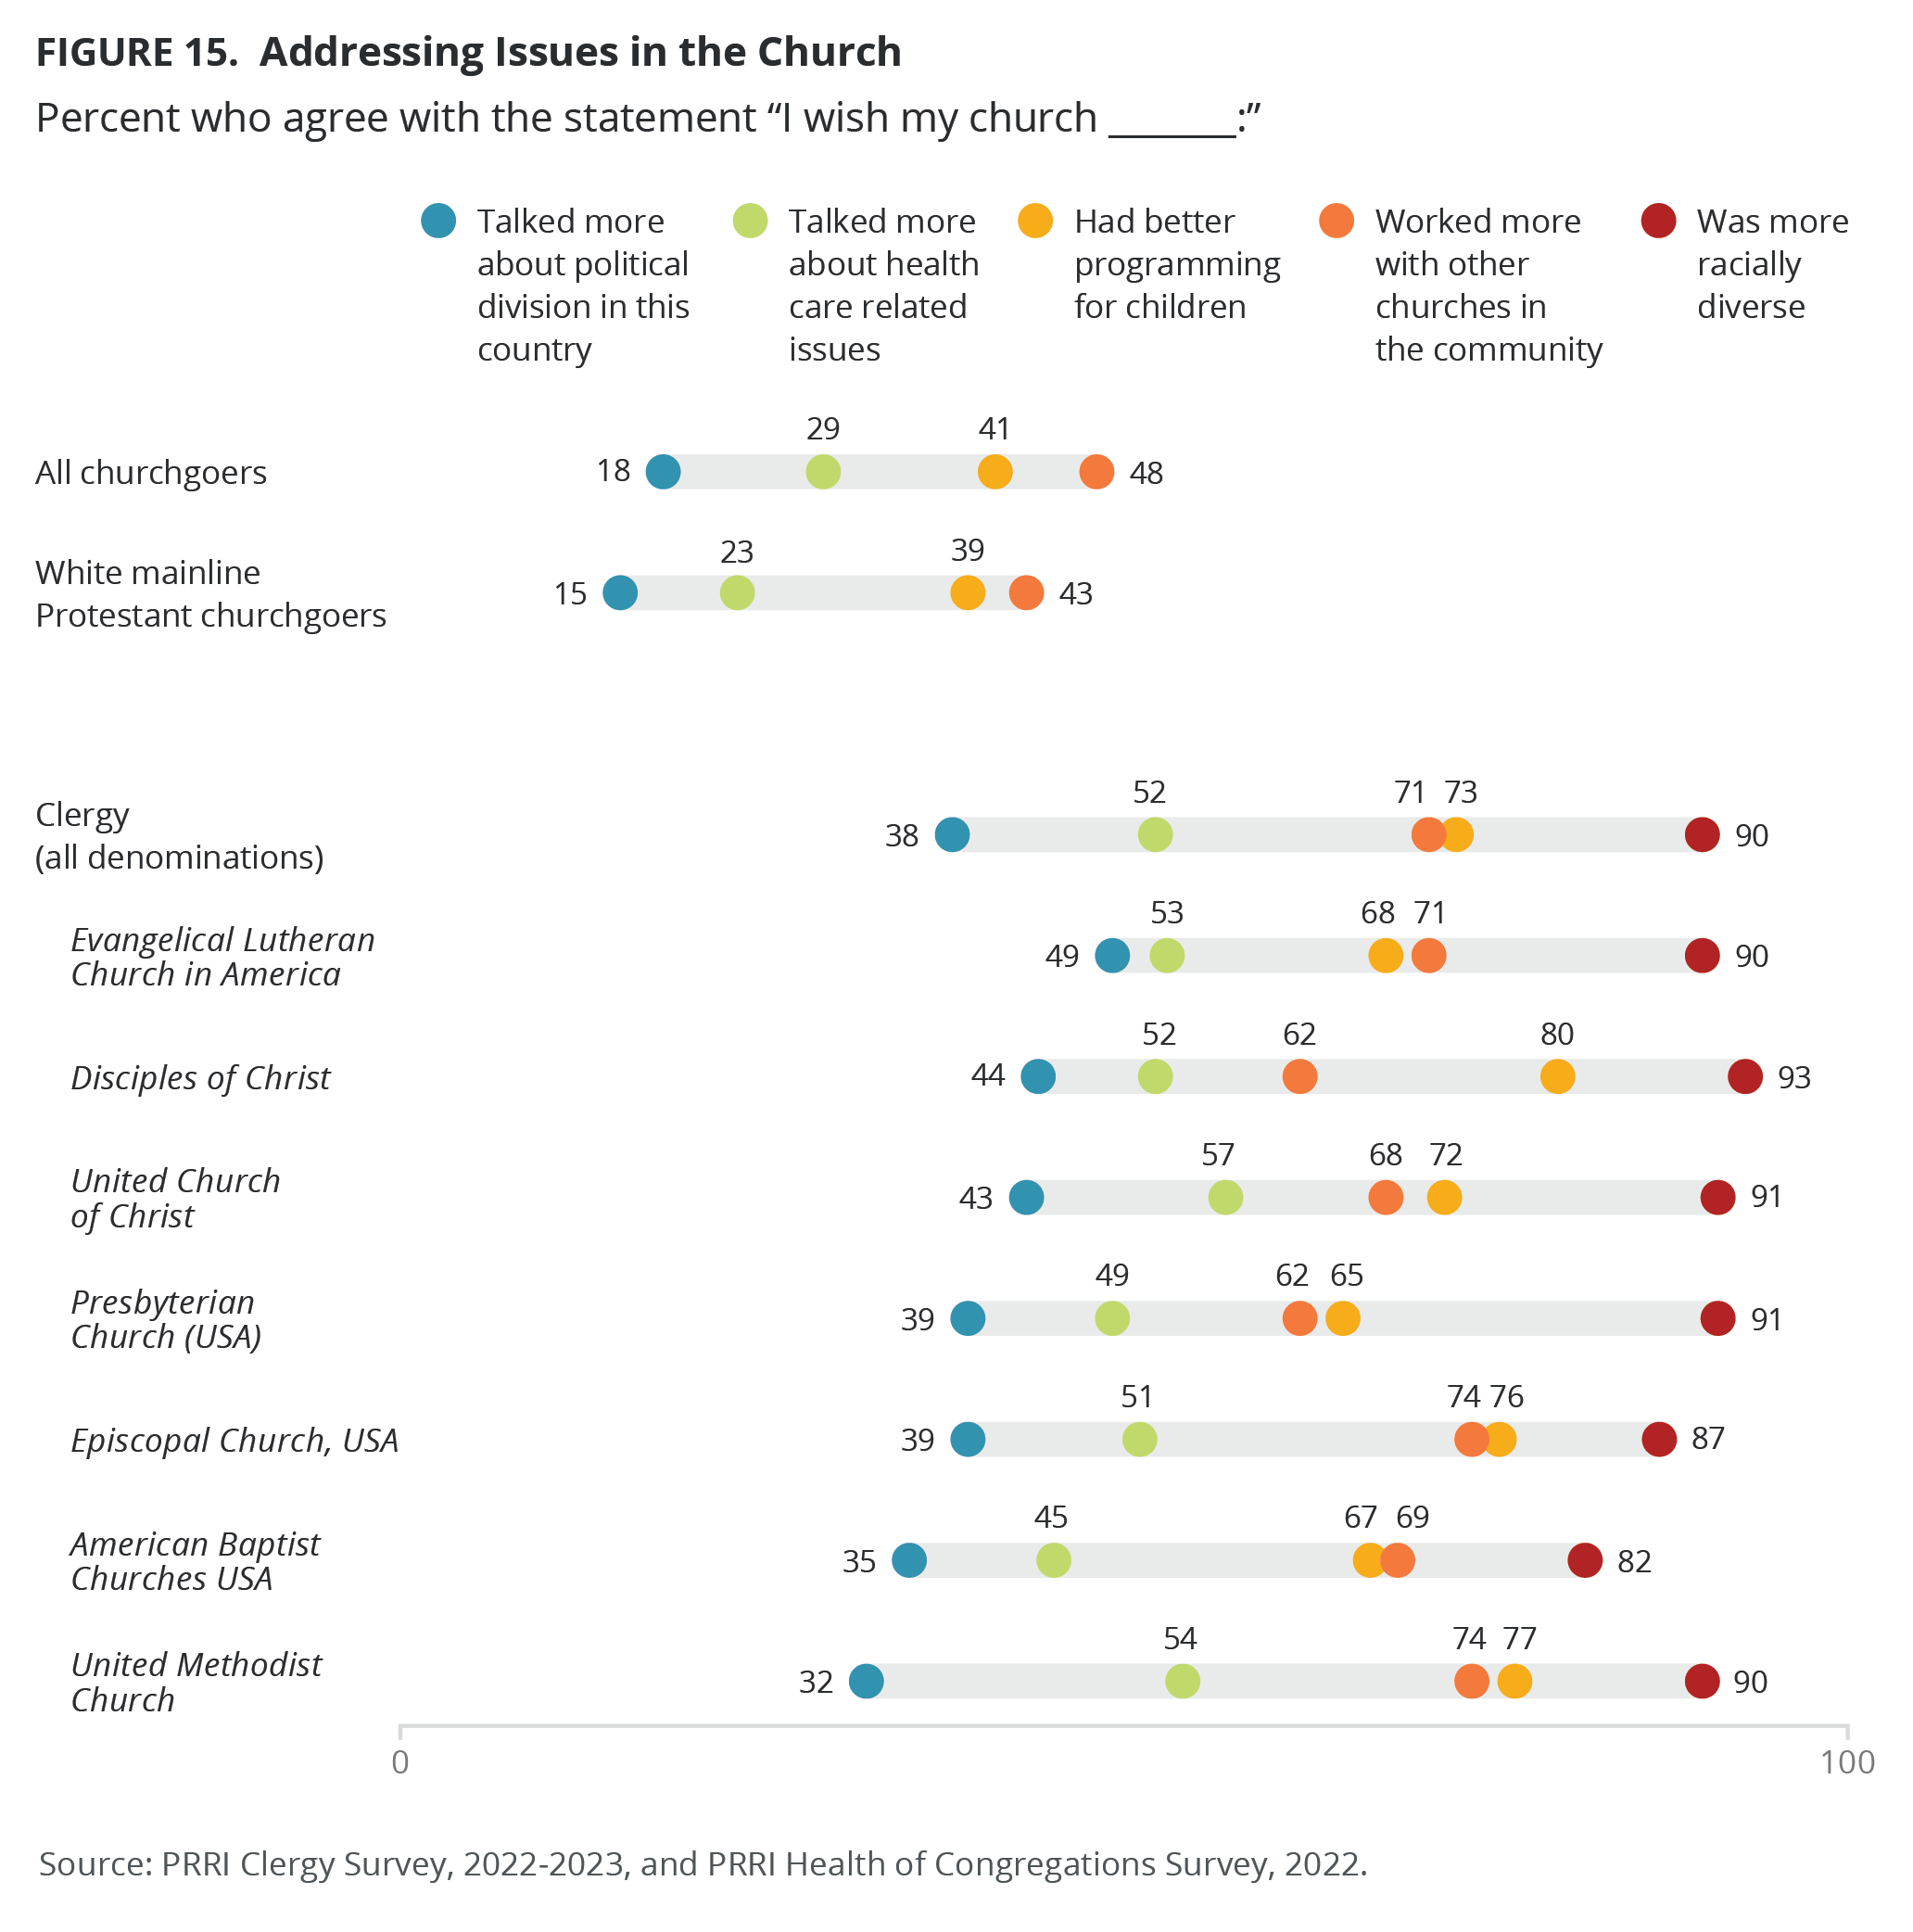
Out of all mainline clergy, almost four in ten (38%) agree with the statement “I wish my church talked more about political division in this country.” Nearly half of ELCA clergy (49%) and about four in ten DOC (44%), UCC (43%), PCUSA (39%), Episcopal (39%), and ABCUSA (35%) clergy agree with this statement. By contrast, only 18% of American churchgoers and 15% of white mainline Protestants say they wish their church talked more about the country’s political division.
Addressing Health Care Issues
A slim majority of mainline clergy (52%) agree with the statement “I wish my church talked more about health care related issues.” More than half of UCC (57%), UM (54%), ELCA (53%), DOC (52%), and Episcopal clergy (51%) agree with this statement. Nearly half of PCUSA and ABCUSA clergy said the same (49% and 45%, respectively). American churchgoers (29%) and white mainline congregants (23%) are about half as likely as mainline clergy (52%) to wish their church talked more about health care related issues.
Improving Racial Diversity
Nine in ten mainline clergy (90%) agree with the statement “I wish my church was more racially diverse.” Across all traditions, solid majorities of mainline clergy say they wish their church was more racially diverse.[20]
Working With Other Churches
More than seven in ten mainline clergy (71%) agree with the statement “I wish my church worked more with other churches in the community.” In the UM (74%), Episcopal (74%), ELCA (71%), ABCUSA (69%), and UCC (68%) churches, about seven and ten clergy agree with the statement. Around six in ten clergy in the PCUSA (62%) and DOC (62%) traditions say the same. By contrast, 48% of American churchgoers and 43% of white mainline congregants wish their church worked more with other churches in the community.
Better Programming for Children
Almost three in four mainline clergy (73%) agree with the statement “I wish my church had better programming for children.” Around eight in ten DOC (80%), UM (77%), and Episcopal clergy (76%) agree with this statement. In the UCC church, 72% of clergy agree as do 68% of ELCA, 67% of ABCUSA, and 65% of PCUSA clergy. By contrast, only 41% of American churchgoers and 39% of white mainline Protestant churchgoers wish their church had better programming for children.
[1] James Hudnet-Beumler and Mark Silk, eds. 2018. The Future of Mainline Protestantism in America. New York: Columbia University Press. The seven largest Protestant denominations historically are referred to as the “Seven Sisters,” including the United Methodist Church, the Evangelical Lutheran Church in America, the Presbyterian Church (USA), the American Baptist Churches USA, the Episcopal Church, the United Church of Christ, and the Christian Church (Disciples of Christ).
[2] Joseph Roso and Mark Chaves. 2023. “Clergy-lay political (mis)alignment in 2019-2020.” Politics & Religion. 16(3): 533-542. doi: 10.1017/S1755048323000172.
[3] Concerning denominational affiliation and race, mainline Protestants are 86% white (Pew Forum 2014). In this report, when we refer to mainline Protestants from our Health of Congregations survey, we follow the dominant practice in most political surveys of restricting the category to white mainline Protestants only. In the Health of Congregations survey, we identify as mainline Protestant Christians those who identify as Protestant but who do not identify as a born-again or evangelical Christian. Although our Health of Congregations survey refers to these respondents as white mainline/non-evangelical Protestants, for ease of presentation in this report, we refer to them as “white mainline Protestant churchgoers.” More detailed information regarding white mainline Protestant churchgoers and all churchgoers, including the sample design and more, can be found here: https://www.prri.org/research/religion-and-congregations-in-a-time-of-social-and-political-upheaval/.
[4] There are fewer than 100 American Baptist clergy who completed our survey, so their individual results in the comparative tables should be interpreted with caution.
[5] There are 21 cases of clergy who identify as nonbinary in our sample.
[6] In our survey, we asked clergy who serve in more than one church to please answer from the perspective of their primary congregation or the congregation that takes up more of their professional time.
[7] Throughout the rest of the report, we use acronyms referring to clergy denominations to ease description of results.
[8] Our 2008 Clergy Voices survey found that 56% of mainline Protestant clergy identified as or leaned Democrat while 34% identified as or leaned Republican. Our current 2022-2023 clergy survey reports party leaners with “true” independents. When asked if the leaned toward one party or another, 18% of independent clergy lean Democrat, compared to 9% who lean Republican. Two percent identify as “true” independents. If categorized in this manner, we find in our 2022-2023 survey that 67% of clergy identify as or lean Democratic while 23% identify or lean Republican. Our 2008 Clergy Voices survey also found that almost half of mainline Protestant clergy (48%) identify as liberal, 19% identify as moderate and 33% identify as conservative. See Robert P. Jones and Daniel Cox. 2009. Clergy Voices: Findings from the 2008 Mainline Protestant Clergy Voices Survey.
[9] Like other Americans, support for same-sex marriage rights has grown among mainline Protestant clergy over the past 15 years. Although the question wording and response options differ, our 2008 Clergy Voices survey found that 33 percent of mainline Protestant clergy supported allowing gay couples to marry and 32 percent supported allowing gay couples to have civil unions.
[10] Our 2022-2023 Clergy survey did not ask clergy specifically about their support for abortion’s legality, but opposition to Roe likely gives us some insight into their attitudes about abortion. For instance, we find in our Health of Mainline Congregations survey that opposition to the overturn of Roe among the American public is strongly related to attitudes about abortion. Among those Americans who oppose the overturn of Roe, 84 percent also support the legality of abortion in all or most cases.
[11] There are not enough cases of Republican clergy or conservative clergy in the other Protestant denominations to analyze for partisan or political ideology or thoughts about changing their faith tradition or denomination.
[12] Since 2019, the United Methodist Church has had more than 6,000 congregations — representing about 20% of their churches — disaffiliate over LGBTQ and theological issues, with many joining the Global Methodist Church, which opposes same-sex marriage and LGBTQ ordination and is theologically more conservative. Most of these departures have taken place in Southern and Midwestern states, especially Texas, Kentucky, Ohio, and Alabama. See https://www.churchleadership.com/wp-content/uploads/2023/08/Disaffiliating-UM-Churches-through-June-2023-report-20230801.pdf; https://to.pbs.org/45eQX3x.
[13] Our 2008 Clergy Voices survey found that 26% of mainline clergy said they often address abortion in their congregations.
[14] Although worded slightly differently, our 2008 Clergy Voices survey found that 81% of mainline clergy said they often spoke out about hunger and poverty and 61% said they often spoke out about race relations.
[15] Our 2008 Clergy Voices survey found that 43% of clergy said they spoke out often about LGBT issues.
[16] Questions about discussions of discrimination against LGTBQ+ people, hatred toward immigrants, white supremacy, and antisemitism were not asked in the PRRI 2022 Health of Congregations survey, so comparisons between mainline clergy, white mainline Protestant churchgoers, and all churchgoers are unavailable.
[17] This question was not asked in the PRRI 2022 Health of Congregations survey, so we cannot make comparisons between how well mainline clergy, white mainline Protestant churchgoers, and all churchgoers say their church is addressing antisemitism.
[18] Ibid.
[19] There are not enough cases of Republican clergy or conservative clergy in the other denominations to analyze for partisan or political ideology breaks for thoughts about changing their faith tradition or denomination.
[20] We cannot make comparisons between mainline clergy, white mainline Protestant churchgoers, and all churchgoers as this question was not asked in the PRRI 2022 Health of Congregations survey.
Survey Methodology
The survey was designed and conducted by PRRI. The survey was made possible through the generous support of the Duke Endowment. The survey was conducted among a sample of 3,066 pastors who lead congregations. Interviews were conducted online between November 2022 and May 2023.
PRRI collaborated with leaders of the Evangelical Lutheran Church in America, the Presbyterian Church (USA), American Baptist Churches USA, the Episcopal Church, the United Church of Christ, and the Christian Church (Disciples of Christ), who sent the survey to their most current list of active clergy. In all cases, surveys were conducted in English and Spanish; additionally, surveys were conducted in Korean for PCUSA clergy. PRRI was unable to secure an entire list of current United Methodist clergy from their denominational office. Working with researchers at Duke University, a sample of United Methodist clergy was compiled resulting in a primary sampling list of clergy emails for approximately two-thirds of active clergy in the denomination. Researchers at Duke compiled those emails from UMdata.org, conference journals and publications that list a directory of clergy, and the webpages of the 54 denominational conferences; the Duke Divinity School also maintains a database of clergy in North Carolina, which was used an additional source.
The combined data were weighted to adjust for age, gender, race/ethnicity, Census region, congregation size, and denomination. The demographic benchmarks including congregation size came from combined 2012 and 2018 National Congregations Study (NCS); the benchmarks for the denomination distribution came from the 2020 US Census of Religion by the Association of Religion Data Archive (ARDA). To generate the benchmarks from the NCS, the file was filtered by survey year and limited to congregation leaders from one of the seven denominations of interest for this study. Denomination benchmarks reflect the distribution of congregations among the seven mainline Protestant denominations of interest for this study. A beginning weight equal to 1 was adjusted to the population benchmarks using iterative proportional fitting (raking).
The weights were trimmed and scaled to sum to the unweighted sample size (n=3,006, wt_final). Specifically, the weights were trimmed at 0.6% and 99.11%. The margin of error is +/-2.3 percentage points and the design effect was equal to 1.88. Surveys may also be subject to error or bias due to question wording, context, and order effects. See Appendix.
