South Carolina’s Religious Landscape, 2007 vs. 2015
The Declining Proportions of White Christians in South Carolina
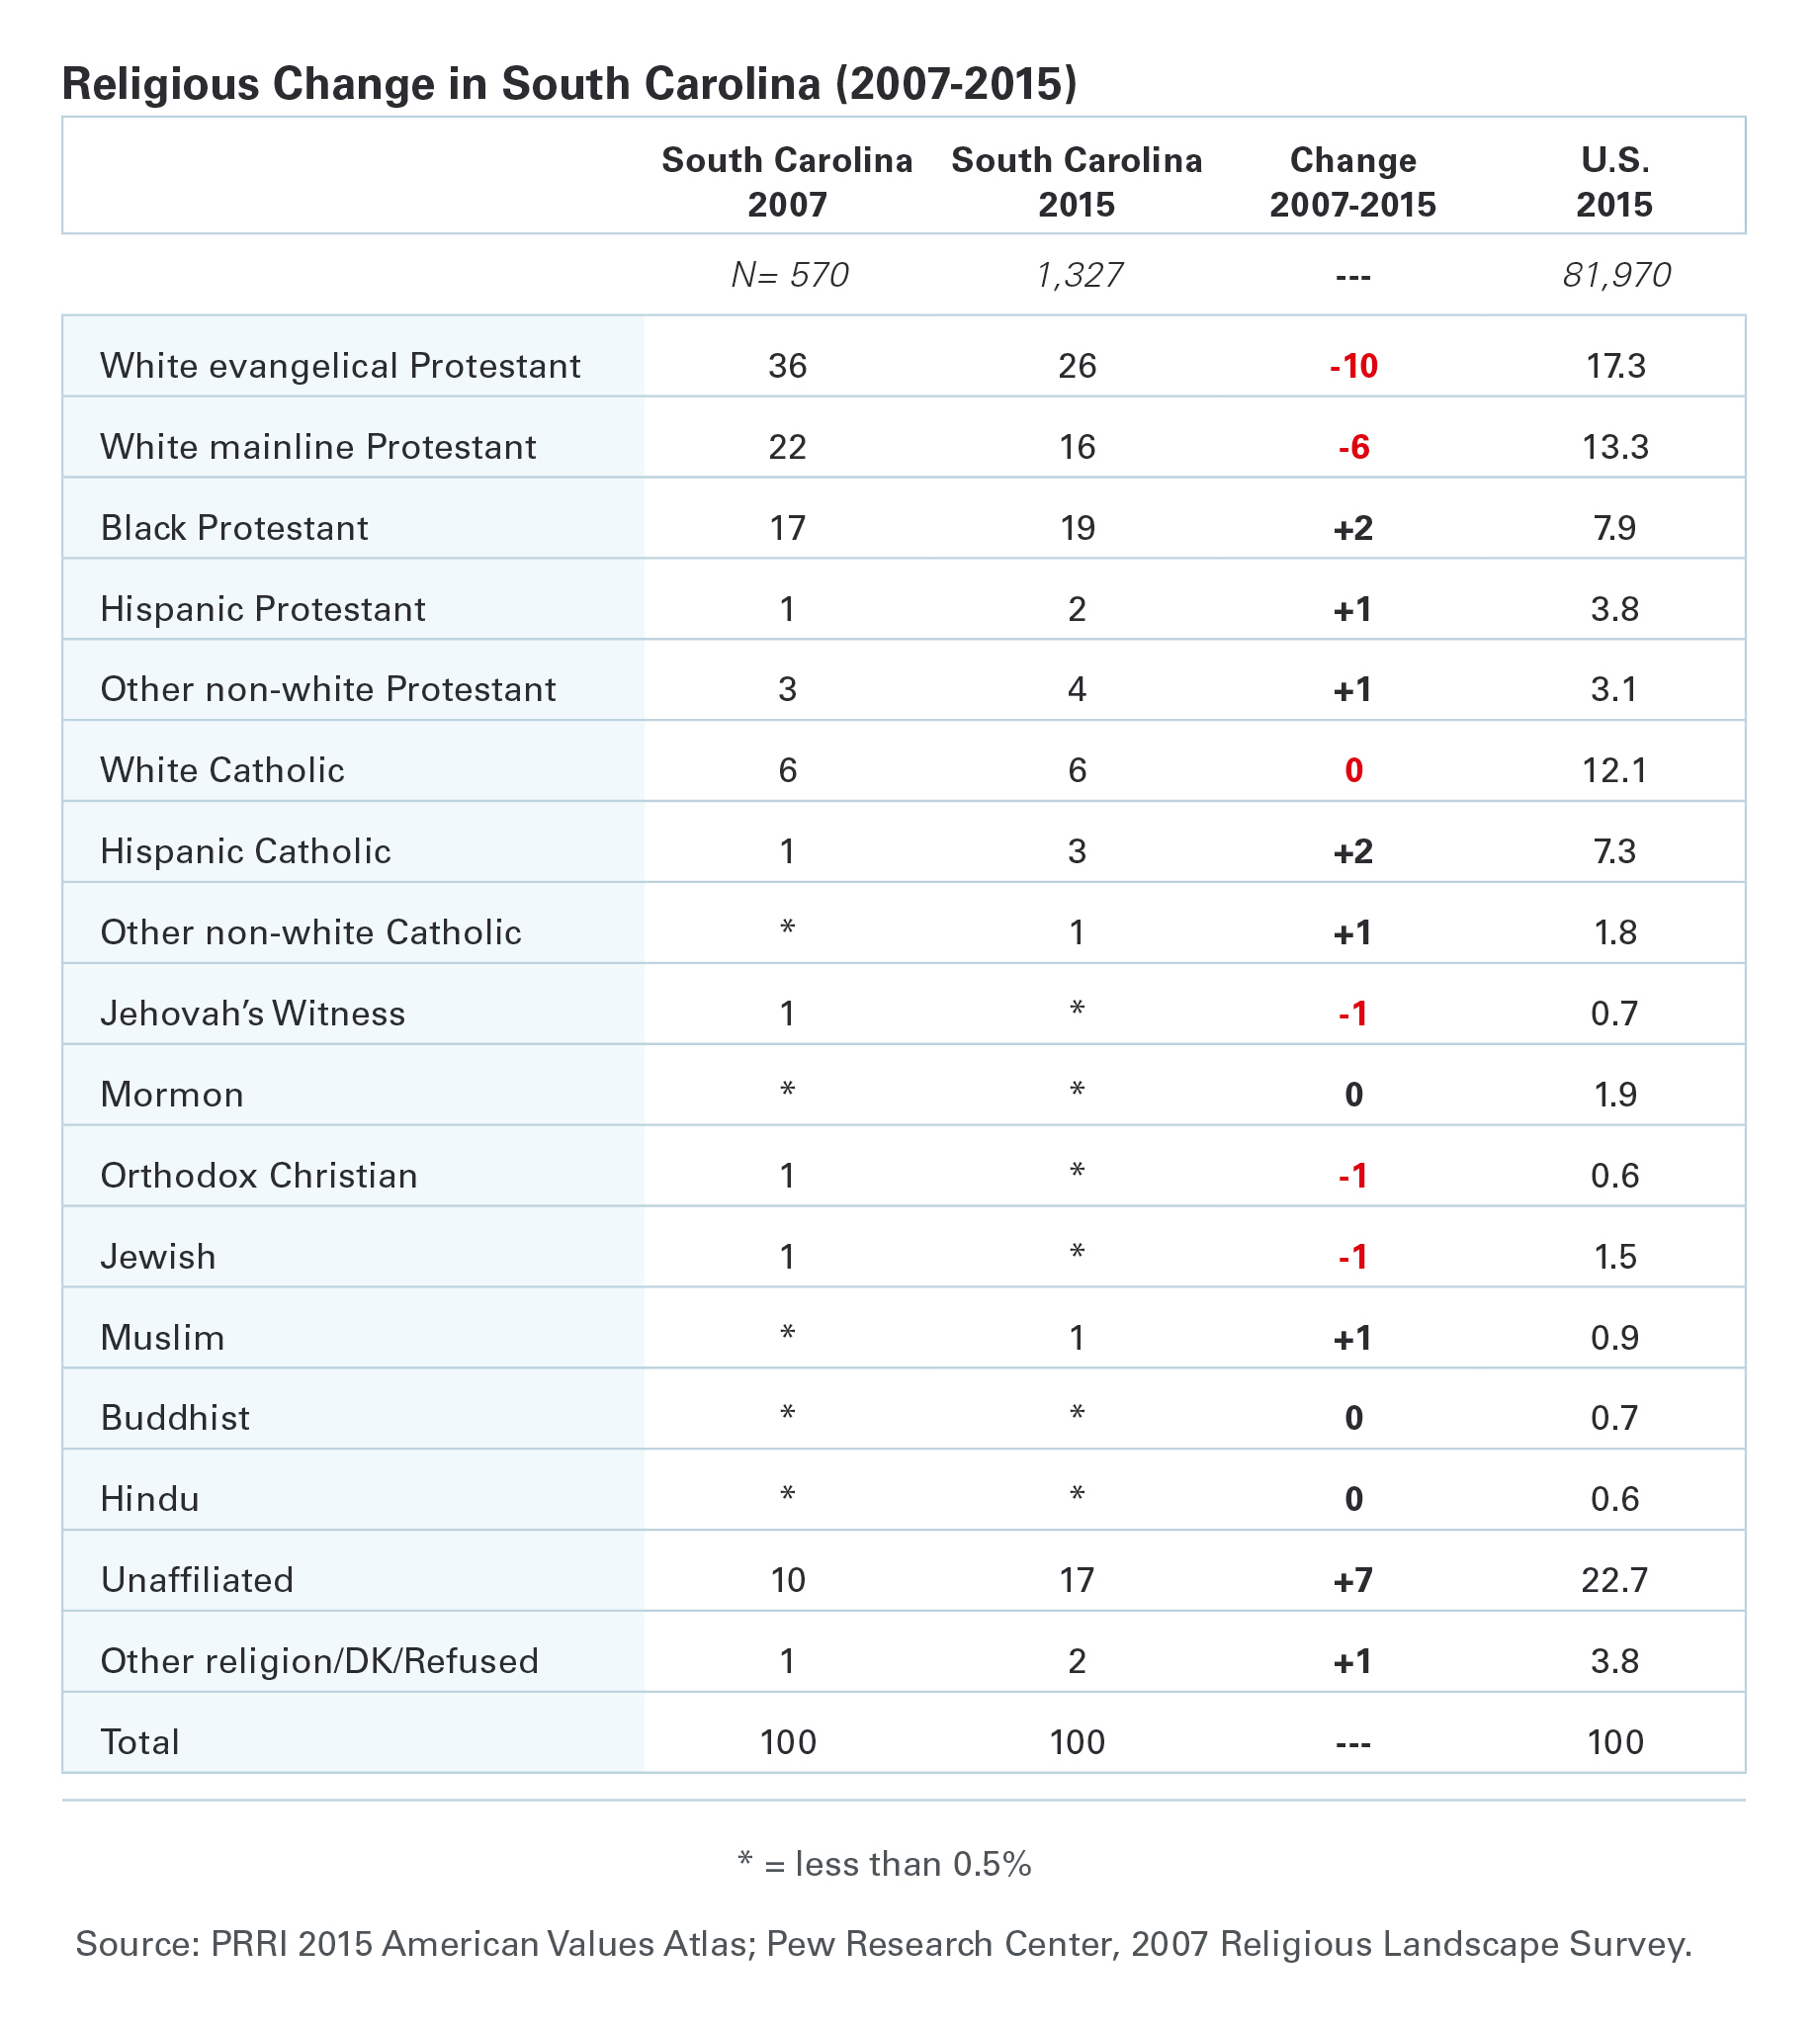
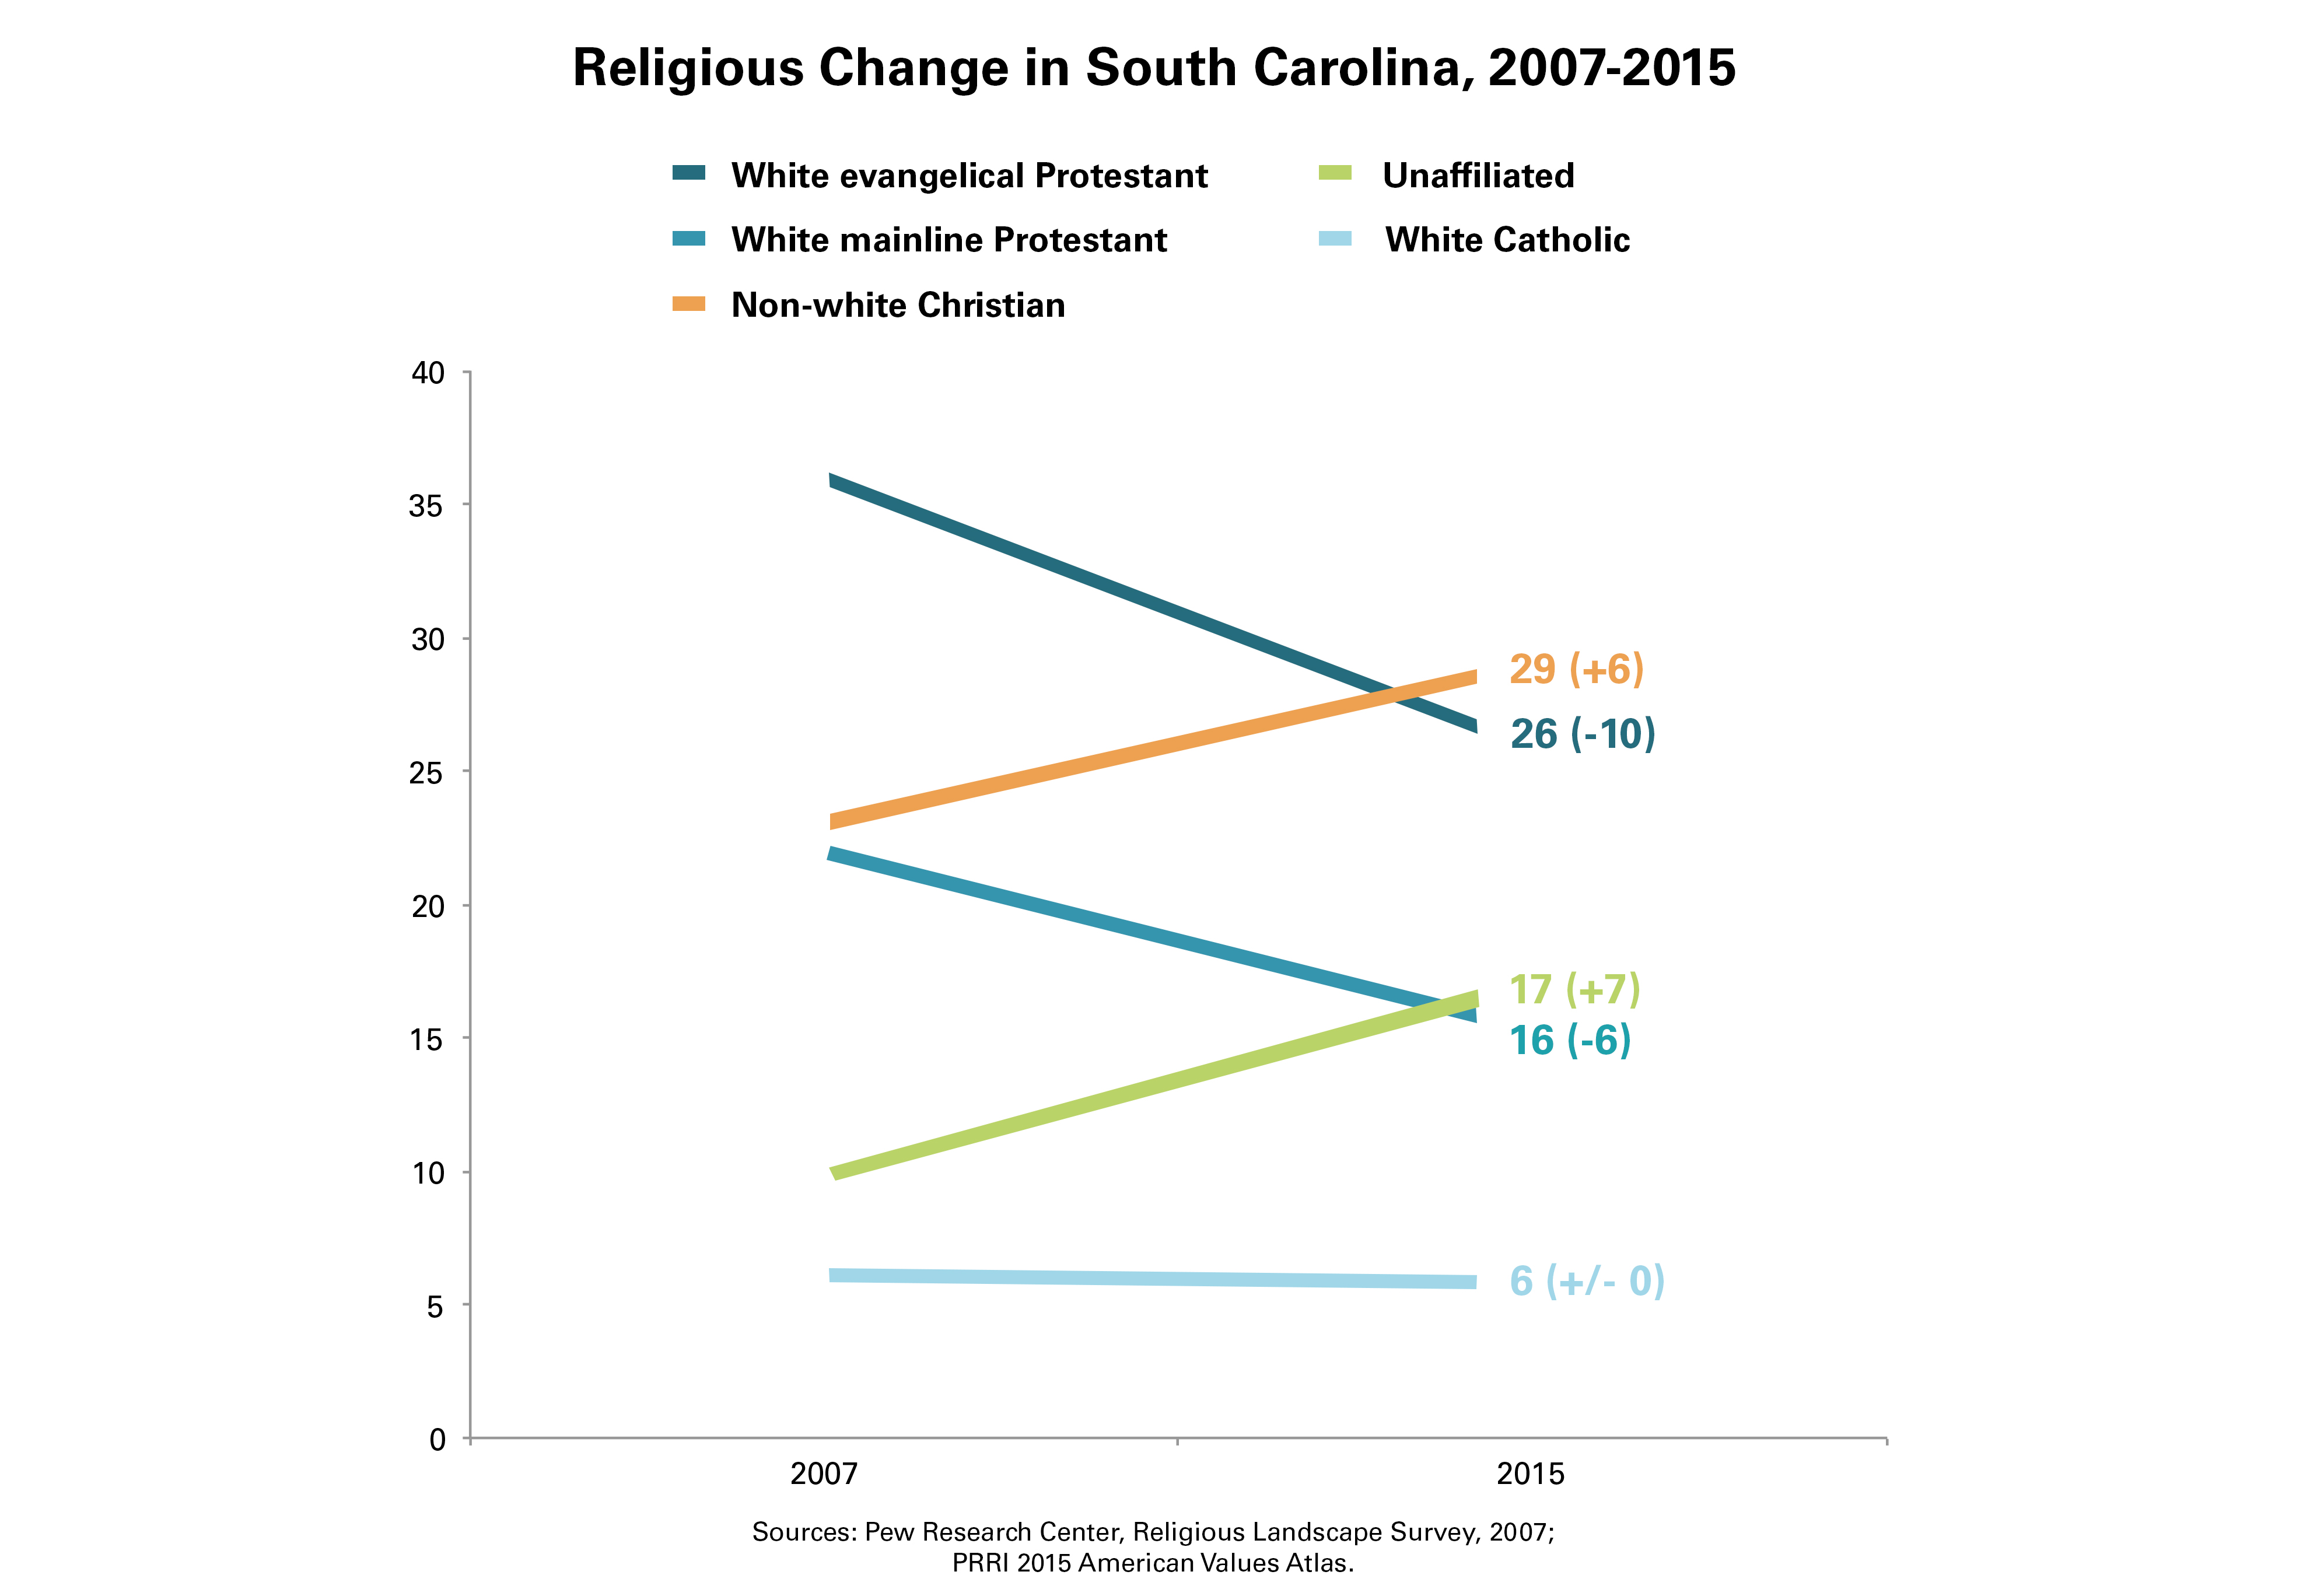
The religious landscape in South Carolina has changed substantially since 2007. The percentage of South Carolinians who identify as white and Christian has dropped 16 percentage points in the past eight years, with white evangelical Protestants experiencing the largest decline. About one-quarter (26%) of South Carolina residents identify as white evangelical Protestant today, compared to 36% in 2007. Additionally, fewer South Carolinians identify as white mainline Protestant compared to 2007 (16% vs. 22%, respectively). The percentage of white Catholics in the state has remained steady (6%).
At the same time, the number of South Carolinians identifying as religiously unaffiliated has grown considerably. Nearly one in five (17%) South Carolinians now identify as religiously unaffiliated, up seven percentage points from just 10% in 2007. There has also been a six percentage-point increase in the non-white Christian population in South Carolina, from 23% in 2007 to 29% today.
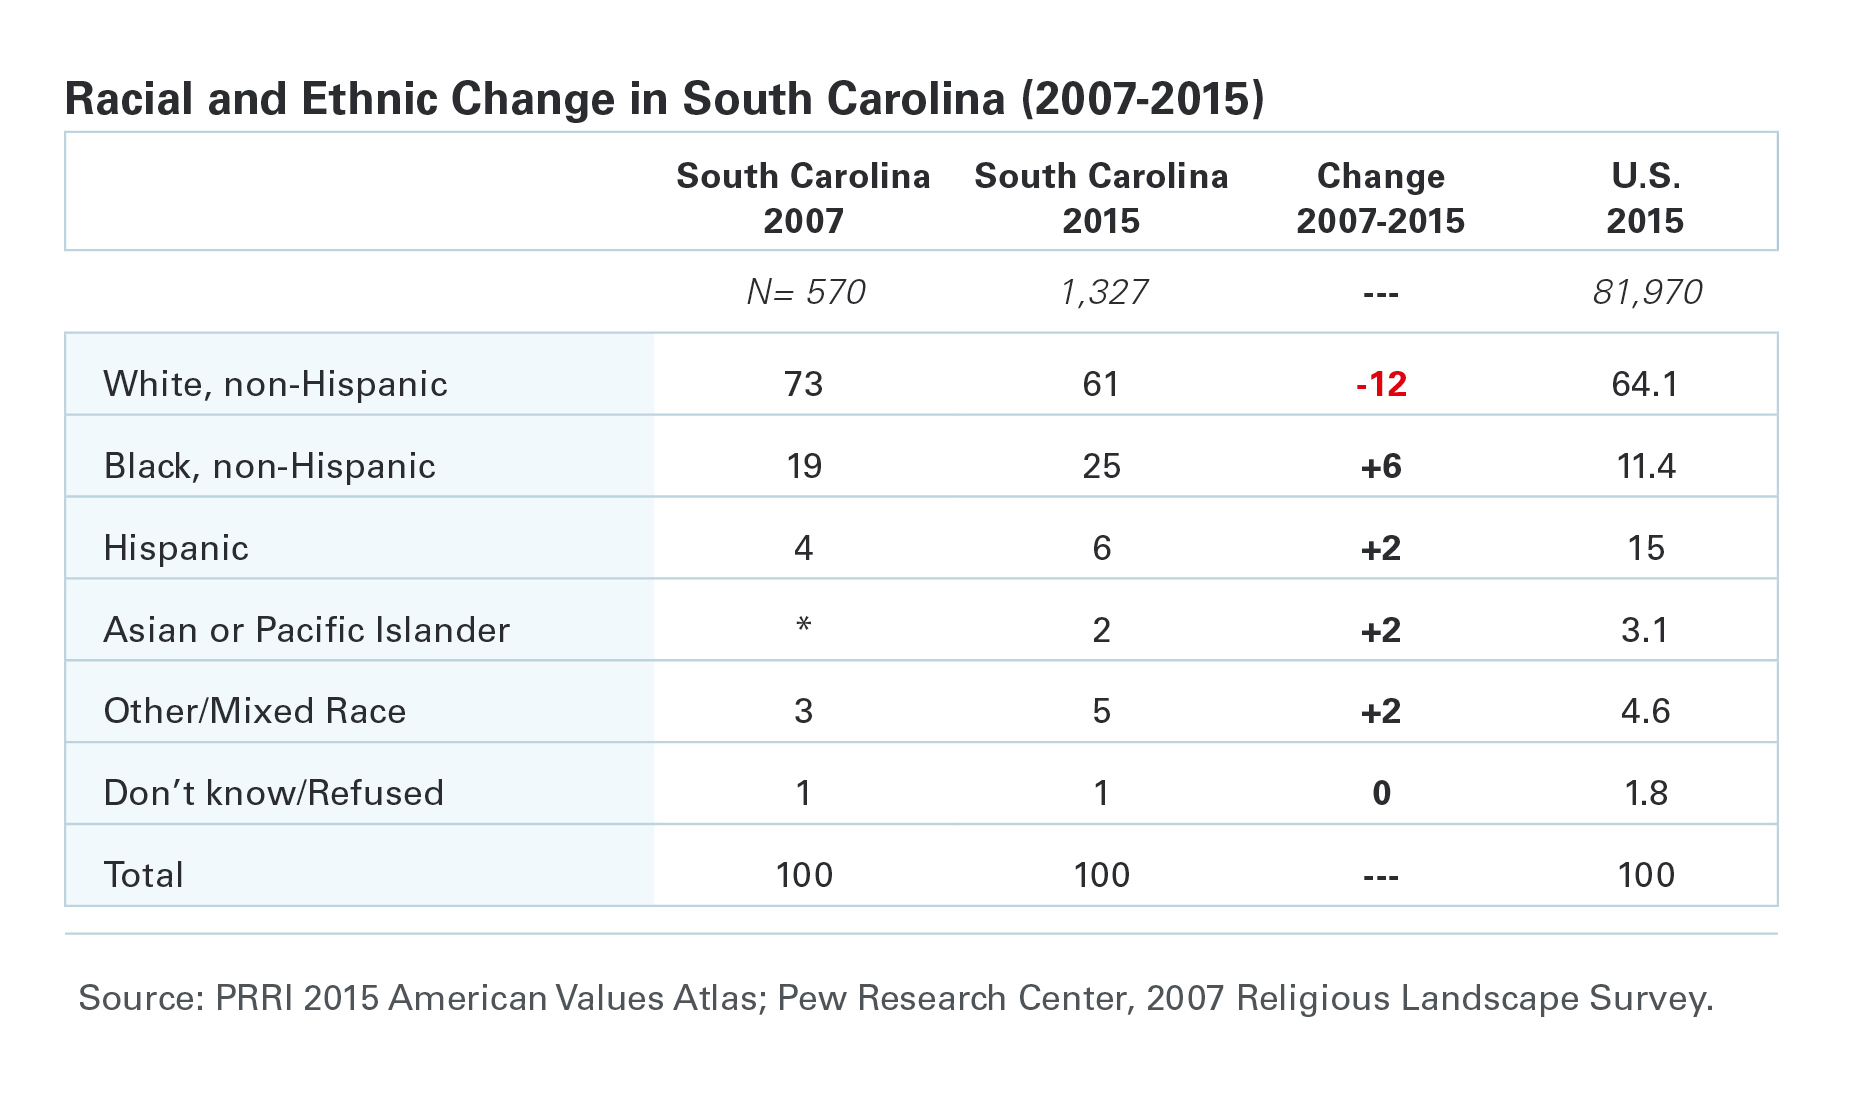
The shifts in the South Carolina religious landscape are being driven in part by the shifting racial and ethnic landscape in the state. The percentage of white residents in the state has dropped 12 percentage points, from 73% in 2007 to 61%today. Simultaneously, the percentage of non-white South Carolinians has risen, including black (from 19% in 2007 to 25% today) and Hispanic residents (from 4% in 2007 to 6% today).
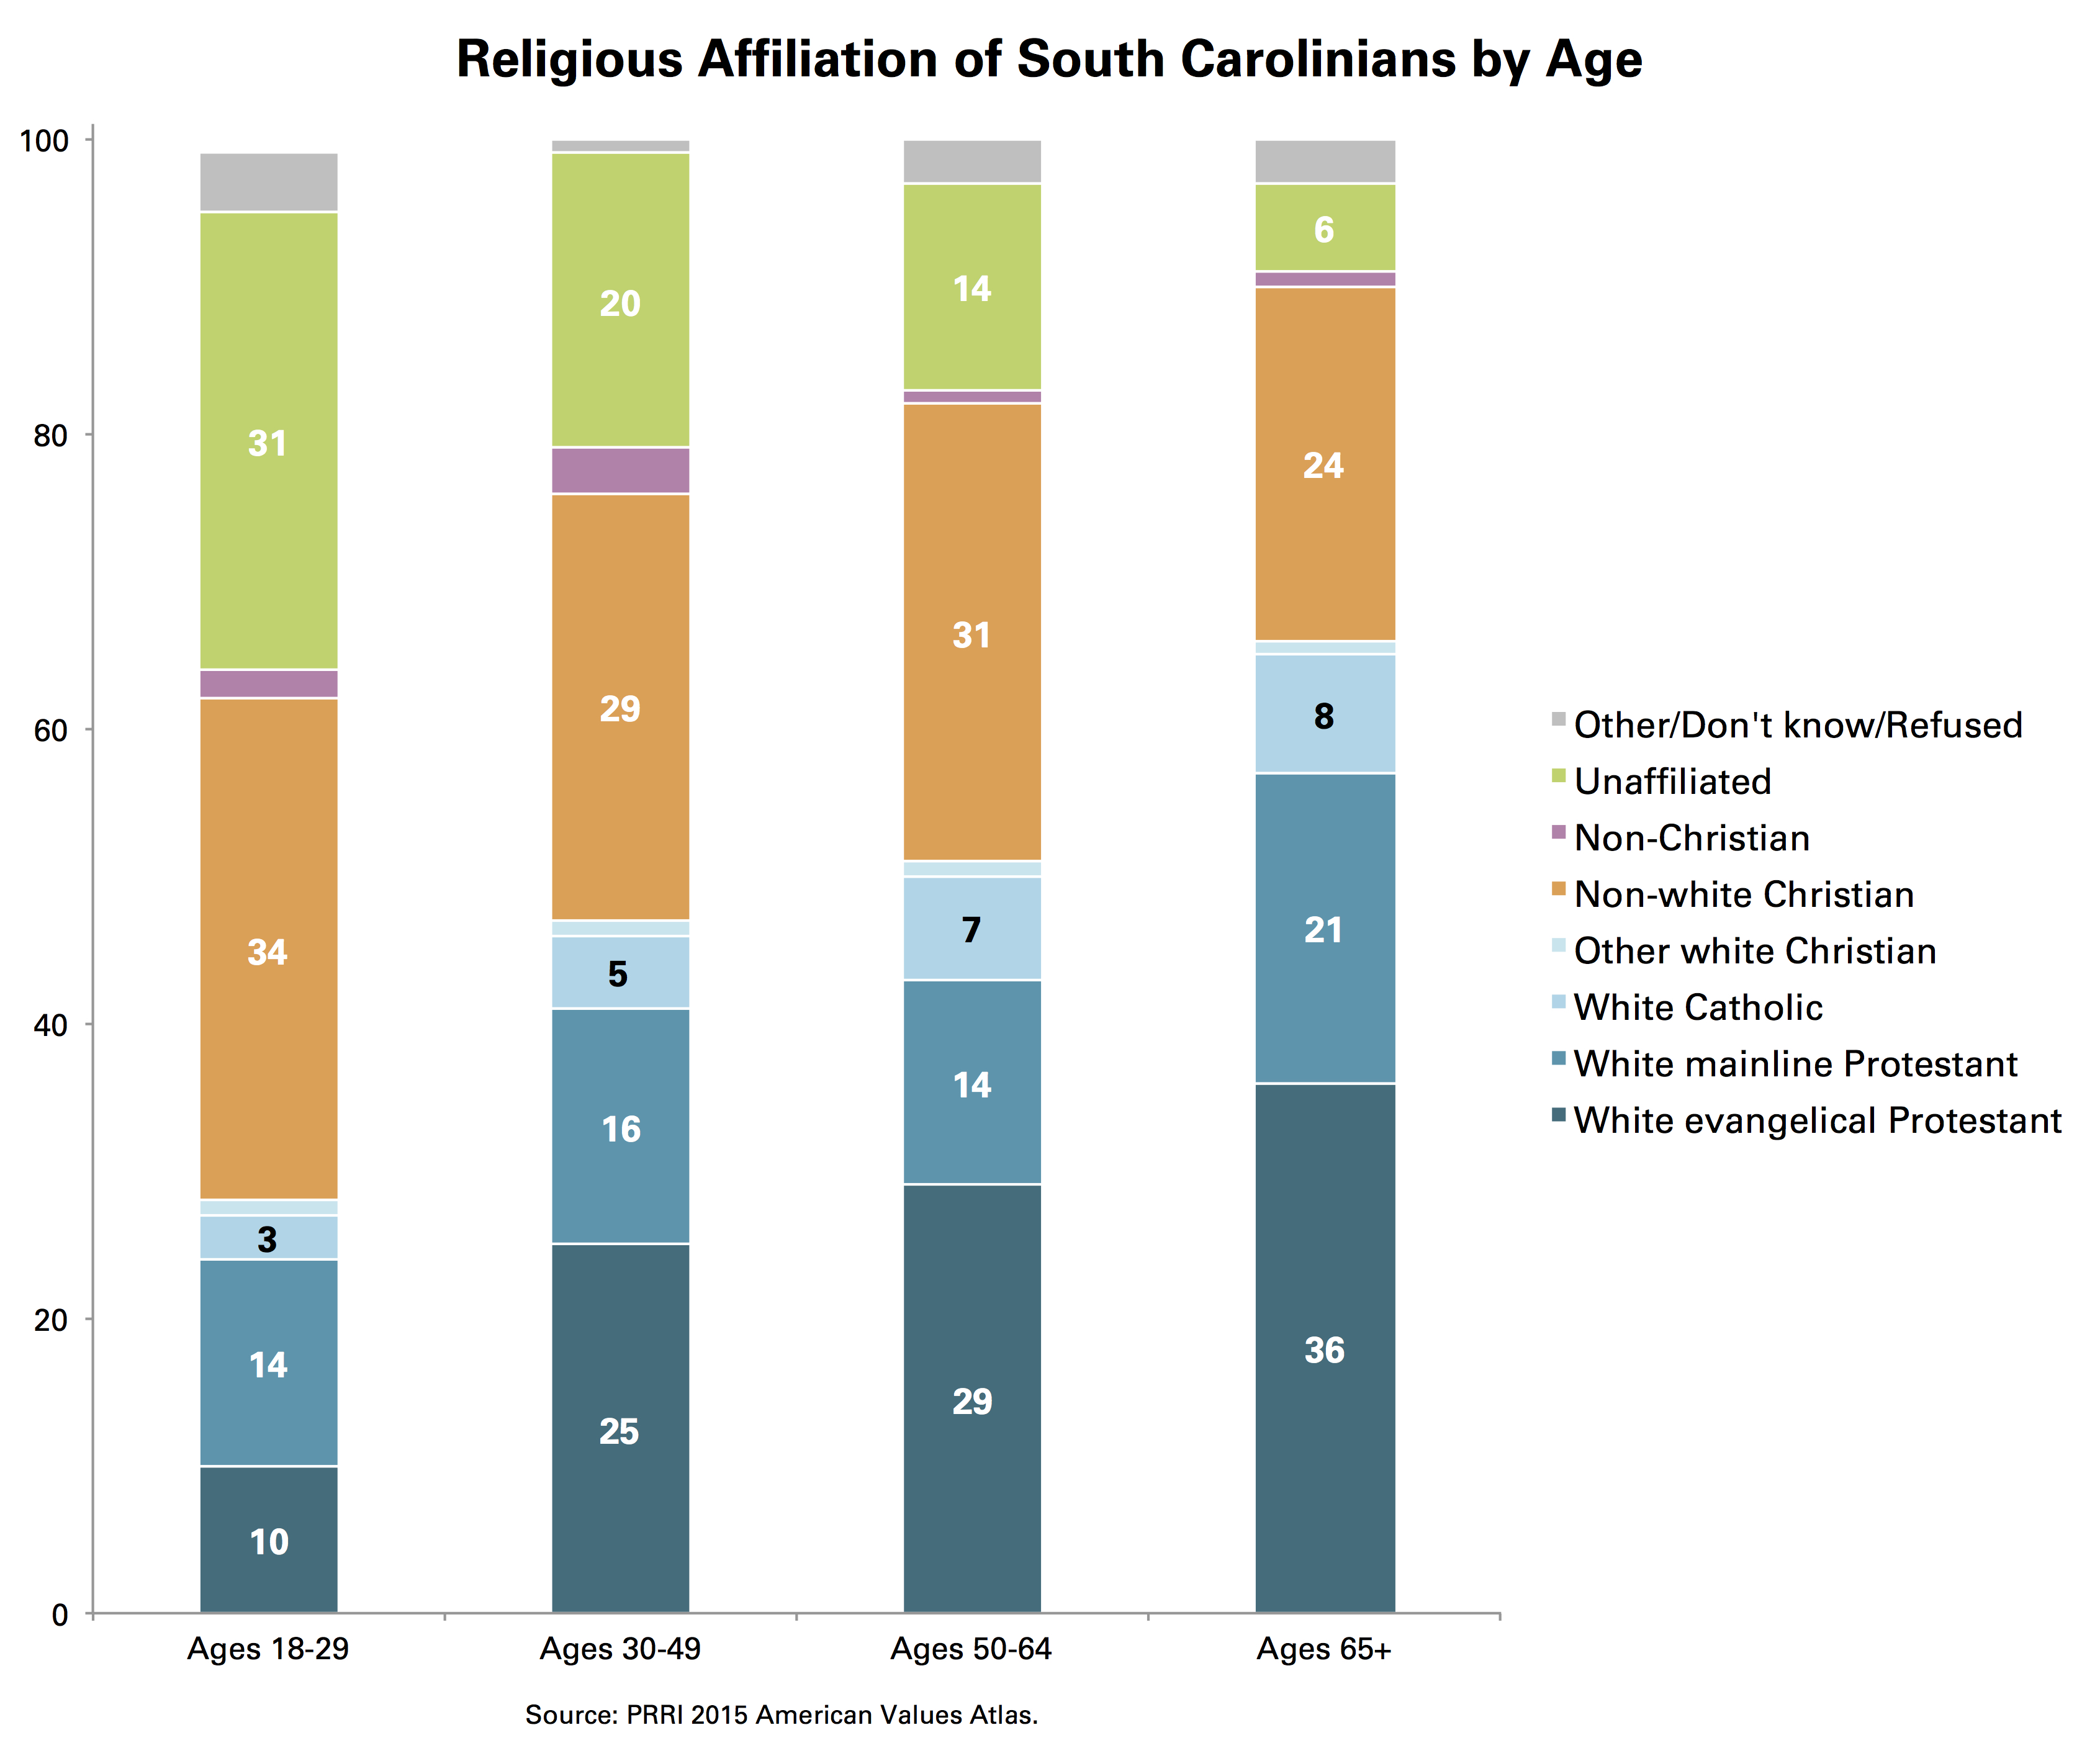
Religion and Generational Change in South Carolina
Generational differences in religious affiliation provide strong evidence that the decline in the proportion of white Christians in South Carolina is likely to continue. Fewer than three in ten young adults (age 18 to 29) in South Carolina identify as both white and Christian, including white evangelical Protestant (10%), white mainline Protestant (14%), and white Catholic (3%). In contrast, approximately two-thirds of South Carolina seniors (age 65 and older) identify as white and Christian, including 36% white evangelical Protestant, 21% white mainline Protestant, and 8% white Catholic. Young adults in South Carolina are also substantially more likely than seniors to identify as either religiously unaffiliated (31% vs. 6%, respectively) or non-white Christians (34% vs. 24%, respectively).
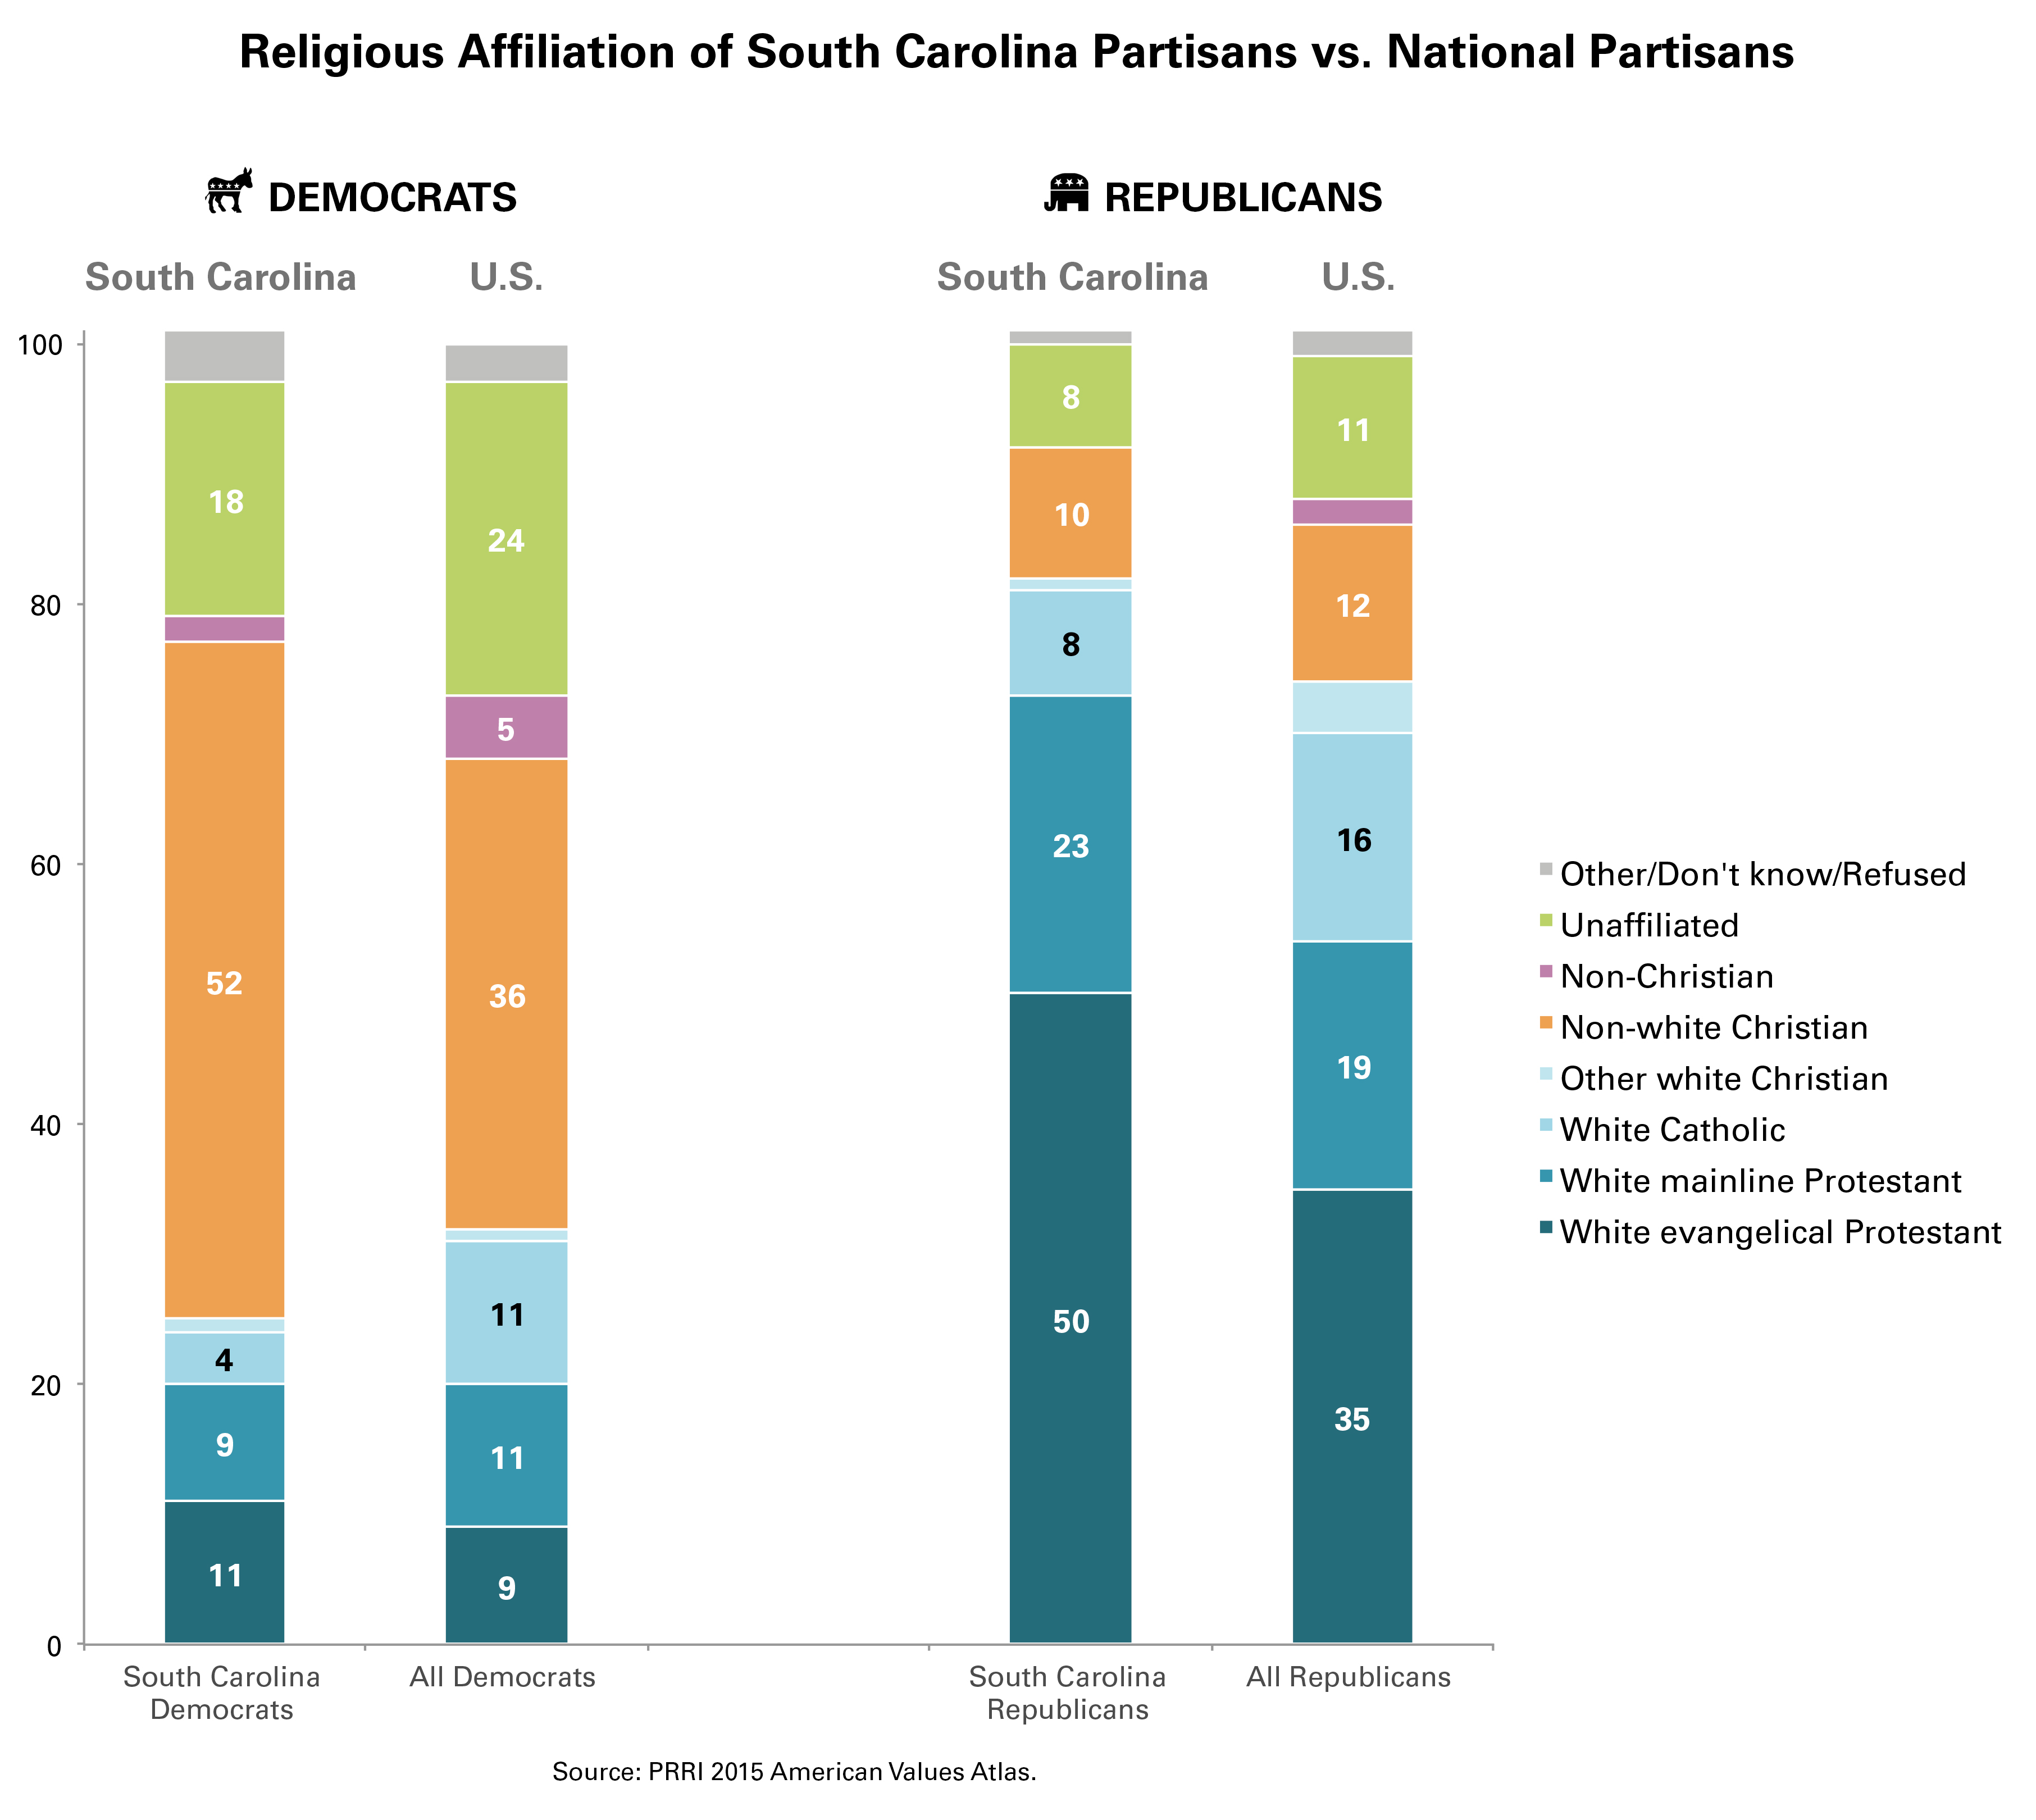
Religion and the Political Parties
Though the percentage of white Christians in South Carolina has declined since 2007, a sizeable majority of South Carolina Republicans continue to identify as both white and Christian. In fact, Republicans in South Carolina are more likely than Republicans overall to identify as white Christians. More than eight in ten (81%) South Carolina Republicans are white Christians, including half (50%) who identify as white evangelical Protestant. A slightly smaller percentage (73%) of national Republicans identify as white and Christian, including 35% who are white evangelical Protestant.
South Carolina Democrats, by contrast, are slightly less likely than their national counterparts to identify as white Christians. About one-quarter (24%) of South Carolina Democrats identify as both white and Christian, compared to 32% of Democrats overall. The largest difference between South Carolina Democrats and national Democrats is in the percentage who identify as non-white and Christian—a majority (52%) of South Carolina Democrats identify as non-white Christians, compared to 36% of Democrats overall.
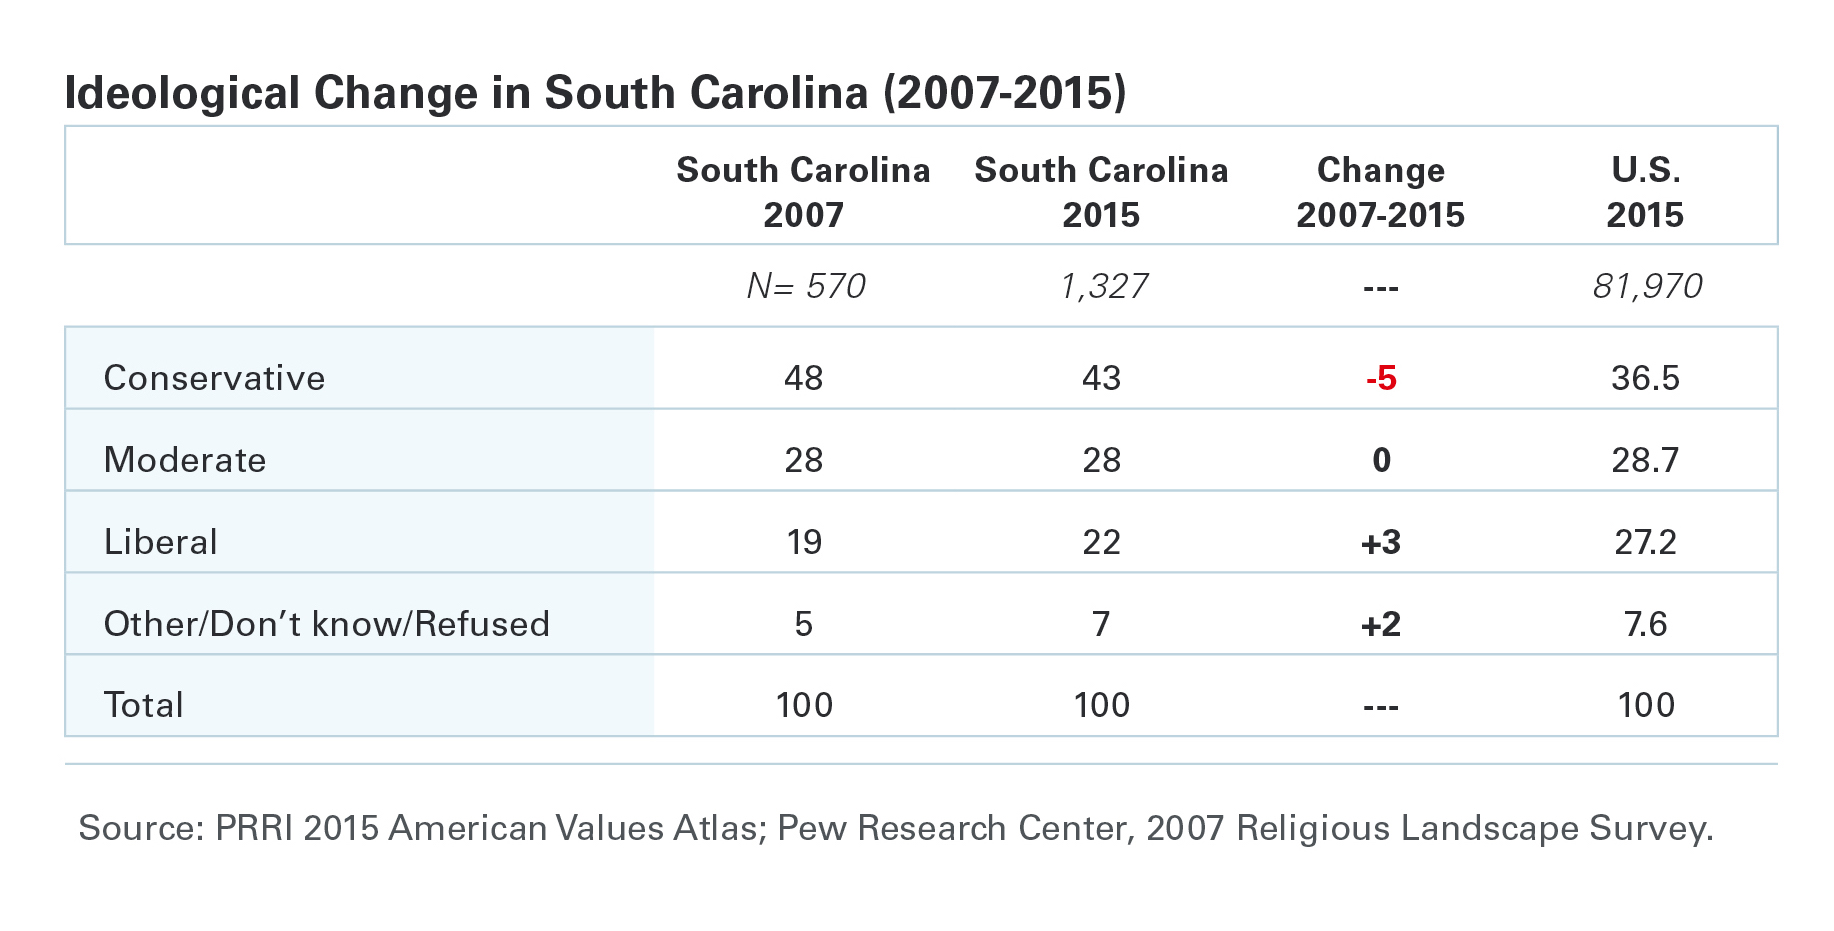
Political and Ideological Change in South Carolina, 2007 vs. 2015
Over the past eight years, South Carolina has seen a slight shift in party affiliation. Consistent with national trends, the percentage of South Carolinians identifying as politically independent has increased, from 29% in 2007 to 37% today. Additionally, the percentage of South Carolina residents who identify as Republicans has dropped slightly, from 31% in 2007 to 25% today.

The political ideology of South Carolina residents has remained fairly stable since 2007. Currently, more than four in ten (43%) South Carolinians identify as conservative, while nearly three in ten (28%) identify as moderate, and fewer than one-quarter (22%) identify as liberal.
Partisans in South Carolina tend to be more conservative than their counterparts nationwide. Nearly three-quarters (73%) of South Carolina Republicans identify as conservative, compared to 68% of Republicans nationwide. Similarly, 36% of South Carolina Democrats identify as liberal, compared to 46% of Democrats nationwide.