Executive Summary
Public Anxiety: Threat of Terrorism, Crime, and Unemployment
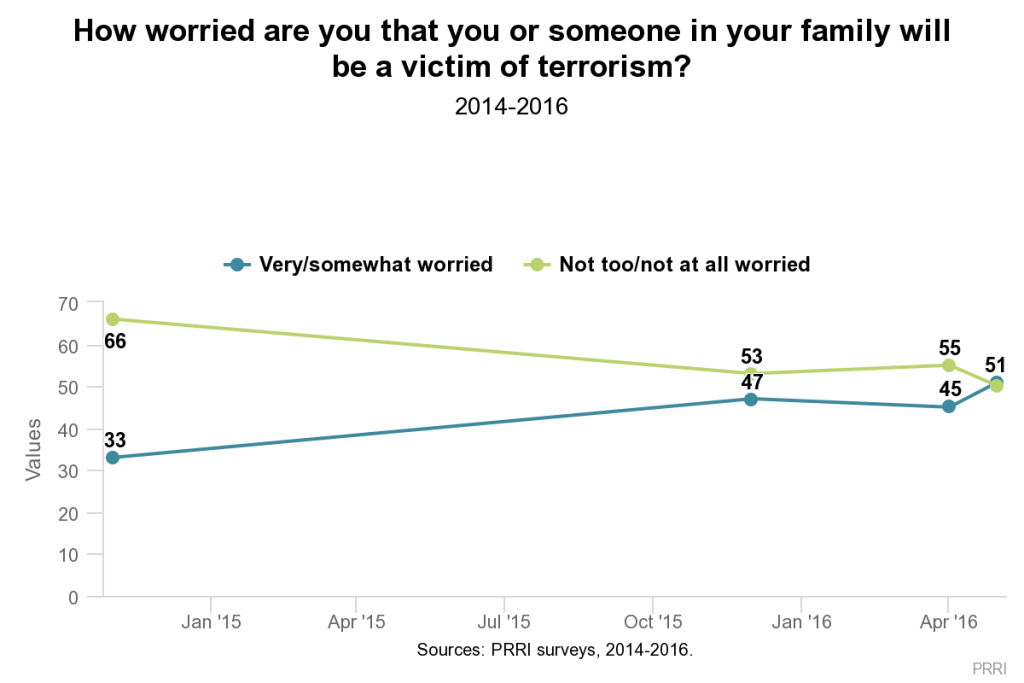
 Today, a slim majority (51%) of Americans report feeling somewhat or very worried that they or a member of their family will become a victim of terrorism. Concerns have increased 18 percentage points since late 2014, when one-third (33%) of Americans said they were at least somewhat worried about being a victim of terrorism.
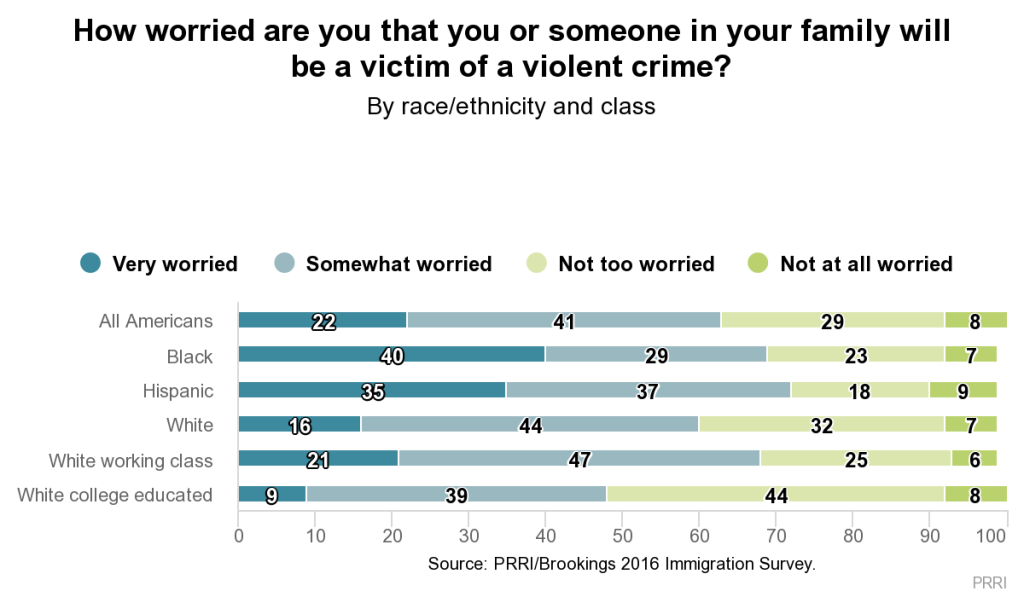
More than six in ten (63%) Americans also report being at least somewhat worried that they or a family member will be a victim of violent crime.
On the economic front, roughly two-thirds (65%) of Americans are at least somewhat worried that they or a family member will become unemployed. Seven in ten (70%) Americans continue to believe the U.S. is still in an economic recession, while about three in ten (29%) disagree. These views have remained remarkably stable since 2012.
Concerns about Cultural Change, Discrimination Against Whites, and Islam
The general public is evenly divided over whether American culture and way of life has mostly changed for the better (49%) or changed for the worse (50%) since the 1950s.
- White working-class Americans (62%) and white evangelical Protestants (70%) are among the most likely to believe that American culture and the American way of life has changed for the worse since the 1950s.
- More than two-thirds of Republicans (68%) and Donald Trump supporters (68%)—Republican and Republican-leaning independents who supported Trump during the primary—believe the American way of life has changed for the worse since the 1950s, while roughly the same number of Democrats (66%) say things have improved. Independents closely mirror the general public.
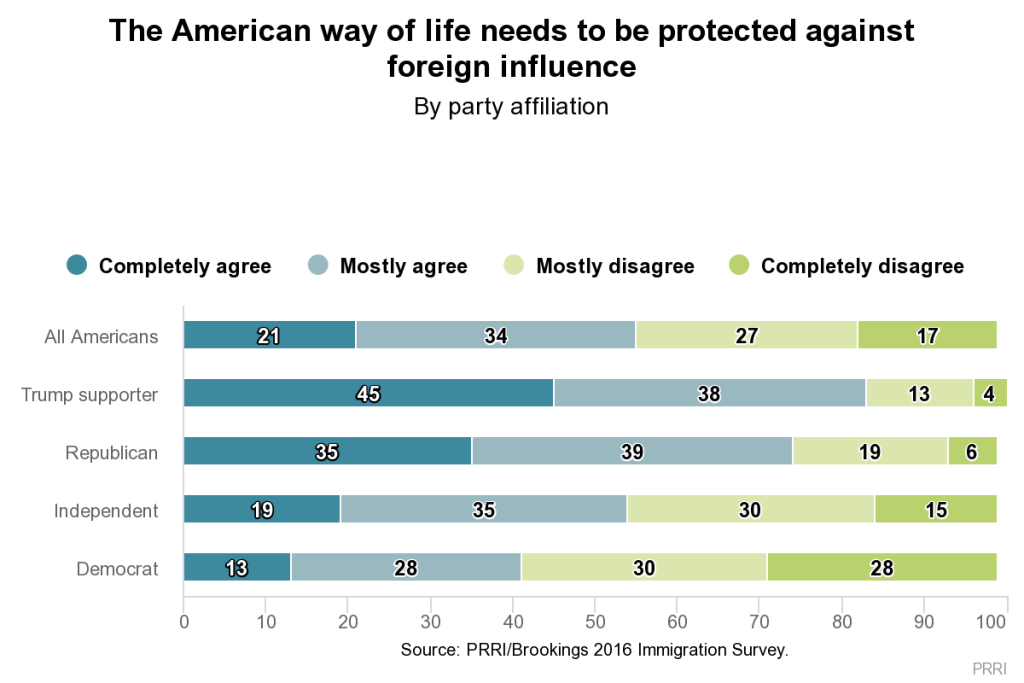
A majority (55%) of Americans believe that the American way of life needs to be protected against foreign influence, while more than four in ten (44%) disagree.
- Nearly three-quarters (74%) of Republicans and about eight in ten (83%) Trump supporters agree that the foreign influence over the American way of life needs to be curtailed, compared to approximately four in ten (41%) Democrats. Political independents’ attitudes mirror those of Americans overall.
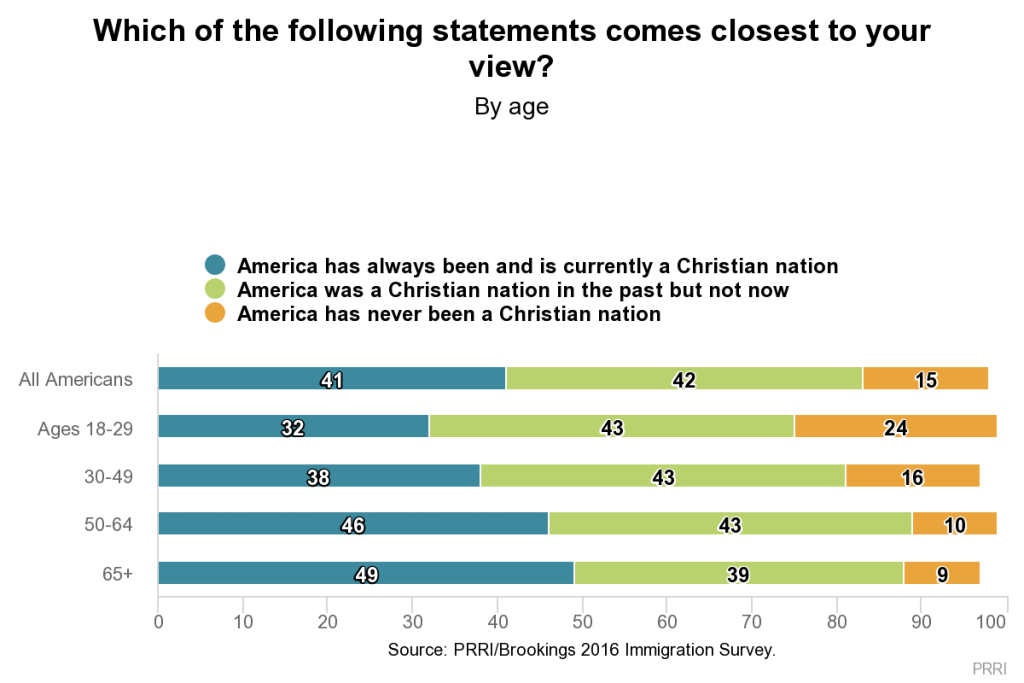
Fewer than half (41%) of the public believes the U.S. has always been and is currently a Christian nation, while a nearly identical number (42%) say America was a Christian nation in the past but is not now. Fifteen percent of Americans say America has never been a Christian nation.
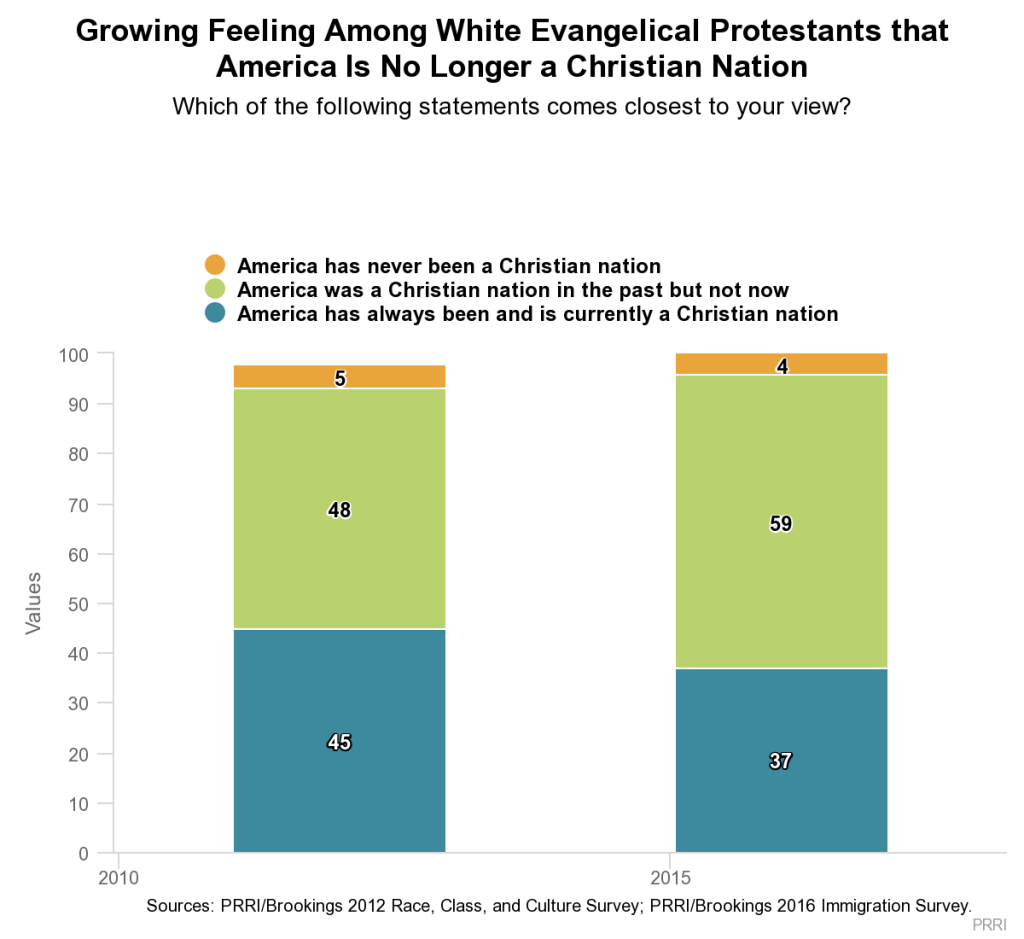
- Over the last four years, the proportion of white evangelical Protestants who believe that the U.S. is no longer a Christian nation has increased 11 percentage points, from 48% in 2012 to 59% today.
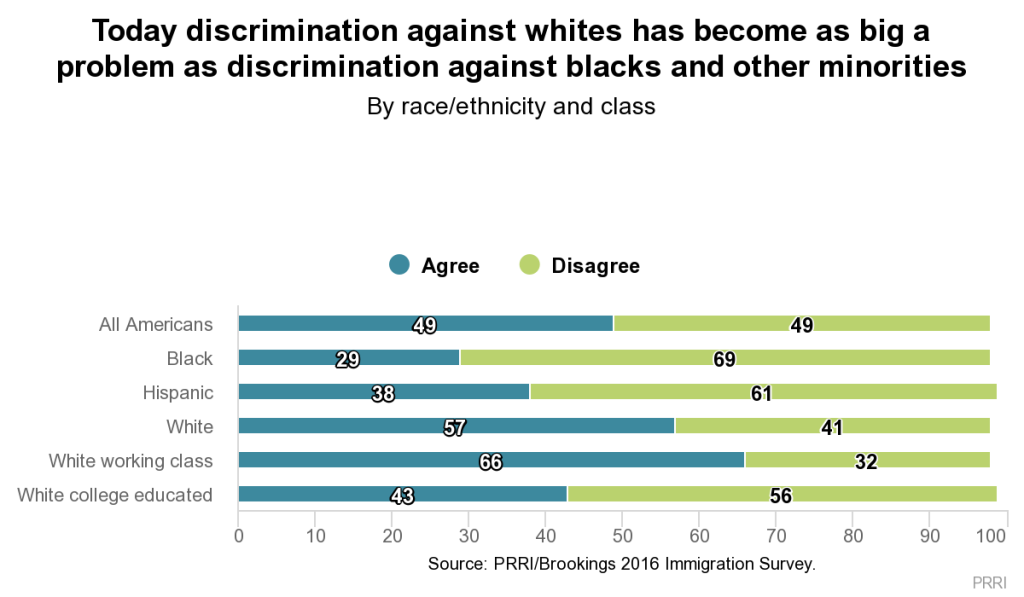
Americans are evenly divided about the extent to which they believe discrimination against whites, or so-called “reverse discrimination,” is as big a problem as discrimination against blacks and other minorities (49% agree, 49% disagree).
- Approximately six in ten (57%) white Americans and roughly two-thirds (66%) of white working-class Americans agree that discrimination against whites is as big a problem today as discrimination against blacks and other minorities, an opinion shared by fewer than four in ten (38%) Hispanic Americans and fewer than three in ten (29%) black Americans.
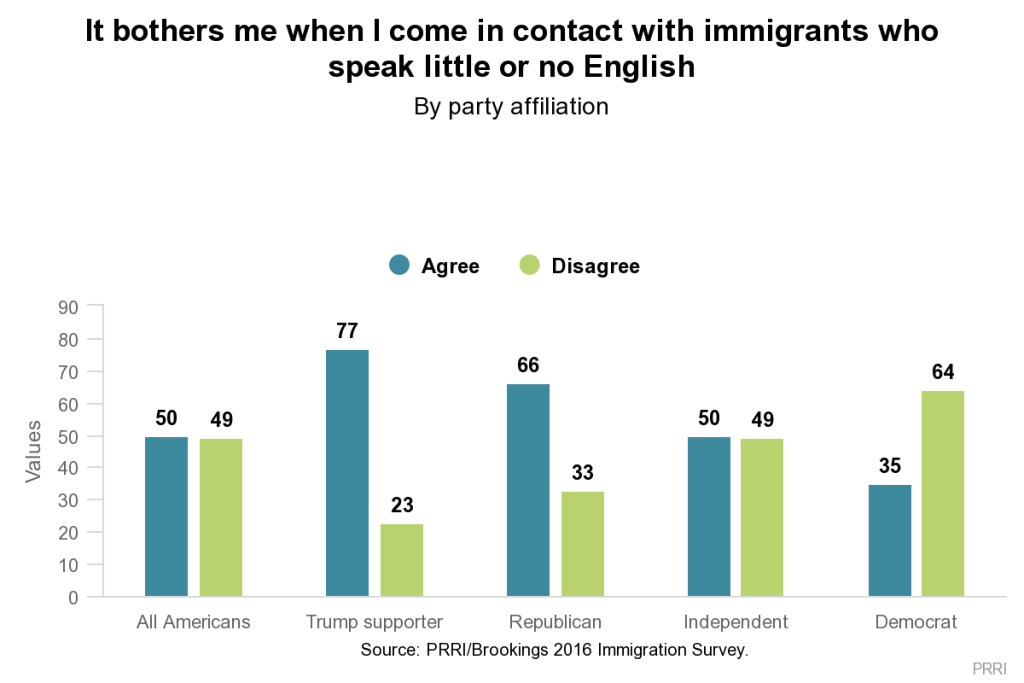
Americans are also split over how comfortable they feel around immigrants who do not speak English: half (50%) say that they are bothered when they come in contact with immigrants who speak little or no English, while nearly as many (49%) say this would not bother them.
- Nearly six in ten (58%) white Americans say they are not comfortable being around immigrants who speak little or no English, compared to four in ten (40%) black Americans and under one-quarter (22%) of Hispanic Americans.
- Roughly two-thirds (66%) of Republicans and 77% of Trump supporters express discomfort when coming into contact with immigrants who do not speak English, while nearly two-thirds (64%) of Democrats say this does not bother them.
- Nearly six in ten (58%) seniors (age 65 and older) say they are bothered coming into contact with immigrants who speak little or no English, compared to fewer than four in ten (37%) young adults (age 18-29).
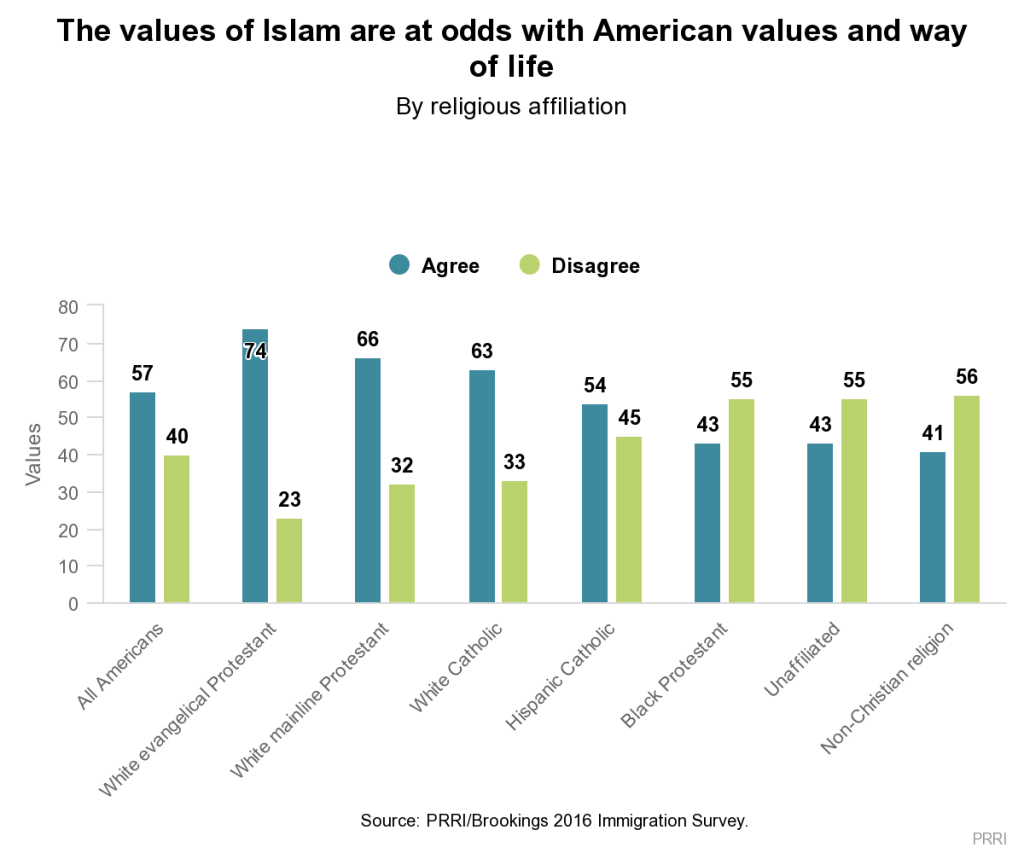
Nearly six in ten (57%) Americans say the values of Islam are at odds with American values and way of life, while four in ten (40%) Americans disagree.
- Approximately eight in ten Republicans (79%) and Trump supporters (83%) believe the values of Islam are at odds with the American way of life. This view is shared by a majority (54%) of independents and less than half (42%) of Democrats. A majority (55%) of Democrats say Islam does not conflict with American values.
Authoritarianism and a Leader Willing to Break the Rules
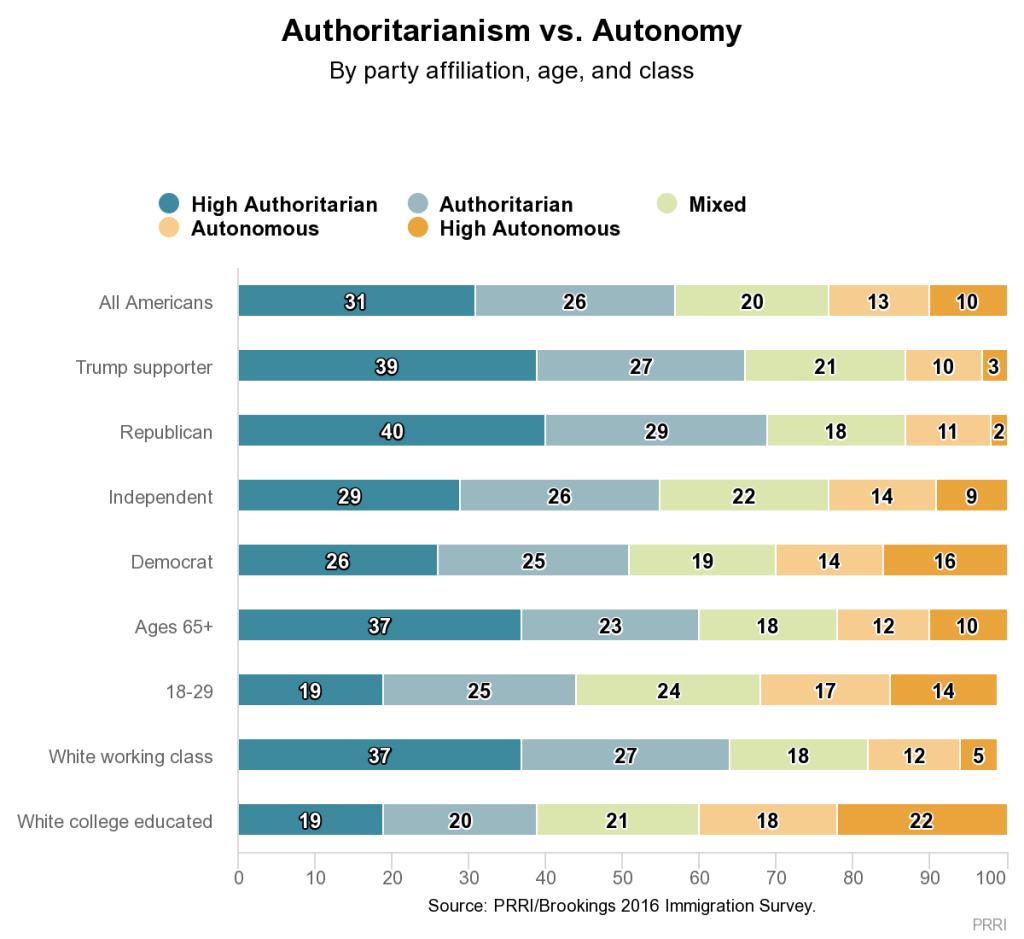
The survey adapted a battery of questions from the American National Election Study (ANES) that were designed to measure authoritarian disposition. According to this scale, approximately six in ten Americans have a moderately authoritarian (26%) or highly authoritarian (31%) orientation.
- Nearly seven in ten (69%) Republicans have an authoritarian orientation, including four in ten (40%) who register as highly authoritarian. Political independents and Democrats are less likely to have an authoritarian orientation (55% and 51%, respectively). Notably, Trump supporters (66%) are not any more likely than Republicans overall to hold an authoritarian orientation.
- A majority (54%) of white Americans have an authoritarian orientation, although there are substantial differences by class. Nearly two-thirds (64%) of white working-class Americans have an authoritarian orientation, compared to fewer than four in ten (39%) white college-educated Americans.
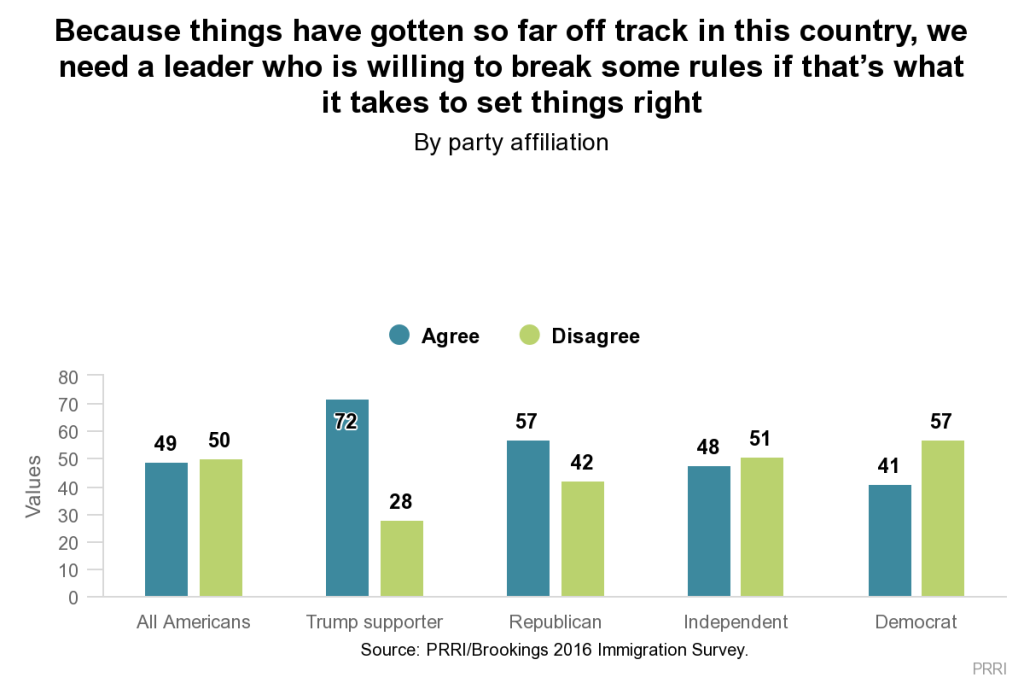
Americans are evenly split over whether or not America has gone so far off track that we need a leader willing to break some rules if that’s what it takes to set things right (49% agree, 50% disagree).
- Republicans (57%), and Trump supporters (72%) in particular, are more likely than either political independents (48%) or Democrats (41%) to believe that America needs a leader willing to break the rules.
- Most notably, Americans who have a highly authoritarian orientation are more than twice as likely as those who have a highly autonomous orientation to say the country needs a leader who is willing to break the rules to set things right (58% vs. 22%, respectively).
The Immigration System and Immigration Policy
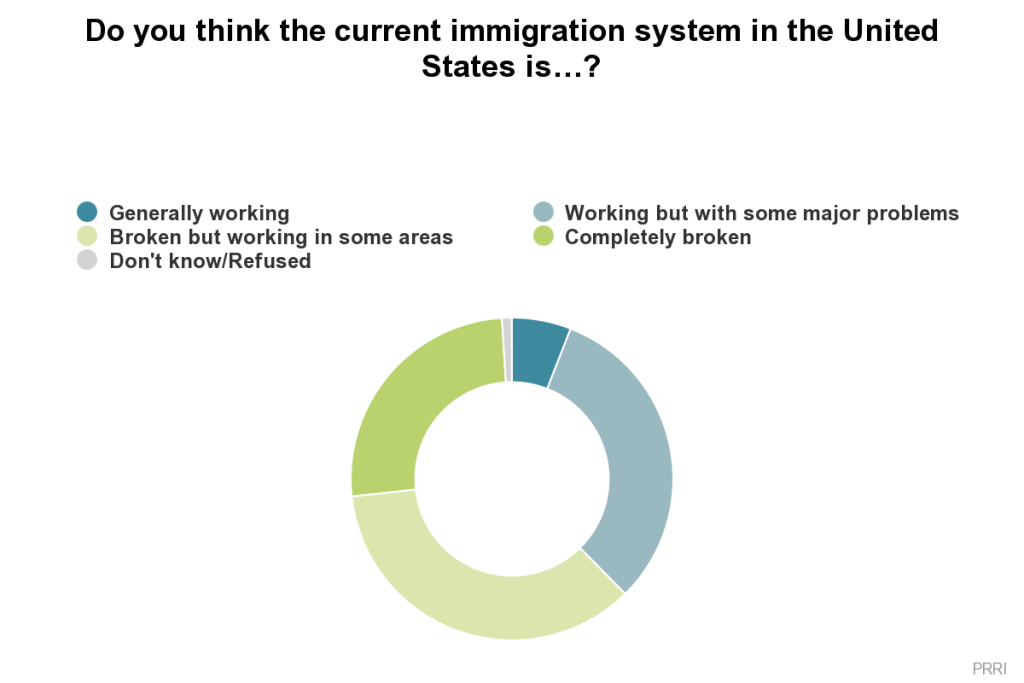
Fewer than four in ten Americans say the current immigration system in the United States is generally working (6%) or working but with some major problems (32%), while more than six in ten say the immigration system is broken but working in some areas (36%) or completely broken (26%).
Few Americans know that the deportation rate of illegal immigrants has increased in recent years. Only 25% of Americans believe that the number of illegal immigrants being deported over the past five or six years has increased. About half (46%) of the public believe the number of illegal immigrants being deported has stayed about the same, and 26% believe deportations have decreased.
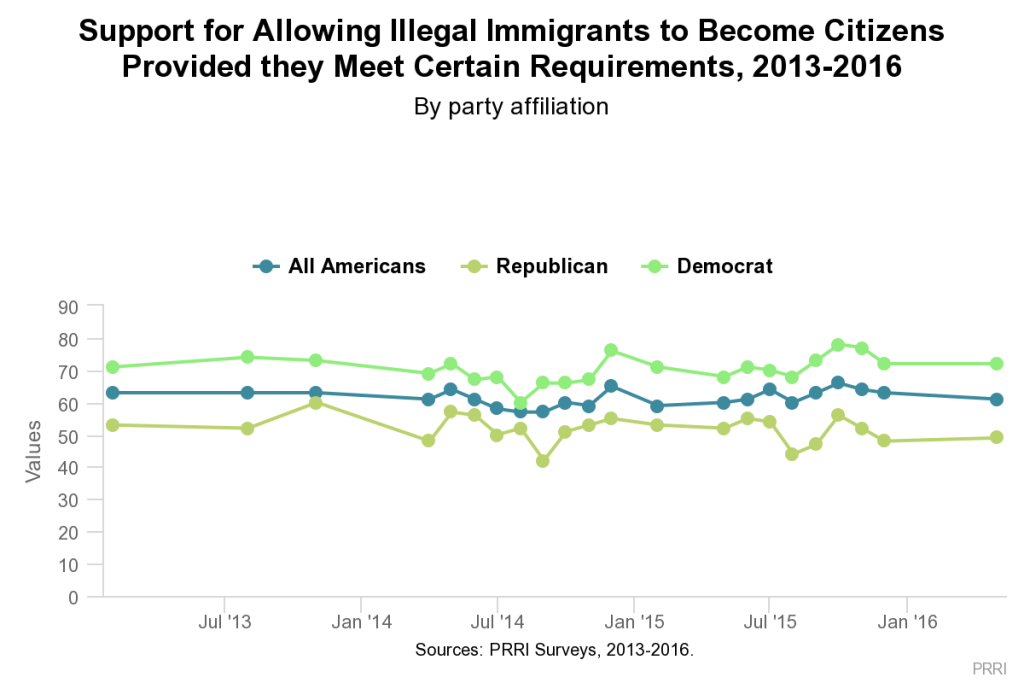
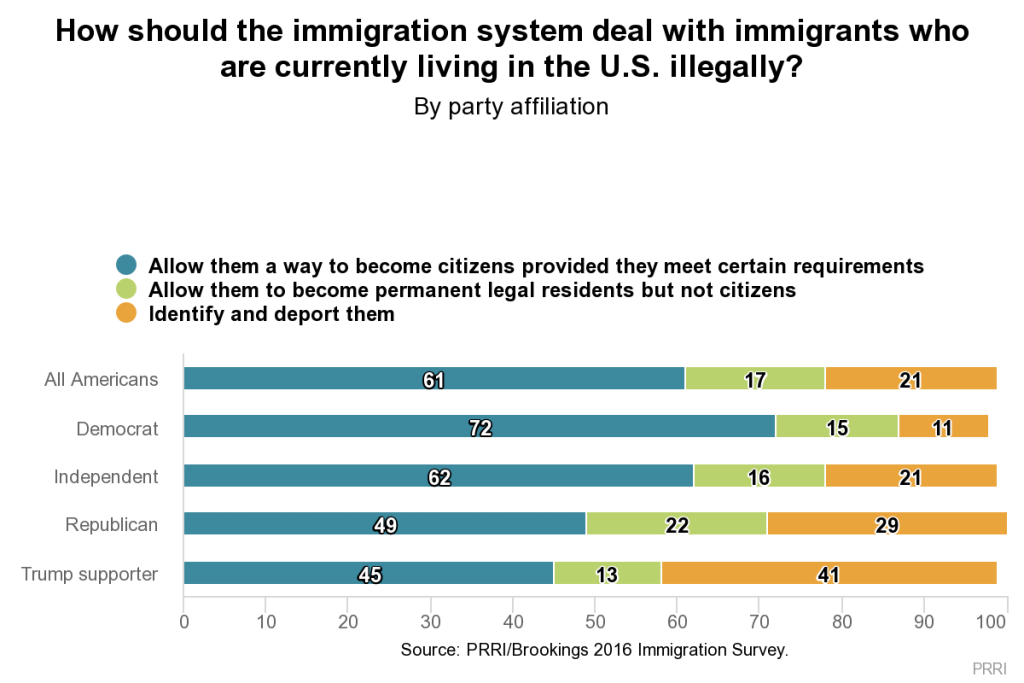
Americans remain firmly committed to an immigration policy that provides a path to citizenship, compared to other policy options. More than six in ten (61%) Americans say immigrants living in the U.S. illegally should be allowed a way to become citizens, provided they meet certain requirements. Roughly one in five (17%) say they would prefer illegal immigrants to be eligible for permanent residency status but not citizenship, and roughly an equal number (21%) say all immigrants living in the U.S. illegally should be deported. Notably, support for a path to citizenship for immigrants living in the U.S. illegally has remained steady since early 2013.
Nearly six in ten (58%) Americans oppose building a wall along the U.S. border with Mexico, compared to 41% who support the idea.
- Roughly two-thirds (66%) of Republicans and 82% of Trump supporters support building a wall between the U.S. and Mexico, while only four in ten (40%) independents and 23% of Democrats favor it.
A majority (55%) of Americans oppose passing a law that would deny Syrian refugees entrance to the U.S., compared to fewer than half (44%) who support it.
- Seven in ten (70%) Democrats oppose the passage of a law that would prevent Syrian refugees from entering the U.S., while 66% of Republicans and 78% of Trump supporters endorse such a measure.
Nearly six in ten Americans (58%) also oppose placing a temporary ban on Muslims from other countries entering the U.S., compared to four in ten (40%) who support this proposal.
- Nearly two-thirds (64%) of Republicans and 77% of Trump supporters favor a temporary ban on Muslims from coming to the U.S., while roughly three-quarters (74%) of Democrats oppose it.
Americans are more likely to say that the Democratic Party (49%), rather than the Republican Party (39%), represents their views on immigration well.
Perceptions of Immigrants and their Impact
Americans are more divided over whether immigrants are more of a benefit or burden in our society. Close to half (47%) of Americans say immigrants today strengthen our country because of their hard work and talents, while 43% say immigrants are a burden on the country because they take jobs, housing, and health care.
- About two-thirds (65%) of Republicans, and eight in ten (80%) Trump supporters, say immigrants constitute a burden on America because they take jobs, housing, and health care, while fewer than three in ten (27%) Democrats say the same. About two-thirds (64%) of Democrats say immigrants strengthen the country with their hard work and talents, a view held by only 26% of Republicans.
Americans overwhelmingly believe immigrants coming to America today generally take jobs that Americans don’t want. Nearly seven in ten (68%) Americans say new immigrants mostly take jobs Americans do not want, while just one-quarter (25%) of Americans believe these immigrants take jobs away from American citizens.
At the same time, a majority (54%) of Americans say illegal immigrants mostly hurt the economy by driving down wages, while four in ten (39%) Americans say illegal immigrants generally help the economy by providing low cost labor.
Americans are nearly twice as likely to say immigrants are changing American society “a lot” as they are to say immigrants are changing their local communities “a lot” (39% vs. 22%, respectively).
- While there are no significant partisan differences in perceptions of the degree to which immigrants are changing local communities, there are large partisan differences in perceptions of how immigrants are changing American society. A slim majority (51%) of Republicans, and nearly six in ten (59%) Trump supporters, say immigrants have changed American society and way of life a great deal, a view shared by approximately four in ten (39%) independents and less than three in ten (27%) Democrats.
- Notably, attitudes about immigrants are not significantly correlated with the perceived effect they are having on local communities, but they are highly correlated with the perceived effect they are having on American society.
Trade and Taxation
A majority (52%) of the public says that free trade agreements with other countries are mostly harmful because they send U.S. jobs overseas and drive down wages. Roughly four in ten (41%) say that free trade agreements are mostly helpful because they open new markets for U.S. companies and allow Americans to buy goods more cheaply.
- Six in ten (60%) Republicans and 69% of Trump supporters say that free trade agreements are mostly harmful to the U.S. In contrast, Democrats are closely divided, with about as many saying they are helpful (45%) as harmful (49%). The views of independents do not differ significantly from Americans overall.
Nearly seven in ten (69%) Americans support increasing the tax rate on Americans earning at least $250,000 per year, compared to about three in ten (31%) who oppose this policy.
- Over the last four years, there has been a sea change in opinion among Republicans with regard to taxing the wealthy. Currently, a majority (54%) of Republicans express support for increasing the tax rate on Americans earning at least $250,000 a year—an 18-point increase from 2012.
- Nearly seven in ten (68%) independents and 84% of Democrats favor increasing taxes on wealthy Americans.
I. The State of the Country
Looking Ahead: Right Direction or Wrong Track
Americans continue to believe that the country is on the wrong track. More than seven in ten (72%) Americans believe the U.S. has gotten off on the wrong track, while only 28% say things are moving in the right direction. Views are little changed over the last few years. In 2011, roughly two-thirds (65%) of the public agreed that the U.S. had gotten off on the wrong track.
Across the political divide, Americans agree that the U.S. is moving in the wrong direction. Nearly nine in ten Republicans (87%), more than seven in ten independents (73%), and roughly six in ten Democrats (58%) believe the country has gotten seriously off track.
Looking Back: Have Things Gotten Better or Worse Since the 1950s?
The general public is evenly divided over whether American society has improved since the middle of the twentieth century. Forty-nine percent of the public say that American culture and way of life has mostly changed for the better, while 50% say it has changed for the worse since the 1950s. Views vary considerably by race, ethnicity, class, religious identity, and political affiliation.
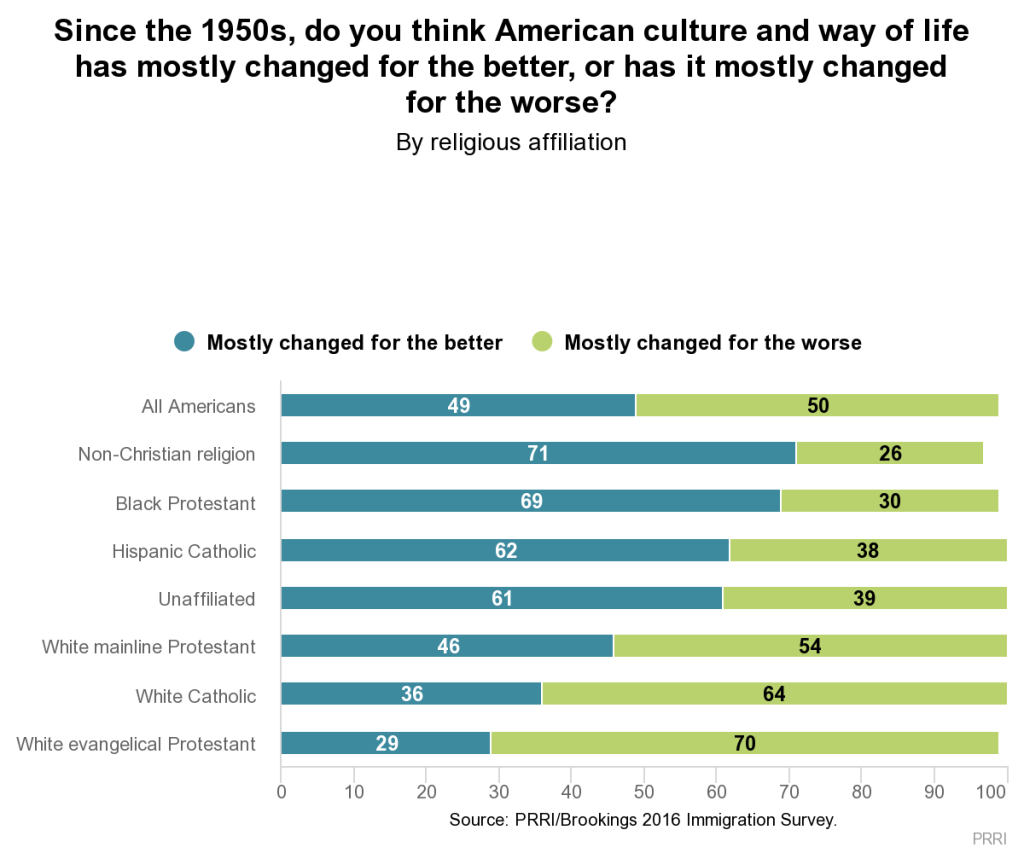 Notably, a majority (55%) of white Americans believe that things have changed for the worse. There are, however, stark class differences among whites. A majority (54%) of white college-educated Americans believe that American culture has improved since the 1950s, while only 37% of white working-class Americans agree. More than six in ten (62%) white working-class Americans say that American culture and society has changed for the worse since the 1950s. In contrast, majorities of Hispanic (54%) and black Americans (71%) say things have changed for the better since the 1950s.
While majorities of all white Christian groups say American culture and way of life has changed for the worse over the past six decades, no group of Americans is more nostalgic about the 1950s than white evangelical Protestants. Seven in ten (70%) white evangelical Protestants believe that American culture and way of life has mostly changed for the worse since the 1950s. A majority of white Catholics (64%) and white mainline Protestants (54%) also agree that things were better then. In contrast, non-white Christians and religiously unaffiliated Americans see improvement since the 1950s. More than six in ten religiously unaffiliated Americans (61%), Hispanic Catholics (62%), and black Protestants (69%) say American culture has changed for the better since the 1950s.
Americans are also sharply divided by political affiliation. More than two-thirds (68%) of Republicans believe the American way of life has changed for the worse since the 1950s, while roughly the same number of Democrats (66%) say things have improved. Independents closely mirror the general public. Trump supporters—Republican and Republican-leaning independents who supported Trump during the primary—are also far more likely to say that American culture and way of life has gotten worse (68%) than say it has improved (32%).
Evaluations of the Economy and Personal Financial Well-being
Most Americans continue to believe that the country’s economic recession has not ended. Seven in ten (70%) Americans believe the U.S. is still enduring an economic recession, while about three in ten (29%) disagree. These views have remained remarkably stable since 2012.
Views about the economic state of the country do not differ greatly by partisan affiliation. More than seven in ten Republicans (77%) and independents (72%) and more than six in ten Democrats (61%) say the country is still in the throes of a recession. However, political liberals are far less likely than conservatives to agree the U.S. is still in a recession (55% vs. 80%, respectively).
Most Americans give fairly negative appraisals of their own financial situation. A majority of Americans say they are only in fair shape (40%) or poor shape (16%) financially. Roughly four in ten say their current financial situation is good (38%) or excellent (6%).
Americans’ assessment of their personal financial wellbeing is associated with views of the overall American economy. More than eight in ten (82%) Americans who report being in poor financial shape believe the U.S. is still in a recession. Conversely, a majority (57%) of Americans who report being in excellent shape financially believe the recession has ended.
II. Anxieties about Personal Safety and Well-being: Terrorism, Crime, and Unemployment
Americans overall are deeply worried about the possibility that they or someone in their family will be the victim of terrorism, suffer violent crime, or become unemployed.
The Threat of Terrorism
Concerns about terrorism have increased significantly in recent years. Today, a slim majority (51%) of Americans report feeling somewhat or very worried that they or a member of their family will become a victim of terrorism. Sentiment was dramatically different in late 2014, when only one-third (33%) of Americans said they were at least somewhat worried about being a victim of terrorism.
 Hispanic Americans and the white working class are the most worried about terrorism. Two-thirds (67%) of Hispanics report being at least somewhat worried about being the victim of terrorism, compared to roughly half of white (48%) and black Americans (47%). White Americans are sharply divided by class. A majority (54%) of the white working class say that they are at least somewhat worried about being the victim of terrorism, compared to fewer than four in ten (37%) white college-educated Americans.
Concerns about terrorism differ markedly between Republicans and Democrats. More than six in ten (62%) Republicans say that they are at least somewhat worried about being personally affected by terrorism, while only 44% of Democrats say this is something that they are worried about. Political independents do not differ significantly from Americans overall. Nearly two-thirds (65%) of Trump supporters fear that they or a family member will be a victim of terrorism.
There are also substantial religious differences in the anxiety Americans express about terrorism. No religious group expresses more apprehension about terrorism than Hispanic Catholics. Seven in ten (70%) say they feel at least somewhat worried about terrorism affecting them or their family. A majority of white evangelical Protestants (57%), white mainline Protestants (54%), and white Catholics (54%) say the same. Fewer than half (49%) of black Protestants, roughly four in ten (38%) members of non-Christian religions, and about one in three (31%) religiously unaffiliated Americans report being at least somewhat worried about terrorism.
The Threat of Violent Crime
Americans are more concerned about the possibility of being a victim of violent crime than they are about terrorism. More than six in ten (63%) Americans report being at least somewhat worried that they or a family member will be a victim of violent crime. Fewer than four in ten (37%) report that they are not too worried or not at all worried about this.
Concerns about crime are associated with race and socio-economic status. Roughly seven in ten Hispanics (72%) and blacks (69%) say they are at least somewhat worried about this issue, compared to six in ten (60%) white Americans. However, there are strong class divisions among white Americans. More than two-thirds (68%) of white working-class Americans express anxiety about violent crime compared to less than half (48%) of white college-educated Americans.
Americans who report being in better financial shape are much less likely to be concerned about violent crime. More than two-thirds (69%) of Americans who are in poor financial shape say they are worried about being the victim of violent crime, including 36% who are “very” worried about this eventuality. In contrast, only half (50%) of Americans in excellent financial shape are at least somewhat concerned about violent crime, including only nine percent who report being “very” concerned.
The Threat of Unemployment
Fears about unemployment are widespread. Roughly two-thirds (65%) of Americans are at least somewhat worried that they or a family member will become unemployed. Only about one-third (34%) of Americans say they are not too worried or not at all worried about potential unemployment.
As was the case with anxiety about violent crime, black (75%) and Hispanic Americans (72%) express more concern about unemployment than white Americans (61%). Again, white Americans are divided by class: there is a 12-point gap between white working-class and white college-educated Americans on this issue (67% vs. 55%, respectively).
Americans who say they are in poor financial shape are more anxious about the prospect of job loss than Americans who say their financial situation is more robust. Eight in ten (80%) Americans who report being in poor financial shape are at least somewhat worried about unemployment affecting them or their family. In stark contrast, fewer than half (44%) of Americans who are in excellent financial shape say the same.
III. Anxieties about Cultural Change
Concerns about America Becoming a Majority Non-white Nation
Concern about the U.S. becoming a majority non-white nation has increased significantly over the last few years. Today, about one in five (21%) Americans explicitly say the prospect of the U.S. becoming a majority non-white country would bother them, compared to 14% in 2013. Nearly eight in ten (78%) Americans, however, say the idea of America becoming a country where most people are not white does not bother them.
The degree to which Americans feel uneasy about the racial and ethnic change in the country varies somewhat among racial and ethnic groups. Nearly one-quarter (24%) of white Americans say the prospect of the U.S. becoming a majority non-white country concerns them. Nearly one in five (19%) black Americans also say this would bother them. Only 13% of Hispanic Americans say the changing racial and ethnic makeup is a cause for concern.
There are notable differences among whites of different socio-economic backgrounds. Close to three in ten (28%) white working-class Americans express concern about the U.S. becoming a majority non-white country, compared to 16% of white college-educated Americans.
Concerns about the changing racial and ethnic composition of the U.S. vary modestly by political affiliation. Twenty-eight percent of Republicans say the prospect of the U.S. becoming a majority non-white country bothers them, an opinion shared by roughly one in five Democrats (20%) and independents (18%). Supporters of Donald Trump express noticeably more discomfort with the idea than any other group; more than one-third (34%) say they would be bothered by this change.
Older Americans express somewhat more discomfort about an America that is primarily non-white than younger Americans. Nearly three in ten (29%) seniors (age 65 and older) say this change would bother them, compared to fewer than one in five (19%) young adults (age 18-29).
Discomfort with Non-English-Speaking Immigrants
Americans are divided over how comfortable they feel when around immigrants who do not speak English: half (50%) say that they are bothered when they come in contact with immigrants who speak little or no English, while nearly as many (49%) say this would not bother them.
There are significant racial and ethnic divisions in the degree of comfort Americans express about coming into contact with immigrants who don’t speak English. Nearly six in ten (58%) white Americans say they are not comfortable being around immigrants speak little or no English, compared to four in ten (40%) black Americans and about one in five (22%) Hispanic Americans. In stark contrast, nearly eight in ten (77%) Hispanics and six in ten (59%) blacks say this would not bother them.
Class differences among white Americans are notable. Nearly two-thirds (64%) of white working-class Americans say it bothers them when they come in contact with immigrants who speak little or no English. White college-educated Americans, by comparison, are much more divided: close to half (48%) say they are bothered when they come into contact with non-English-speaking immigrants, while a slim majority (52%) say this experience would not bother them.
The extent to which Americans are bothered by non-English-speaking immigrants varies considerably by party affiliation. Roughly two-thirds (66%) of Republicans express discomfort when coming into contact with immigrants who do not speak English, while nearly two-thirds (64%) of Democrats say this does not bother them. Trump supporters exhibit even greater discomfort than Republicans, with nearly eight in ten (77%) reporting that this experience would bother them.
 Generational differences in attitudes toward non-English-speaking immigrants are considerable. Nearly six in ten (58%) seniors say they are bothered coming into contact with immigrants who speak little or no English, compared to fewer than four in ten (37%) young adults. More than six in ten (62%) young adults say they would not be bothered by this experience.
Perceptions of Discrimination Against Whites
Americans are also evenly divided about the extent to which they believe discrimination against whites, or “reverse discrimination,” is a problem in the country today. Forty-nine percent of Americans say discrimination against whites has become as big a problem today as discrimination against blacks and other minorities, while an identical number (49%) disagree. Concern about reverse discrimination has been relatively stable since 2011, when 46% said whites were facing as much discrimination as non-whites. A slim majority (51%) disagreed.
Not surprisingly, there are also significant racial and ethnic divisions in attitudes about the seriousness of reverse discrimination. Approximately six in ten (57%) white Americans agree that discrimination against whites is as big a problem today as discrimination against blacks and other minorities, an opinion shared by fewer than four in ten (38%) Hispanic Americans and fewer than three in ten (29%) black Americans. Nearly seven in ten (69%) black Americans and about six in ten (61%) Hispanic Americans do not believe whites today are confronting discrimination equal to that of non-whites.
 The opinions of white Americans also differ significantly by social class. About two-thirds (66%) of white working-class Americans agree that the discrimination faced by whites is now as big a problem as the discrimination faced by non-whites. Only about four in ten (43%) white college-educated Americans embrace this view, and a majority (56%) disagree.
The partisan gap in views about reverse discrimination is considerable. Seven in ten (72%) Republicans believe that discrimination against whites has become as big a problem today as discrimination against blacks and other minorities, compared to fewer than one in three (32%) Democrats; more than two-thirds (68%) of Democrats disagree. The partisan gap is just as large between white Democrats and white Republicans. Three-quarters (75%) of white Republicans believe that discrimination against whites is no less a problem than it is against blacks and other minorities, a view embraced by only 35% of white Democrats. However, Trump supporters express even greater concern about reverse discrimination than Republicans—more than eight in ten (81%) Trump supporters say discrimination against whites is as big a problem as discrimination against other racial and ethnic groups. The attitudes of independents closely mirror the attitudes of the general public.
White Christian groups hold significantly different opinions than all other religious groups about reverse discrimination. More than six in ten white evangelical Protestants (68%), white mainline Protestants (63%), and white Catholics (62%) say discrimination against whites is now as critical as discrimination against non-whites. In contrast, more than six in ten religiously unaffiliated Americans (67%), black Protestants (66%), and Hispanic Catholics (61%) say discrimination against whites is not as big a problem as discrimination against blacks and other minorities in the U.S.
Perceptions of Discrimination Against Christians
Nearly half (49%) of Americans also say discrimination against Christians has become as big a problem in America today as discrimination against other groups, while half (50%) of Americans disagree.
Although there are no significant differences in opinion by race or ethnicity, among white Americans, anxiety about discrimination against Christians varies substantially by social class. More than six in ten (62%) white working-class Americans believe discrimination against Christians is now as big a problem as discrimination against other groups. Only 38% of white college-educated Americans agree, while 62% disagree.
Partisan differences in attitudes about the discrimination faced by Christians are also significant. Nearly three-quarters (74%) of Republicans believe discrimination against Christians today is as big an issue as discrimination against other groups, while fewer than half of independents (45%) and Democrats (34%) agree. Like Republicans overall, 77% of Trump supporters say discrimination against Christians in the U.S. today is a major problem.
Christians are considerably more likely than non-Christians to perceive significant discrimination against Christians in the U.S., yet there is still significant diversity of opinion among denominations. Nearly eight in ten (77%) white evangelical Protestants say that discrimination against Christians now rivals that of other groups. Substantially fewer white mainline Protestants (54%), white Catholics (53%), black Protestants (53%), and Hispanic Catholics (50%) agree that discrimination against Christians is now as big a problem as discrimination against other groups in the America. About eight in ten religiously unaffiliated Americans (78%) and adherents of non-Christian religions (77%) disagree.
The Place of Christianity in National Identity
Fewer than half (41%) of the public believes the U.S. has always been and is currently a Christian nation, while a nearly identical number (42%) say America was a Christian nation in the past but is not now. Fifteen percent of Americans say America has never been a Christian nation.
The perspectives of Republicans and Democrats differ significantly on this question. Forty-four percent of Republicans say the U.S. has always been and continues to be a Christian nation, while a majority (51%) say America was once a Christian nation but is no longer. Only five percent of Republicans say the U.S. has never been a Christian nation. In contrast, four in ten (40%) Democrats believe the U.S. is currently a Christian nation, while only about one-third (36%) believe the U.S. was formerly a Christian country but is not today. More than one in five (22%) Democrats say the U.S. has never been a Christian nation.
Opinions about America’s legacy as a Christian nation are also strongly influenced by religious affiliation. White evangelical Protestants are most apt to believe that the U.S. has lost its Christian identity, and this belief has increased significantly over the last four years. In 2012, 45% of white evangelical Protestants believed that the U.S. is and has always been a Christian nation, while a similar number (48%) believed that the U.S. was a Christian nation in the past but is not today. Today, fewer white evangelical Protestants believe the U.S. is currently a Christian nation (37%), and the belief that America is no longer a Christian nation has jumped 11 percentage points to 59%.
 Other religious groups are less likely to say the U.S. has shifted away from a past Christian identity. Roughly four in ten black Protestants (46%), white mainline Protestants (45%), Hispanic Catholics (42%), and white Catholics (40%) say the U.S. was a Christian nation at one time but is not anymore. Even fewer adherents of non-Christian religions (32%) and religiously unaffiliated Americans (28%) say the same. Notably, more than one-third (34%) of Americans who are religiously unaffiliated and about three in ten (29%) adherents of non-Christian religions say the U.S. was never a Christian nation.
Perceptions of America’s religious heritage and identity vary substantially by age. Only one-third (32%) of young adults (age 18-29) say America is and always has been a Christian nation, while nearly half (49%) of seniors (age 65 and older) say the same. Conversely, young adults are nearly three times more likely than seniors to say America has never been a Christian nation (24% vs. 9%, respectively).
Is Islam at Odds with American Values?
Americans remain somewhat skeptical about the extent to which Islam is consistent with American values and way of life. Nearly six in ten (57%) Americans say the values of Islam are at odds with American values and way of life, while four in ten (40%) Americans disagree. In October 2015, a similar number (56%) of Americans said Islamic values are incompatible with the American way of life.
Black and Hispanic Americans are considerably more divided than their white counterparts about whether Islam is at odds with American values and way of life. Six in ten (61%) white Americans say the values of Islam are incompatible with American values and way of life, compared to a slim majority (51%) of Hispanic Americans and less than half (45%) of black Americans. A slight majority (52%) of black Americans and nearly half (48%) of Hispanic Americans reject this idea.
Class differences among white Americans are significant. Nearly seven in ten (68%) white working-class Americans say the values of Islam conflict with American values. White college-educated Americans are more divided, with a majority (53%) expressing agreement and nearly half (47%) rejecting the idea.
Perspectives about Islam’s compatibility with American way of life also vary significantly by party affiliation. Nearly eight in ten (79%) Republicans believe the values of Islam are at odds with the American way of life, a view shared by a majority (54%) of independents and less than half (42%) of Democrats. A majority (55%) of Democrats say Islam does not conflict with American values. More than eight in ten (83%) Trump supporters embrace the idea that Islam is opposed to American values.
White Christian groups are the most likely of all major religious groups to express doubt about Islam’s compatibility with American values, though non-white Christian groups also express considerable skepticism. Three-quarters (74%) of white evangelical Protestants and more than six in ten white mainline Protestants (66%) and white Catholics (63%) say the values of Islam conflict with American values and way of life, as do a majority of Hispanic Catholics (54%). Only about four in ten religiously unaffiliated Americans (43%), black Protestants (43%), and members of non-Christian religions (41%) echo this sentiment.
 Age differences in opinions about Islamic values are significant. While more than six in ten (62%) seniors say the values of Islam conflict with American values, fewer than half (45%) of young adults agree. A majority (52%) of young adults say the values of Islam are not at odds with American values.
Protection from Foreign Influence
A majority (55%) of Americans believe that the American way of life needs to be protected against foreign influence, while more than four in ten (44%) disagree. Views about defending the U.S. from foreign cultural encroachments have not shifted in recent years.
The levels of fear about external cultural threats vary somewhat by race and ethnicity. A majority of white (59%) and black Americans (53%) agree that the American way of life needs protection from foreign influence compared to fewer than half of Hispanic Americans (44%).
The views of white Americans are sharply divided by social class. More than two-thirds (68%) of the white working class agree that the American way of life needs protection, while fewer than half (47%) of white college-educated Americans agree. A majority (54%) of white college-educated Americans reject the notion that the American way of life is in need of protection.
Republicans are much more concerned than Democrats about changes to the American way of life. Nearly three-quarters (74%) of Republicans agree that the foreign influence over the American way of life needs to be kept at bay, compared to approximately four in ten (41%) Democrats. Political independents’ attitudes mirror those of Americans overall. Supporters of Donald Trump are even more anxious than rank and file Republicans about perceived external challenges to the American way of life: more than eight in ten (83%) say the U.S. needs to be protected.
 White Christians, including white evangelical Protestants (76%), white Catholics (68%), and white mainline Protestants (63%), are more likely than members of other religious groups to say that the American way of life needs protection. Only four in ten (40%) Hispanic Catholics, and roughly one-third of the religiously unaffiliated (34%) and members of non-Christian religions (32%) agree.
Seniors and young Americans diverge sharply in their views about the threat posed by foreign cultures. While nearly two-thirds (66%) of seniors believe the American way of life needs to be protected, only 38% of young adults agree. More than six in ten (62%) young adults do not believe the American way of life needs to be defended against foreign influence.
Fighting Cultural Change
Most Americans believe that if their values are at odds with broader cultural changes, they should fight against them even if their views represent only a minority of people. A majority (57%) of Americans agree that it is important to keep fighting against laws and cultural changes that go against their values, even if most other Americans disagree. Roughly four in ten (41%) disagree.
A majority of black (63%), white (57%), and Hispanic Americans (55%) agree that laws and cultural changes that violate their beliefs should be resisted. There are only modest class divisions among white Americans. Six in ten (60%) white working-class Americans agree that it is important to fight cultural changes and laws they disagree with, while a majority (53%) of white college-educated Americans also agree.
Republicans (71%) are more likely than either independents (55%) or Democrats (49%) to agree that it is important to oppose cultural change that goes against one’s values, even if most Americans disagree.
No religious group is more likely to believe that it is important to keep fighting laws and cultural changes that go against their personal beliefs, regardless of prevailing public sentiment, than white evangelical Protestants. Seven in ten (70%) white evangelical Protestants and two-thirds (67%) of black Protestants agree with this statement. Nearly six in ten white Catholics (59%) and white mainline Protestants (57%) also believe it is important to stand up against cultural changes and laws. About half of Americans who belong to non-Christian religions traditions (50%) and Hispanic Catholics (49%), and only four in ten (40%) religiously unaffiliated Americans agree.
IV. Leadership in a Time of Anxiety
Does America Need a Strong Leader Willing to Break the Rules?
Americans are evenly split over whether or not America has gone so far off track that we need a leader willing to break some rules if that’s what it takes to set things right: 49% agree, while roughly as many (50%) disagree. Americans who are experiencing a high degree of economic and cultural insecurity are much more likely to agree with this statement than other Americans.
While there are no differences based on race or ethnicity, there are striking divisions based on class and educational attainment. Six in ten (60%) white working-class Americans agree that the U.S. needs a leader willing to break some rules, a view shared by roughly one-third (32%) of white college-educated Americans. Two-thirds (67%) of white college-educated Americans reject this statement.
Educational differences cut across racial and ethnic divisions. Americans with only a high school education or less are much more likely than Americans with greater levels of formal education to embrace a leader who is willing to defy convention. Nearly six in ten (59%) Americans with a high school education or less say America needs such a leader. A slim majority (51%) of Americans with some college education—including those with an associate’s degree—also affirm this view. In contrast, only four in ten (40%) Americans with a four-year college degree and fewer than one-quarter (24%) of Americans with a post-graduate education agree that America needs that kind of leader.
Republicans (57%) are more likely than either political independents (48%) or Democrats (41%) to agree that America needs a leader willing to break the rules. Perhaps not surprisingly, nearly three-quarters (72%) of Trump supporters believe that things have become so dire that the country needs a leader who will disrupt the rules of the game.
 Americans who feel threatened are also more likely to say that America needs a leader willing to break some rules. Americans who agree that the American way of life needs protection from foreign influence are much more likely than those who disagree to say that we need such a leader (59% vs. 36%, respectively). Americans who are concerned that they will personally be victimized by terrorism are also much more likely than those who are not worried to think that America needs this kind of leader (58% vs. 39%, respectively).
Authoritarianism
In 2012, PRRI conducted a study of white working-class Americans, Beyond God and Guns, which examined how differing approaches to authority influenced cultural attitudes and politics. Informed by the work of Feldman (2003), Stenner (2005), and others, that study adapted a series of measures from the American National Election Study (ANES) that asked respondents to choose between desirable childhood traits that emphasize authority (e.g. good manners) and those that emphasize autonomy (e.g. curiosity).
The current survey, which replicates that battery, finds that Americans overall tend to favor an emphasis on authoritarian traits over autonomous traits. A majority of Americans prefer children to have respect for elders (74%) rather than independence (26%), to demonstrate good manners (70%) rather than curiosity (30%), and to be well-behaved (61%) rather than creative (38%). The only autonomous trait that a majority of Americans prefer is self-reliance (53%) over to obedience (46%).
From these four questions we computed a single additive scale that identifies five distinct orientations: Highly Autonomous, Autonomous, Mixed, Authoritarian, and Highly Authoritarian. A majority of Americans favor either highly authoritarian (31%) or authoritarian (26%) traits. In contrast, roughly one-quarter express preferences for either highly autonomous (10%) or autonomous (13%) traits. One in five Americans (20%) have mixed preferences.
Which Americans Incline Toward Authoritarianism?
A majority (54%) of white Americans have an authoritarian orientation, although there are substantial differences by class. Nearly two-thirds (64%) of white working-class Americans have an authoritarian orientation, compared to fewer than four in ten (39%) white college-educated Americans. Roughly two-thirds of black (68%) and Hispanic Americans (66%) have an authoritarian orientation, although these orientations are also highly correlated with lower education levels. For example, 66% of non-white Americans with a high school degree or less have an authoritarian orientation, compared to 51% of non-white Americans with a post-graduate degree.
Educational differences are also pronounced among Americans overall. Nearly seven in ten (69%) Americans with a high school education or less have an authoritarian orientation, compared to only about four in ten (39%) of Americans with a post-graduate level of education.
Preferences for authoritarian traits vary considerably across the political spectrum. Nearly seven in ten (69%) Republicans express an authoritarian disposition, including four in ten (40%) who register as highly authoritarian. Political independents and Democrats are less likely to have an authoritarian orientation (55% and 51%, respectively). However, Democrats are sharply divided by race, with only 43% of white Democrats expressing authoritarian preferences compared to 61% of non-white Democrats. Notably, Trump supporters are not any more likely than Republicans overall to embrace an authoritarian orientation; roughly two-thirds (66%) express a preference for authoritarian traits.
Americans of different religious backgrounds also display varying affinities for embracing an authoritarian orientation. Roughly three quarters of black Protestants (77%), white evangelical Protestants (75%), and Hispanic Catholics (75%) have an authoritarian orientation. A majority of white Catholics (62%) and white mainline Protestants (55%) also express authoritarian preferences. In contrast, no more than one in three Americans who belong to non-Christian denominations (33%) and the religiously unaffiliated (30%) hold an authoritarian disposition.
Older Americans are much more likely to have an authoritarian orientation than younger Americans. Six in ten (60%) seniors (age 65 and older) express a preference for authoritarian traits, compared to fewer than half (44%) of young adults (age 18-29).
The Authoritarian Orientation: Feelings of Personal Insecurity, Acute Cultural Anxiety
Americans who value authoritarian traits also express much greater concerns about their personal safety and security. A majority (57%) of Americans who have a highly authoritarian orientation report being worried that they or a family member will be a victim of terrorism; only about one-quarter (24%) of Americans who have a highly autonomous orientation share these concerns. Similarly, while nearly seven in ten (69%) highly authoritarian Americans express concern about being a victim of violent crime, only 41% of highly autonomous Americans say they are worried about this. Importantly, majorities of both highly authoritarian (63%) and highly autonomous Americans (55%) are worried about becoming unemployed.
Americans who express an authoritarian disposition are much more likely to view cultural changes negatively. More than six in ten (62%) highly authoritarian Americans say that American culture and way of life has mostly changed for the worse since the 1950s while only 22% of highly autonomous Americans say the same. Nearly eight in ten (77%) highly autonomous Americans say that American culture and way of life has improved since this time.
Americans who have a highly authoritarian orientation are more than twice as likely as those who have a highly autonomous orientation to say that the values of Islam are counter to American values and way of life (66% vs. 28%, respectively) and that they are bothered when coming into contact with immigrants who do not speak English (61% vs. 24%, respectively).
Most notably, Americans who have a highly authoritarian orientation are more than twice as likely as those who have a highly autonomous orientation to say the country needs a leader who is willing to break the rules to set things right (58% vs. 22%, respectively).
V. The 2016 Election
Critical Issues
No issue is more critical to Americans than terrorism. Nearly seven in ten (69%) Americans say terrorism is a critical issue to them personally. A majority (55%) of Americans say unemployment is a critical issue. Close to half (48%) say crime is of critical importance to them, while roughly four in ten say that the cost of education (44%), the growing gap between rich and poor (43%), and immigration (43%) are critical concerns. Only 36% of the public say race relations are critically important to them, while about one in four (26%) cite trade agreements as critical.
There is substantial disagreement between partisans on what issues are most important. Democrats are roughly twice as likely as Republicans to say that economic inequality (55% vs. 24%, respectively) and race relation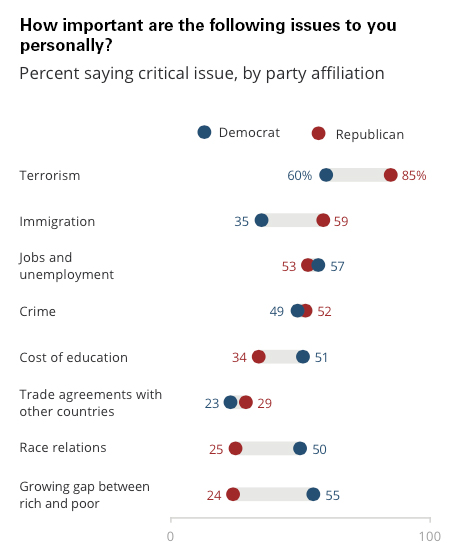 s (50% vs. 25%, respectively) are critical concerns. Democrats are also more likely than Republicans to cite the cost of education as a critical issue (51% vs. 34%, respectively). Conversely, Republicans are much more likely than Democrats to mention immigration (59% vs. 35%, respectively) and terrorism (85% vs. 60%, respectively). Notably, relatively few Democrats (23%) and Republicans (29%) identify free trade as a critical issue.
There are sizable differences in the priorities of Americans by race and class. Black Americans (63%) are much more likely than white (29%) and Hispanic Americans (44%) to say the issue of race relations is critically important to them. Blacks (67%) and Hispanics (62%) are much more likely than whites (42%) to say crime is a critical concern. However, there is a notable divergence between whites by class. White working-class Americans are much more likely to say crime is a concern than white college-educated Americans (51% vs. 28%, respectively). There are also significant racial and ethnic divisions among the public about the importance of education. A majority of blacks (57%) and Hispanics (53%) say the cost of education is critical to them, compared to only 39% of whites. There is strong agreement across racial lines that terrorism is a critical issue. Perhaps surprisingly, fewer than one-third (30%) of white working-class Americans say that trade agreements with other countries is a critical concern.
Views of the Political Parties
The Republican Party is facing an enduring deficit in how it is viewed among the public. Only about one in three (35%) Americans have a favorable view of the GOP, while nearly six in ten (59%) hold an unfavorable view. In contrast, more Americans than not have a positive view of the Democratic Party. Half (50%) of the public have a favorable impression of the Democratic Party, compared to 45% who view it negatively.
There is no evidence that the 2016 presidential primary campaign has had any effect on perceptions of either political party. Last August, 36% of Americans held a positive view of the Republican Party, compared to nearly half (49%) who reported a favorable view of the Democratic Party.
In part, the higher ratings of the Democratic Party are driven by political independents and Republicans who rate their own party less positively than do Democrats. Roughly eight in ten (78%) Republicans have a favorable view of the GOP, while nearly nine in ten (88%) Democrats hold a positive view of the Democratic Party. Independents are not particularly enamored with either party, but have much more positive views of the Democratic Party (45%) than the Republican Party (28%).
The Democrats: Hillary Clinton, Bill Clinton, and Bernie Sanders
Hillary Clinton is less popular among the public than her rival for the Democratic nomination, Bernie Sanders, while Bill Clinton is more popular than both of them. Fewer than half (44%) of the public view Hillary Clinton positively, compared to a majority (54%) who hold an unfavorable opinion of her, including 37% who hold a very unfavorable view. In contrast, a slim majority (51%) of the public have a positive perception of Sanders, while fewer than half (43%) have a negative view of him. A majority of the public (56%) report having a positive view of former president Bill Clinton.
The favorability of both Clintons have eroded in recent years. As recently as October 2013, a majority (57%) of the public reported having a favorable opinion of Hillary Clinton, while only about one in three (35%) expressed a negative opinion of her. Shortly after she announced her candidacy for president, public impressions turned markedly more negative. By October 2015, fewer than half (46%) the public said they viewed Hillary Clinton positively. Bill Clinton has also witnessed his popularity decline. Shortly before the 2012 election, seven in ten (70%) Americans said they had a positive opinion of the former president.
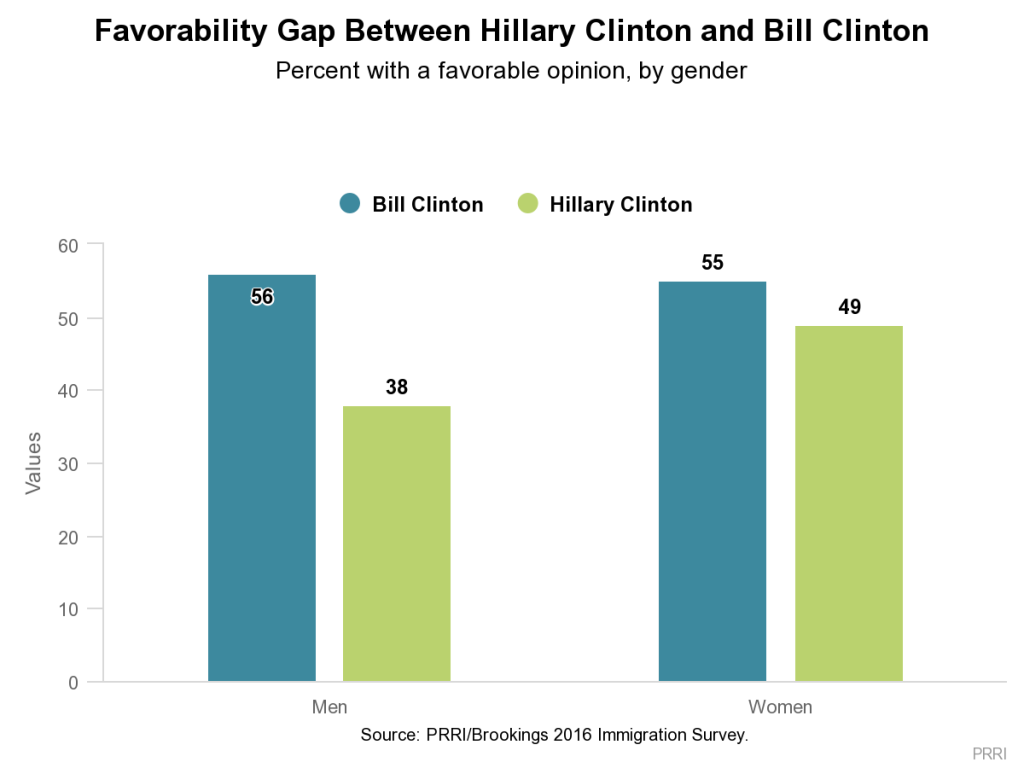
Bill Clinton’s favorability advantage over Hillary is largely the result of a yawning gender gap. A majority (56%) of men have a favorable opinion of Bill Clinton, while fewer than four in ten (38%) report positive feelings about Hillary Clinton, an 18-point advantage. Among women, Bill Clinton is viewed slightly more positively than Hillary Clinton (55% vs. 49%, respectively). Importantly, there are no significant gender differences in Hillary Clinton’s favorability among Republicans or Democrats. Republican men and women report similar feelings about Hillary Clinton, as do Democratic men and women.
 Bernie Sanders’ advantage over Hillary Clinton is primarily driven by how well he is perceived by whites. Only about one-third (34%) of whites express a favorable view of Clinton, while nearly half (46%) of whites have a favorable view of Sanders. Sanders and Clinton are viewed roughly the same by Hispanics, among whom roughly six in ten (59% vs. 58%, respectively) have positive opinions. Clinton is viewed more positively than Sanders among blacks (76% vs. 67%, respectively). Bill Clinton is incredibly popular among blacks—82% have a favorable view of him—and well-regarded by Hispanics, with more than six in ten (63%) holding a positive view of him. Half (49%) of whites also have a favorable view of the former president.
Democrats have an overwhelmingly positive view of both current primary contenders. Nearly eight in ten (79%) Democrats report a favorable opinion of Hillary Clinton, while more than three-quarters (76%) view Sanders favorably. In contrast, few Republicans express positive feelings about either Clinton (11%) or Sanders (21%). A slim majority (51%) of independents have a positive view of Sanders, while fewer than four in ten (39%) have a favorable view of Clinton.
The Republicans: Donald Trump and Ronald Reagan
Only 28% of Americans have a favorable opinion of Donald Trump, while nearly seven in ten (69%) have a negative impression of the presumptive GOP nominee, including a majority (53%) who express a very unfavorable view.
Trump is viewed unfavorably by a majority of all racial and ethnic groups, but is held in particularly low regard among Hispanic and black Americans. Trump is viewed most favorably among whites, with 36% expressing a positive opinion of the likely GOP nominee compared to 63% who have an unfavorable view. More than four in ten (41%) white working class Americans view Trump favorably, a view shared by only 28% of white college-educated Americans. Black and Hispanic Americans have an overwhelmingly negative opinion of Trump. More than nine in ten (91%) blacks view Trump unfavorably, including 79% who hold a very unfavorable view. Similarly, 86% of Hispanics also have an unfavorable opinion of Trump, including 71% who hold a very unfavorable view.
Trump is viewed favorably by a majority (57%) of Republicans but overwhelming numbers of Democrats (89%) and independents (73%) view the Republican nominee unfavorably. Notably, Republicans are far less likely to have a favorable view of Trump than the Republican Party overall (57% vs. 78%, respectively).
Despite the low regard Americans generally have of Donald Trump and the Republican Party today, former Republican President Ronald Reagan remains an extremely popular figure. Roughly two-thirds (66%) of Americans have a favorable view of Reagan, including more than nine in ten (92%) Republicans, more than six in ten (63%) independents, and about half (48%) of Democrats.
VI. Evaluations of the Current Immigration System
Is the Immigration System Working?
Americans continue to be highly critical about the state of the U.S. immigration system. Fewer than four in ten Americans say the current immigration system in the United States is generally working (6%) or working but with some major problems (32%), while more than six in ten say the immigration system is broken but working in some areas (36%) or completely broken (26%). Attitudes about the state of the national immigration system have remained quite negative over the last six years. In 2010, roughly as many Americans reported that the immigration system was generally working (7%) or working with major problems (34%).
 Perceptions of the U.S. immigration system vary somewhat among racial and ethnic groups. Roughly two-thirds (66%) of white Americans say the system is broken but working in select areas or completely broken, while about six in ten (59%) Hispanic Americans and a slim majority (52%) of black Americans say the same. Notably, class differences among white Americans are modest.
Republicans express considerably more negative views of the national immigration system than Democrats. Nearly eight in ten (79%) Republicans say the current U.S. immigration system is either mostly broken or completely broken, while fewer than half (47%) of Democrats agree. A majority (53%) of Democrats say the national immigration system is generally working or working but with some major problems. The attitudes of independents closely align with the attitudes of Americans overall.
Majorities of every major religious groups voice pessimistic views about the U.S. immigration system, with white evangelical Protestants expressing particularly negative attitudes. Three-quarters (75%) of white evangelical Protestants and more than two-thirds (68%) of white mainline Protestants say the U.S. immigration system is either broken but working in a handful of areas or totally broken. Six in ten white (61%) and Hispanic Catholics (60%) and majorities of religiously unaffiliated Americans (56%), members of non-Christian religions (55%), and black Protestants (52%) say the same.
Immigration Levels from Different Countries
American attitudes about the proper levels of immigration into the U.S. vary considerably depending on the part of the world from which the immigrants are coming. Americans express much greater concern about the number of immigrants from the Middle East, Central America and Mexico, and predominately Muslim countries than those from predominately Christian countries and Europe.
More than eight in ten Americans say the number of immigrants coming from predominately Christian countries is about right (68%) or too low (15%), while fewer than one in five say the number is too high (10%) or say no immigrants from Christian countries should be allowed to come here (4%). About eight in ten Americans also say the number of immigrants coming from Europe is about right (67%) or too low (14%). Fewer than one in five Americans say there are too many immigrants coming from Europe (12%) or say no additional immigrants from Europe should be allowed to come (4%).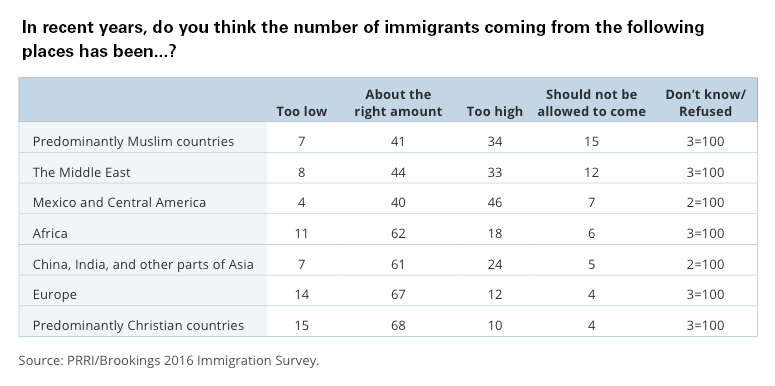
Americans are also generally comfortable the number of immigrants coming to the U.S. from Africa and Asia. More than seven in ten Americans believe the number of immigrants coming from Africa is about right (62%) or too low (11%), while about one-quarter say the number is too high (18%) or say immigration from Africa should be halted altogether (6%). Similarly, nearly seven in ten Americans say they are satisfied with the rate of immigration from China, India, and other parts of Asia (61%) or say it is too low (7%). Roughly three in ten Americans say too many immigrants are coming from Asia (24%) or that no additional immigrants from this part of the world should be allowed to come to the U.S. (5%).
Americans display much more ambivalence about the number of immigrants coming from the Middle East, predominately Muslim countries, and Central America and Mexico. A slim majority of Americans say the number of immigrants coming from the Middle East is about right (44%) or too low (8%), while more than four in ten believe there are too many Middle Eastern immigrants coming (33%) or would prefer to halt immigration from this part of the world completely (12%). About half say immigration levels from predominately Muslim countries are about right (41%) or say too few immigrants come from these countries (7%), compared to similar numbers who say the U.S. accepts too many (34%) or say immigrants from these countries should not be allowed in at all (15%).
Finally, Americans are particularly concerned about immigration from Central America and Mexico. A majority of the public believe the number of immigrants coming from Mexico and Central America is too high (46%) or say that no more immigrants from this part of the world should be allowed to come to the U.S. (7%). Less than half say the number is about right (40%) or too low (4%).
The largest racial and ethnic differences in opinion about immigrant flow concern immigrants coming from predominately Muslim countries, the Middle East, and Central America. A majority (55%) of white Americans say the number of immigrants coming from predominately Muslim countries is too high or that no additional immigrants should be allowed in from these countries—a view shared by four in ten (43%) Hispanic Americans and about one-third (36%) of black Americans. A slim majority of white Americans (51%) believe that too many immigrants come from the Middle East or that immigrants from that region should not be allowed into the U.S. at all; fewer than four in ten blacks (38%) and Hispanics (36%) agree. Nearly six in ten (57%) white Americans believe the rate of immigration from Central America is either too high or should be shut down completely. Fewer than half of Hispanics (48%) and blacks (45%) agree.
Among white Americans, there is also considerable disagreement by social class. Six in ten (60%) white working-class Americans say there are too many immigrants from the Middle East coming to the U.S. or believe no more immigrants from the region should be allowed in. In contrast, only four in ten (40%) white college-educated Americans say the same. The class divide is roughly similar in views about the rate of immigration from predominately Muslim countries, with 62% of white working-class and 43% of white college-educated Americans saying it is too high or should be stopped. There is also a sizeable difference of opinion between the two groups about immigrants coming from Central America and Mexico: more than six in ten (63%) white working-class Americans say either the number of Central American and Mexican immigrants coming to the U.S. is too high or immigration from that region should be halted, while fewer than half (48%) of white college-educated Americans agree.
There is considerable partisan disagreement about the rate of immigration from predominantly Muslim countries and Central America. Nearly three-quarters (73%) of Republicans, compared to only about one-third (32%) of Democrats, say the number of immigrants coming from predominately Muslim countries is too high or say the flow of immigrants from these areas should be halted entirely. Republicans are also much more likely than Democrats (72% vs. 39%, respectively) to say immigration from Mexico and Central America should be reduced or stopped entirely.
While members of every major religious group generally agree about immigration levels from predominately Christian countries, there is significant disagreement between white Christian groups and other religious groups about immigration levels from predominately Muslim countries. More than two-thirds (68%) of white evangelical Protestants and roughly six in ten white Catholics (60%) and white mainline Protestants (59%) say the number of immigrants coming to the U.S. from Muslim countries is either too high or should be stopped. Fewer than four in ten black Protestants (39%), Hispanic Catholics (37%), and religiously unaffiliated Americans (34%), and fewer than one-quarter (23%) of non-Christians echo this sentiment.
Perceptions of Deportation Levels
While the Obama administration has actually increased deportations compared to the Bush years, only 25% of Americans believe that the number of illegal immigrants being deported over the past five or six years has increased. About half (46%) of the public believe the number of illegal immigrants being deported has stayed about the same, and 26% believe deportations have decreased.
There are notable racial and ethnic differences in perceptions of deportation levels in the U.S. While more than four in ten (42%) Hispanic Americans say deportations of illegal immigrants have increased in the past five or six years, just three in ten (30%) black Americans and about one in five (22%) white Americans say the same.
Partisan differences in views on deportation levels are also substantial. More than four in ten (42%) Republicans say deportations have dropped in the last five or six years, compared to only 23% of independents and 17% of Democrats. Democrats are about twice as likely as Republicans to say the rate of deportation has increased (33% vs. 16%, respectively).
VII. U.S. Immigration Policy
Reforming the Immigration System
Americans remain firmly committed to an immigration policy that would allow illegal immigrants a way to become citizens, compared to other policy options. More than six in ten (61%) Americans say immigrants living in the U.S. illegally should be allowed a way to become citizens, provided they meet certain requirements. Roughly one in five (17%) say they would prefer illegal immigrants to be eligible for permanent residency status but not citizenship, and a similar number (21%) say all immigrants living in the U.S. illegally should be deported.
Support for reforming the immigration system to allow illegal immigrants to become citizens has been relatively stable over the past couple of years. In February 2013, for example, a nearly identical proportion (63%) of Americans voiced support for allowing immigrants living in the U.S. illegally to become citizens provided they meet certain requirements. Attitudes among partisans have also remained relatively stable during this period.
Support for immigration reform is fairly strong across racial and ethnic lines. Close to six in ten white Americans (57%) and more than seven in ten black (71%) and Hispanic Americans (75%) favor a policy that would offer illegal immigrants a chance to become citizens. However, there are notable class divisions among whites. Only a slim majority (52%) of white working-class Americans say illegal immigrants should be allowed citizenship status if they meet requirements, compared to 62% of white college-educated Americans. Among white working-class Americans, 14% prefer a policy that allows illegal immigrants to gain permanent residency status but not citizenship; and nearly one-third (32%) prefer deportation to other policy options.
With the exception of white evangelical Protestants, a majority of every religious group prefer allowing illegal immigrants an opportunity to become U.S. citizens. More than six in ten white mainline Protestants (61%), Catholics (62%), religiously unaffiliated Americans (64%), and black Protestants (69%) favor a citizenship option for illegal immigrants. However, there are notable racial and ethnic differences among Catholics. More than three-quarters (77%) of Hispanic Catholics prefer allowing illegal immigrants an opportunity to become citizens, compared to 55% of white Catholics. Fewer than half (49%) of white evangelical Protestants say the immigration system should allow immigrants living in the U.S. illegally a way to become citizens. Among white evangelical Protestants, 19% say they would prefer illegal immigrants to be eligible for permanent residency status but not citizenship, and 30% say all immigrants living in the U.S. illegally should be deported.
 American policy preferences on immigration differ starkly between Republicans and Democrats. More than seven in ten (72%) Democrats say illegal immigrants should be allowed a way to become citizens, a view shared by fewer than half (49%) of Republicans. There are even wider differences between Clinton and Trump supporters. Clinton supporters are far more likely than Trump supporters to support a policy that would allow immigrants living in the U.S. illegally a way to become citizens (71% vs. 45%, respectively). Conversely, Trump supporters (41%) are much more likely than Clinton supporters (13%) and Republicans overall (29%), to favor a policy of deportation.
 Relatively few Americans prefer deportation as a policy solution when presented with other policy alternatives. However, when asked as a standalone question, more than four in ten (43%) Americans nonetheless agree that “we should make a serious effort to deport all illegal immigrants back to their home countries.” A majority (56%) of the public disagree with that statement.
The discrepancy between the number of Americans who broadly affirm that the U.S. should make an effort to deport illegal immigrants and the number supporting deportation as a concrete policy option is largely explained by perceptions of the practical difficulties mass deportation would present. Seven in ten (70%) Americans believe it would be “very difficult” to deport all the immigrants living in the U.S. illegally; 22% of the public say mass deportation would be somewhat difficult to accomplish, while only seven percent say it would not be that difficult. Even among Americans who agree that the U.S. should make a serious effort to deport all illegal immigrants, nearly six in ten (59%) say this would be very difficult to do.
Perhaps not surprisingly, there are substantial differences between Americans who support different immigration policy options. More than three-quarters of Americans who say illegal immigrants should be allowed to become citizens (76%) and those supporting permanent residency status for illegal immigrants (77%) believe that deporting all illegal immigrants in the U.S. would be very difficult. Notably, even a slim majority (51%) of Americans who favor deportation as a policy solution agree that it would be very difficult to accomplish.
Cultural Protectionism: Building a Wall with Mexico,
Banning Muslims, and Refusing Syrian Refugees
Building a Wall on America’s Southern Border
Nearly six in ten (58%) Americans oppose building a wall along the U.S. border with Mexico, compared to 41% who support the idea. There are significant divisions by race, ethnicity, class, and party affiliation.
More than seven in ten black (72%) and Hispanic Americans (71%) oppose building a wall along the U.S.-Mexico border. A slight majority (52%) of white Americans also oppose the proposal while nearly half (48%) support it. There are important divisions among whites by class. A majority (55%) of white working-class Americans support the construction of a wall while fewer than four in ten (39%) white college-educated Americans agree. More than six in ten (61%) white college-educated Americans oppose the idea.
There is strong partisan disagreement on the issue of building a wall along America’s southern border. About two-thirds (66%) of Republicans endorse the idea, while only four in ten (40%) independents and 23% of Democrats favor it. Nearly six in ten (59%) independents and three-quarters (75%) of Democrats reject the proposal; nearly half (48%) of Democrats strongly oppose it. Trump supporters are even more supportive of building a wall than Republicans overall, with more than eight in ten (82%) supporting the proposal.
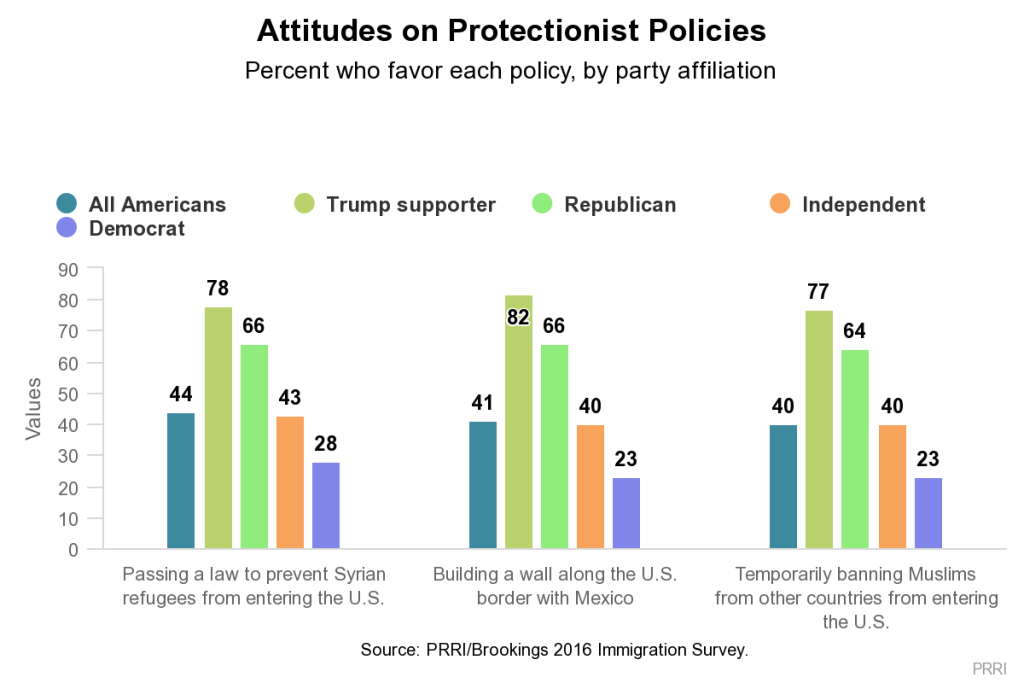 Opinions also vary significantly by generation. Seven in ten (70%) young adults (age 18 to 29) oppose the construction of a wall along the U.S.-Mexico border. Seniors (age 65 and older) are divided, with roughly as many expressing support (47%) as opposition (52%) to the proposal.
Preventing Syrian Refugees from Entering the U.S.
Americans are largely opposed to passing legislation that would prevent Syrian refugees from entering the U.S. A majority (55%) of Americans oppose passing a law that would deny Syrian refugees entrance to the U.S., compared to fewer than half (44%) who support it.
There are only modest racial and ethnic differences about whether to admit Syrian refugees, but there are large class differences. A majority of white (53%) and Hispanic Americans (53%) oppose a ban on Syrian refugees entering the U.S., while more than six in ten (62%) black Americans say the same. A majority (53%) of white working-class Americans support passing a law to prevent Syrian refugees from coming to the U.S., a position shared by fewer than one-third (32%) of white college-educated Americans. Two-thirds (67%) of white college-educated Americans oppose such a plan.
There are robust partisan divisions about whether to admit Syrian refugees. Seven in ten (70%) Democrats oppose the passage of a law that would prevent Syrian refugees from entering the U.S. Nearly as many Republicans (66%) express support for such a measure, while the views of independents closely track Americans overall. Notably, Trump supporters are even more supportive than Republicans overall. Nearly eight in ten (78%) Americans who support Trump favor passing a law to prevent Syrian refugees from coming to the U.S., including nearly half (47%) who strongly support it.
Americans are also sharply divided by religious affiliation. Majorities of white evangelical Protestants (54%) and white mainline Protestants (53%) support passing a law that would prevent Syrians from entering the country. White Catholics are closely divided, with roughly as many registering support (49%) as opposition (51%). Fewer than half of Hispanic Catholics (45%) and black Protestants (36%) support the ban. In stark contrast, two-thirds (67%) of religiously unaffiliated Americans and nearly three-quarters (73%) of Americans who belong to non-Christian faiths oppose the ban on Syrian refugees.
Fears about being personally effected by terrorism are strongly linked to attitudes about banning Syrian refugees. Americans who express greater concerns about terrorism are more likely to support a ban on Syrian refugees. A majority (57%) of Americans who report being “very worried” about terrorism favor a law that would prevent refugees from entering the U.S. In contrast, only 25% of those who are not at all concerned about terrorism support this idea.
A Temporary Ban on Muslim Immigration
Nearly six in ten Americans (58%) oppose placing a temporary ban on Muslims from other countries entering the U.S., compared to four in ten (40%) who support this proposal. Typical cleavages are evident along partisan, religious, racial, and class lines.
There are sizable differences in the perspectives of white and non-white Americans. Close to half (46%) of whites express support for a temporary ban on Muslims coming to the U.S., while only 30% of Hispanics and 25% of blacks support a ban. White working-class Americans are much more supportive than whites with a college education of a ban on Muslim immigration (54% vs. 33%, respectively).
Democrats and Republicans express sharply contrasting views on the issue of banning Muslims. Nearly two-thirds (64%) of Republicans favor a temporary ban on Muslims from coming to the U.S., while nearly three-quarters (74%) of Democrats oppose it. This idea is particularly popular among Trump supporters (77% favor). Independents closely track the views of the American public.
White Christian Americans stand apart from other religious communities in expressing support for a temporary ban on Muslims. A majority of white evangelical Protestants (55%), white Catholics (52%), and white mainline Protestants (51%) endorse a temporary ban on Muslims coming to the U.S. from abroad. In contrast, only about one-quarter religiously unaffiliated Americans (27%), black Protestants (25%), Hispanic Catholics (25%), and members of non-Christian religions (21%) express support for a ban. More than seven in ten black Protestants (73%), Hispanic Catholics (75%), religiously unaffiliated Americans (72%), and members of non-Christian religions (77%) oppose the idea.
Which Party Represents Your Views on Immigration?
On the issue of immigration, Americans are more likely to say that the Democratic Party better represents their views than the Republican Party. Close to half (49%) of Americans say the Democratic Party represents their views somewhat or very well, while approximately four in ten (39%) Americans say the Republican Party represents their views at least somewhat well.
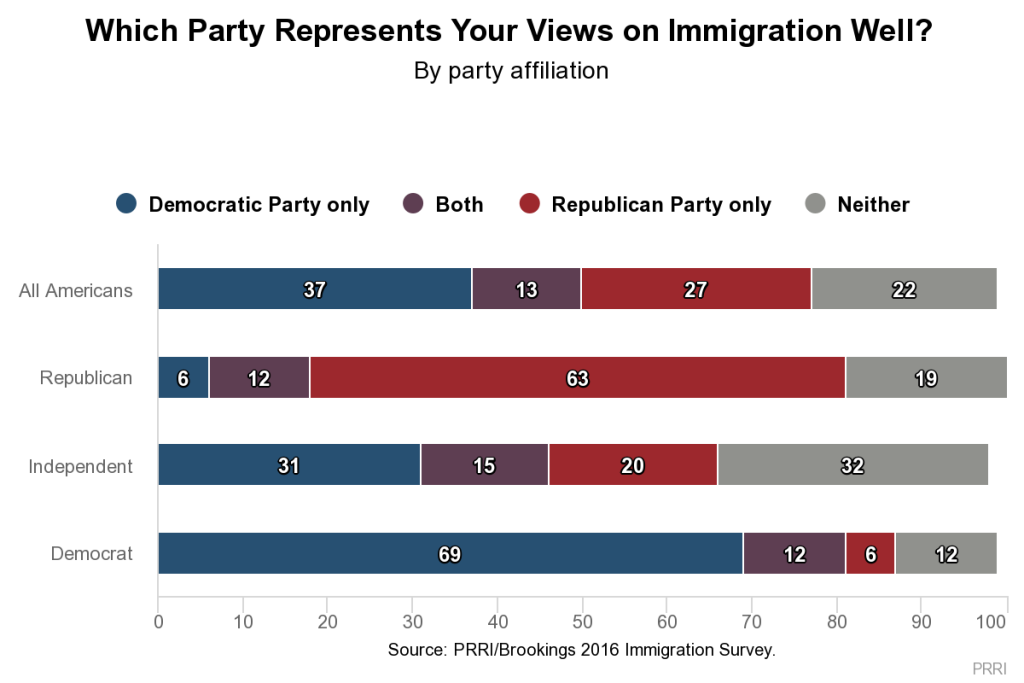 When it comes to which party exclusively represents public views well on the issue of immigration, the Democratic Party still retains an advantage over the Republican Party. Thirty-seven percent of the public believe the Democratic Party exclusively represents their views somewhat or very well, while roughly one-quarter (27%) say that only the Republican Party represents their views well. Close to one in four (22%) Americans say that their views on the issue of immigration are not well represented by either political party. Thirteen percent say both parties represent their views at least somewhat well.
In roughly equal numbers, white Americans say that only the Democratic Party (31%) or only the Republican Party (34%) represent their views well. Close to six in ten (58%) black Americans say that only the Democratic Party represents their views well. Forty-one percent of Hispanics also say their views are only well represented by the Democratic Party, while 16% say their views are only well represented by the Republican Party. However, nearly one-quarter (24%) of Hispanics say that neither political party represents their views on the issue of immigration.
More than six in ten (63%) Republicans say their views are well-represented by the Republican Party on immigration while nearly seven in ten (69%) Democrats say the same of their party. Republicans are slightly more likely than Democrats to say that neither party represents their views well on this issue (19% vs. 12%, respectively). Notably, while independents are somewhat more likely to say the Democratic Party rather than the Republican Party represents their views on the issue of immigration (31% vs. 20%, respectively), nearly one-third (32%) say their views are not well represented by either party.
VIII. Perceptions of Immigrants and their Impact
The Traits that Describe Immigrants
Americans largely agree that three traits describe immigrants well. More than eight in ten Americans say the phrase “hardworking” describes immigrants who are coming to the U.S. today either somewhat (47%) or very (36%) well. An identical number of Americans say “strong family values” describes immigrants somewhat (49%) or very (34%) well. But just about as many Americans say the idea that they “mostly keep to themselves” is a somewhat (58%) or very (21%) apt description of immigrants.
There is less consensus among Americans on other traits. A slim majority of Americans say “they make an effort to learn English” describes immigrants somewhat (38%) or very (13%) well. About seven in ten black (70%) and Hispanic Americans (67%) say making an effort to learn English describes recent immigrants well, but only about four in ten (43%) white Americans agree. A majority (55%) of white Americans say making an effort to learn English does not describe immigrants well. White college-educated Americans are more likely than white working-class Americans to say recently arrived immigrants make an effort to learn English (53% vs. 38%, respectively).
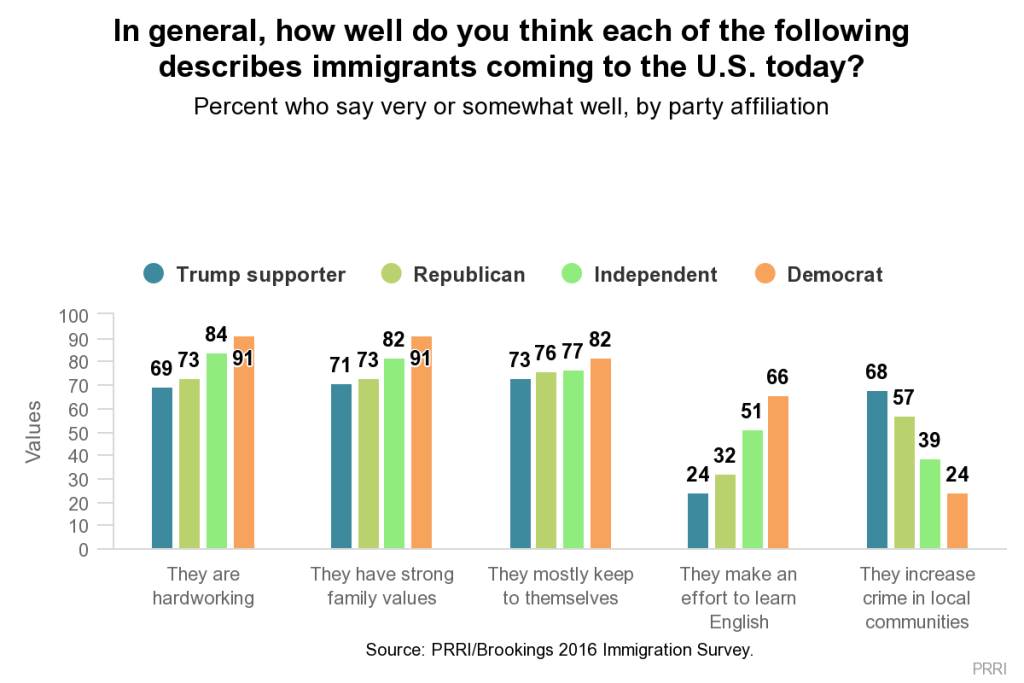 Four in ten Americans say the phrase “they increase crime in local communities” describes recent immigrants to the U.S. somewhat (30%) or very (10%) well. Nearly six in ten say increasing crime in communities describes immigrants not too well (40%) or not at all well (18%). While more than four in ten (43%) white Americans link increasing crime in local communities to new immigrants, only about three in ten blacks (32%) and Hispanics (30%) say the same. White college-educated Americans are substantially less likely than white working-class Americans to link recent immigrants with increased crime in local communities (31% vs. 52%, respectively).
Opinions about the attributes that best describe immigrants diverge strongly along party lines. Democrats are significantly more likely than Republicans to say immigrants are described well by the phrases “they make an effort to learn English” (66% vs. 32%, respectively), “they are hardworking” (91% vs 73%, respectively), and “they have strong family values” (91% vs. 73%, respectively). In contrast, Republicans are substantially more likely than Democrats to say increasing crime in local communities describes recent immigrants well (57% vs. 24%, respectively). Notably, more than two-thirds (68%) of Trump supporters believe that immigrants coming to the U.S. today increase crime in local communities.
Americans who report being more personally concerned about crime are more likely to believe that immigrants are a cause of it. Nearly half (49%) of Americans who say they are very worried that they or their family will be a victim of a violent crime say that immigrants are responsible for increasing criminal activity in local communities. In contrast, only 28% of Americans who are not at all worried about being a victim of crime share this opinion.
Economic Concerns about Immigrants
Immigrants: Strength or Burden?
Americans are closely divided over whether immigrants are more of a benefit or burden in our society. Close to half (47%) of Americans say immigrants today strengthen our country because of their hard work and talents, while 43% say immigrants are a burden on the country because they take jobs, housing, and health care.
White Americans express considerably more negative views of immigrants than non-white Americans. A slim majority (51%) of white Americans say immigrants are a burden on the country, compared to approximately one-third (34%) of black Americans and just one in five (22%) Hispanic Americans. Conversely, roughly six in ten (61%) blacks and about seven in ten (71%) Hispanics say immigrants strengthen the U.S., a view held by only 38% of white Americans.
The views of white Americans diverge sharply based on class background. More than six in ten (61%) white working-class Americans believe immigrants are a burden on the U.S., compared to roughly one in three (35%) white college-educated Americans. A majority (52%) of white college-educated Americans say immigrants actually strengthen the country, while only 28% of white working-class Americans say the same.
Attitudes about the contributions of immigrants also differ by party affiliation. About two-thirds (65%) of Republicans say immigrants constitute a burden on America because they take jobs, housing, and health care, while fewer than three in ten (27%) Democrats say the same. About two-thirds (64%) of Democrats say immigrants strengthen the country with their hard work and talents, a view held by only 26% of Republicans. Even compared to Republicans, Trump supporters express particularly negative views about the contributions of immigrants: eight in ten (80%) say immigrants are a burden on society.
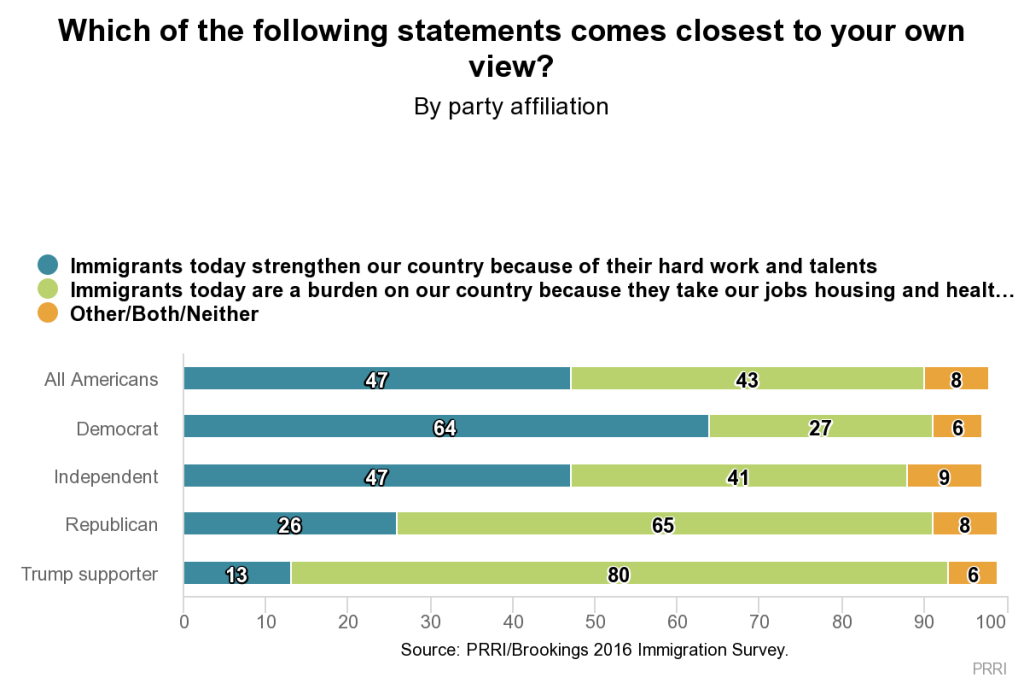 Religious groups are similarly divided over whether immigrants strengthen or burden America. A majority of members of white Christian groups, including white evangelical Protestants (63%), white mainline Protestants (57%), and white Catholics (53%), say immigrants are more of a burden on the country because they take jobs, housing, and health care. In contrast, a majority of religiously unaffiliated Americans (58%), black Protestants (60%), adherents of non-Christian religions (66%), and Hispanic Catholics (74%) believe immigrants strengthen the U.S.
Do Immigrants Take Jobs Away from American Workers or Fill Unwanted Jobs?
Americans overwhelmingly believe immigrants coming to America today generally take jobs that Americans don’t want. Nearly seven in ten (68%) Americans say new immigrants mostly take jobs Americans do not want, while just one-quarter (25%) of Americans believe these immigrants take jobs away from American citizens.
There is broad agreement about the impact that immigrants have on American jobs across racial and ethnic groups. Nearly nine in ten (87%) Hispanics say immigrants coming to the country today take jobs Americans don’t want, a view shared by nearly three-quarters (73%) of blacks and more than six in ten (63%) whites.
Class differences among whites are substantial, but even here a majority of white college-educated Americans (77%) and white working-class Americans (53%) say immigrants take unwanted jobs. Four in ten (40%) white working-class Americans say new immigrants take jobs away from American citizens.
On the issue of whether immigrants take American jobs there is rare bipartisan agreement. More than eight in ten (82%) Democrats believe immigrants coming to America today generally take unwanted jobs, a view also shared by a majority (56%) of Republicans. Importantly, Trump supporters differ significantly from Republicans overall: a majority (53%) of Trump supporters say immigrants take jobs from American citizens, compared to only four in ten (40%) who say immigrants are filling unwanted jobs.
Do Illegal Immigrants Provide Low Cost Labor or Drive Down Wages?
While Americans reject the notion that immigrants are taking American jobs, most believe illegal immigrants are hurting the economy by driving down wages. A majority (54%) of Americans say illegal immigrants mostly hurt the economy by driving down wages, while roughly four in ten (39%) Americans say illegal immigrants generally help the economy by providing low cost labor.
White and black Americans are considerably more likely than their Hispanic counterparts to say illegal immigrants harm the national economy. Six in ten (60%) white Americans and a majority (54%) of black Americans say illegal immigrants generally hurt the economy by driving down wages, compared to just one-third (34%) of Hispanic Americans. Approximately six in ten (61%) Hispanic Americans say illegal immigrants help the U.S. economy because they provide low cost labor.
Among white Americans, there are substantial class differences in attitudes about the economic impact of illegal immigrants. About seven in ten (71%) white working-class Americans say illegal immigrants harm the U.S. economy by depressing wages. White college-educated Americans are more divided: a plurality (49%) say illegal immigrants help the U.S. economy by providing low cost labor, while nearly as many (44%) say these immigrants hurt the economy.
Opinions about the impact of illegal immigrants on the economy also differ significantly by party affiliation. Seven in ten (70%) Republicans believe immigrants hurt the U.S. economy by driving down wages, while Democrats are almost evenly divided over whether immigrants hurt or help the economy (44% vs. 47%, respectively). Donald Trump supporters stand out for the extent to which they view illegal immigrants negatively: more than eight in ten (83%) Trump supporters say illegal immigrants are harming the economy by reducing wages.
Immigrants Changing Communities vs. the Country
Attitudes about immigrants do not appear to be driven by the effect they are having on local communities. Only about one in five (22%) Americans say immigrants are changing their local community and way of life a lot, while half (50%) say immigrants are changing the character and way of life of local communities a little. About one-quarter (26%) say immigrants are not having a discernible impact on their communities at all.
Americans are divided about whether immigrants are changing their communities for the better or for the worse. Among Americans who say immigrants are changing their local communities at least a little, about as many say this is a good thing (50%) as a bad thing (49%).
Notably, Americans are nearly twice as likely to say immigrants are changing American society as they are to say immigrants are changing their local communities. About four in ten (39%) say immigrants today are changing American society and way of life a lot, while about half (49%) say immigrants are changing American society a little, and just over one in ten (11%) say they are not changing society at all.
Again, Americans are evenly divided about whether the impact that immigrants are having on the U.S. is either good or bad. Among those who believe immigrants are changing American society at least a little, nearly half (48%) say the change is for the better, while about as many (50%) say it has been for the worse.
Nearly half (46%) of Hispanic Americans and fewer than four in ten white (39%) and black Americans (32%) say immigrants today are changing American society a lot. Notably, while Hispanics and whites do not differ much in their perceptions of how much immigrants have changed American society, they differ greatly in their perceptions of whether this change is a good thing. Among Hispanic Americans who say immigrants have changed American society, about seven in ten (72%) say this change is a good thing. However, among white Americans who say immigrants have impacted American society, nearly six in ten (58%) say this change is a bad thing.
The attitudes of white Americans differ modestly by social class. More than four in ten (43%) white working-class Americans say immigrants today are changing American society and way of life a lot, while about one-third (32%) of white college-educated Americans agree.
There are considerable partisan differences in perceptions about the degree to which immigrants are changing American way of life. A slim majority (51%) of Republicans say immigrants have changed American society and way of life a great deal, a view shared by approximately four in ten (39%) independents and less than three in ten (27%) Democrats. A majority (56%) of Democrats and half (50%) of independents say immigrants have changed American society only a little. Among Republicans who say immigrants have changed American society, nearly three quarters (74%) say it has been for the worse; in contrast, among Democrats who say immigrants have changed American society, 68% say it has been for the better. Trump supporters who believe immigrants are changing American society are even more emphatic that this is a bad thing, with 83% expressing this view.
Living in Communities with New Immigrants
Only 15% of Americans report that they live in a community that has a large number of recent immigrants. Roughly one-third (32%) say they live in an area with some new immigrants, while a majority (52%) say their community has only a few or almost no new immigrants. Republicans and Democrats as equally as likely to report living around a large number of recent immigrants; only 13% of Republicans, 15% of independents, and 16% of Democrats say they live in a community with many new immigrants.
Notably, Americans who live in communities with a high number of new immigrants are more likely than those who do not to view the economic contributions of illegal immigrants positively. Nearly half (49%) of Americans who live in communities with high numbers of recent immigrants say that illegal immigrants help the economy by providing low-cost labor, compared to about four in ten (44%) who say they hurt the economy by driving down wages. In contrast, Americans living in areas with almost no new immigrants are about half as likely to say illegal immigrants help the economy as they are to say immigrants hurt the economy (32% vs. 61%, respectively).
IX. Trade and Taxation
Is Free Trade Good or Bad?
Americans today believe that free trade agreements are more harmful than helpful to the U.S. economy. A majority (52%) of the public say that free trade agreements with other countries are mostly harmful because they send U.S. jobs overseas and drive down wages. Roughly four in ten (41%) say that free trade agreements are mostly helpful because they open new markets for U.S. companies and allow Americans to buy goods more cheaply.
Views about free trade diverge modestly by race and substantially by class. A majority (56%) of white Americans believe free trade is more harmful than helpful, while roughly four in ten (38%) say the opposite. Black Americans are evenly divided with as many saying these agreements are mostly helpful (48%) as mostly harmful (48%). A slim majority (52%) of Hispanic Americans say that free trade is mostly beneficial to U.S. economic interests, but a large minority (44%) take the opposing view. There are even larger differences by social class. More than six in ten (62%) white working-class Americans say free trade agreements are more harmful because they send jobs overseas and drive down wages. Fewer than half (46%) of white college-educated Americans agree.
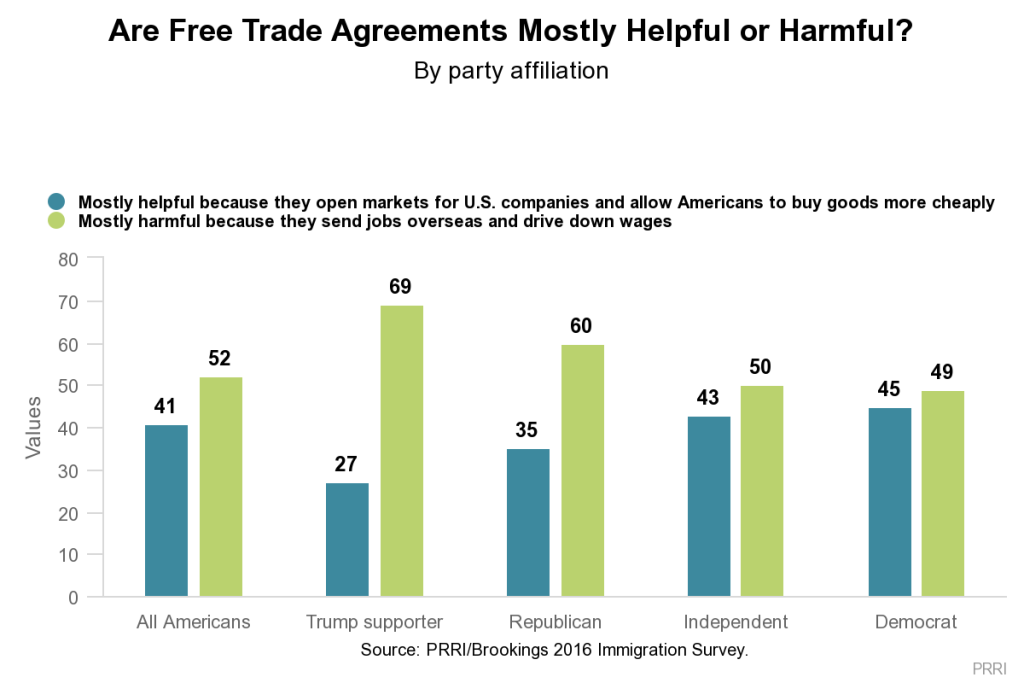 Today, Republicans express much more negative views about free trade agreements than Democrats. Six in ten (60%) Republicans say that free trade agreements are mostly harmful to the U.S., while only about one-third (35%) say they are mostly beneficial. In contrast, Democrats are closely divided, with about as many saying they are helpful (45%) as harmful (49%). The views of independents do not differ significantly from Americans overall. Trump supporters express even greater hostility to free trade agreements than self-identified Republicans: roughly seven in ten (69%) say these agreements are mostly harmful to the U.S.
There are also important regional differences in views about free trade. Americans living in the Midwest are the most dubious about the benefits of free trade agreements. Close to six in ten (57%) Midwesterners say free trade agreements are mostly harmful because they send jobs overseas and drive down wages; only 36% say these agreements are generally helpful. In contrast, Americans living in the Northeast are split over the perceived benefits and costs of free trade. Half (50%) of Northeasterners say free trade agreements are harmful while nearly as many say they are beneficial (46%). Americans living in the West and South mirror the general public in views about trade.
Taxing the Wealthy
Nearly seven in ten (69%) Americans support increasing the tax rate on wealthy Americans, compared to more than three in ten (31%) who oppose this policy. Current support for increasing the tax rate on wealth Americans represents a modest increase from 2012, when roughly six in ten (61%) Americans said they favored raising the tax rate on Americans with incomes in excess of $250,000 a year.
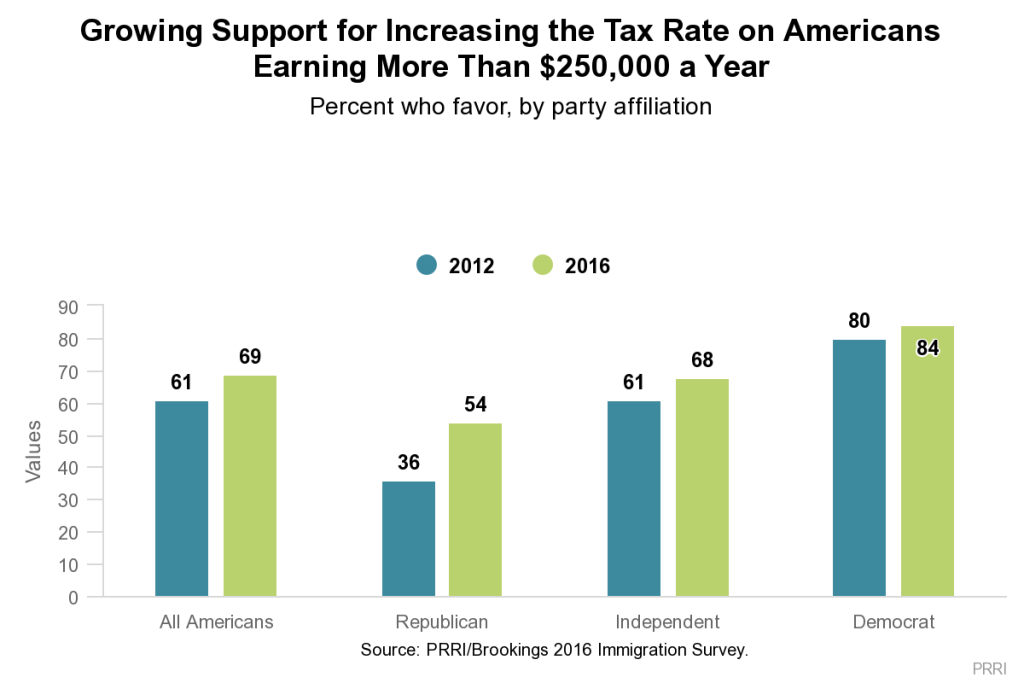 There has been a sea change in opinion among Republicans with regard to taxing the wealthy. Currently, a majority (54%) of Republicans express support for increasing the tax rate on Americans earning at least $250,000 a year—an 18-point increase from 2012. Independents and Democrats experienced only modest increases over this same period. More than two-thirds (68%) of independents favor a tax increase on the wealthy, compared to 61% who endorsed this idea in 2012. Eighty-four percent of Democrats favor an increase on Americans with annual incomes above $250,000, while 80% voiced support for this policy in 2012.
Recommended citation:
Jones, Robert P., Betsy Cooper, Daniel Cox, E.J. Dionne Jr., William A. Galston, and Rachel Lienesch. “How Immigration and Concerns about Cultural Change Are Shaping the 2016 Election: PRRI/Brookings Survey.” PRRI. 2016. http://www.prri.org/research/prri-brookings-poll-immigration-economy-trade-terrorism-presidential-race/.