The 2016 Election
Clinton Leads Trump Among Registered Voters
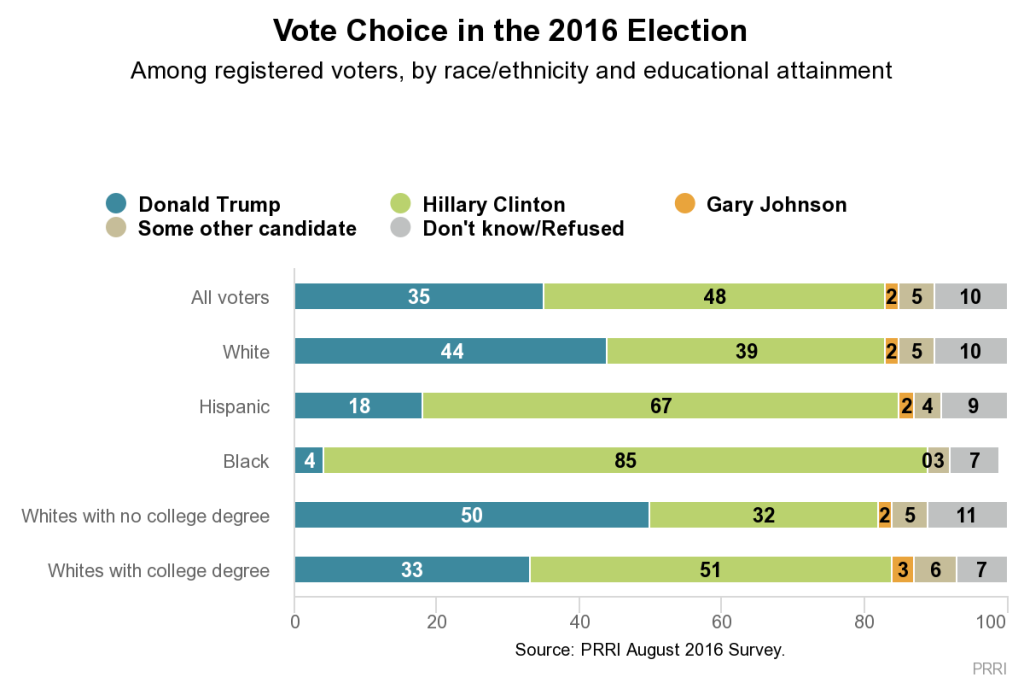
Hillary Clinton has a 13-point lead over Donald Trump among registered voters. Forty-eight percent of American voters say they would vote for Clinton if the election were being held today, compared to 35% who would vote for Trump. Two percent of voters volunteer that they would vote for Libertarian Gary Johnson, while another 5% volunteer that they would vote for some other candidate and 10% offered no opinion.
Clinton has stronger support among Democrats than Trump has among Republicans. Nearly nine in ten (88%) Democratic voters say they would vote for Clinton if the election were held today, while eight in ten (80%) Republican voters say they would vote for Trump. Among independent voters, Clinton leads Trump by seven points (40% vs. 33%, respectively); however, 4% of independent voters are supporting Johnson, 9% are supporting some other candidate, and 13% of independent voters offer no opinion.
Trump holds a five-point lead over Clinton among white voters (44% vs. 39%, respectively). Black and Hispanic voters, in contrast, strongly prefer Clinton over Trump. Two-thirds (67%) of Hispanic voters and 85% of black voters say they would vote for Clinton if the presidential election were held today, while fewer than one in five (18%) Hispanic voters and just 4% of black voters say they would vote for Trump.
There is, however, considerable division among white voters by educational attainment. Half (50%) of white voters without a college degree support Trump, compared to 32% who support Clinton. Among white voters with a college degree, the numbers are reversed; a slim majority (51%) of white voters with a college degree say they would vote for Clinton, compared to one-third (33%) who prefer Trump.
 Religious groups are divided by race and ethnicity, with white non-Hispanic Protestants leaning toward Donald Trump and all other religious groups leaning toward Hillary Clinton. A majority of white evangelical Protestant voters (62% Trump vs. 23% Clinton) and a plurality of white mainline Protestant voters (47% Trump vs. 37% Clinton) support Trump over Clinton.
Catholic voters are divided along racial and ethnic lines. White Catholic voters are closely divided but lean toward Clinton (44% Clinton vs. 41% Trump), while non-white Catholic voters overwhelmingly support Clinton over Trump (76% vs. 13%, respectively).
Majorities of every other major religious group support Clinton over Trump: religiously unaffiliated voters (55% vs. 24%, respectively) and black Protestant voters (89% vs. 2%, respectively).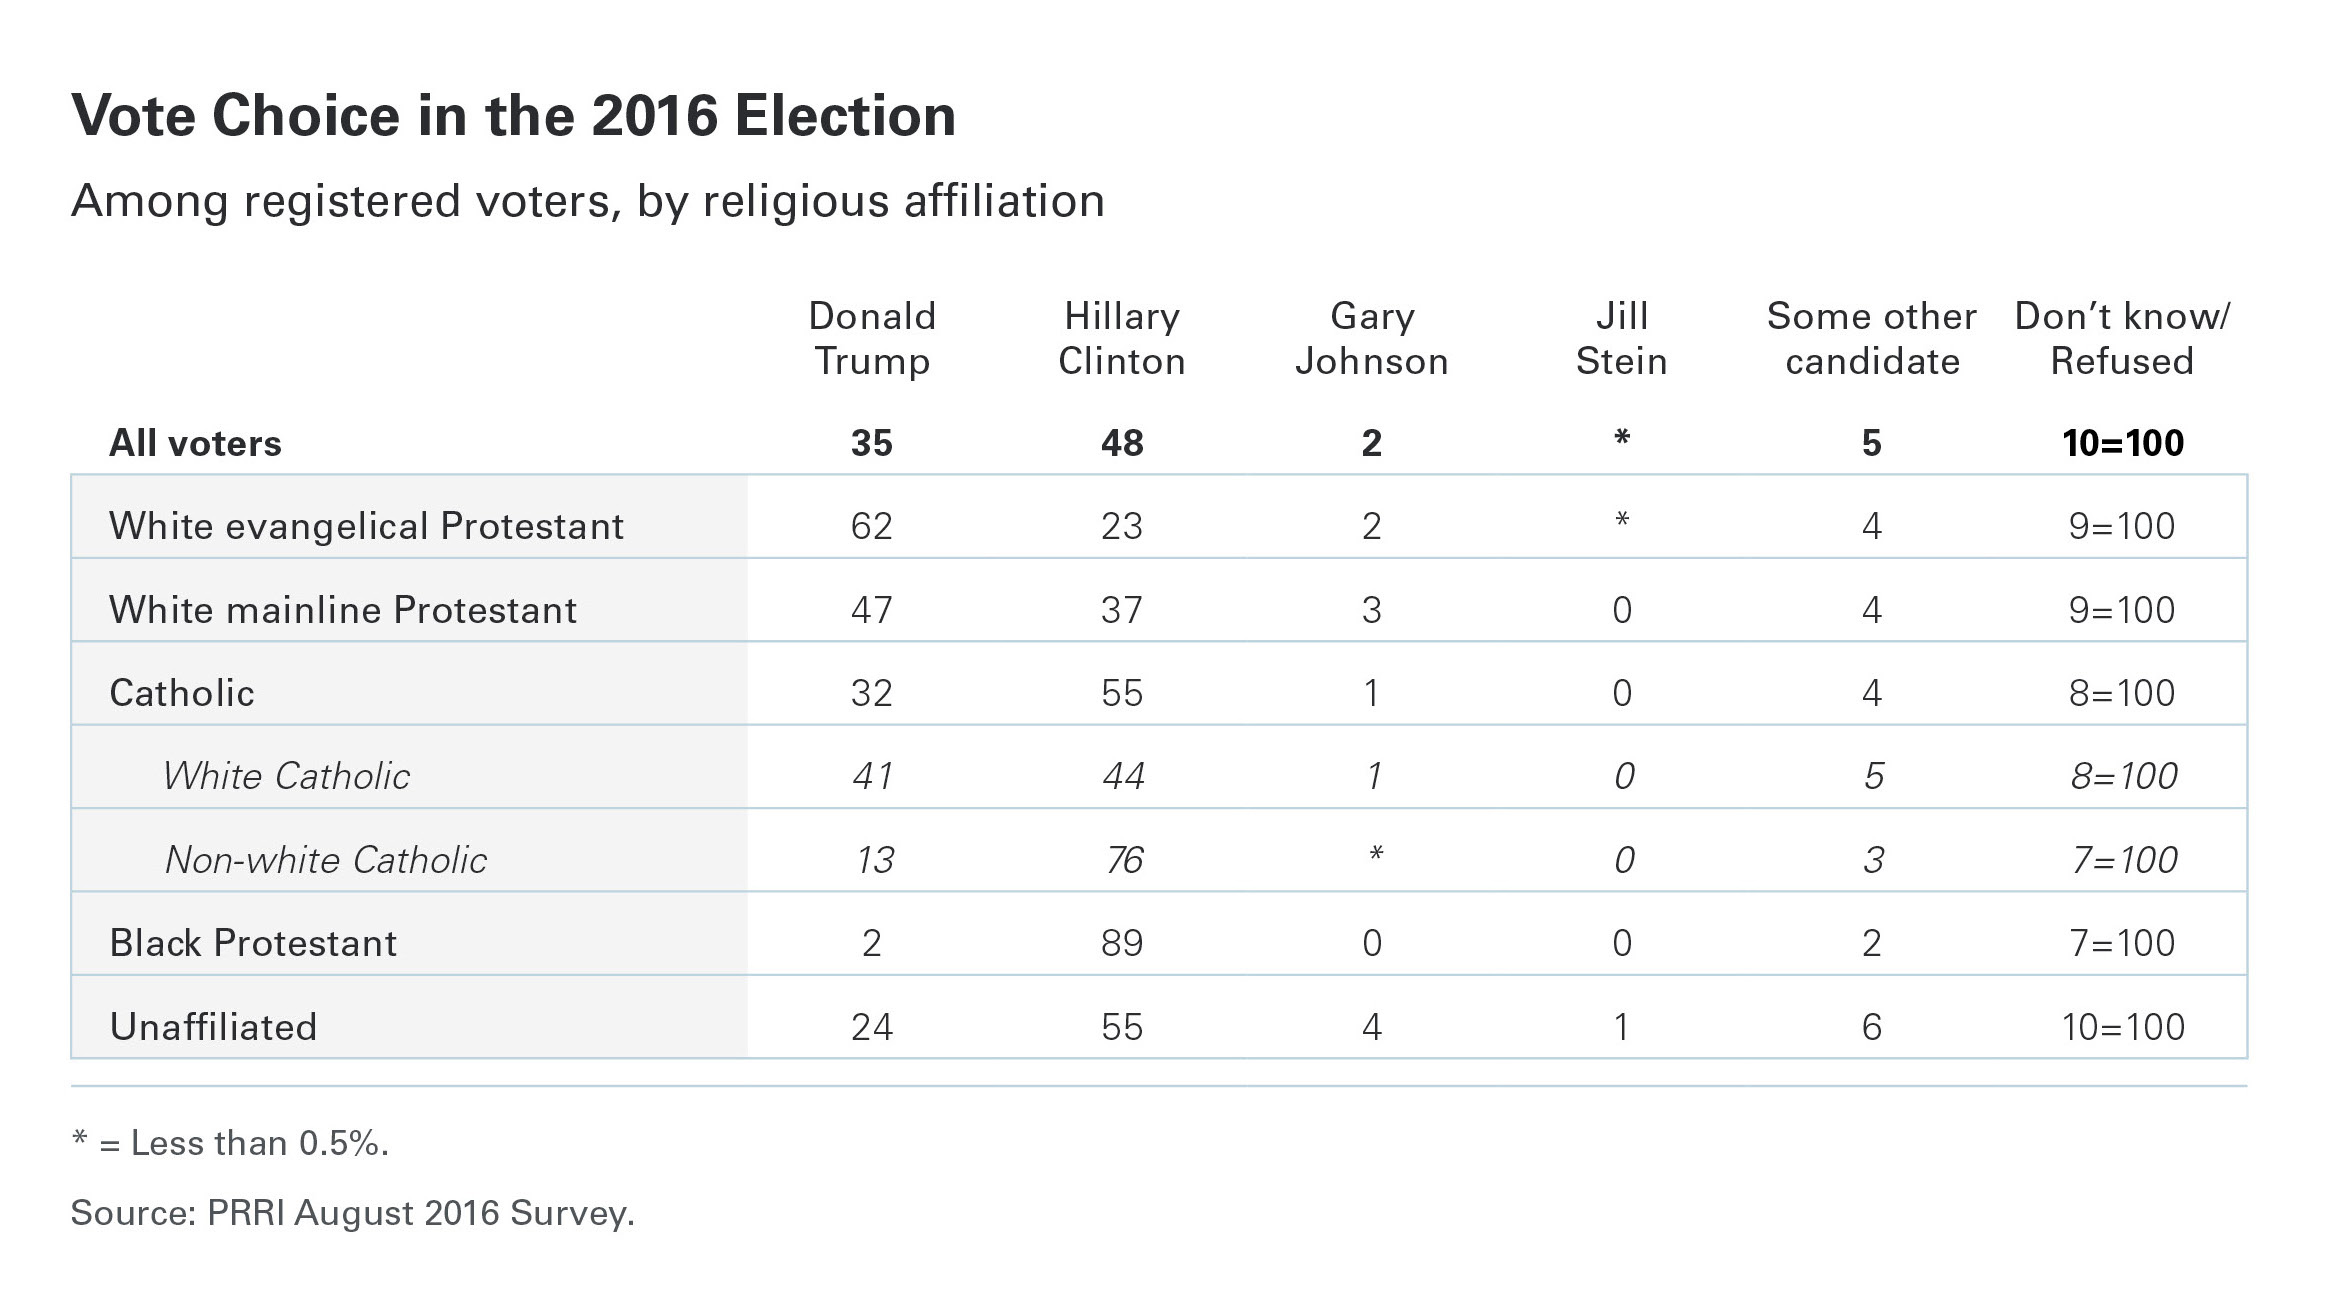 Candidate preference also varies significantly by age, though notably, Clinton is leading Trump in every single age bracket. Six in ten (60%) young adult voters (age 18 to 29) prefer Clinton, compared to only one-quarter (25%) who support Trump. Senior voters (age 65 and older) are more divided, with 45% supporting Clinton and 38% supporting Trump.
Gender differences in support for Clinton and Trump are also stark. Male voters are evenly divided between the two candidates: 43% support Clinton while 42% support Trump. Female voters, in contrast, prefer Clinton over Trump by a nearly two to one ratio. A majority (54%) of female voters express a preference for Clinton, compared to 28% who support Trump. Among white voters, Trump leads Clinton by 19 points among men (51% vs. 32%, respectively), but trails Clinton by 8 points among women (37% vs. 45%, respectively).
Do the Candidates Share Your Values?
Registered voters are more likely to say Hillary Clinton than Donald Trump shares their values, though neither candidate fares well on this question. More than four in ten (42%) voters say Clinton shares their values, while a majority (54%) say she does not. For Trump, the values deficit is even larger—only about three in ten (31%) voters say he shares their values, while nearly two-thirds (64%) disagree.
Democratic voters are significantly more likely to say Clinton shares their values (78%) than Republican voters are to say Trump shares their values (70%). Independent voters are about as likely to say Clinton (31%) shares their values as Trump (29%).
White voters are slightly more likely to say Trump than Clinton shares their values (38% vs. 34%, respectively). In sharp contrast, black voters (74% vs. 6%, respectively) and Hispanic voters (61% vs. 19%, respectively) are significantly more likely to say Clinton rather than Trump shares their values.
Notably, while white voters without a college degree see their values aligning more with Trump (43%) than with Clinton (28%), white voters with a college degree are much more likely to say Clinton (44%) rather than Trump (27%) shares their values.
Religious groups are also significantly divided in attitudes about both candidates’ values. White evangelical Protestant voters are the only religious group in which a majority (56%) say Trump shares their values; just 19% of white evangelical Protestant voters say Clinton shares their values. White mainline Protestant voters (38% vs. 36%, respectively) and white Catholic voters (38% vs. 38%, respectively), in comparison, are roughly equally as likely to say Trump as to say Clinton shares their values.
Among voters from every other major religious group—including black Protestants (79% vs. 5%, respectively), non-white Catholics (70% vs. 19%, respectively), and religiously unaffiliated voters (43% vs. 20%, respectively)—adherents are considerably more likely to say Clinton shares their values than to say Trump does.
Male voters are as likely to say Clinton (35%) shares their values as they are to say Trump (36%) does. Female voters, however, are almost twice as likely to say Clinton’s (47%) values align with their own as they are to say Trump’s (26%) do.
Hearing about the Election from Clergy
Very few voters report they are hearing about the election in religious services this year. Only about one in five (22%) voters who attend religious services at least once a month say the clergy at their place of worship have spoken out about the 2016 election at some point, while about three-quarters (76%) say their clergy have not done this.
Democrats are more likely than Republicans to report hearing about the election from a clergy member. About one-third (32%) of Democratic voters who attend religious services monthly say they have heard a clergy member at their place of worship discuss the election, compared to roughly one in five (19%) Republican voters who attend services monthly.
There is a significant racial gap on this issue. A majority (51%) of black voters who attend religious services at least once a month say a clergy member at their place of worship has discussed the presidential election, compared to just 16% of white voters who attend religiously services monthly. Additionally, white evangelical Protestant voters who attend religious services regularly (20%) are somewhat more likely than their white mainline Protestant (14%) and Catholic (13%) counterparts to report they have heard a clergy member at their place of worship speak out about the 2016 presidential election.
Changing Views on Same-sex Marriage
Growing Support for Same-sex Marriage
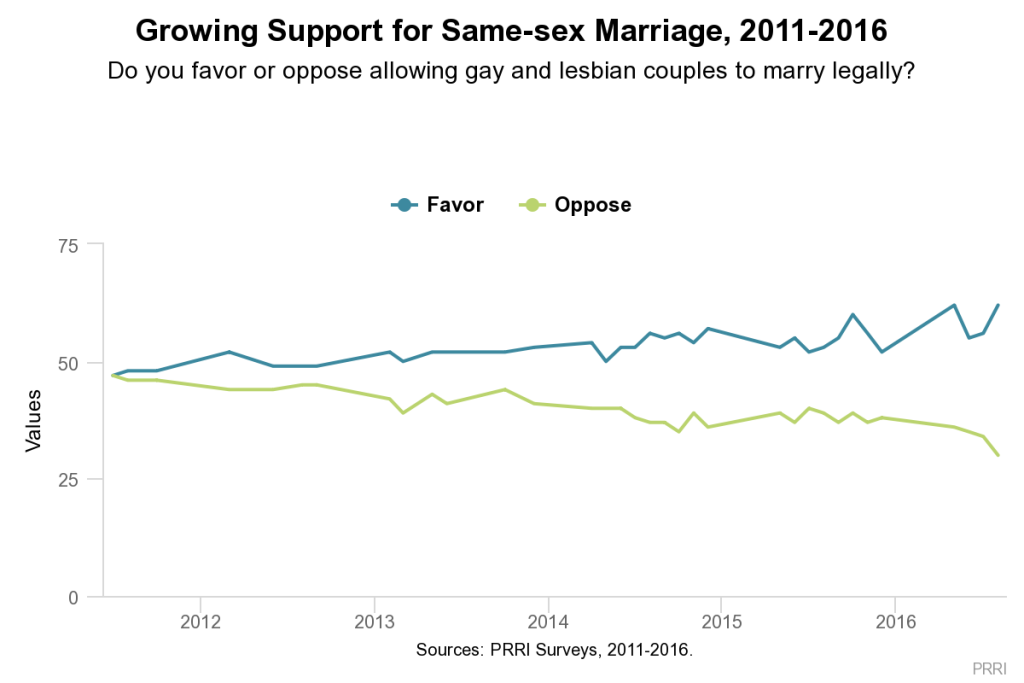
Today, more than six in ten (62%) Americans say they favor allowing gay and lesbian couples to marry legally, compared to just three in ten (30%) who say they are opposed. Support for same-sex marriage has increased rapidly in recent years. Just five years ago, in 2011, fewer than half of Americans (47%) said they favor same-sex marriage, while an identical number (47%) said they were opposed. And in 2003, just 32% of Americans expressed support for same-sex marriage, while nearly six in ten (59%) were opposed.
 Nearly three-quarters (73%) of Democrats favor same-sex marriage, compared to 43% of Republicans. Nearly half (49%) of Republicans are opposed to same-sex marriage. The views of independents closely mirror the views of Americans overall.
There are also significant differences in attitudes about same-sex marriage among religious groups. Approximately eight in ten religiously unaffiliated Americans (80%) and adherents of non-Christian religions (79%) favor same-sex marriage, as do about two-thirds of Catholics (68%) and white mainline Protestants (66%). Black Protestants are closely divided on the issue, with 44% who favor same-sex marriage and 40% who oppose it. Among white evangelical Protestants, by contrast, only 34% support same-sex marriage; nearly six in ten (59%) oppose it.
Compared to 2003, support for same-sex marriage has increased more among Catholics than among any other major religious group, increasing 33 percentage points from 35% in 2003. Support has increased 30 percentage points among white mainline Protestants from 36% in 2003. Support has also increased among white evangelical Protestants and black Protestants since 2003, though by a smaller margin. White evangelical Protestant support for same-sex marriage has risen 22 percentage points from 12% in 2003, while black Protestant support has risen 21 percentage points from 23% in 2003. The religiously unaffiliated—who currently express the strongest support for same-sex marriage—have had the smallest uptick in opinion on the issue. Support for same-sex marriage among religiously unaffiliated Americans has increased 15 percentage points from 65% in 2003.
Changing Personal Attitudes about Same-sex Marriage
Compared to their views five years ago, approximately one-quarter (26%) of Americans report they are now more supportive of same-sex marriage, compared to 6% who say they are now more opposed. Roughly two-thirds (66%) of Americans say their views about the legality of same-sex marriage have not changed in the past five years.
The number of Americans who say they have become more supportive of same-sex marriage has grown modestly in recent years. In 2011, Americans reported similar shifts in their attitudes over the previous five-year period. About one in five (19%) said they were more supportive of same-sex marriage than they had been five years ago, while about one in ten (9%) said they were more opposed and approximately seven in ten (71%) said their views had not changed.
Democrats are significantly more likely than Republicans to say their views about same-sex marriage have become more positive in recent years. More than three in ten (31%) Democrats say they are now more supportive of same-sex marriage than they were five years ago, while 7% say they are less supportive and about six in ten (61%) say their views remain unchanged. In contrast, fewer than one in five (17%) Republicans say they have become more supportive of same-sex marriage in the past five years. Nine percent of Republicans say they are less supportive and about three-quarters (73%) say their views have not changed from five years ago. Political independents express similar views to Americans overall.
Interestingly, Catholics (39%) are more likely than members of every other major religious group to say they have become more supportive of same-sex marriage over the past five years. Roughly three in ten religiously unaffiliated Americans (30%) and non-Christian religious Americans (28%), roughly one in five white mainline Protestants (22%) and black Protestants (22%), and just 14% of white evangelical Protestants also say they have become more supportive of same-sex marriage. Also of note, black Protestants (11%) and white evangelical Protestants (10%) are the most likely to say they have become less supportive of same-sex marriage than they were five years ago.
Conflicts Between Religious Views and Same-sex Marriage
Americans are also less likely today to see a conflict between same-sex marriage and their own religious beliefs. Today, only about four in ten (41%) Americans say same-sex marriage goes against their religious beliefs, down from 51% in 2013 and 62% in 2003.
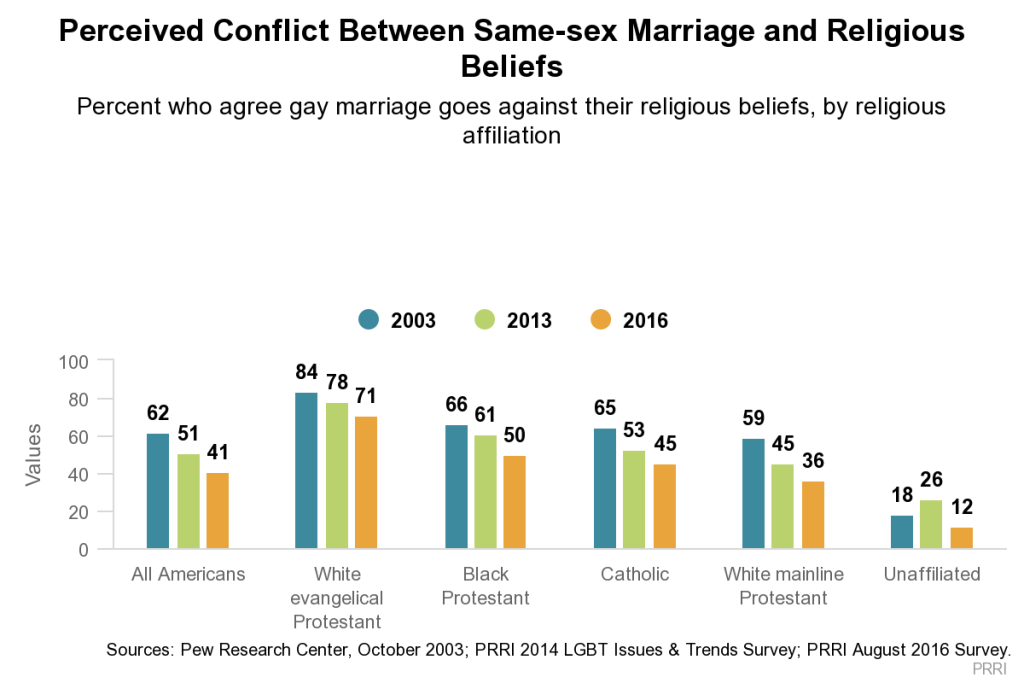 White evangelical Protestants are the most likely to see conflict, with more than seven in ten (71%) agreeing same-sex marriage goes against their religious beliefs. Black Protestants (50% agree, 47% disagree) and Catholics (45% agree, 50% disagree) are both closely divided on this question, with about as many saying same-sex marriage conflicts with their religious beliefs as saying it does not. At the other end of the spectrum, about six in ten adherents of non-Christian religions (58%) and white mainline Protestants (60%) and more than eight in ten (82%) religiously unaffiliated Americans say same-sex marriage does not go against their religious beliefs.
Social Acceptability of Support for Same-sex Marriage
About two-thirds of Americans say it is more socially acceptable to favor same-sex marriage (65%) in the U.S. today than to oppose it (23%). Attitudes on societal acceptance of same-sex marriage have shifted significantly since 2011, when a slim majority said it was more socially acceptable to favor same-sex marriage (51%) and more than four in ten said it was more socially acceptable to oppose it (43%).
There is widespread agreement that society is more accepting of people who favor same-sex marriage, with at least 50% of every major demographic, political, and religious group saying it is more socially acceptable to be in favor of same-sex marriage than to be opposed.
Same-sex Marriage and Support for Political Candidates
Consistent with the shifts in public opinion, opposition to same-sex marriage has become a potential liability for political candidates. A plurality (44%) of Americans say they would definitely not vote for a candidate who opposes same-sex marriage. Another 22% say they would consider voting for such a candidate, but with reservations. Only one in five (20%) Americans say they would definitely vote for such a candidate.
A majority (56%) of Democrats say they would definitely not vote for an opponent of same-sex marriage. Roughly equal numbers of Democrats say they would definitely (17%) vote for such a candidate or would do so with reservations (18%). In contrast, only one in five (20%) Republicans say they would definitely not vote for a candidate who opposes same-sex marriage. About three in ten (29%) of Republicans say they would vote for a candidate who opposed same-sex marriage with some reservations, and more than one-third (35%) of Republicans say they would definitely vote for such a candidate.
Other LGBT-Related Policies
LGBT Nondiscrimination Laws
There is broad, bipartisan support for LGBT nondiscrimination laws, with more than seven in ten (72%) Americans saying they favor laws that would protect gay, lesbian, bisexual, and transgender people against discrimination in jobs, public accommodations, and housing. Fewer than one-quarter (23%) of Americans oppose such laws. Support for these laws has remained steady for the last year and a half—in May of 2015, a nearly identical number (71%) expressed support for LGBT nondiscrimination laws.
Nearly eight in ten (78%) Democrats favor laws that would protect LGBT people from discrimination in jobs, public accommodations, and housing, compared to about six in ten (62%) Republicans. Majorities of all major religious groups also support LGBT nondiscrimination laws.
Notably, the overwhelming majority of Americans remain unaware that there is currently no federal law protecting LGBT Americans from discrimination in the workplace. Eight in ten (80%) Americans incorrectly believe it is currently illegal under federal law to fire or refuse to hire someone because they are gay, lesbian, bisexual, or transgender, while just 14% of Americans know it is currently legal to do so.
Laws about the Use of Bathrooms by Transgender People
A majority (53%) of Americans oppose laws that require transgender individuals to use bathrooms that correspond to their sex at birth rather than their current gender identity, compared to 35% who favor such laws.
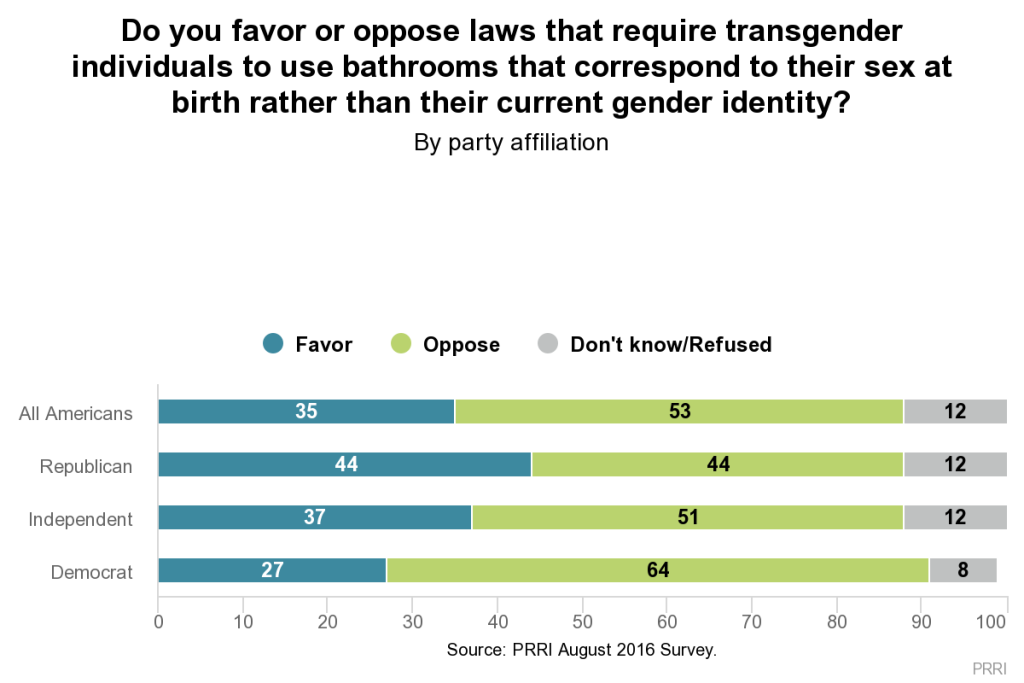 Nearly two-thirds (64%) of Democrats oppose laws that would require transgender individuals to use bathrooms that correspond to their assigned sex at birth, compared to 27% who favor such laws. Republicans, in contrast, are evenly divided (44% favor, 44% oppose) on this issue.
Religiously Based Refusals to Serve Gay or Lesbian People
By a roughly two to one margin, Americans oppose rather than favor allowing a small business owner in their state to refuse to provide products or services to gay or lesbian people if doing so violates their religious beliefs (63% vs. 30%, respectively). Attitudes on this policy are virtually unchanged from May of 2015, when 62% said they opposed allowing small business owners to refuse service to gay and lesbian customers on religious grounds.
Eight in ten (80%) Democrats oppose allowing small business owners to deny service to gay and lesbian individuals if doing so would violate their religious beliefs, while only about half as many Republicans (42%) express the same opinion. A majority (52%) of Republicans favor a policy that would allow religiously based service refusals.
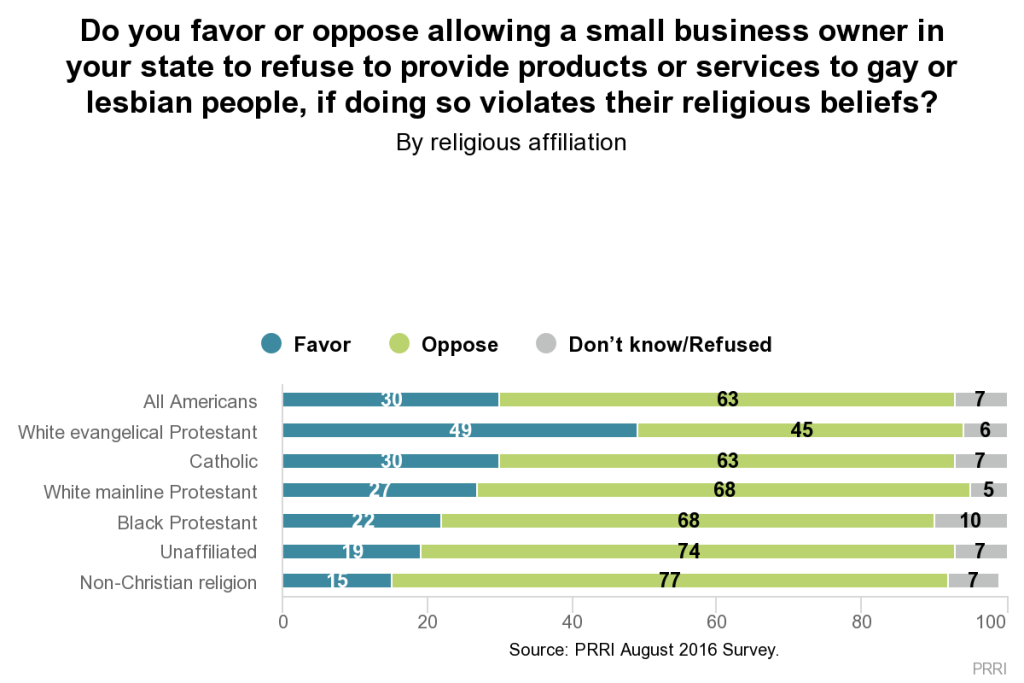 With the exception of white evangelical Protestants, majorities of every major religious group—including 68% of white mainline Protestants, 68% of black Protestants, 63% of Catholics, 77% of non-Christian religious Americans, and 74% of religiously unaffiliated Americans—oppose allowing small business owners to deny service to gay and lesbian individuals on the basis of their religious beliefs. White evangelicals, by contrast, are closely divided on this issue, with 45% opposing religiously based service refusals and 49% supporting them.
Perceptions of Discrimination Against LGBT People
More than six in ten Americans believe gay and lesbian people (61%) and transgender people (65%) face a lot of discrimination in the U.S. today. Similar numbers also say blacks (60%) and immigrants (66%) face a lot of discrimination today.
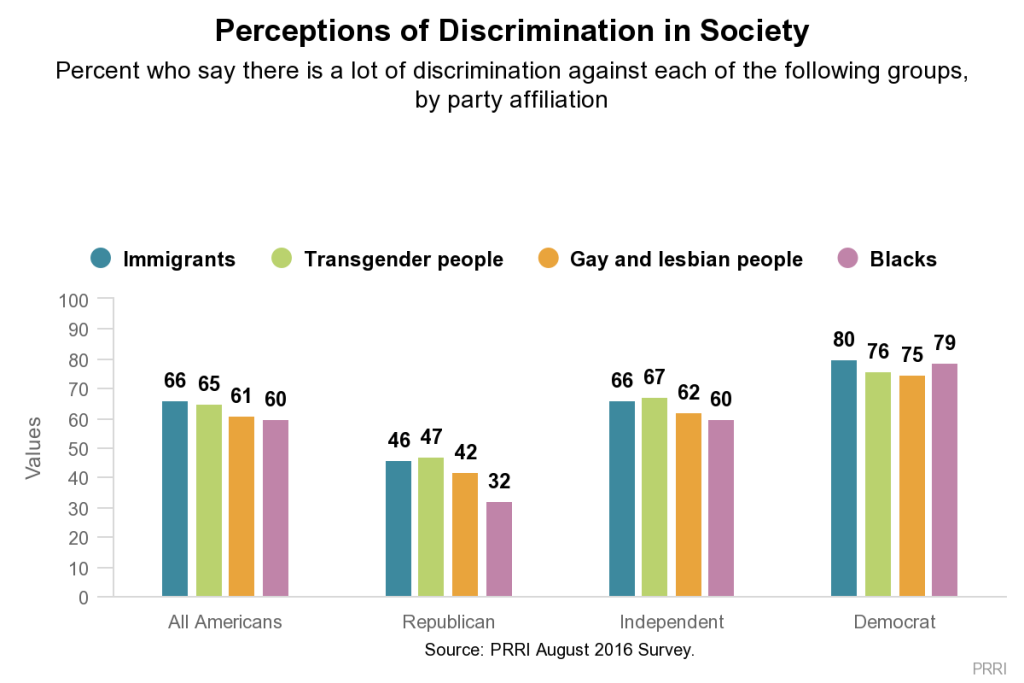 There are striking partisan differences in perceptions of discrimination. Approximately three-quarters of Democrats say there is a lot of discrimination against gay and lesbian people (75%), transgender people (76%), blacks (79%), and immigrants (80%). Notably, fewer than half of Republicans believe gay and lesbian people (42%), transgender people (47%), blacks (32%), or immigrants (46%) face significant discrimination. Independents’ attitudes on this issue mirror Americans overall.
Perceptions of Friendliness Toward LGBT People
The Friendliness of Political Parties Toward LGBT People
Americans of all stripes believe the Democratic Party is friendly towards LGBT people, but they are more divided in their perceptions of the Republican Party.
More than seven in ten (73%) Americans say the Democratic Party is at least somewhat friendly towards LGBT people, while 13% say the party is at least somewhat unfriendly towards the group. Notably, there are few differences on this across the political spectrum. At least seven in ten Democrats (82%), Republicans (77%), and independents (70%) perceive the Democratic Party as generally friendly to LGBT people.
Conversely, only one-third (33%) of Americans say the Republican Party is at least somewhat friendly to LGBT people; a slim majority (51%) of Americans say the Republican Party is at least somewhat unfriendly to LGBT people.
Notably, compared to all Americans, Republicans have a rosier view of their own party’s posture toward LGBT people. Six in ten (60%) Republicans say their own party is at least somewhat friendly towards LGBT people, while three in ten (30%) say it is at least somewhat unfriendly.
Friendliness of Religious Institutions Toward LGBT People
Americans overall do not perceive religious institutions to be friendly towards lesbian, gay, bisexual and transgender people. Notably, Catholics and white evangelical Protestants—but not white mainline Protestants—see their own institutions as at least somewhat friendly to LGBT people.
Almost half (49%) of Americans say the Catholic Church is somewhat or very unfriendly towards LGBT people, compared to 35% who say it is somewhat or very friendly to this group. Nearly one in five (17%) Americans do not provide an opinion on this issue. Catholics hold more positive views of their own church, with nearly half (49%) saying the church is friendly to LGBT people, compared to 45% who say the church is unfriendly to LGBT people.
Similarly, half (50%) of Americans say evangelical Christian churches are at least somewhat unfriendly to LGBT people, compared to only three in ten (30%) who say they are friendly. More than one in five (21%) people do not provide an opinion. A majority (53%) of white evangelical Protestants, by contrast, say their churches are at least somewhat friendly to LGBT people, while just over one-third (35%) say they are unfriendly.
Americans are less likely to say non-evangelical Protestant churches, such as mainline Protestant churches, are unfriendly toward LGBT people. Only four in ten (40%) Americans report non-evangelical Protestant churches are at least somewhat unfriendly to LGBT people, compared to roughly one-third (34%) who believe these kinds of churches are friendly. However, more than one-quarter (27%) of Americans say they do not know whether these non-evangelical Protestant churches are friendly to LGBT people or not. Among white mainline Protestants themselves, a plurality (43%) say non-evangelical Protestant churches are at least somewhat unfriendly to LGBT people, compared to roughly one-third (35%) who say they are friendly.
Places of Worship and Teachings about Homosexuality
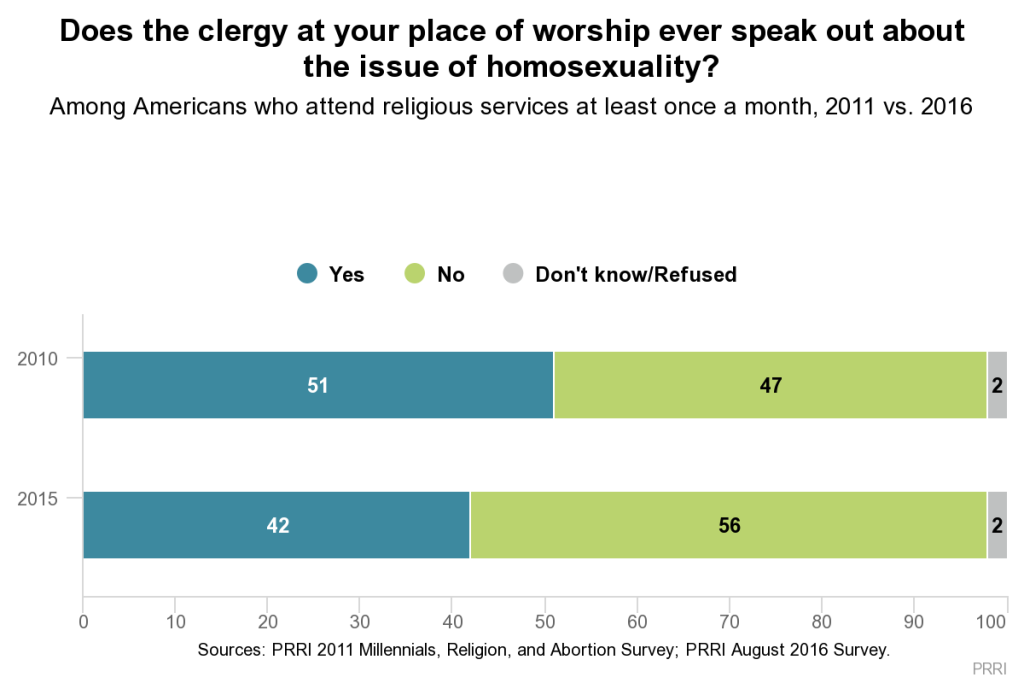
Compared to five years ago, fewer Americans today are hearing about the issue of homosexuality from their clergy, and among those who do, fewer are hearing negative messages. Among Americans who attend religious services at least a few times per month, only about four in ten (42%) report hearing their clergy speak out about homosexuality, compared to a majority (56%) who say their clergy do not speak about this issue. This represents a significant decline from 2011, when a slim majority (51%) reported their clergy had spoken out about homosexuality.
Americans who report hearing about homosexuality—and attend services regularly—are much more likely to report their clergy teach that homosexuality is morally wrong (60%) as opposed to teaching that it is morally acceptable (13%), but about one-quarter (24%) report that their clergy are not taking a position on the issue. This also represents a notable shift from 2011, when nearly eight in ten (77%) regular service attenders reported that their clergy were teaching that homosexuality is morally wrong, compared to only 5% who were teaching it is morally acceptable and 16% who were not taking a position.
 No religious group is more likely to hear about homosexuality from their clergy than black Protestants. 1 A majority (55%) of black Protestants who attend services monthly or more say they have heard their clergy speak out about this issue. At the other end of the spectrum, fewer than four in ten white mainline Protestants (38%) and Catholics (37%) say their clergy ever talk about this issue. Even among white evangelical Protestants, who hold the most conservative views on same-sex marriage, only 43% report hearing their clergy speak out on this issue.
1 Sample size is less than 100 (n=96). Interpret results with caution.
Immigration Reform Policy
The survey also tracked attitudes on how the immigration system should deal with immigrants who are currently living in the country illegally. Nearly two-thirds (64%) of Americans say immigrants who are living in the country illegally should be allowed to become citizens provided they meet certain requirements, 14% say they should be allowed to become permanent legal residents but not citizens, and 18% say these immigrants should be identified and deported. American attitudes on this question have been remarkably stable since 2013.
Nearly half (49%) of Republicans believe immigrants living in the country illegally should be allowed to become citizens provided they meet certain requirements, and 12% say they should be allowed to become permanent legal residents but not citizens. However, nearly four in ten (37%) Republicans support identifying and deporting immigrants who are in the country illegally. In contrast, nearly three-quarters (73%) of Democrats say illegal immigrants should be allowed to become citizens if they meet certain requirements, while 15% support permanent legal residency and just 8% opt for deportation. The views of independents on this issue mirror the views of Americans overall.
Recommended citation:
Jones, Robert P., Betsy Cooper, Daniel Cox, and Rachel Lienesch. “Majority of Americans Oppose Laws Requiring Transgender Individuals to Use Bathrooms Corresponding to Sex at Birth Rather than Gender Identity.” PRRI. 2016. http://www.prri.org/research/poll-lgbt-transgender-bathroom-bill-presidential-election/.