According to PRRI’s latest survey, support for same-sex marriage in America has risen by a full 21 points in the last decade, from 32 percent in 2003 to a full majority (53 percent) today. Which groups have led the way in affecting such a tidal wave of change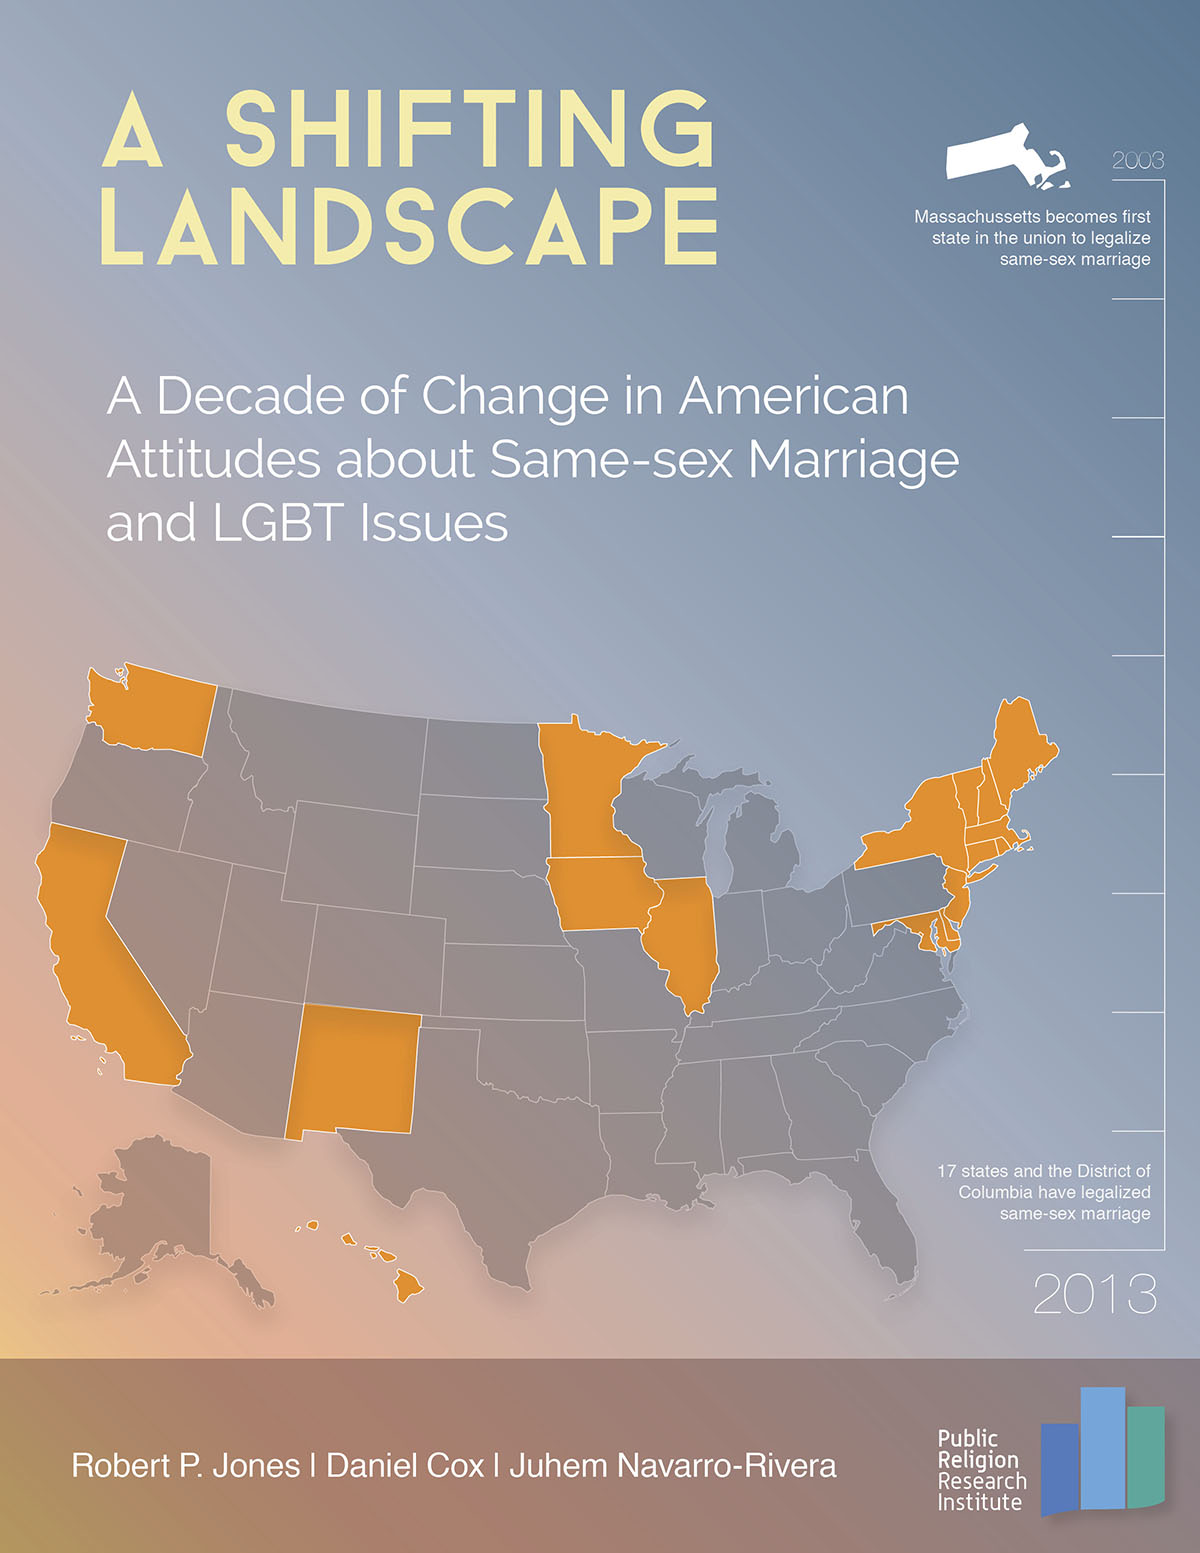 in public opinion?
Currently, same-sex marriage enjoys much stronger support from younger generations than older ones, though since 2003 Americans of all age groups have shown a substantial increase in support for allowing gay and lesbian couples to legally marry. Among Millennials, or Americans ages 18 to 33, 69 percent currently support same-sex marriage, marking a 24-point jump since 2003 when just 35 percent of Americans between the ages of 18 and 33 favored legalizing same-sex marriage. Americans between the ages of 34 and 48 showed a similar increase of 23 percentage points, from 32 percent in support in 2003 to 55 percent today. Baby Boomers (ages 49 to 67) showed a more modest uptick of 18 percentage points in support for same-sex marriage; 27 percent in 2003 vs. 45 percent today. Interestingly, the greatest change in support occurred among older Americans in the Silent Generation, those ages 68 and older, whose support more than tripled from from 2003 (12 percent) to 2013 (37 percent).
Women continue to lead men in support of same-sex marriage by a growing margin. In 2003, women were slightly more likely than men to support same-sex marriage (29 percent vs. 24 percent), while women today are significantly more likely to favor same-sex marriage than men (57 percent vs. 48 percent).
By religion, Jews and unaffiliated voters show overwhelming support for same-sex marriage, with 83 percent of Jews and 73 percent of the religiously unaffiliated in support. Other religious groups have shown dramatic increases during the last decade, with current Catholic support (57 percent) up 22 percentage points from 2003 (35 percent) and white mainline Protestant support (62 percent) up a whopping 26 points from 2003 (36 percent). Today, Hispanic Protestants (46 percent), black Protestants (35 percent), and white evangelical Protestants (27 percent) have a smaller proportion supporting same-sex marriage, notwithstanding notable increases among these groups as well.
Finally, education level continues to play a significant role in support for same-sex marriage, with higher levels of education correlated with higher support. Among Americans who’ve achieved post-graduate degrees today, roughly two-thirds (66 percent) support same-sex marriage, an increase of 15 points from 2003 (51 percent). Both college graduates (60 percent) and those who have had some college experience (57 percent) have crossed over into majority-support during the past decade, with 20 and 23 percentage point increases respectively. Individuals who hold a high school level education or less have also shown a substantial increase in support, up 22 percentage points from 2003 (24 percent) in 2013 (46 percent).