

Perceptions of Churches With Respect to LGBTQ People
Three in four (75%) church attenders agree that their church is generally welcoming and kind to everyone, including LGBTQ+ people. Large majorities of all religious groups agree, including 81% of white mainline Protestants, 80% of Black Protestants, 74% of white evangelical Protestants, 74% of other Protestants of color, 73% of other Christians, 72% of white Catholics, and 64% of Hispanic Catholics. There are no substantial partisan differences, either, as 76% of Republicans, 75% of independents, and 75% of Democrats agree that their church is welcoming and kind to all, including LGBTQ+ people.
There are no substantial race or education differences, but younger churchgoers are less likely than older ones to agree. Two-thirds of those age 18-29 (68%) agree that their church is welcoming and kind to all, including LGBTQ+ people, compared to 74% of those age 30-49, 74% of those age 50-64, and 79% of those age 65 and over.
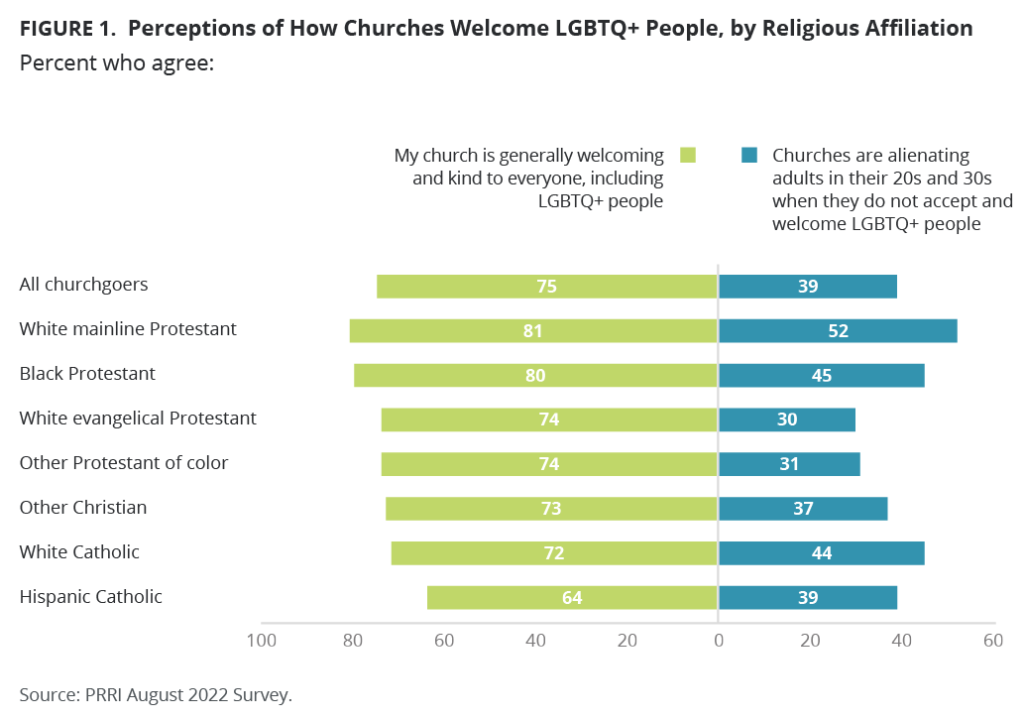
At the same time, churchgoers are less convinced that not welcoming LGBTQ+ people could be a negative. About four in ten (39%) agree that churches are alienating adults in their 20s and 30s when they do not accept and welcome LGBTQ+ people, while 55% disagree that alienation is a risk. A slim majority of white mainline Protestants (52%) agree that not accepting LGBTQ+ people alienates young adults, as do 45% of Black Protestants and 44% of White Catholics, 39% of Hispanic Catholics, and 37% of other Christians. Other Protestants of color (31%) and white evangelical Protestants (30%) are least likely to agree this could alienate people in their 20s and 30s.
There are also partisan divides on this question, as only 25% of Republicans agree, compared to 44% of independents and 56% of Democrats.
Interestingly, there is not a substantial age gap on this question, as those ages 18-29 (41%), 30-49 (38%), 50-64 (42%), and 65 and over (38%) are all similarly likely to agree that churches are alienating adults in their 20s and 30s when they do not accept and welcome LGBTQ+ people. There is also not a significant difference based on perception of their own church: among those who agree their church is welcoming and kind to LGBTQ+ people, 41% agree that churches are alienating young adults if they are not welcoming, compared to 40% among those who disagree that their church is welcoming and kind to LGBTQ+ people.
What Churchgoers Want To See in Church Regarding LGBTQ Issues
Prefer Not To Discuss Gender and Sexuality Issues
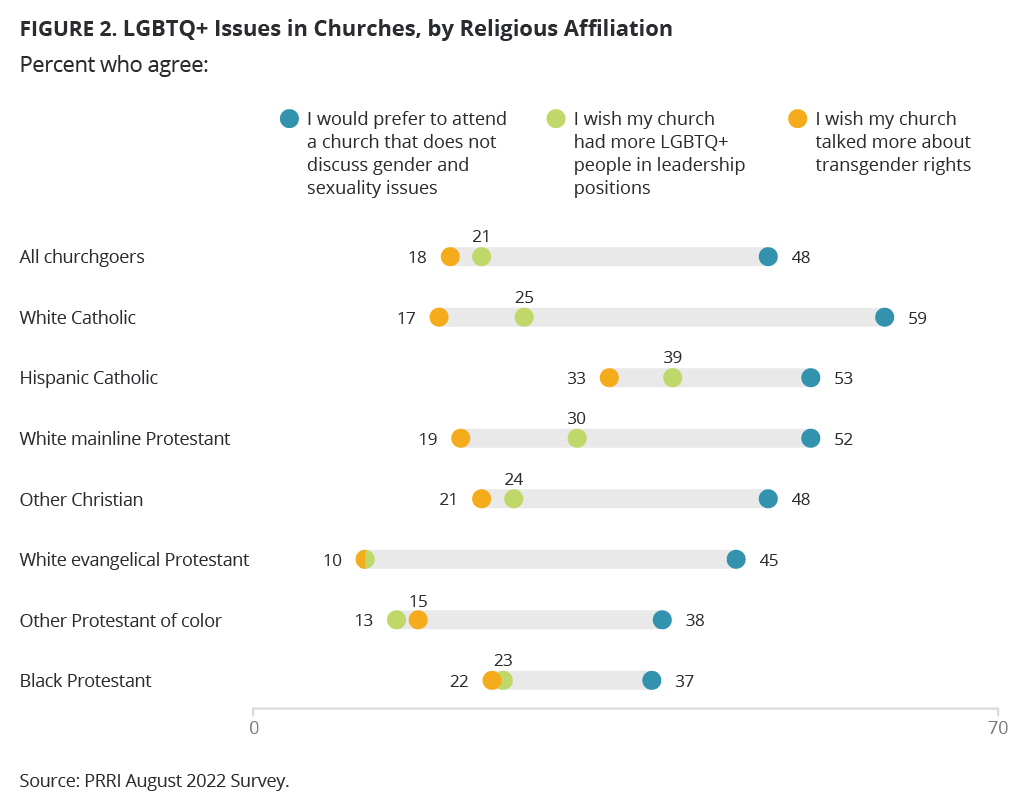
Although most they say they welcome LGBTQ+ people in their church, churchgoers are evenly divided on whether they prefer to attend a church that does not discuss gender and sexuality issues, with 48% agreeing and 48% disagreeing with the statement. Majorities of white Catholics (59%), Hispanic Catholics (53%), and white mainline Protestants (52%) agree they would rather attend churches that do not discuss these issues. Just under half of other Christians (48%) and white evangelical Protestants (45%) agree, compared to less than four in ten other Protestants of color (38%) and Black Protestants (37%).
A majority of Republicans (52%) and half of independents (50%) agree that they would prefer to attend a church that does not discuss gender and sexuality issues, while 41% of Democrats agree.
White churchgoers (51%) are more likely than Black (39%) and Hispanic (45%) churchgoers to agree with this statement. White churchgoers with a four-year college degree or higher education (45%) are less likely than those without a four-year college degree (54%) to agree that they would prefer to attend a church that does not discuss gender and sexuality issues. There are not large age differences on this question.
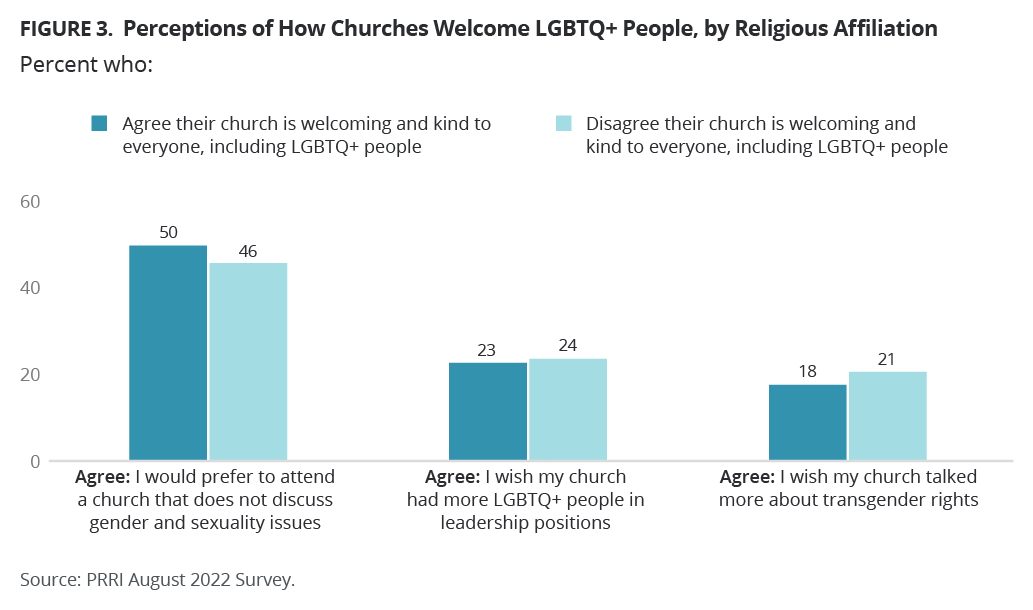
Those who agree their church is welcoming and kind to everyone, including LGBTQ+ people, are similarly likely as those who disagree that their church is welcoming and kind to everyone to agree that they would prefer to attend a church that does not discuss gender and sexuality issues (50% vs. 46%).
More LGBTQ People in Church Leadership
Most Christians who attend church at least a few times a year are not particularly interested in seeing more LGBTQ+ people in leadership in their church, as only 21% agree they would like to see this, while 72% disagree. Hispanic Catholics (39%) are more likely than any other group to agree that they wish their church had more LGBTQ+ people in leadership positions. Three in ten white mainline Protestants (30%) and about one in four white Catholics (25%), other Christians (24%), and Black Protestants (23%) agree. Only around one in ten other Protestants of color (13%) and white evangelical Protestants (10%) agree that they wish their church had more LGBTQ+ people in leadership.
There are considerable partisan divides as well, with 39% of Democrats agreeing that they would like to see more LGBTQ+ people in leadership in their church, compared to 23% of independents and 9% of Republicans.
Hispanic churchgoers (30%) and Black churchgoers (24%) are more likely to agree with this statement than white churchgoers (19%). White churchgoers with a four-year college degree or higher education (26%) are more likely than those without a four-year college degree (15%) to agree that they wish their church had more LGBTQ+ people in leadership positions.
Younger churchgoers, particularly those age 18-29 (33%), are more likely than churchgoers age 30-49 (22%), age 50-64 (21%), and age 65 and over (17%) to agree that they wish their church had more LGBTQ+ people in leadership positions.
Those who agree their church is welcoming and kind to everyone, including LGBTQ+ people, are equally likely as those who disagree that their church is welcoming and kind to everyone to agree that they wish their church had more LGBTQ+ people in leadership positions (23% vs. 24%).
More Discussion of Transgender Rights?
Most churchgoers also do not necessarily want their church to talk more about transgender rights. Less than one in five (18%) agree, while 78% disagree, that they wish their church talked more about transgender rights. Again, Hispanic Catholics (33%) are the most likely of these religious groups to agree with the statement, while 22% of Black Protestants, 21% of other Christians, 19% of white mainline Protestants, 17% of white Catholics, and 15% of other Protestants of color agree. Only 10% of white evangelical Protestants want their church to talk more about transgender issues.
Three in ten Democrats (31%) agree that they would like to see their church talk more about transgender issues, compared to 20% of independents and only 7% of Republicans.
Hispanic (25%) and Black (24%) churchgoers are more likely than white churchgoers (14%) to agree that they would like this discussion. White churchgoers with a four-year college degree or higher education (18%) are more likely than those without a four-year college degree (11%) to agree that they would like their church to talk more about transgender issues.
Younger churchgoers, particularly those age 18-29 (30%), are more likely than churchgoers age 30-49 (18%), age 50-64 (15%), and age 65 and over (14%) to agree that they wish their church talked more about transgender rights.
Those who agree their church is welcoming and kind to everyone, including LGBTQ+ people, are equally likely as those who disagree that their church is welcoming and kind to everyone to agree they would like their church to talk more about transgender issues (18% vs. 21%).
About the Sample
These results are from 2,374 churchgoers who are Christian and attend services, other than weddings and funerals, at least a few times per year. The religious makeup of the sample is 27% white evangelical Protestant, 16% white mainline Protestant, 16% white Catholic, 13% Black Protestant, 10% Hispanic Catholic, 6% Hispanic Protestant, 4% other Protestant of color, 4% Latter-day Saint, 3% Jehovah’s Witness, 2% other Catholic of color, and less than 1% Orthodox Christian. Due to sample sizes, categories reported are: white evangelical Protestant, white mainline Protestant, white Catholic, Black Protestant, Hispanic Catholic, other Protestant of color (including Hispanic Protestant), and other Christian (including other Catholic of color, Jehovah’s Witness, Latter-day Saint, and Orthodox).
Politically, 36% are Republican, 28% are Democrat, and 25% are independent.
This group resembles the country as a whole by education and race, but are a bit older than the general population, with 28% age 65 or over (vs.22% overall), 28% age 50-64 (vs. 26% overall), 29% age 30-49 (vs. 33% overall), and 15% age 18-29 (vs. 19% overall).


