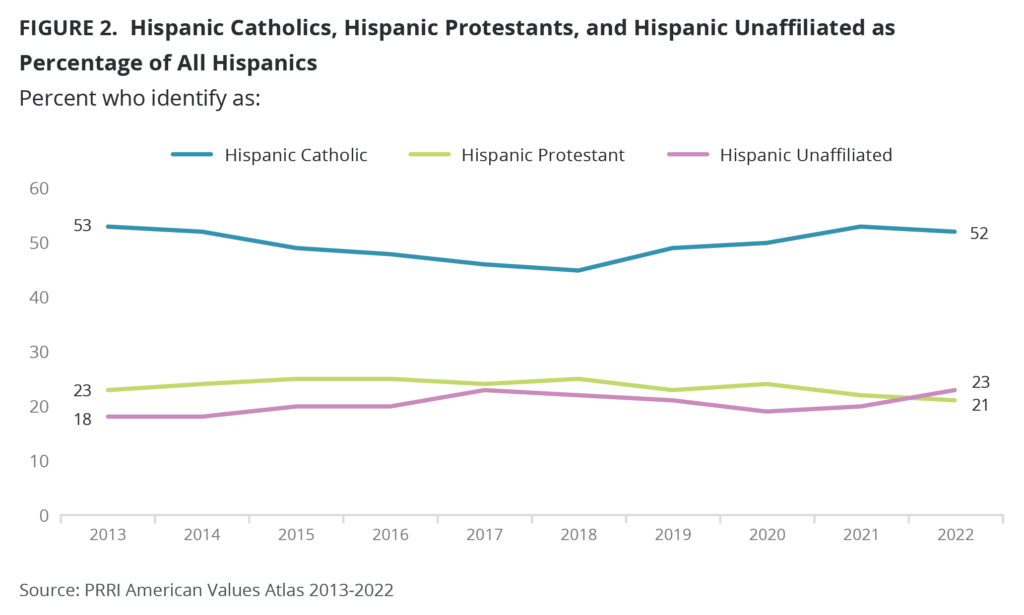
The percentage of Hispanic Americans who say they are adherents of Christianity has been declining as an increasing share of Hispanics identify as religiously unaffiliated. The PRRI American Values Atlas shows that religiously affiliated and unaffiliated Hispanics have made up less than 20% of the American population over the last decade.[1] Within the Hispanic population, about eight in ten (79%) identified as Christian in 2013, including 53% who were Catholics and 23% who were Protestant. Today, those numbers are slightly down, with 76% of Hispanics identifying as Christian, including 52% who identify as Catholic, and 21% who identify as Protestant. By contrast, 18% of Hispanics identified as religiously unaffiliated in 2013, but today that number is 23%. 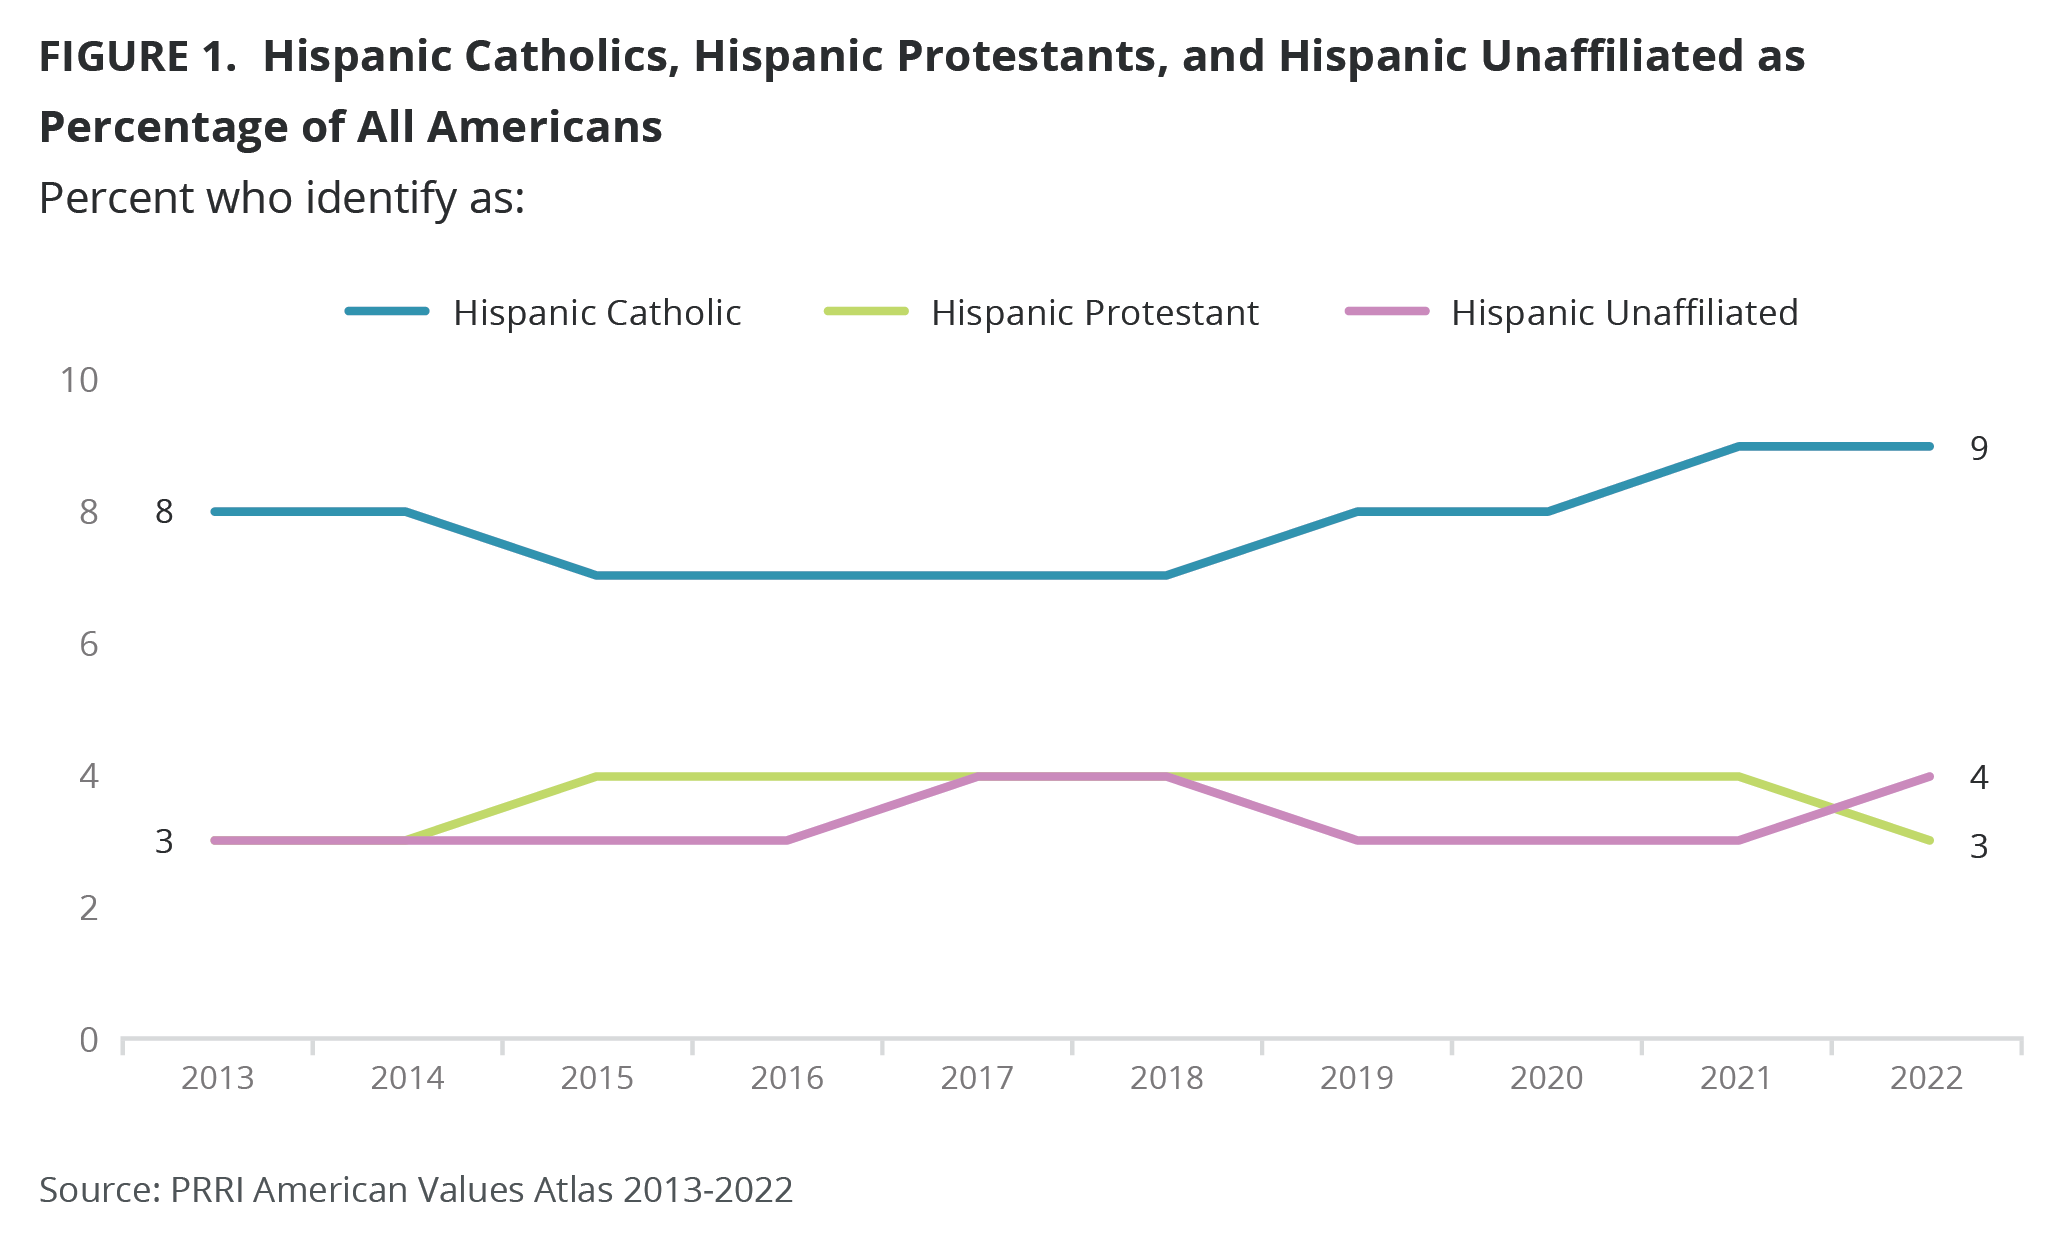
Hispanic Americans tend to be viewed as monolithic in their attitudes, yet the group’s members differ from one another in many significant ways, including in their views on LGBTQ rights. For example, Hispanic Christians tend to be more conservative in their views on this issue than unaffiliated Hispanics, and Hispanic Protestants are more conservative than Hispanic Catholics. Further, in 2022 12% of Hispanics identified as LGBTQ.
Views on Same-Sex Marriage
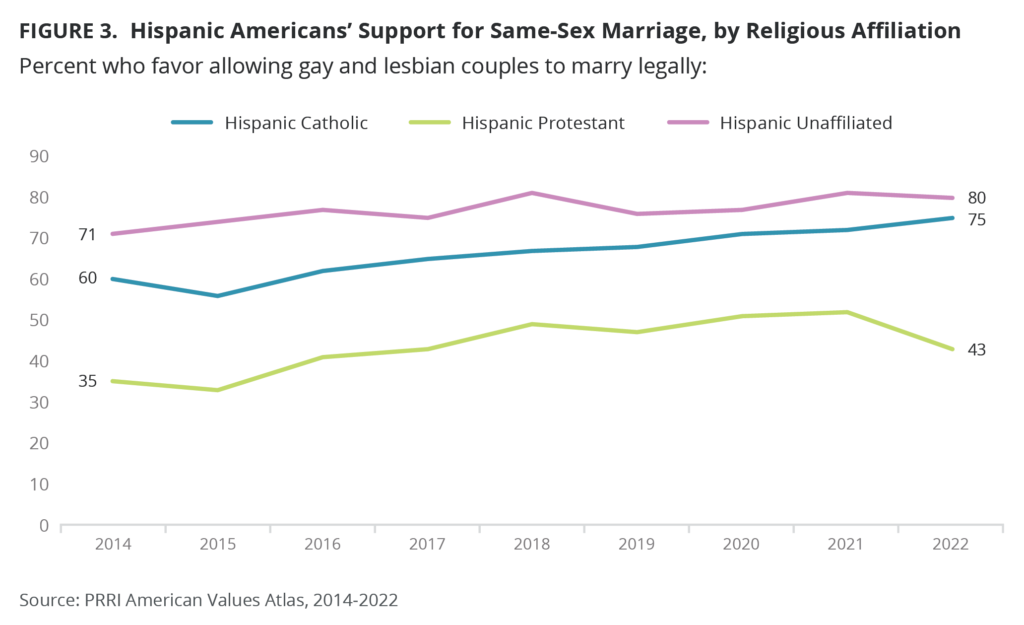
PRRI’s 2022 American Values Atlas shows that support for allowing same-sex couples the right to marry has increased among Hispanic Protestants, Hispanic Catholics, and religiously unaffiliated Hispanics since the question was first asked, in 2014. Hispanic Protestants reached their lowest level of support in 2015 (33%) and their highest level in 2021 (52%), before dropping again in 2022 (43%). Hispanic Protestants’ views on same-sex marriage are close to those of white evangelical Protestants (38%), but differ significantly from white mainline Protestants (77%), with Black Protestants (55%) falling in between.
Hispanic Catholics reached their lowest level of support for same-sex marriage in 2015 (56%), but support has increased every year since then, reaching to a high of 75% in 2022. Hispanic Catholics are identical to white Catholics (75%) in their support for same-sex marriage.
Among religiously unaffiliated Hispanics, a large majority have always supported same-sex marriage, starting with 71% in support in 2014, and rising to a high of 81% in 2018. And support has held steady at 80% over the past two years.
Support for Nondiscrimination Protections for LGBTQ People
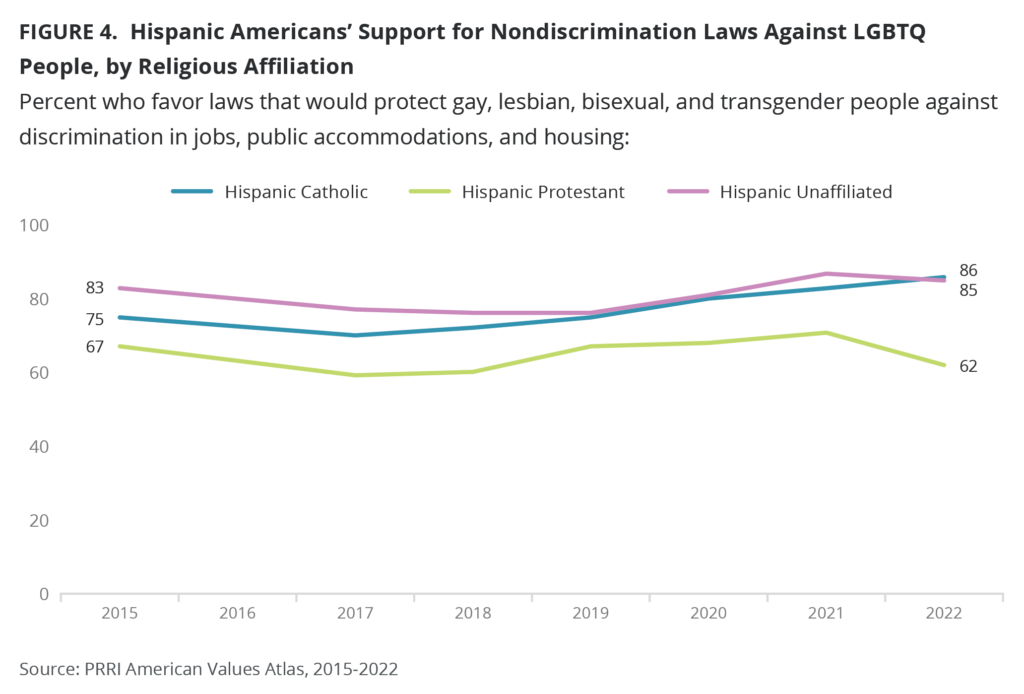
Strong majorities of Hispanic Protestants, Hispanic Catholics, and religiously unaffiliated Hispanics have supported nondiscrimination protections for LGBTQ people since 2015.
The highest levels of support were recorded for Hispanic Catholics (86%) in 2022 and for religiously unaffiliated Hispanics (87%) in 2021. Support hit a low among Hispanic Catholics in 2017 (70%), and among unaffiliated Hispanics in 2018 and 2019 (76%). Hispanic Protestants have consistently expressed lower levels of support for such protections than both Hispanic Catholics and religiously unaffiliated Hispanics, reaching their lowest level of support in 2017 (59%) and their highest level in 2021 (71%).
Most recently, in 2022, support for nondiscrimination protections was high among Hispanic Catholics (86%) and unaffiliated Hispanics (85%), but for Hispanic Protestants support dropped from its highest level, 71%, in 2021 to 62% in 2022 — the same as the level of support among white evangelical Protestants (62%). Black Protestants (79%), white mainline Protestants (83%), and white Catholics (82%) are notably more likely to support nondiscrimination laws than are Hispanic Protestants (62%).
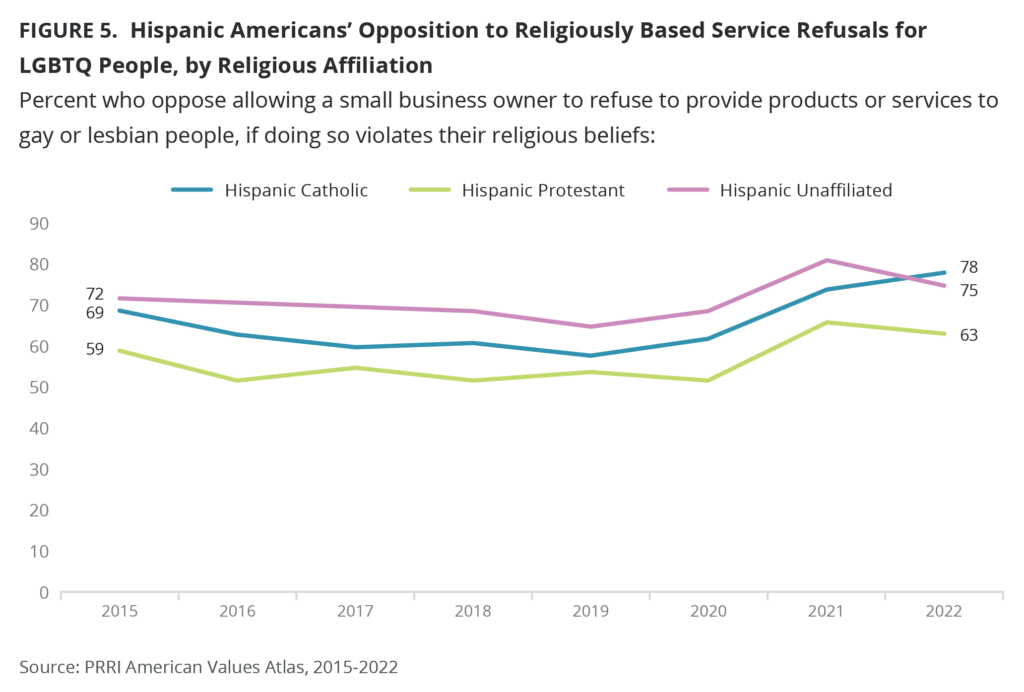
Opposition to Religiously Based Service Refusals for LGBTQ People
When looking at Hispanic Protestants, Hispanic Catholics, and religiously unaffiliated Hispanics, opposition to religiously based service refusals for LGBTQ people has increased a bit since 2015. Hispanic Protestants had their lowest levels of opposition in 2016 and 2018 (52%) and their highest in 2021 (66%). In 2022, 63% of Hispanic Protestants opposed religiously based refusals, about the same as the percentage of white mainline Protestants (62%), but significantly higher than the percentage of white evangelical Protestants (37%). Among all Protestant groups, Black Protestants (73%) are the most likely to oppose religiously based refusals for LGBTQ people.
Among Hispanic Catholics, the highest level of opposition to religiously based service refusals was recorded in 2022, at 78%, an increase from 69% in 2015. The lowest level of opposition among Hispanic Catholics was 58%, in 2019. In 2022, Hispanic Catholics (78%) are more likely than white Catholics (64%) to oppose religiously based refusals for LGBTQ people.
Among religiously unaffiliated Hispanics, the percentage of those who oppose religiously based refusals peaked in 2021, at 81%, and was at its lowest in 2019, at 65%. In 2022, 75% of religiously unaffiliated Hispanics opposed religiously based refusals for LGBTQ people, slightly higher than it was in 2015 (72%).
[1] Information for this section comes from a random sample of 40,000 respondents from the Ipsos KnowledgePanel as part of PRRI’s 2022 American Values Atlas.