

What Are Americans Worried About in the 2020 Election?
Voter Harassment and a Peaceful Transition of Power
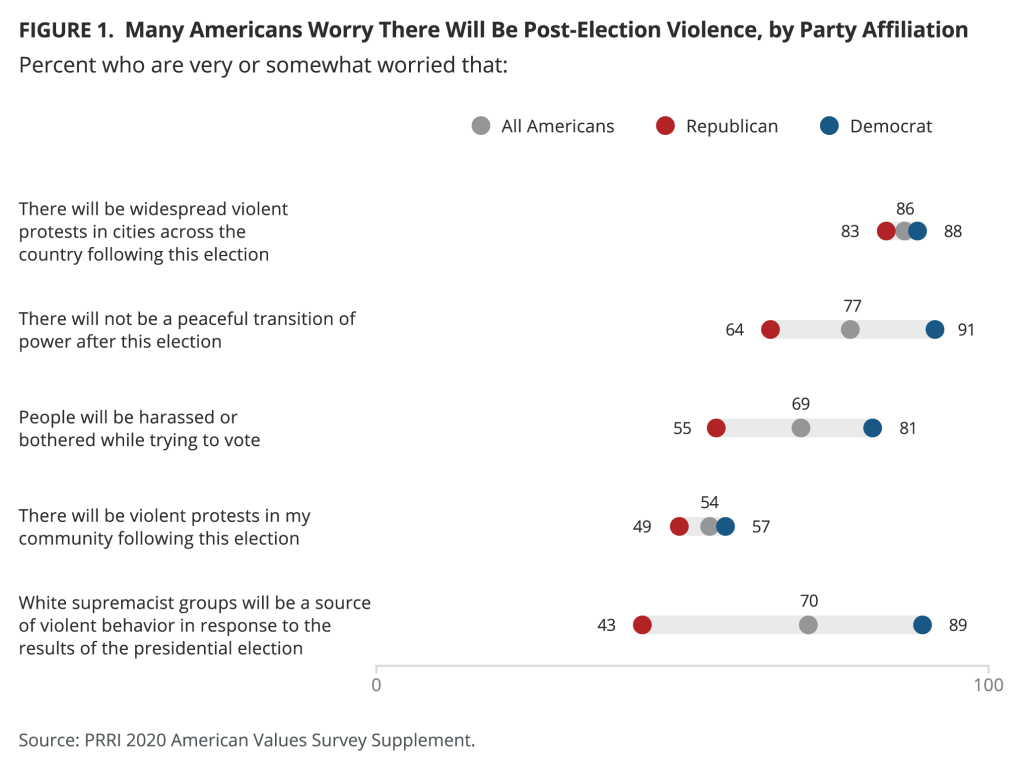
Nearly seven in ten Americans (69%) are somewhat or very worried that people will be harassed or bothered while trying to vote in the 2020 election. Democrats (81%) are much more likely to be worried about voter harassment than Republicans (55%). Hispanic Americans (71%), Black Americans (67%), and white Americans (68%) are similarly likely to be worried about voter harassment.
More than three in four Americans (77%) are somewhat or very worried that there will not be a peaceful transition of power after the election. Again, there are deep partisan divides, with nine in ten Democrats (91%), compared to nearly two-thirds of Republicans (64%), reporting that they are at least somewhat worried there will not be a peaceful transition of power.
Violence in the Aftermath of the Election
More than eight in ten Americans (86%) are somewhat or very worried that there will be widespread violent protests in cities across the country following this election. This issue transcends partisanship, with more than eight in ten Republicans (83%) and Democrats (88%) saying they are somewhat or very worried. Black Americans (74%) are less likely than white (89%) and Hispanic Americans (84%) to say that they are worried about widespread violent protests across the country.
Notably, Americans are less likely to say they are worried about violent protests in their community (54%) than in the country more broadly. Democrats (57%) are only marginally more worried than Republicans (49%) about protests in their community. There are only minor differences between Hispanic (63%) and Black (51%) or white (51%) Americans on this question.
Some of the deepest partisan divides come over worries about violence being perpetrated by white supremacists. Seven in ten Americans (70%) are somewhat or very worried that white supremacist groups will be a source of violent behavior. Less than half of Republicans (43%), compared to nearly nine in ten Democrats (89%), say they are at least somewhat worried about white supremacist groups perpetrating violence in the aftermath of the election.
What Do Americans Want From Religious Leaders in the 2020 Election?
Speaking Out to De-escalate Anger and Encourage Peaceful Protests
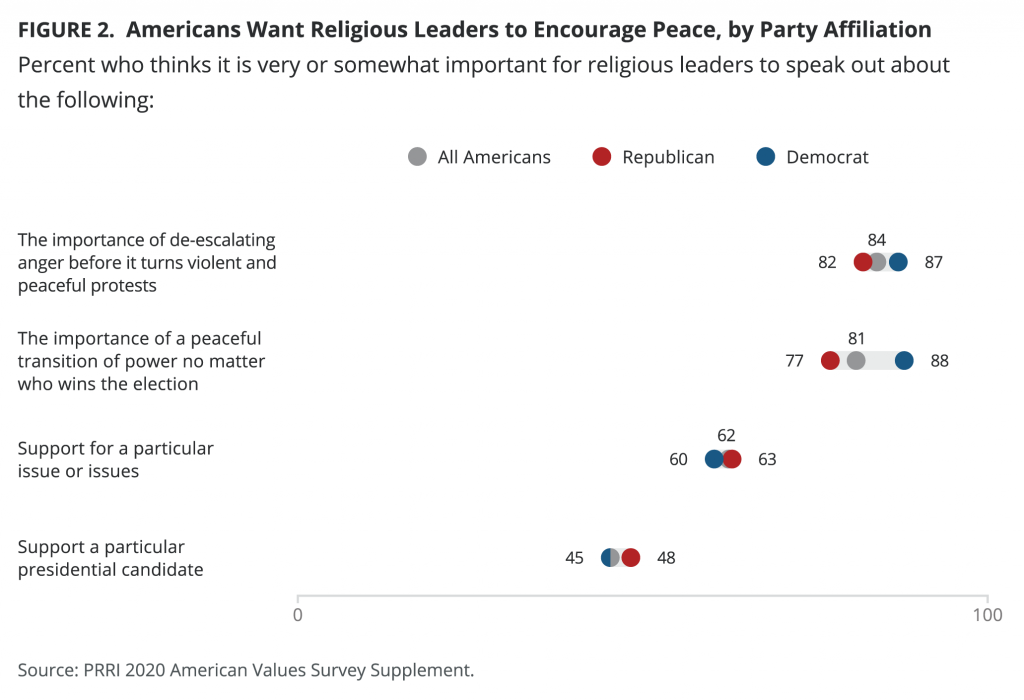
More than eight in ten Americans say it is somewhat important (24%) or very important (60%) for religious leaders to speak out to help de-escalate anger before it turns violent and encourage peaceful protests.
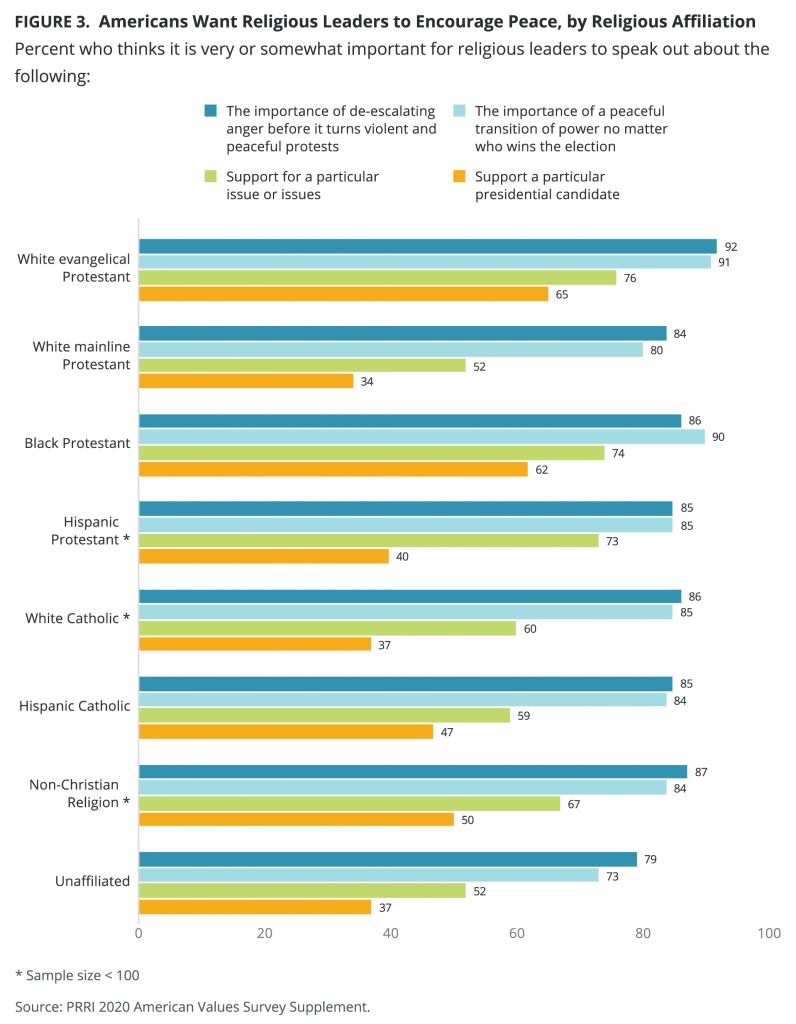
More than eight in ten Democrats (87%), Republicans (82%), and independents (82%) say it is important for religious leaders to help de-escalate anger before it turns violent and encourage peaceful protests. Overwhelming majorities of all religious groups agree, including white evangelical Protestants (92%), Black Protestants (86%), white Catholics (86%), and white mainline Protestants (84%). Religiously unaffiliated Americans (79%) are less likely than religious Americans to say it is important for religious leaders to play this role, but support nonetheless remains high.[1]
Speaking Out to Encourage a Peaceful Transition of Power
More than eight in ten Americans also say it is somewhat important (23%) or very important (58%) for religious leaders to speak out about a peaceful transition of power regardless of who wins the election.
Even though majorities of partisans say it is somewhat or very important for religious leaders to speak out about the importance of a peaceful transition of power no matter who wins the election, notably, Democrats (88%) are more likely than Republicans (77%) or independents (78%) to say so.
Large majorities of all religious groups say it is somewhat or very important for religious leaders to talk about the importance of a peaceful transition of power. Nine in ten white evangelical Protestants (91%) and Black Protestants (90%), eight in ten or more white Catholics (85%) and white mainline Protestants (80%), and nearly three in four religiously unaffiliated Americans (73%) agree.
Speaking Out to Support Issues or Candidates
Approximately six in ten Americans think it is somewhat important (36%) or very important (26%) for religious leaders to speak out about supporting a particular issue.
Partisans largely agree on this issue. Majorities of Republicans (63%), Democrats (60%), and independents (59%) think that it is somewhat or very important for religious leaders to speak about supporting a particular issue.
However, there are differences by religious affiliation. While strong majorities of white evangelical Protestants (76%) and Black Protestants (74%) believe it is important for clergy to express support for particular issues, fewer white mainline Protestants (52%) and white Catholics (60%) say it is important. White evangelical Protestants in particular stand out as more likely to say that it is very important (46%) that religious leaders support a particular issue or issues, compared to 11% of white mainline Protestants, 23% of white Catholics, and 24% of members of non-Christian religious groups.[2]
By contrast, less than half of Americans believe it is somewhat important (29%) or very important (16%) for religious leaders to support a particular presidential candidate; a majority of Americans think it is somewhat unimportant (22%) or very unimportant (32%).
There are no significant partisan differences on this question. Less than half of Republicans (48%), Democrats (45%), and independents (41%) think that it is important for religious leaders to speak about supporting a particular presidential candidate.
There are, however, stark differences by religious affiliation. White evangelical Protestants (65%) and Black Protestants (62%) both stand out as more likely than other religious groups to say it is important that religious leaders speak out about supporting a particular candidate. None of the other religious groups reach majority support for this question: Hispanic Catholics (47%), Hispanic Protestants (40%), white Catholics (37%), religiously unaffiliated Americans (37%), and white mainline Protestants (34%).[3]
How Are Americans Planning to Vote in the 2020 Presidential Election?
Among all Americans, 52% say they are voting for Joe Biden for president, including 4% who are uncertain but lean toward Biden, compared to 36% who say they are voting for Donald Trump, including 3% who are uncertain but lean toward Trump.
Given the ongoing coronavirus pandemic, there is considerable uncertainty about how many Americans will turn out to vote. PRRI developed two likely voter models to measure potential support for each candidate under two turnout scenarios.[4] If voter turnout looks similar to that of 2016 (55% turnout), Biden leads Trump by 14 percentage points (54% vs. 40%). If voter turnout is much higher (70% turnout), Biden leads Trump by 18 percentage points (56% vs. 38%).
Partisans align as expected. Democrat who are likely to vote are nearly universal in their choice of Biden (98%) over Trump (1%), while Republicans are a bit weaker in their support, with 88% for Trump and 8% for Biden. Independents skew heavily toward Biden (54%) over Trump (32%). By race, white people who are likely to vote are roughly evenly divided between Trump (47%) and Biden (46%). Hispanic voters prefer Biden (64%) over Trump (33%), and more than eight in ten Black voters (86%) prefer Biden over Trump (7%). [5]
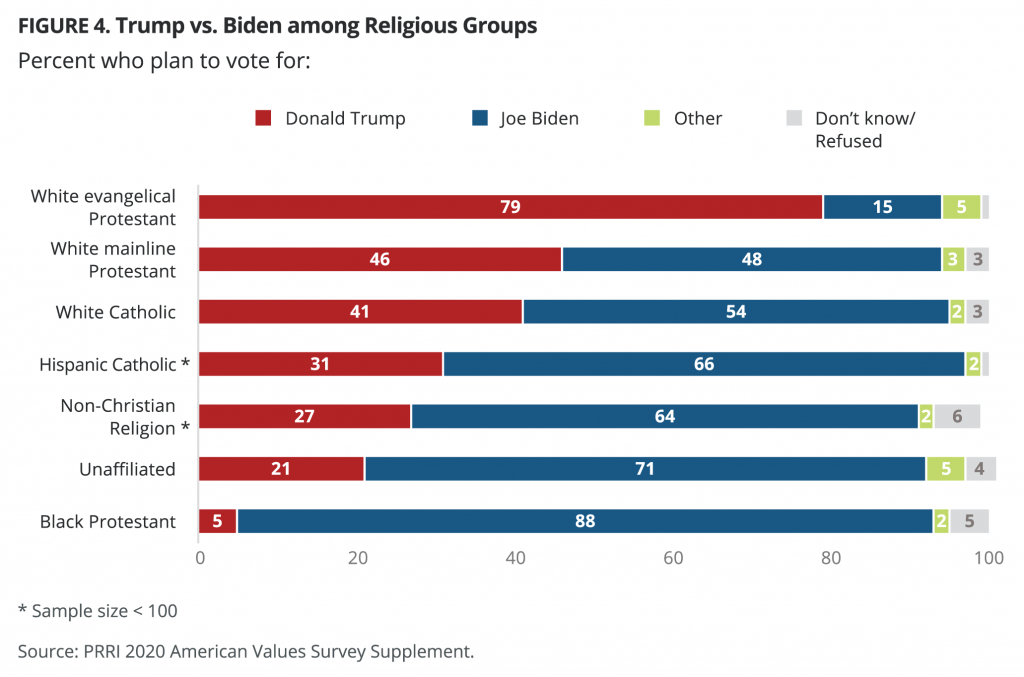
Among religious groups, white evangelical Protestants are by far the most pro-Trump. In the large turnout likely voter model (70%), nearly eight in ten (79%) report that they plan to vote for Trump, compared to 15% for Biden. White mainline Protestants are evenly divided (46% for Trump vs. 48% for Biden), and white Catholics are leaning more toward Biden than Trump (54% for Biden vs. 41% for Trump). Religiously unaffiliated Americans and Black Protestants are heavily skewed toward Biden over Trump (71% vs. 21% and 88% vs. 5%, respectively). The sample sizes of other religious groups are too small to report. [6]
The underlying dynamics of Trump’s support have shifted significantly since 2016. About seven in ten Trump supporters (71%) say their vote is more for Trump than against Biden, while 28% say their vote is more against Biden than for Trump. In 2016, Trump supporters were much less likely to say their vote was more for Trump (40%) than against Hillary Clinton (59%). On the other side, Biden supporters are more divided, with a slim majority saying their vote is more for Biden than against Trump (51%), while 48% say their vote is more against Trump than for Biden. In 2016, 46% of Clinton supporters indicated that their choice was more for Clinton than against Trump, compared to 54% who said their vote was more against Trump.
Survey Methodology
The survey was designed and conducted by PRRI. The survey was made possible by a generous grant from the Carnegie Corporation of New York, with additional support from the Ford Foundation, the Wilbur and Hilda Glenn Family Foundation, and the Unitarian Universalist Veatch Program at Shelter Rock. Interviews were conducted among a random sample of 2,538 adults (ages 18 and older) living in the United States, including all 50 states and the District of Columbia. Interviews were conducted both online using a self-administered design and by telephone using live interviewers. All interviews were conducted among participants in AmeriSpeak, a probability-based panel designed to be representative of the national U.S. adult population, run by NORC at the University of Chicago. Interviewing was conducted in both Spanish and English between Sept. 9 and Sept. 22, 2020. The margin of error, including the design effect, for the survey is +/- 2.6 percentage points at the 95% level of confidence.
A supplemental survey of 1,070 adults using the same methodology was conducted Oct. 9–12, 2020, to assess likely turnout, presidential candidate choice, and motivation for voting (for/against the candidate). The margin of error, including the design effect, for that survey is +/- 4.0 percentage points at the 95% level of confidence.
Endnotes
[1]The number of cases for other religious groups is < 100. Hispanic Protestants, N=70; Hispanic Catholics, N=84; members of non-Christian religions, N=83.
[2]Even though the number of cases for members of non-Christian religions is 83, the differences among white evangelical Protestants for this question are statistically significant.
[3]Despite smaller numbers of cases for Hispanic Protestants (N=70) and Hispanic Catholics (N=84), the differences are statistically significant. Black Protestants do not differ significantly from Hispanic Catholics.
[4]The likely voter models are described in the appendix to this report
[5] All numbers in this paragraph are from the average turnout model (55%).
[6]All numbers in this paragraph on vote by religious affiliation are from the large turnout model (70%). Because of smaller sample sizes for many religious subgroups, all numbers should be interpreted with caution.


