

As the country continues to experience widespread protests stemming from the recent killings of George Floyd and other Black Americans by white police officers, a broad range of questions about racial justice reveal that Americans continue to be polarized along partisan and racial lines. White Americans are notably divided by partisanship, Christian affiliation, and educational attainment. While some questions, such as the killing Black Americans by police, show significant movement in opinions over the last five years, others, such as perceptions of the Confederate flag and monuments, show continued and stable divisions.
Perceptions of Police Killings Black Americans
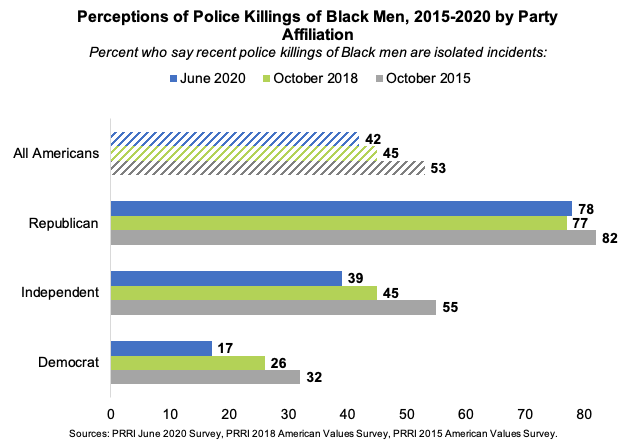
More than four in ten (42%) Americans say that recent killings of Black men are isolated incidents, compared to a majority (56%) who say such killings are part of a broader pattern of how police treat Black Americans. These numbers are roughly consistent with attitudes from October 2018, when 45% of Americans said police killings are isolated incidents and 53% said they are indicative of a broader pattern. Attitudes have shifted, however, since October of 2015, when a majority (53%) of Americans said police killings of Black men are isolated incidents and 44% said these incidents are part of a broader pattern.
Party Affiliation
More than three in four (78%) Republicans, compared to 39% of independents and only 17% of Democrats, say killings of Black Americans are isolated incidents rather than part of a broader pattern of how police treat African Americans.
Democrats are significantly less likely than they were in both 2018 (26%) and 2015 (32%) to believe police killings of Black men are isolated incidents. Independents have trended downward as well, with 55% saying killings of Black Americans are isolated incidents in 2015 and 45% in 2018. By contrast, Republicans have not changed their views since 2018 (77%) and only slightly since 2015 (82%).
Views of the presidential candidates mostly align with partisan positions. Among Americans who have a favorable view toward President Donald Trump, 82% say these killings are isolated incidents. Among those who are favorable toward former Vice President Joe Biden, only 17% view police killings of Black men as isolated incidents.
Race
Half (50%) of white Americans, compared to only 29% of Hispanic Americans and 17% of Black Americans, say recent police killings of Black men are isolated incidents.
Black Americans’ views have held constant since 2018 (16%) and 2015 (15%).[1] The proportion of Hispanic Americans who believe these killings to be isolated incidents has declined from 41% in 2015 to 34% in 2018 and to 29% today. Notably, the proportion of white Americans who say police killings of Black men are isolated incidents have dropped 15 percentage points over the last five years, from 65% in 2015 to 55% in 2018 to 50% today.
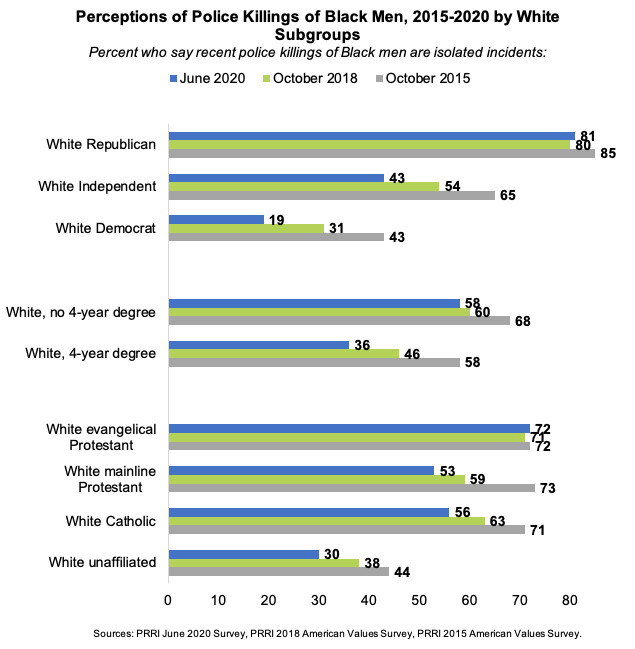
The largest movement among white Americans has come from white Democrats. Fewer than one in five (19%) white Democrats, compared to 31% in 2018 and 43% in 2015, say police killings of Black men are isolated incidents. White independents have also become less likely to view such killings as isolated incidents, declining to 43% from 54% in 2018 and 65% in 2015. White Republicans, however, remain convinced these killings are isolated incidents. More than eight in ten (81%) white Republicans hold that view, the same as in 2018 (80%) and only slightly less than in 2015 (85%).
White Americans without four-year college degrees (58%) are much more likely than those with four-year degrees (36%) to say police killings of Black men are isolated incidents. On this question, the education gap among whites has doubled over the last five years. In 2018, 60% of white Americans without college degrees, compared to 46% of whites with college degrees, said police killings are isolated incidents. In 2015, two-thirds (68%) of those without four-year degrees and a majority (58%) of those with four-year degrees said police killings of Black men are isolated incidents.
Religious Affiliation
Among religious affiliations, white evangelical Protestants (72%) are most likely to say police killings of Black men are isolated incidents. Their views are unchanged since 2018 (71%) and 2015 (72%). The attitudes of white mainline Protestants (53%) and white Catholics (56%) are not statistically different from their views in 2018 (59% and 63%, respectively) but their views have significantly shifted since 2015 (73% and 71%, respectively), when these groups were aligned with white evangelical Protestants on this issue. Compared to white Christian groups, white religiously unaffiliated Americans (30%) are less likely to view these police killings as isolated incidents, down from 38% in 2018 and a high of 44% in 2015. Among all religiously unaffiliated Americans, 26% view police killings of Black men as isolated incidents. About three in ten (31%) nonwhite Protestants say the same.[2]
Age
About one-third (35%) of young Americans (ages 18-29) and 39% of those ages 30-49 say recent police killings of Black men are isolated incidents. Americans over the age of 50 are more likely to hold this view. Just under half of Americans over age 50 (48% among both 50-64 and 65 and over) say these killings are isolated incidents. Only those over age 65 have significantly changed since 2018, when a majority (56%) said police killings of Black men are isolated incidents. However, all age groups have shifted significantly away from thinking these killings are isolated incidents since 2015, when 44% of those ages 18-29 year and majorities of those ages 30-49 (54%), 50-64 (58%) and 65 and over (55%) held this view.
Perceptions of So-Called “Reverse Discrimination” Against White Americans
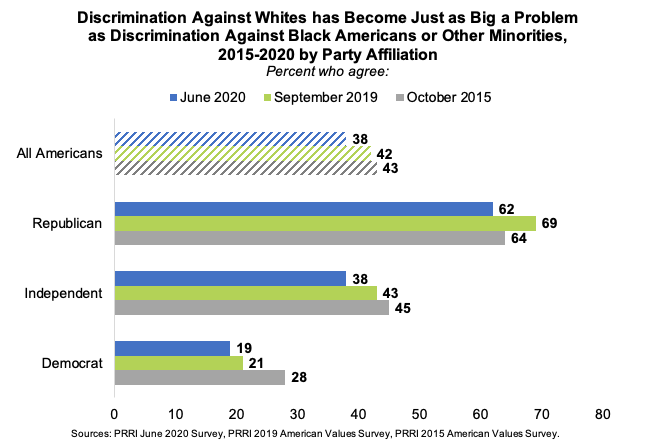
Nearly four in ten (38%) Americans agree that “today discrimination against whites has become as big a problem as discrimination against blacks and other minorities,” compared to a 61% majority who disagree with the statement. The percentage of Americans who agree with this statement has decreased modestly, but significantly, from 42% in 2019. In 2015, 43% agreed with the statement.
Party Affiliation
Republicans (62%) are three times as likely as Democrats (19%) to agree that discrimination against whites has become as a big a problem as discrimination against Black Americans and other minorities. The attitudes of independents (38%) fall in between.
Significantly fewer Republicans agree with this statement since 2019 (69%), but their opinions today are similar to their views in 2015 (64%). The attitudes of Democrats have not shifted significantly since 2019, when 21% agreed with this statement, but a larger shift has taken place since 2015 (28%). Independents show a slight decline in agreement since 2019 (43%) and 2015 (45%).
Among those who view Trump favorably, nearly seven in ten (69%) agree that discrimination against whites has become as a big problem as discrimination against Black Americans and other minorities. Only 22% of those who view Biden favorably hold the same view.
Race
White Americans (44%) are substantially more likely than Hispanic Americans (33%) and Black Americans (13%) to agree that discrimination against whites has become as big a problem as discrimination against Black Americans and other minorities. Both white and Black Americans are notably less likely to agree with this statement today than they did in 2019 (49% and 23%, respectively) and 2015 (50% and 25%, respectively). There are no significant differences among Hispanic Americans over time.
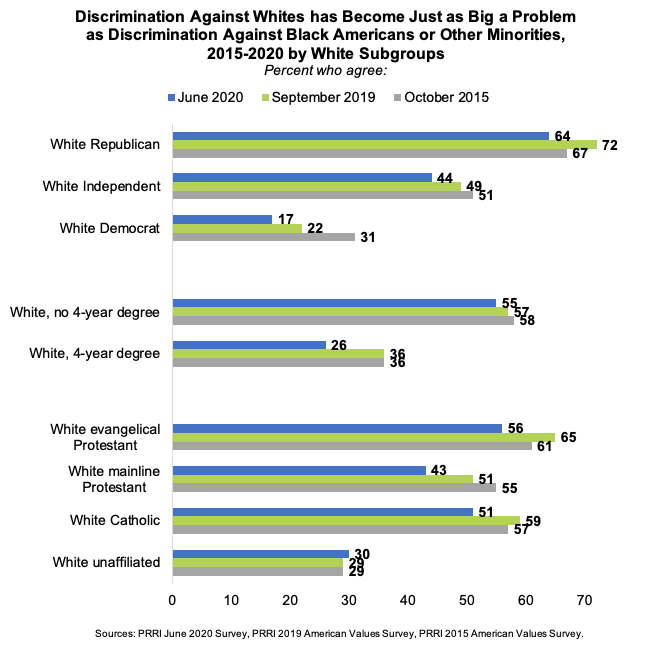
Partisan divisions among whites are acute. White Republicans (64%) are much more likely than white independents (44%) and white Democrats (17%) to agree that today discrimination against whites has become as big a problem as discrimination against Black Americans and other minorities. Attitudes among white Republicans has declined significantly since 2019 when 72% agreed with the statement, but views remain similar to 2015 (67%). Among white Democrats, there are no notable changes compared to 2019 (22%) but agreement with this statement is substantially lower than in 2015 (31%). Views among white independents remain stable over time.
White Americans without a four-year college degree are more than twice as likely as those with a four-year college degree to say discrimination against whites is as big a problem as discrimination against Blacks and other minority groups. A majority (55%) of white Americans without a four-year college degree agree with this statement today as they did in 2019 (57%) and 2015 (58%). By contrast, only about one in four (26%) whites with a four-year college degree agree with this statement today, and they are substantially less likely to agree with this sentiment than in 2019 (36%) and 2015 (36%).
Religious Affiliation
Among religious groups, majorities of white evangelical Protestants (56%) and white Catholics (51%) agree that “today discrimination against whites has become as big a problem as discrimination against blacks and other minorities,” as do more than four in ten white mainline Protestants (43%). By contrast only about three in ten white unaffiliated Americans (30%) and nonwhite Protestants (28%) agree. Among all religiously unaffiliated Americans, 27% agree. Notably, white mainline Protestants are the only religious group in which agreement with this statement have declined consistently over the last five years, dropping from 55% in 2015 to 51% in 2019 to 43% today. The attitudes of white unaffiliated Americans have remained stable over time.
Age
One third (33%) of young Americans (ages 18-29) agree that today discrimination against whites has become as big a problem as discrimination against Black Americans and other minorities, compared to 44% of senior Americans (ages 65 and older). About four in ten Americans ages 30-49 (36%) and ages 50-64 (40%) also agree with this statement, but do not differ significantly from the other two age groups. Young Americans and seniors have both remained mostly consistent in their views since 2019 (34% and 46%, respectively) and 2015 (35% and 44%, respectively). However, both of the two middle age groups, ages 30-49 and 50-64, are less likely to agree with this statement today than in 2019 (40% and 47%, respectively) and 2015 (44% and 50%, respectively).
How Generations of Slavery and Discrimination Have Affected Black Americans
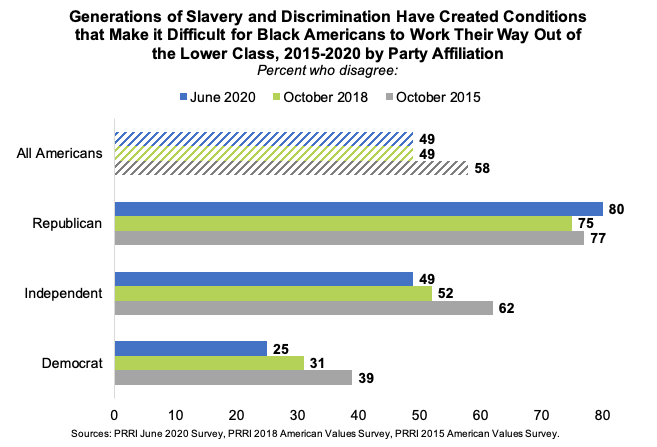
Americans are evenly divided on the question of whether generations of slavery and discrimination have created conditions that make it difficult for Black Americans to work their way out of the lower class (49% agree vs. 49% disagree). The percentage of Americans who disagree with this statement is the same as in 2018 (49%), but it has decreased significantly from 2015 (58%).
Party Affiliation
Eight in ten (80%) Republicans disagree that slavery and discrimination have made it difficult for Black Americans to work their way out of the lower class, compared to less than half (49%) of independents and only one in four (25%) Democrats. Republican attitudes have remained mostly steady since 2018 (75%) and 2015 (77%), while fewer independents and Democrats hold this belief than in 2018 (52% and 31%, respectively) and 2015 (62% and 39%, respectively).
More than eight in ten Americans who hold favorable views of Trump (82%) disagree that generations of slavery and discrimination have created conditions that make it difficult for Black Americans to work their way out of the lower class. Only 29% of those who view Joe Biden favorably share that opinion.
Race
White Americans (55%) and Hispanic Americans (48%) are notably more likely than Black Americans (22%) to disagree that slavery and discrimination have made it difficult for Black Americans to achieve economic mobility. White Americans have not changed their views since 2018 (55% disagreed) but have become less likely to hold the belief than in 2015 (64% disagreed). The fluctuations in views among African Americans and Hispanic Americans are not statistically significant.
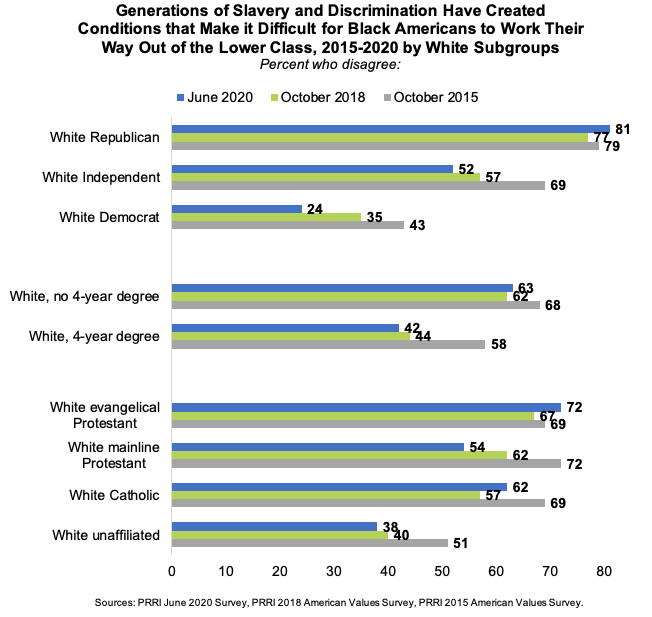
Eight in ten white Republicans (81%) disagree that slavery and discrimination have created conditions that make it difficult for Black Americans to work their way out of the lower class, compared to a slim majority (52%) of white independents and only about one in four (24%) white Democrats. The attitudes of white Republicans have remained fairly stable since 2018 (77%) and 2015 (79%), while white independents and white Democrats are significantly less likely to hold this view today than they did in 2018 (57% and 35%, respectively) and 2015 (69% and 43%, respectively).
More than six in ten (63%) white Americans without a four-year college degree disagree that slavery and discrimination have limited African American economic mobility, compared to 42% of white Americans with a four-year college degree. Those with a four-year college degree were similarly likely to disagree with this statement in 2018 (44%) but were substantially more likely to disagree in 2015 (58%). The percentage of white Americans without a college degree who disagree with the statement remained mostly steady since 2015.
Religious Affiliation
Majorities of all white Christian groups disagree that generations of slavery and discrimination have created conditions that make it difficult for Black Americans to work their way out of the lower class, including white evangelical Protestants (72%), white Catholics (62%), and white mainline Protestants (54%). Fewer nonwhite Protestants (44%) and religiously unaffiliated Americans (35%) disagree, including 38% of white unaffiliated Americans. The attitudes of white evangelical Protestants and white Catholics views are mostly unchanged since 2018 (67% and 57%, respectively) and 2015 (69% for both). However, disagreement with this statement has consistently declined among white mainline Protestants since 2018 (62%) and 2015 (72%). White religiously unaffiliated Americans have not significantly changed their views since 2018 (40%) but are notably less likely to disagree with this statement today than they did in 2015 (51%).
Age
Young Americans (42%) and Americans ages 30-49 (41%) are notably less likely to disagree with the idea that slavery and discrimination make it difficult for Black Americans to get out of poverty than Americans ages 50-64 (58%) and senior Americans (57%). All age groups remain stable over time, except for Americans ages 30-49, among whom disagreement levels have declined since 2018 (50%) and 2015 (59%).
Confederate Flags: Symbols of Southern Pride or Racism?
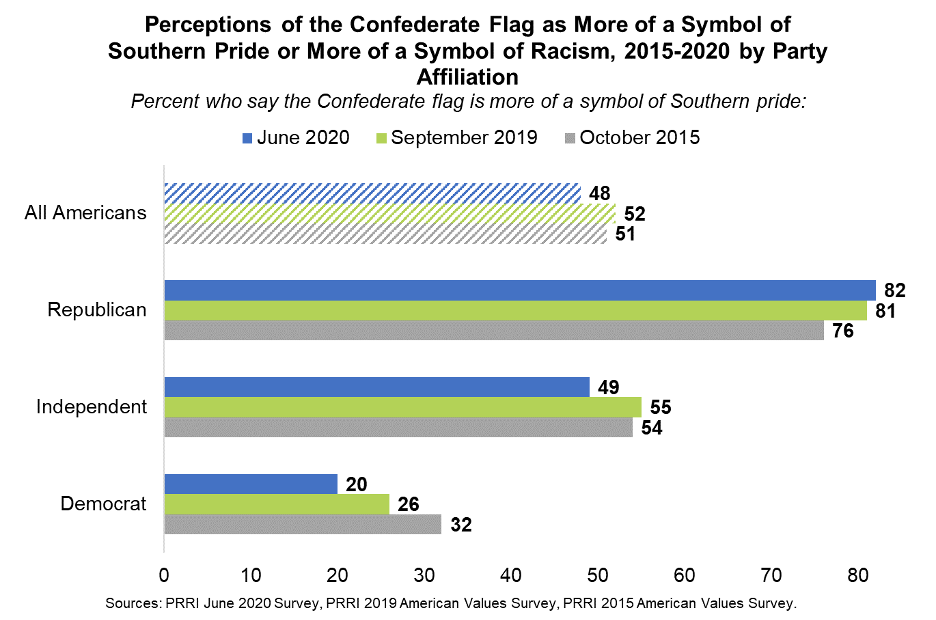
Despite renewed efforts and successes in removing Confederate symbols, opinions on whether those symbols are racist remain largely unchanged and deeply divided. The country is nearly equally divided on the question of whether the Confederate flag is a symbol of racism (49%) or a symbol of Southern pride (48%). This is only a modest shift from 2019, when a slim majority (52%) said the flag was a symbol of Southern pride, and 45% said it was a symbol of racism. Similarly, in 2015, 51% said the Confederate flag is a symbol of Southern pride and 40% said it is a symbol of racism.[3]
Party Affiliation
Democrats and Republicans have become more polarized on the issue, while independents are evenly divided. More than eight in ten (82%) Republicans, compared to only 20% of Democrats, say the Confederate flag is a symbol of Southern pride as opposed to a symbol of racism. Just under half (49%) of independents view the Confederate flag as a symbol of Southern pride.
The proportion of Republicans who view the Confederate flag as a symbol of Southern pride rather than racism are the same as in 2019 (81%), and are actually slightly up from 2015 (76%). The share of Democrats who view the Confederate flag as a symbol of Southern pride has declined steadily, from 26% in 2019 and 32% in 2015. Independents have become slightly less likely to say the Confederate flag is a symbol of Southern pride since 2019 (55%) and 2015 (54%).
Americans are similarly polarized in their views on Confederate flags based on their impressions of Trump and Biden. More than eight in ten (85%) Americans who hold a favorable view of Trump say that they view the Confederate flag as a symbol of Southern pride rather than racism. By contrast, one in four (26%) Americans who hold a favorable view of Biden say the Confederate flag is a symbol of Southern pride.
Region
Southerners are most likely to say the Confederate flag is a symbol of Southern pride (54%), while less than half of Midwesterners (48%), Westerners (45%), and Northeasterners (41%) agree. Northeasterners and Midwesterners have become less likely to say the flag is a symbol of Southern pride since 2019 (55% and 58%, respectively) and 2015 (56% and 55%, respectively). Westerners’ and Southerners’ views have not significantly changed since 2019 (48% and 50%, respectively) or 2015 (43% and 52%, respectively).
Race
Unsurprisingly, some of the deepest divides over the Confederate flag are along racial and ethnic lines. A majority (57%) of white Americans, compared to 37% of Hispanic Americans and only 16% of Black Americans, say the Confederate flag is a symbol of Southern pride rather than racism. White Americans have become slightly less likely to hold this view since 2019 (64%) and 2015 (61%). Hispanic Americans’ views are virtually identical in 2019 (35%) and 2015 (36%), while Black Americans have also not significantly shifted since 2019 (17%) and express an insignificant decline from 2015 (22%).
There are sizeable differences in opinion among white subgroups, however. White Republicans (85%) are much more likely than white independents (58%) and white Democrats (21%) to say the Confederate flag is a symbol of Southern pride. The proportion of white Republicans who see the Confederate flag as a symbol of Southern pride have not moved significantly since 2019, when 87% held this view; notably it has actually increased since 2015, when 79% said the flag is a symbol of Southern pride. Among white Democrats, views of the Confederate flag as a symbol of Southern pride have declined steadily, down from 30% in 2019 and 42% in 2015.
Around seven in ten (67%) white Americans without four-year college degrees, compared to only 40% of white Americans with college degrees, say the Confederate flag is a symbol of Southern pride. Among those without college degrees, the proportion of those saying the Confederate flag is a symbol of Southern pride is roughly unchanged from 72% in 2019 and 70% in 2015. By contrast, the proportion of white Americans with college degrees decreased from 50% holding this view in 2019 and 45% in 2015.

Religious Affiliation
About three in four (76%) white evangelical Protestants and six in ten white Catholics (61%) and white mainline Protestants (60%) say the Confederate flag is a symbol of Southern pride rather than a symbol of racism. Only around one-third of nonwhite Protestants (33%) and religiously unaffiliated Americans (31%) share that view. Among white unaffiliated Americans, 37% say the Confederate flag is a symbol of Southern pride.
All of the white religious groups have shifted their views on this question since 2019 and 2015. In 2019, 86% of white evangelical Protestants said the flag is a symbol of Southern pride, although that was an increase from 70% in 2015. Seven in ten white mainline Protestants (70%) and white Catholics (70%) said the flag is about Southern pride in 2019, similar to their views in 2015 (70% and 65%, respectively). White unaffiliated Americans have become slightly less likely to see the flag as a symbol of pride (41% in 2019 and 43% in 2015).
Age
Perceptions of the Confederate flag as a symbol of Southern pride increase with age. Majorities of Americans over age 65 (59%) and ages 50 to 64 (54%), compared to four in ten Americans ages 30 to 49 (41%) and ages 18 to 29 (40%) say the Confederate flag is a symbol of Southern pride. Views of the Confederate flag among young Americans ages 18 to 29 have remained relatively stable, with 37% saying the flag represents Southern pride in 2019, and 38% saying the same in 2015. Views of the flag among Americans ages 30 to 49 have only declined in the past year. Previously, a slim majority said the flag was a symbol of Southern pride in 2019 and 2015 (52% in both years). Americans ages 50 to 64 and ages 65 and older have remained steady in their views over the last five years (57% and 62% in 2019, and 57% and 57% in 2015, respectively).
Monuments to Confederate Soldiers: Symbols of Southern Pride or Racism
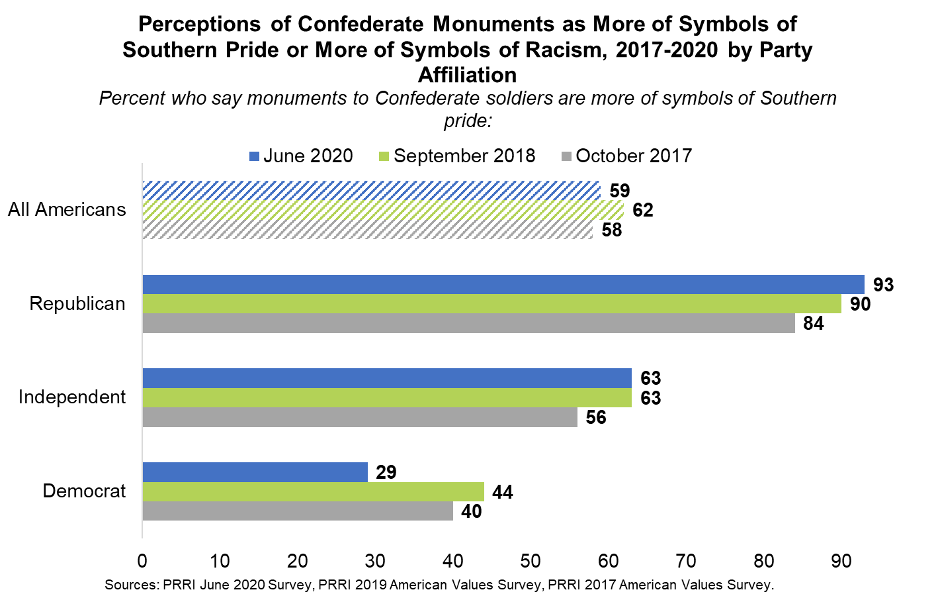
Compared to perceptions of the Confederate flag, Americans are less divided in their views of Confederate monuments. About six in ten (59%) Americans view Confederate monuments as symbols of Southern pride, while 38% view them as symbols of racism, similar to 2018 (62% and 35% respectively), and 2017 (58% and 30%).
Party Affiliation
While the views of Americans regarding Confederate monuments have only shifted minimally since 2018 and 2015, partisans have become more polarized on the issue. More than nine in ten (93%) Republicans and six in ten (63%) independents, compared to 29% of Democrats, say Confederate monuments are symbols of Southern pride rather than racism. Democrats have become less likely to hold this view than in 2018 (44%) and 2017 (40%). Views among Republicans and independents are unchanged from 2018 (90% and 63%, respectively), but both have become more likely to say Confederate monuments represented Southern pride since 2017 (84% and 56%, respectively).
An overwhelming majority (93%) of those who hold favorable views of Trump view Confederate monuments as symbols of Southern pride rather than racism. Around four in ten (37%) Americans who hold favorable views of Biden say the same.
Region
Residents of the South (63%) and Midwest (62%) are more likely than residents of the West (56%) or Northeast (54%) to see Confederate monuments as symbols of Southern pride. Current views are largely consistent with views in 2017 and 2018.
Race
More than two-thirds (68%) of white Americans say Confederate monuments represent Southern pride rather than racism, while a slim majority of Hispanic (51%) Americans and 29% of Black Americans agree. In 2018, 45% of Hispanic Americans said monuments were symbols of Southern pride, down from a majority (54%) in 2017. The proportion of white Americans saying the monuments are symbols of Southern pride decreased from 74% in 2018, though the current share is identical to 2017 (68%). Black Americans’ views are largely unchanged from 2018 (26%) or 2017 (29%).
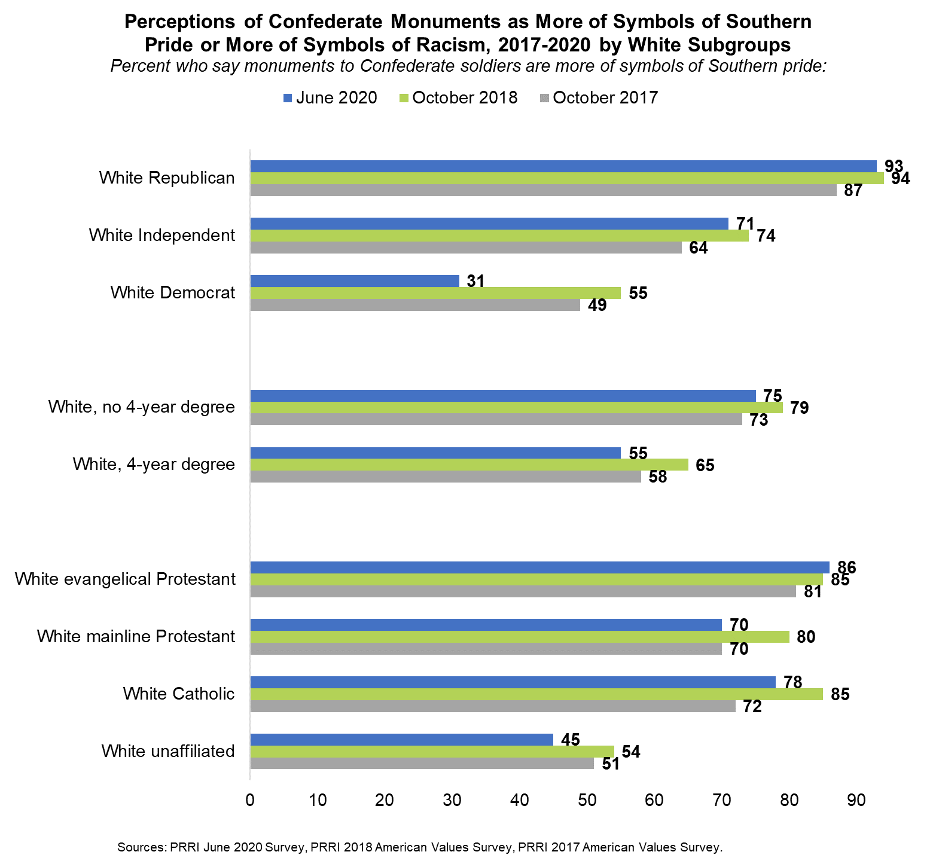
Again, partisan differences among white Americans are stark. More than nine in ten (93%) white Republicans and seven in ten (71%) white independents view Confederate monuments as symbols of Southern pride rather than racism. Only three in ten (31%) white Democrats agree, and their views have changed drastically since 2018, when 55% said Confederate monuments are symbols of Southern pride, and 2017 when 49% said the same. The proportions of white Republicans and white independents who say Confederate monuments represent Southern pride are not significantly different from 2018 (94% and 74%, respectively). In 2017, both white Republicans (87%) and white independents (64%) were less likely to say monuments were symbols of Southern pride than they are currently.
A smaller majority of white Americans with four-year college degrees (55%) than white Americans without four-year college degrees (75%) say Confederate monuments represent Southern pride. Among those with college degrees, this represents a decrease from 65% in 2018, but is similar to the 58% who said the same in 2017. White Americans without a college degree only show modest movement in the same period, from 79% who said monuments are symbols of Southern pride in 2018 and 73% in 2017.
Religious Affiliation
White Christian groups are most likely to view Confederate monuments as symbols of Southern pride rather than racism, including strong majorities of white evangelical Protestants (86%), white Catholics (78%), and white mainline Protestants (70%). Nonwhite protestants are divided, with 49% saying monuments are symbols of Southern pride. Just four in ten (40%) religiously unaffiliated Americans say the flag symbolizes Southern pride, which increases slightly to 45% among white unaffiliated Americans.
White mainline protestants have become less likely to see monuments as symbols of Southern pride since 2018 (80%), though it is the same as in 2017 (70%). The views of white evangelical Protestants and white Catholics have not changed significantly since 2018 (85% for both groups) or 2017 (81% and 72%). White unaffiliated Americans are less likely to see Confederate monuments as symbols of Southern pride than they were in 2018 (54%) and 2017 (51%).
Age
Much like the Confederate flag, the belief that Confederate monuments represent Southern pride rather than racism increases with age. Similar proportions of Americans ages 18 to 29 (54%) and ages 30 to 49 (53%) believe that Confederate monuments are symbols of Southern pride. Americans age 50 to 64 (63%) and over age 65 (70%) are more likely to say they are symbols of Southern pride. Older Americans have shifted somewhat in their views of Confederate monuments since 2018, when 77% viewed them as symbols of Southern pride, but their views remain roughly in line with their attitudes in 2017, when two-thirds (67%) said the same. A similar pattern exists among Americans ages 50 to 64, with 69% in who said monuments were symbols of pride in 2018, and 63% in 2017. Movement over time for Americans ages 30 to 49 and 18 to 29 is not statistically significant.
Methodolgy and Footnotes
Survey Methodology
The survey was designed and conducted by PRRI among a random sample of adults (age 18 and up) living in the United States and who are part of Ipsos’s Knowledge Panel. The survey included a national sample (N=1,016) representing all 50 states. Interviews were conducted online between June 26 and 29, 2020. The survey was made possible by a generous grant from The Ford Foundation.
Respondents are recruited to the KnowledgePanel using an addressed-based sampling methodology from the Delivery Sequence File of the USPS – a database with full coverage of all delivery addresses in the U.S. As such, it covers all households regardless of their phone status, providing a representative online sample. Unlike opt-in panels, households are not permitted to “self-select” into the panel; and are generally limited to how many surveys they can take within a given time period.
The initial sample drawn from the KnowledgePanel was adjusted using pre-stratification weights so that it approximates the adult U.S. population defined by the latest March supplement of the Current Population Survey. Next, a probability proportional to size (PPS) sampling scheme was used to select a representative sample.
To reduce the effects of any non-response bias, a post-stratification adjustment was applied based on demographic distributions from the most recent American Community Survey (ACS). The post-stratification weight rebalanced the sample based on the following benchmarks: age, race and ethnicity, gender, Census division, metro area, education, and income. The sample weighting was accomplished using an iterative proportional fitting (IFP) process that simultaneously balances the distributions of all variables. Weights were trimmed to prevent individual interviews from having too much influence on the final results. In addition to an overall national weight, separate weights were computed for each state to ensure that the demographic characteristics of the sample closely approximate the demographic characteristics of the target populations. The state-level post-stratification weights rebalanced the sample based on the following benchmarks: age, race and ethnicity, gender, education, and income.
The margin of error for the national survey is +/- 3.2 percentage points at the 95% level of confidence. The design effect for the survey is 1.1. In addition to sampling error, surveys may also be subject to error or bias due to question wording, context, and order effects.
Additional details about the KnowledgePanel can be found on the Ipsos website:
https://www.ipsos.com/en-us/solution/knowledgepanel
Appendix
| Table 1. Demographic, Political, Religious, and Geographic Subgroup Sample Sizes
(Unweighted) |
|
| N= | |
| Total Sample | 1,016 |
| Male | 544 |
| Female | 472 |
| Republican | 293 |
| Independent | 377 |
| Democrat | 327 |
| White, non-Hispanic | 735 |
| Black, non-Hispanic | 88 |
| Hispanic | 115 |
| Age 18-29 | 186 |
| 30-49 | 299 |
| 50-64 | 305 |
| 65+ | 226 |
| White evangelical Protestant | 155 |
| White mainline Protestant | 185 |
| Nonwhite Protestant | 118 |
| Catholic | 212 |
| White Catholic | 149 |
| Religiously unaffiliated | 231 |
Footnotes
[1] Sample size for Black Americans is n=88. Results should be interpreted with caution.
[2] Sample size for Black Protestants, Hispanic Protestants, Hispanic Catholics, and non-Christian religions are too small to report individually. Protestants who identify as Black, Hispanic, Asian or Pacific Islander, Native, multiracial, or any other race are included in nonwhite Protestants.
[3] In the 2015 phrasing of the question, 6% of respondents chose a response of “Other” or “Neither/Both” which were not included in other years.
[4] In the 2017 phrasing of the question, 3% of respondents chose a response of “Part of history/Other” which was not included in other years.


