

Introduction
The novel coronavirus and the illness it causes, COVID-19, has impacted communities in the United States at vastly different rates and severities. Population density and different state and local government actions to combat the spread have compounded the uneven outcomes. In the absence of federal mandates, state and local governments have implemented and reversed varying degrees of restrictions and shutdowns on public or social activities. One of the key debates is whether to allow religious services and gatherings, to substantially decrease them in size, or to ban them completely. Some religious groups have been outspoken about continuing their usual activities, despite evidence showing that religious gatherings can become ground zero for coronavirus outbreaks. Other religious groups immediately closed their physical doors and moved to online formats, with arrangements for smaller events as conditions allow.
Many factors go into how religious groups have reacted to the pandemic, but part of the story is that not all groups have been impacted in the same way. In the U.S., particular religious groups are clustered in specific regions of the country; some are more likely to serve rural communities while others are rooted in larger cities. Additionally, religious denominations in the U.S. remain highly segregated by race and ethnicity. Research has shown for example how disproportionately COVID-19 has impacted African American and Hispanic communities and certain areas of the country. However, little attention has been paid to the ways these disparities translate to the American religious landscape. The purpose of this report is to fill this gap by estimating exposure rates to COVID-19 for religious subgroups in the U.S.
Data Sources
Directly measuring how religious communities have been impacted by the pandemic is virtually impossible, as there is no source of COVID-19 data by religious affiliation. However, the geographic location of U.S. residents who affiliate with different religious groups can serve as a proxy indicator of how much COVID-19 exposure on average members of a religious group have experienced. In this report, we draw on two primary data sources: 1) PRRI’s 2019 American Values Atlas, which provides nationally representative data on the religious affiliation of more than 53,000 U.S. residents, including their county-level geographic location; and 2) county-level case data from the COVID-19 Data Repository by the Center for Systems Science and Engineering (CSSE) at Johns Hopkins University as of July 26, 2020, which provides the number of COVID-19 cases and deaths each county in the U.S. has reported since February.
To estimate COVID-19 exposure by religious affiliation, we merged these two datasets, aggregated religious affiliation and COVID-19 cases at the county level, and computed average exposure for each religious subgroup.
Importantly, this means that COVID-19 exposure in these religious groups is inherently tied to their geographic location at the county level. It does not mean that each member of the religious group has an identical experience; it creates an aggregate picture of the overall religious group’s experience based on where its adherents live. For example, Jewish Americans are more likely to live in urban counties in New York, Florida, California, and New Jersey. Urban areas have been more conducive to viral transmission due to population density. New York City and New Jersey were the initial epicenter of the virus in the U.S., and the numbers in Florida and California have risen in the summer. These factors combined mean that Jewish communities, as a result of where many of them live, have experienced higher average rates of virus exposure than other more scattered and less urban-based religious communities. This does not mean Jewish Americans have necessarily contracted or spread the virus at a higher rate — it does, however, mean their risks are likely higher due to where they live.
Due to the sample size of the American Values Atlas, these estimates can be generated for most sizeable religious groups in the U.S. Sample sizes and further details are available in the appendix.
Overall COVID-19 Exposure by Religious Affiliation
Overall, Hispanic Christian, Black Christian, and non-Christian religious groups are more likely to live in areas hardest hit by COVID-19 cases. This pattern is driven in part by the sizeable portions of those groups living in urban areas of the country, which have been more heavily impacted by the pandemic. Figure 1 shows the proportion of each religious group that lives in counties in the top quartile (75th-100th percentiles) of cases per 100,000 residents in the U.S., as well as the percent of each religious group that lives in an urban area.
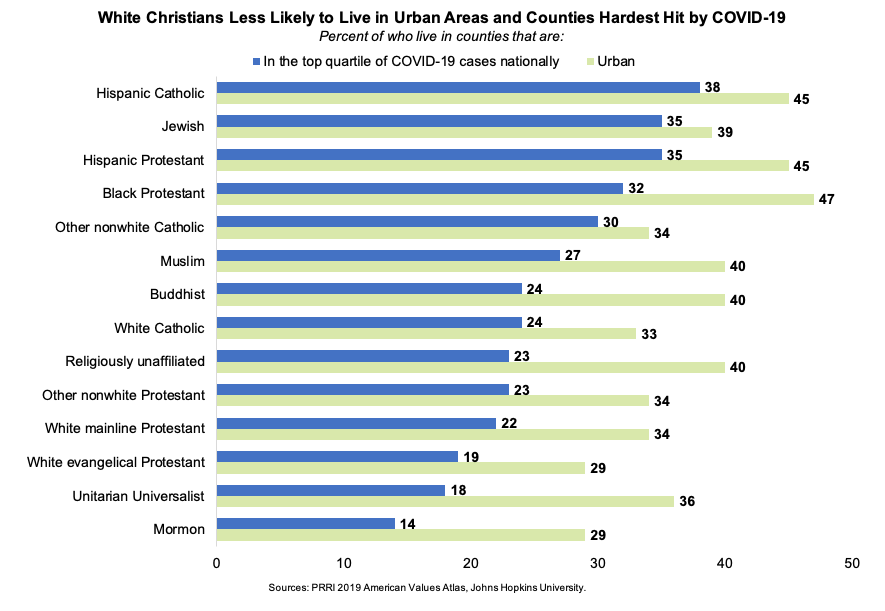
Notably, the top half of the chart is dominated by nonwhite and non-Christian religious groups. All white Christian groups are less likely than nonwhite and non-Christian religious groups to live in places in the top quartile of COVID-19 cases per capita. Mormons’ concentration in non-urban Western states means they are less likely than other groups to live in high-COVID impact areas. While urban location is important, other aspects of geography and population distribution matter and will be discussed below.
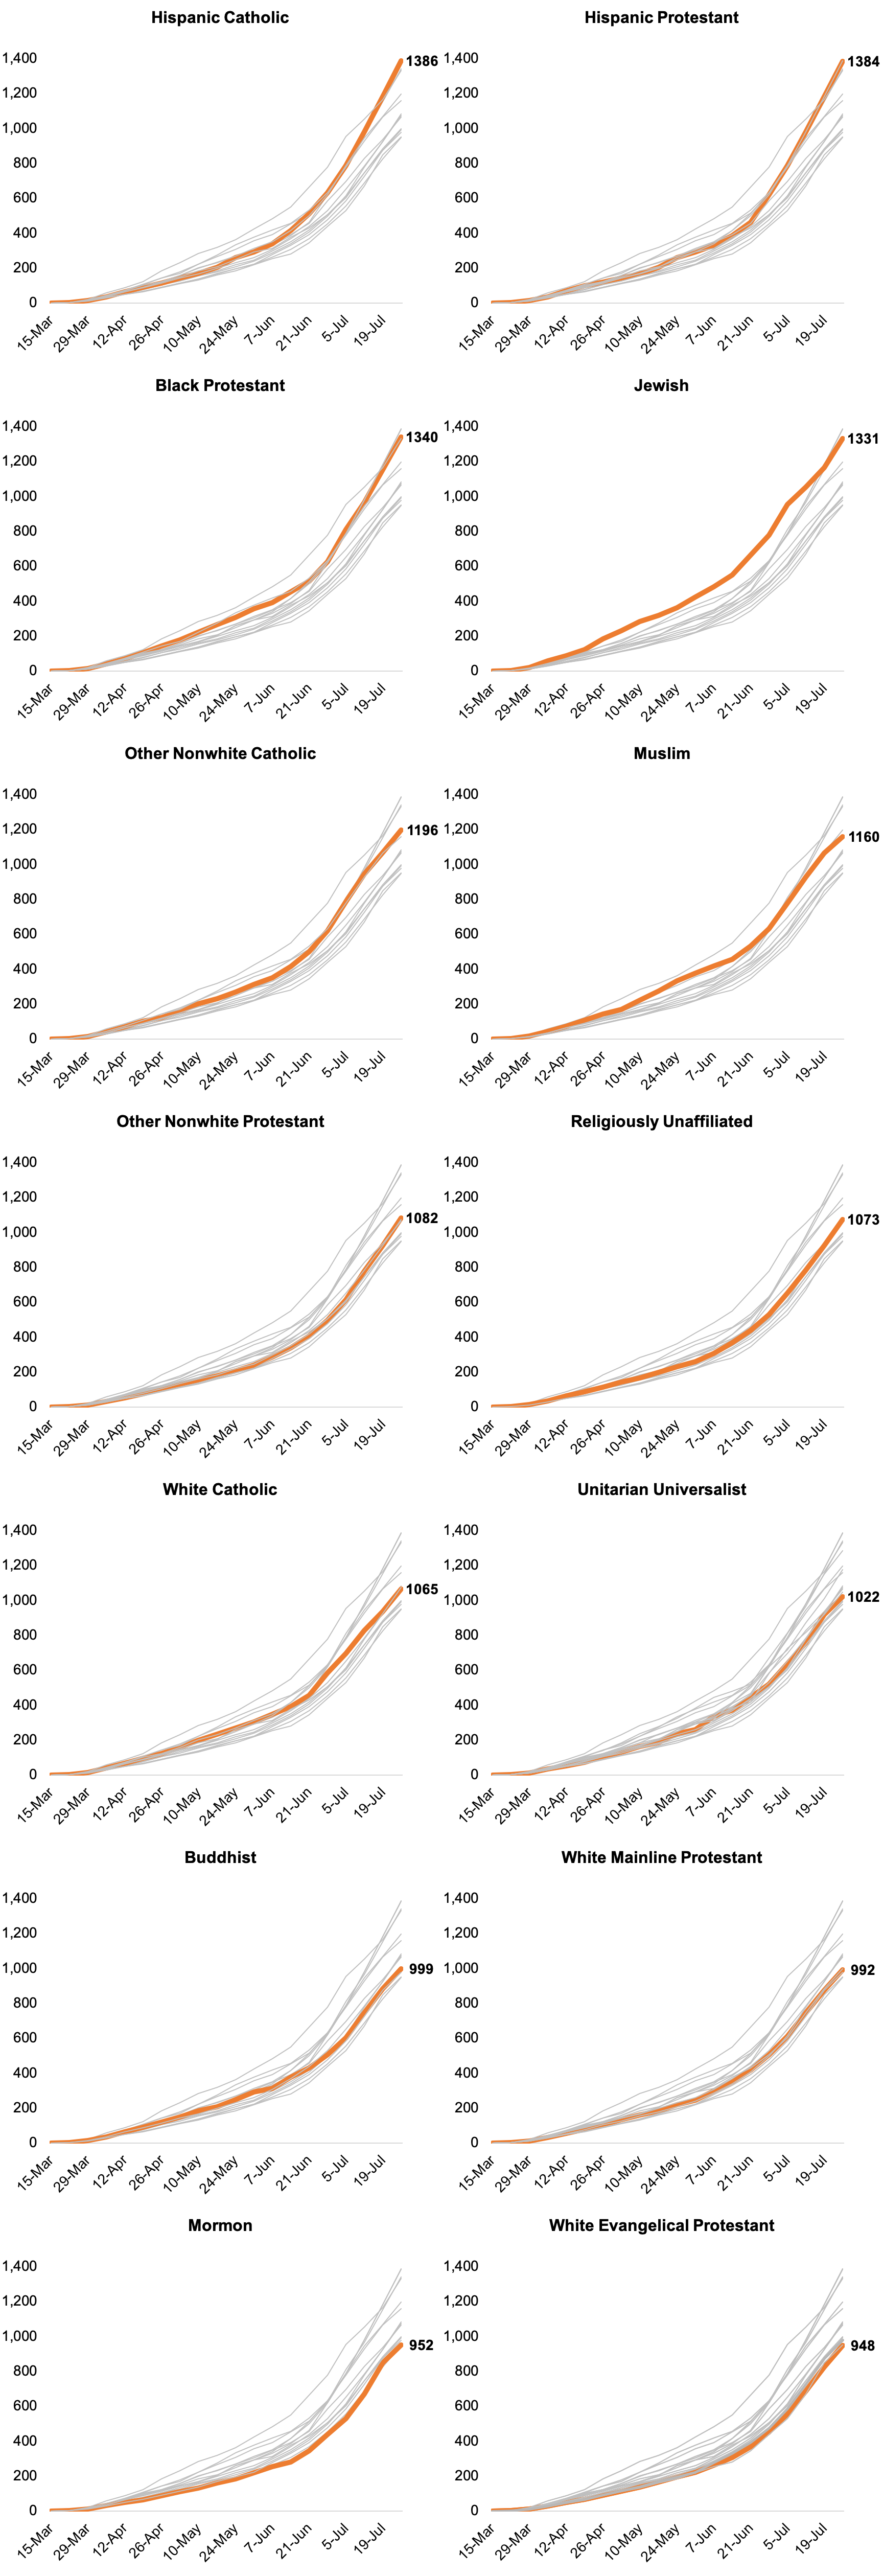
The chart matrix below shows how cases of COVID-19 have spread in counties where each major religious group lives from mid-March to late July. The vertical axis shows the median number of cases per 100,000 residents, while the horizontal axis shows the date. The larger orange line shows the case trajectory for the featured group, while the smaller lines show the trajectories of each of the other groups. The bold number shows the median case rate per 100,000 residents for each group as of July 26 2020.
Hispanic Catholic
Hispanic Catholics make up 7.8% of the American population and is the religious group most likely to live in areas that are highly affected by COVID-19. As of July 26, 2020, counties where Hispanic Catholics live had a median case rate of 1,386 cases per 100,000 residents, the highest among all religious groups.
Until late May, case rates in counties where Hispanic Catholics live fell in the middle of all religious groups, but began quickly accelerating in mid- to late-June, eventually overtaking counties where Jewish Americans live in mid-July.
Hispanic Catholics are primarily concentrated in urban and suburban areas and in the South and in the West. More than four in ten Hispanic Catholics live in urban (45%) and suburban areas (45%), while only one in ten (10%) live in rural areas. More than one-third of Hispanic Catholics live in the South (35%) and in the West (36%), while one in five (20%) live in the Northeast and 9% live in the Midwest. Hispanic Catholics are most likely to live in California (24%), Texas (13%), Florida (10%), or New York (9%).
The median age of Hispanic Catholics over age 18 is 41 years old, compared to 47 for all Americans. Hispanic Catholics are more likely to be young ages 18 to 29 (25%) and to be ages 30 to 49 (40%) than Americans overall (21% and 33%, respectively), and are about half as likely as all Americans to be seniors ages 65 and over (12% vs. 21%), but do not differ from all Americans ages 50 to 64 (23% vs. 25%).
Hispanic Protestant
Hispanic Protestants make up 3.7% of the American population and live in some of the areas that are most affected by COVID-19. As of July 26, 2020, counties where Hispanic Protestants live had a median case rate of 1,384 cases per 100,000 residents, second only to Hispanic Catholics (1,386 cases per 100,000).
Until mid-June, counties where Hispanic Protestants lived generally fell in the middle of other religious groups in their per capita cases. However, starting in late June, per capita case counts in counties where Hispanic Protestants live began rapidly accelerating, pushing the group from middle to near the top.
Hispanic Protestants are most likely to live in the South (40%) or the West (30%), and fewer live in the Northeast (19%) or the Midwest (11%). More than one in ten Hispanic Protestants live in either California (17%), Texas (13%), or Florida (11%). This group is evenly split between urban areas (45%) and suburban areas (43%), while just 13% live in rural areas.
Hispanic Protestants are generally younger than all Americans, with a median age of 40, compared to 47 for all Americans. Hispanic Protestants are much more likely to be ages 18 to 29 (29%) or 30 to 49 (40%) than all Americans (21% and 33% respectively). They are somewhat less likely to be ages 50 to 64 (20%), and much less likely to be over age 65 (11%) compared to all Americans (25% and 21% respectively).
Black Protestant
Black Protestants make up 7.2% of the American population and are one of the religious groups most likely to live in areas that are highly affected by COVID-19. As of July 26, 2020, counties where Black Protestants live have on average 1,340 cases per 100,000 residents, third only to counties where other Christians of color live (i.e., Hispanic Catholics and Hispanic Protestants).
As COVID-19 cases increased through the spring, counties where Black Protestants live have consistently been more affected than nearly any other religious group. Cases in these counties have been accelerating more quickly since mid- to late-June as several states in the South have seen increasing cases. In early to mid-July, counties where Black Protestants live entered the top end of counties affected by the virus.
Black Protestants are primarily concentrated in urban areas and the South. Around half (47%) of Black Protestants live in urban areas, while fewer live in suburban areas (37%) or rural areas (15%). Half (49%) of Black Protestants live in the South, while around one in five live in the Northeast (20%) and the Midwest (19%), and around one in ten (12%) live in the West. Black Protestants are most likely to live in Georgia (9%), New York (7%), California (7%), Florida (7%), or Texas (6%), nearly all of which have had increasing cases of COVID-19 in June and July.
The median age of Black Protestants over age 18 is 50 years old, compared to 47 for all Americans. Black Americans somewhat more likely to be ages 50 to 64 (30%) than Americans overall (25%), and less likely to be ages 18 to 29 (16%), or 30 to 49 (31%), compared to all Americans (21% and 33%, respectively), but they are similarly likely to be over the age of 65 (22% vs. 21% for all Americans).
Jewish Americans
Jewish Americans make up only 1.3% of the American population, yet are one of the religious groups most likely to live in areas that are highly affected by COVID-19. As of July 26, 2020, counties where Jewish Americans live had a median case rate of 1,331 cases per 100,000 residents, only fourth to Christians of color (i.e., Hispanic Catholics, Hispanic Protestants, and Black Protestants). COVID-19 cases in counties where Jewish Americans live accelerated early, and these counties have consistently been more affected than most other areas since early spring.
As COVID-19 cases increased through the spring, counties where Jewish Americans live have consistently been more affected than all other religious groups. Cases in these counties accelerated through June, before slowing somewhat in July.
Jewish Americans are primarily concentrated in suburban and urban areas and in the Northeast. A majority (53%) of Jewish Americans live in suburban areas, while nearly four in ten (39%) live in urban areas, and only 8% live in rural areas. More than four in ten (44%) Jewish Americans live in the Northeast, while 23% live in the South, 20% live in the West, and 13% live in the Midwest. Jewish Americans are most likely to live in New York (19%), California (12%), Florida (9%), and New Jersey (8%).
The median age of Jewish Americans over age 18 is 49 years old, slightly older than the median age of all Americans (47). About one in five (21%) are young ages 18 to 29 and 24% are ages 50 to 64, same as Americans overall (21% and 25%, respectively), while 29% are ages 30 to 49 and 26% are seniors 65 and over, slightly smaller and higher than all Americans (33% and 21%, respectively).
Other Nonwhite Catholic
Catholics of any race or ethnic group besides white or Hispanic, including Black (45%), Asian or Pacific Islander (13%), multiracial (21%), or Native American (9%), are included in this category. Other nonwhite Catholics make up 2.2% of the American population and are one of the religious groups that live in areas that are highly affected by COVID-19. As of July 26, 2020, counties where other nonwhite Catholics live had a median case rate of 1,196 cases per 100,000 residents, only surpassed by other Christians of color and Jewish Americans. COVID-19 cases in counties where other nonwhite Catholics live have grown steadily, with some acceleration through late June.
Other nonwhite Catholics are primarily concentrated in urban and suburban areas and in the South. More than four in ten other nonwhite Catholics live in urban (44%) and suburban areas (43%), while only 13% live in rural areas. About one-third of other nonwhite Catholics live in the South (32%) and about one in four live in the West (25%) and in the Northeast (23%), while one in five (20%) live in the Midwest. Other nonwhite Catholics are most likely to live in California (13%), New York (9%), Florida (7%), or Texas (6%).
The median age for this group over age 18 is 46 years old, similar to all Americans (47 years old). One in five (20%) other nonwhite Catholics are young ages 18 to 29 , about the same as all Americans (21%), 35% are ages 30 to 49 as are 33% of all Americans. Similarly, one in four (25%) other nonwhite Catholics are ages 50 to 64 and one in five (20%) are ages 65 and over, virtually the same as Americans overall (25% and 21%, respectively).
Muslim Americans
Muslim Americans make up 0.7% of the American population and are one of the religious groups that live in areas that are more affected than average by COVID-19. As of July 26, 2020, counties where Muslim Americans live had a median case rate of 1,160 cases per 100,000 residents. COVID-19 case rates in counties where Muslim Americans live have consistently been higher than most other religious groups and have grown steadily through the spring and summer.
Muslim Americans are primarily concentrated in urban and suburban areas. More than four in ten Muslim Americans live in urban (40%) and in suburban areas (44%), and 16% live in rural areas. About one-third (32%) of Muslim Americans live in the Northeast, 31% live in the South, 19% live in the Midwest and 18% in the West. Muslim Americans are most likely to live in New York (14%), California (9%), and Pennsylvania (7%).
The median age of Muslim Americans over age 18 is 34 years old, much younger than the median age of 47 for all Americans. Muslim Americans are more likely to be young ages 18 to 29 (36%) and to be ages 30 to 49 (43%) than Americans overall (21% and 33%, respectively). Also, 15% of Muslim Americans are ages 50 to 64 and 5% are seniors ages 65 and over.
Other Nonwhite Protestant
Other nonwhite Protestants are Protestants who are not white, Black, or Hispanic and make up 3.5% of the American population. This group is primarily made up of multiracial Americans (42%), Native Americans (20%), and Asian Americans and Pacific Islanders (18%). This group generally lives in counties that are slightly less affected than other major religious groups, with a median case rate of 1,082 COVID-19 cases per 100,000 residents. Case growth has generally followed the median path of all other religious groups.
The demographic characteristics of other nonwhite Protestants are similar to those of Americans as a whole. Like Americans as a whole, a plurality of this group live in suburban areas (44%, compared to 43% for all Americans), while one-third (34%) live in urban areas (37% for all Americans), and just under one in four (23%) live in rural areas (20% for all Americans). This group is slightly more concentrated in the South (40%) and the West (27%) than all Americans (35% and 24% respectively), and slightly less prevalent in the Midwest (18%) or Northeast (15%) than all Americans (21% and 20% respectively). More than one in ten (12%) other nonwhite Protestants live in California, while 7% live in Florida, 5% live in Texas, and 5% live in North Carolina.
With a median age of 49 (compared to 47 for all Americans), other nonwhite Protestants are slightly older than all Americans, with 19% who are ages 18-29 (21% for all Americans), 31% who are ages 30 to 49 (33% for all Americans), 28% who are ages 50 to 64 (25% for all Americans), and 21% who are over age 65 (also 21% for all Americans).
Religiously Unaffiliated
About one in four (24%) Americans are religiously unaffiliated. This group has consistently remained in the middle tier of counties most affected by COVID-19 as cases have spread through the country. As of July 26, 2020, counties where religiously unaffiliated Americans live had a median case rate of 1,073 cases per 100,000 residents. Case growth has generally followed the median path of all other religious groups.
Religiously unaffiliated Americans are more likely to live in the South (40%) or West (30%) than the Northeast (20%) or Midwest (11%). More than one in ten (12%) unaffiliated Americans live in California, 7% live in Florida, 6% live in New York, and 6% live in Texas. Unaffiliated Americans are divided between living in suburban (42%) or urban areas (40%), while less than one in five (18%) live in rural areas.
Unaffiliated Americans are somewhat younger compared to all Americans.. One in three (31%) unaffiliated Americans are ages 18 to 29, compared to one in five (21%) of all Americans, and 36% of unaffiliated Americans are ages 30 to 49 (33% for all Americans). Unaffiliated Americans are less likely to be ages 50 to 64 (19%) or over age 65 (13%) compared to Americans overall (25% and 21% respectively).
White Catholic
White Catholics make up 12% of the American population and live in counties relatively less affected by COVID-19. As of July 26, 2020, counties where white Catholics live had a median case rate of 1,065 cases per 100,000 residents. As COVID-19 cases increased through the spring, counties where white Catholics live have been moderately less affected than other religious groups. Starting late June, COVID-19 cases in counties where white Catholics live have accelerated more rapidly than in the spring.
White Catholics are primarily concentrated in suburban areas and in the Northeast. Around half (48%) of white Catholics live in suburban areas, while one-third (33%) live in urban areas, and about one in five (18%) live in rural areas. Nearly three in ten (29%) white Catholics live in the Northeast, a little over one in four (26%) live in the Midwest and in the South (26%), and one in five live in the West (20%). White Catholics are most likely to live in California (9%), New York (9%), Florida (7%), Pennsylvania (6%), or Texas (5%).
The median age of white Catholics over age 18 is 52 years old, compared to 47 for all Americans. White Catholics are more likely to be ages 50 to 64 (29%) or seniors ages 65 or over (26%) than Americans overall (25% and 21%, respectively), and less likely to be ages 18 to 29 (14%), compared to all Americans (21%). However, they are similarly likely to be ages 30 to 49 than all Americans (31% vs. 33%).
Unitarian Universalist
Unitarians Universalists make up 0.1% of the population and live in areas that have been less affected by COVID-19. As of July 26, 2020, Unitarian Universalists live in counties with median case rates of 1,022 cases per 100,000 residents. As COVID-19 cases have spread through the spring and summer, the counties where Unitarian Universalists live have been somewhat less affected areas.
Unitarian Universalists are primarily concentrated in suburban areas and in the Midwest. The majority (55%) of Unitarian Universalists live in suburban areas, 36% live in urban areas, and 9% live in rural areas. About three in ten (31%) Unitarian Universalists live in the Midwest, one in four (25%) live in the South, 23% live in the Northeast, and 22% live in the West. Unitarian Universalists are most likely to live in California (13%), Florida (10%), New York (7%), and Minnesota (6%).
Unitarian Universalists are generally older than all Americans, with a median age of 53 compared to 47 for all Americans. More than one in ten (12%) Unitarian Universalists are ages 18-29, compared to 21% of all Americans, while 28% are ages 30 to 49 (33% for all Americans). More Unitarian Universalists are ages 50 to 64 (30%) and over age 65 (29%) than all Americans (25% and 21%, respectively).
Buddhist
Buddhist Americans make up 0.8% of the American population and are less likely than other religious groups to live in areas that are highly affected by COVID-19. As of July 26, 2020, counties where Buddhist Americans live have median case rates of 999 cases per 100,000 residents. Counties, where Buddhist Americans live, have seen steady growth of COVID-19 case rates, but unlike many other groups have not seen much acceleration since late June or early July.
As COVID-19 cases increased through the spring, counties, where Buddhist Americans live, have been less affected than nearly any other religious group, with the exception of Mormons and white evangelical Protestants.
Buddhist Americans are primarily concentrated in suburban and urban areas. Nearly half (47%) of Buddhist Americans live in suburban areas, four in ten (40%) live in urban areas, and 13% live in rural areas. About one-third of Buddhist Americans live in the West (34%), 28% live in the South, 21% live in the Northeast, and 18% live in the Midwest. Buddhist Americans are most likely to live in California (21%), Texas (8%), and New York (8%).
Buddhist Americans are more likely to be younger than all Americans (median age of 36 vs. 47). Specifically, Buddhist Americans are more likely to be young ages 18 to 29 (39%), compared to 21% of all Americans in this age group. However, Buddhist Americans are similarly likely to be ages 30 to 49 (29%) and seniors ages 65 and over (15%) than Americans overall (33% and 21%, respectively). Fewer than one in five (18%) Buddhist Americans are ages 50 to 64.
White Mainline Protestant
White mainline Protestants make up 14.7% of the American population. White mainline Protestants are less likely than their nonwhite counterparts to live in counties that are highly affected by COVID-19. The counties where this group lives had median case rates of992 cases per 100,000 residents as of July 26, 2020. The per capita cases have risen steadily in these counties, though they have been consistently less affected than counties where most other religious groups live.
The demographic characteristics of white mainline Protestants generally align with those of the country as a whole. This group is about as likely to live in urban (34%), suburban (43%), or rural areas (23%) as all Americans (37%, 43%, and 20% respectively). They are also similarly distributed across the Northeast (19%) and the South (36%) as all Americans (20% and 35% respectively), though they are slightly more likely to live in the Midwest (26%) than all Americans (21%), and comparatively less likely to live in the West (20%) than all Americans (24%). White mainline Protestants are most likely to live in the largest states: 7% live in California, 7% live in Florida, 6% live in Texas, and 5% live in New York.
With a median age of 50 (47 for all Americans), white mainline Protestants as a group are slightly older than Americans overall. Fewer than one in five (16%) white mainline Protestants are between the ages of 18 and 29, and 31% are between ages 30 and 49 (21% and 33% for all Americans respectively). Around one quarter (27%) are ages 50 to 64, and three in ten (30%) are over age 65, compared to 25% and 21% for all Americans in these two age groups.
Mormon
Mormons make up 1.7% of the population and live in areas that have been some of the least affected by COVID-19. As of July 26, 2020, Mormons live in counties with median case rates of 952 cases per 100,000 residents. As COVID-19 cases have spread through the spring and summer, the counties where Mormons live have consistently been some of the least affected areas.
The geographic distribution of Mormons is very different from that of Americans a whole. More than six in ten (63%) Mormons live in the West, more than twice the share of all Americans (24%). Significantly fewer live in the South (17%), the Midwest (13%) or the Northeast (6%), compared to 35% of all Americans who live in the South, 21% who live in the Midwest, and 20% who live in the Northeast. Mormons are also much more likely to live in rural areas (31%) than all Americans (20%), and less likely to live in urban areas (29%) than all Americans (37%), though they are similarly likely to live in suburban areas (40% vs. 42% for all Americans). Nearly three in ten (28%) Mormons live in Utah, while 8% live in California, 7% live in Idaho, and 5% live in Arizona.
Mormons are generally younger than all Americans, with a median age of 44 compared to 47 for all Americans. One in four (25%) Mormons are ages 18-29, compared to 21% of all Americans, while 34% are ages 30 to 49 (33% for all Americans). Slightly fewer Mormons are ages 50 to 64 (21%) than all Americans (25%), while the proportion of Mormons over age 65 (21%) is the same as all Americans (21%).
White Evangelical Protestant
White evangelical Protestants make up 15.2% of the population. This group is the least likely major religious group to live in counties that are highly affected by COVID-19. As of July 26, 2020, the median number of cases per 100,000 residents in the counties where white evangelical Protestants live is 948. Since March, this group has consistently been at or near the bottom of all religious groups in its growth in per capita cases.
White evangelical Protestants are less likely to live in urban areas, which likely accounts for the slower spread of COVID-19 among this group. Nearly three in ten (28%) white evangelical Protestants live in rural areas, compared to 20% of all Americans. About as many (29%) live in urban areas (compared to 37% of all Americans), and the remaining 42% live in suburban areas (similar to 43% of all Americans). White evangelical Protestants are much more likely to live in the South (45%), and somewhat more likely to live in the Midwest (24%) than all Americans (35% and 21% respectively), and correspondingly less likely to live in the West (17% vs. 24%) or the Northeast (15% vs. 20%). This group is most likely to live in Texas (8%), California (7%), Florida (7%), Ohio (5%), or North Carolina (5%).
This group is significantly older than the population as a whole, with a median age of 55 compared to 47 for all Americans. Barely more than one in ten (11%) white evangelical Protestants are ages 18 to 29, just more than half the proportion of Americans as a whole who are in the same age range (21%). Around three in ten are ages 30 to 49 (29%), 50 to 64 (30%), or over age 65 (30%), compared to 33%, 25%, and 21% of all Americans respectively.
Survey Methodology
The 2019 American Values Atlas (AVA) is a project of PRRI. Results for all demographic, religious affiliation, and political affiliation questions were based on 53,474 bilingual telephone interviews (including 33,708 cell phone interviews) conducted between January 2, 2019 and December 30, 2019 by professional interviewers under the direction of SSRS.
The COVID-19 religious tracker was made possible by generous support from the Henry Luce Foundation. The AVA survey was made possible by generous support from the Arcus Foundation, the E. Rhodes & Leona B. Carpenter Foundation, the Evelyn and Walter Haas, Jr. Fund, the Gill Foundation, and Unitarian Universalist Veatch Program at Shelter Rock.
Throughout 2019, at least 1,000 interviews were completed each week, with about 600 interviews conducted among respondents on their cell phones. Mid-year, the cell phone proportion was increased to about 700 per week. Each week, interviewing occurred over a five- or six-day period, starting Tuesdays or Wednesdays and going through Sunday or Monday. The selection of respondents within households was accomplished by randomly requesting to speak with the youngest adult male or female currently living in the household.
Data collection was based on stratified, single-stage, random-digit-dialing (RDD) of landline telephone households and randomly generated cell phone numbers. The sample was designed to represent the total U.S. adult population from all 50 states, including Hawaii and Alaska, and the District of Columbia. The landline and cell phone samples were provided by Marketing Systems Group.
The weighting was accomplished in two separate stages. The first stage of weighting corrects for different probabilities of selection associated with the number of adults in each household and each respondent’s telephone usage patterns. In the second stage, sample demographics were balanced to match target population parameters for gender, age, education, race and Hispanic ethnicity, region (U.S. Census definitions), population density, and telephone usage. The population density parameter was derived from 2010 Census data. The telephone usage parameter came from an analysis of the January-June 2017 National Health Interview Survey. All other weighting parameters were derived from an analysis of the U.S. Census Bureau’s March 2017 Current Population Survey.
The sample weighting was accomplished using iterative proportional fitting (IFP), a process that simultaneously balances the distributions of all variables. Weights are trimmed so that they do not exceed 4.0 or fall below 0.25 to prevent individual interviews from having too much influence on the final results. The use of these weights in statistical analysis ensures that the demographic characteristics of the sample closely approximate the demographic characteristics of the target populations.
The margin of error for the total sample is +/- 0.4 percentage points at the 95% level of confidence. The design effect for the total sample is 1.3. In addition to sampling error, surveys may also be subject to error or bias due to question wording, context, and order effects.
Religious Affiliation
Respondents’ religious affiliation is obtained using their answer to the following question: “What is your present religion, if any? Are you Protestant, Roman Catholic, Mormon, Orthodox such as Greek or Russian Orthodox, Jewish, Muslim, Buddhist, Hindu, atheist, agnostic, something else, or nothing in particular?” Atheist, agnostic, and nothing in particular responses are categorized as “unaffiliated.” All respondents who identified as any form of Protestant Christian or “just Christian” were asked a follow-up in order to identify evangelicals: “Would you describe yourself as a “born-again” or evangelical Christian, or not?” Table 1 provides the sample sizes for all religious subgroups discussed in this report.
COVID-19 Data
The COVID-19 case data is sourced from the COVID-19 Data Repository by the Center for Systems Science and Engineering at Johns Hopkins University and can be found here: https://github.com/CSSEGISandData/COVID-19.
To merge the data in with the PRRI American Values Atlas data, cases are matched to AVA respondents at the county level, generating new variables in the AVA data that identify the daily number of cases in the county in which the respondent resides. The Johns Hopkins data reports only one value for New York City (Bronx, Brooklyn, Kings, New York, and Richmond counties) and for Kansas City (Cass, Clay, Jackson, and Platte counties), as do almost all sources of COVID-19 case data. These counties are recoded together in the AVA data in order to accommodate the COVID-19 data, meaning that all New York City, NY residents and all Kansas City, MO residents are given their city’s case rate rather than the county.
Table 1: Sample Sizes, Population Proportions, and Margins of Error for Religious Affiliations
| Unweighted Sample Size | Weighted % of population | Margin of Error* | |
| Religiously unaffiliated | 12,272 | 24 | 1.0 |
| White evangelical Protestant | 8,974 | 15 | 1.2 |
| White mainline Protestant | 8,778 | 15 | 1.2 |
| White Catholic | 7,334 | 12 | 1.3 |
| Black Protestant | 3,278 | 7 | 2.0 |
| Hispanic Catholic | 3,159 | 8 | 2.0 |
| Other nonwhite Protestant | 1,760 | 4 | 2.7 |
| Hispanic Protestant | 1,598 | 4 | 2.8 |
| Other nonwhite Catholic | 1,094 | 2 | 3.4 |
| Mormon | 915 | 2 | 3.7 |
| Jewish | 885 | 1 | 3.8 |
| Buddhist | 384 | 1 | 5.7 |
| Muslim | 308 | 1 | 6.4 |
*The reported margin of error includes the design effect.


