Introduction
Young Americans (ages 18-29) have consistently been more supportive of LGBTQ rights compared with other age groups. The majority of young Americans favor nondiscrimination protections for LGBTQ Americans and allowing same-sex couples to marry legally and oppose allowing businesses to refuse service to LGBTQ Americans if doing so goes against their religious beliefs. However, overall support for LGBTQ rights among 18 to 29-year-olds has seen a decline over the past few years, with the most notable drops among Republicans.
Support for Nondiscrimination Protections
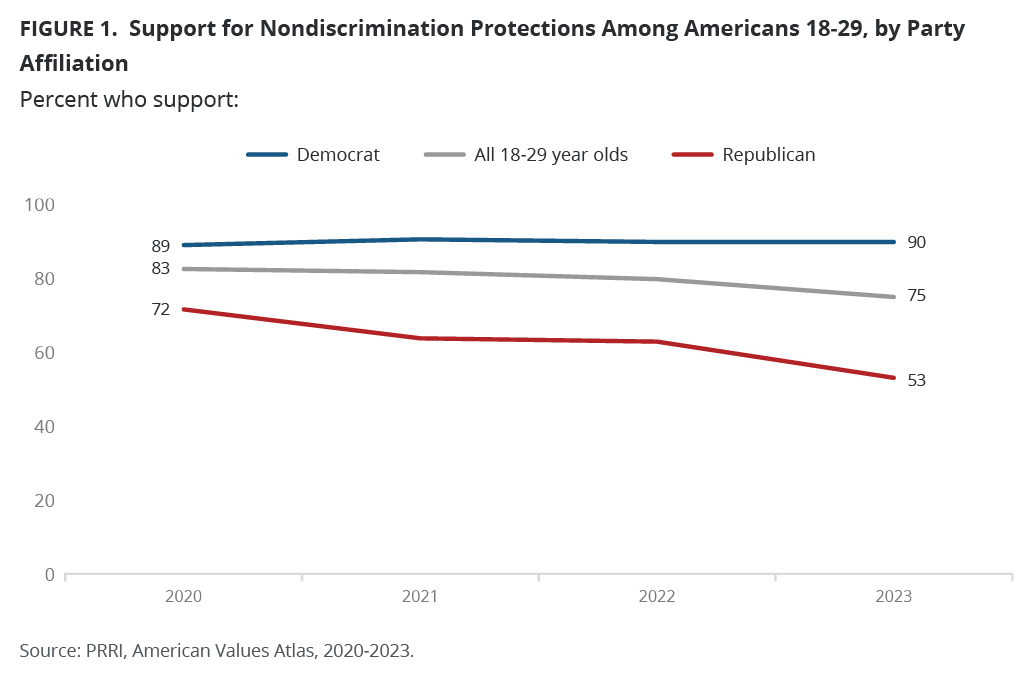
Three in four young Americans 18 to 29 (75%) favor laws that would protect LGBTQ Americans from discrimination in jobs, public accommodations, and housing. However, there has been a gradual decline from 2020 to 2023, with the most significant drop from 80% in 2022 to 75% in 2023.
Support for nondiscrimination protections among Democrats ages 18 to 29 has shifted little, with around nine in ten favoring LGBTQ nondiscrimination protections from 2020 to 2023. Young independents’ support for nondiscrimination protections showed little change from 2020 to 2022 but dropped 5 percentage points from 83% in 2022 to 78% in 2023. Support among Republicans 18 to 29 has seen the most significant declines in the past four years, dropping by nearly 20 percentage points from 72% in 2020 to 53% in 2023.
Opposition to Religiously Based Service Refusals
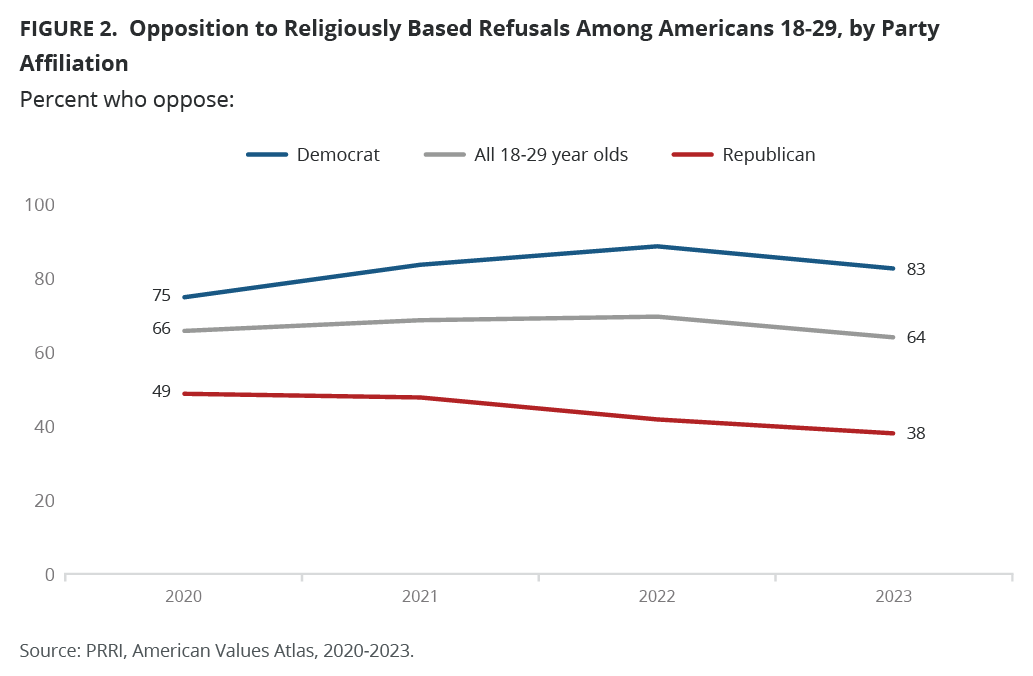
In 2023, about two-thirds of Americans ages 18 to 29 (64%) oppose allowing small businesses to refuse providing goods or services to LGBTQ Americans if doing so goes against their religious beliefs. This is about a 5 percentage point decrease from around seven in ten opposing such religiously based service refusals in 2021 (69%) and 2022 (70%) but is similar to the rate of opposition to refusals in 2020 (66%). In 2023, the vast majority of young Democrats (83%) oppose religiously based service refusals compared with 62% of young independents and 38% of young Republicans.
Young Democrats have fluctuated the most among partisan groups. In 2023, 83% of Democrats ages 18 to 29 oppose religiously based service refusals. Even though this percentage decreased from 89% in 2022, it is notably up from 75% in 2020. Sixty-two percent of independents in 2023 also oppose these refusals, a decrease from 68% in 2020. Young Republicans’ opposition to religiously based refusals has seen the most dramatic decline, from 49% in 2020 to 38% in 2023.
Support for Same-Sex Marriage
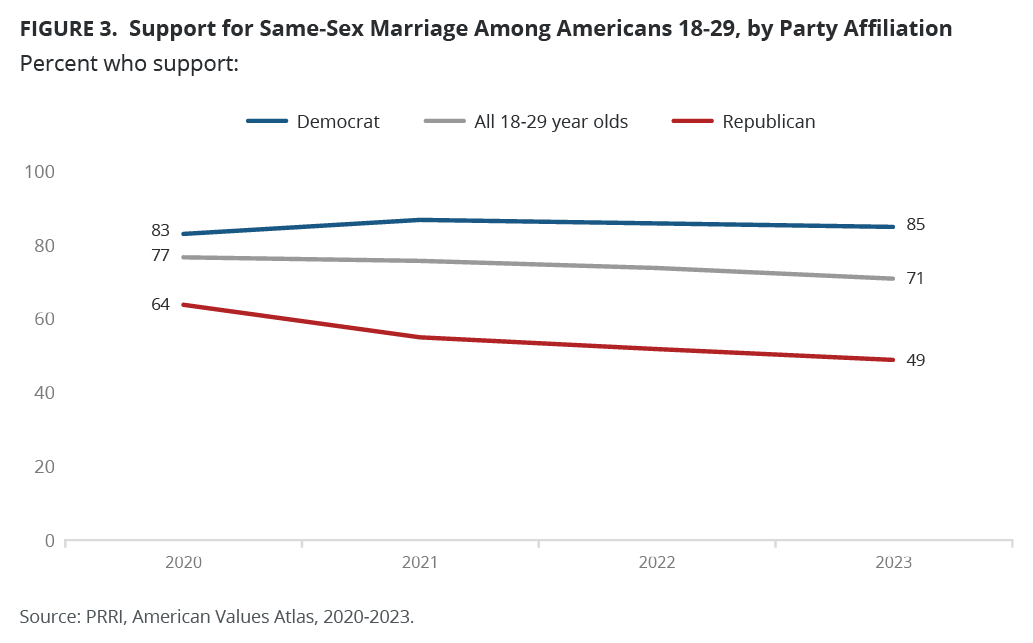
Around seven in ten Americans ages 18 to 29 (71%) support allowing same-sex couples to marry legally. This percentage has gradually declined from 77% in 2020. More than eight in ten young Democrats (85%) support same-sex marriage compared with three-fourths of young independents (75%) and just under half of young Republicans (49%).
Both young Democrats and young independents have shown little change in their support for allowing same-sex couples to marry legally from 2020 to 2023. However, there has been a substantial decrease in support among young Republicans (25 percentage points). In 2023, under half (49%) of young Republicans support same-sex marriage, compared with 64% in 2020.
Although there is still broad support for LGBTQ rights among young Americans, the dramatic decline in support among young Republicans is noteworthy.