The 2022 PRRI Census of American Religion update is part of an annual update to the groundbreaking 2020 PRRI Census of American Religion, the first study to provide reliable county-level religious affiliation data. To see the 2021 PRRI Census of American Religion update, click here.
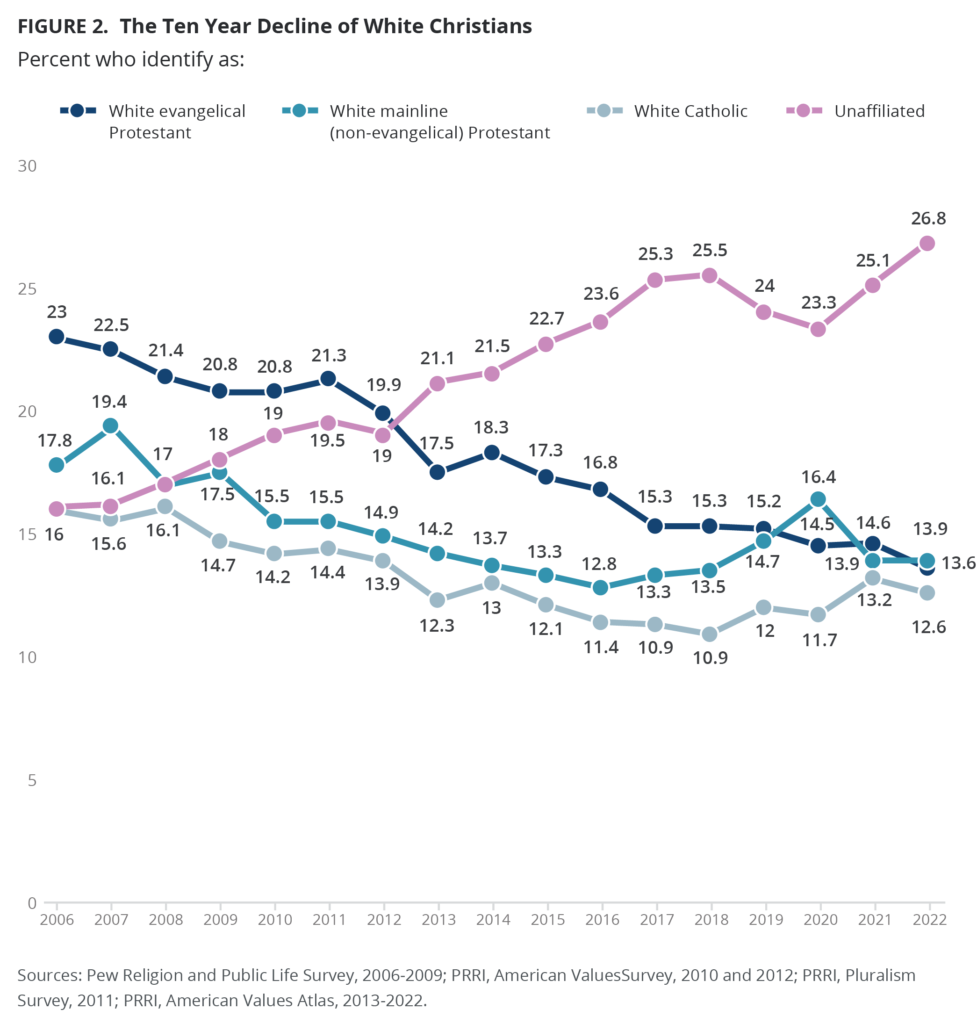
As part of the 2022 PRRI American Values Atlas, a random sample of 40,000 respondents from the Ipsos KnowledgePanel shows that most trends in religious affiliation moved little between 2021 and 2022. Notably, the proportion of white Christians in the country has remained steady, at 42%, after a long decline from 72% in 1990 to 42% in 2018. In 2020 and 2021 the share of white Christians in the country bumped up to 44% before returning to its current rate. The proportion of those who are religiously unaffiliated has ticked up again, to 27%, after rising from 16% in 2006 to nearly 26% in 2018, which was followed by a brief downward dip to 23% in 2020.
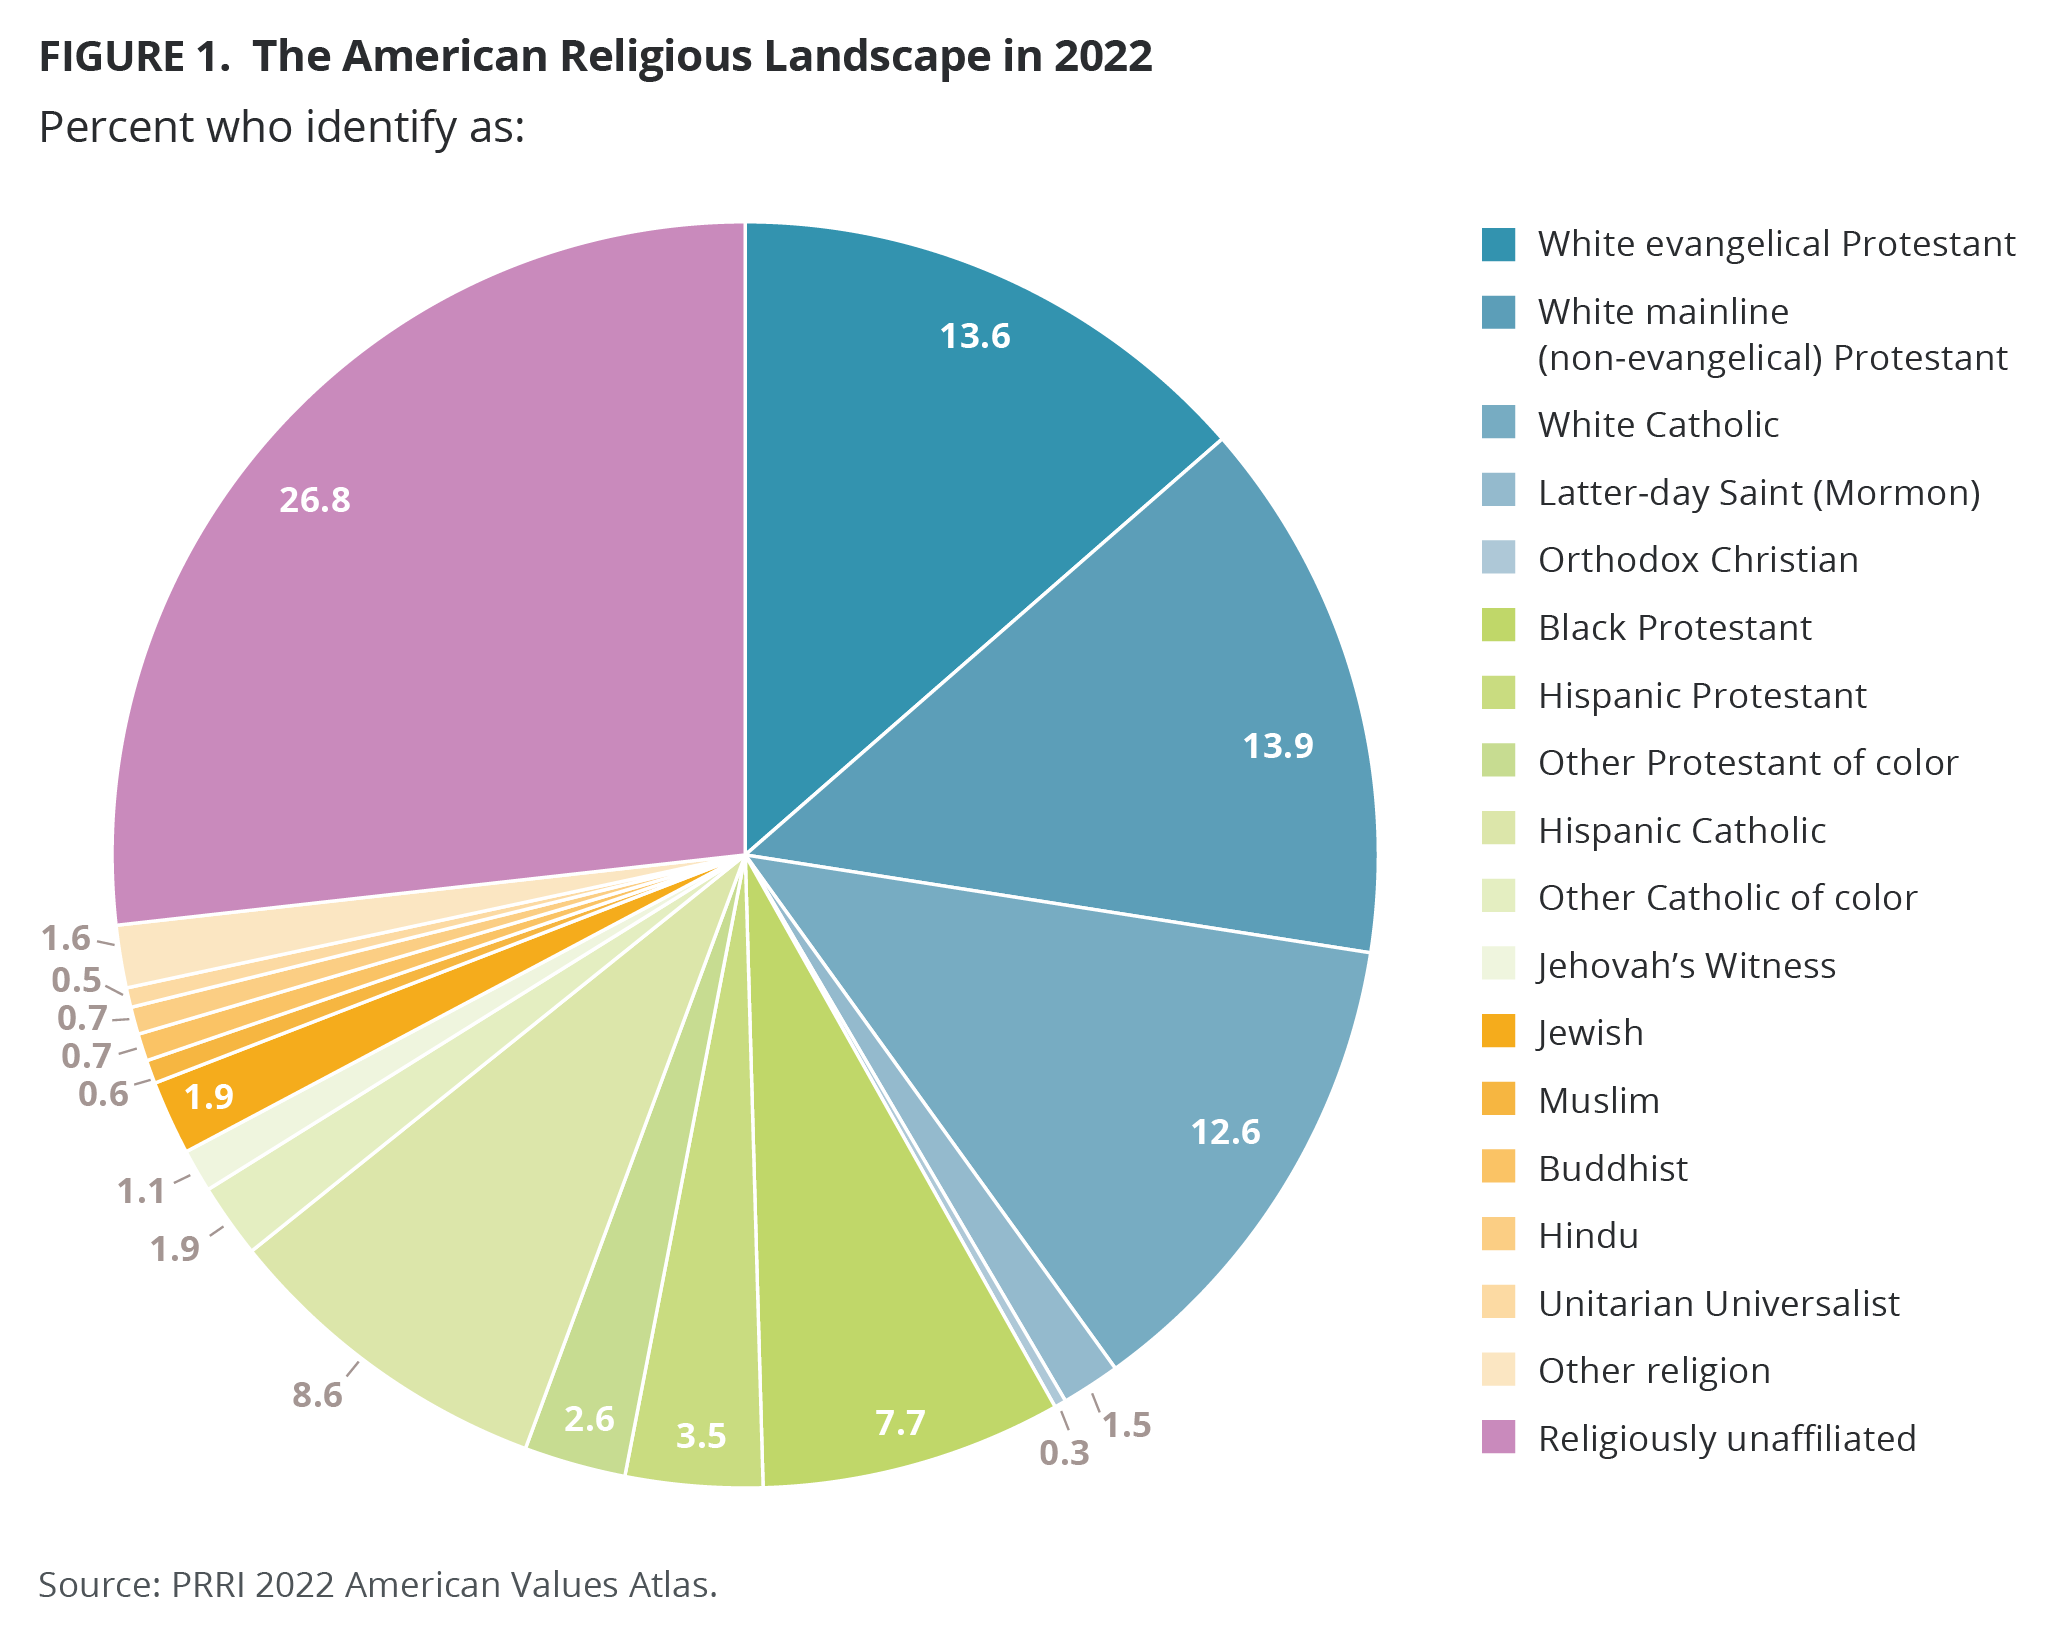
An additional quarter of the country (25%) is composed of Christians of color, meaning Christians who are Black, Hispanic, Asian American, Native American, multiracial, or any other race or ethnicity. This figure is essentially unchanged from the preceding few years. The remaining 6% of Americans belong to a different religion. This group includes those who are Jewish, Muslim, Hindu, Buddhist, Unitarian Universalist, or belong to any other world religion. This proportion has also remained steady over the past few years.
The white Christian portion of the U.S. adult population includes 14% who are white evangelical Protestant, 14% who are white mainline (non-evangelical) Protestant, 13% who are white Catholic, and small proportions of white Latter-Day Saints, Jehovah’s Witnesses, and Orthodox Christians. The proportion of white evangelical Protestants in the population steadily declined starting in 2006 (when they made up 23% of the population) before settling at about 14% over the past few years. White mainline (non-evangelical) Protestants and white Catholics accounted for similar portions of the population in 2022, at 14% and 13%, respectively. Both these groups have declined as a proportion of the population since 2006, when they were at 18% and 16%, respectively. However, these drop-offs of roughly four percentage points are less pronounced than the nine-percentage-point decline in white evangelical Protestant affiliation. The religiously unaffiliated category has absorbed much of the fall-off.
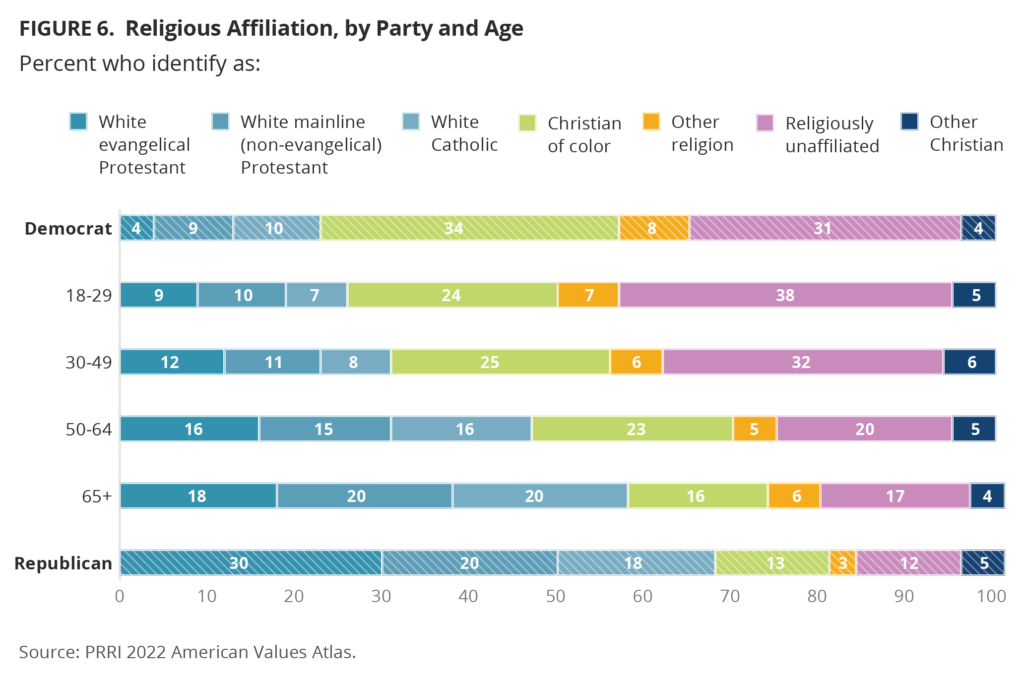
Both major political parties are majority Christian, but the total Christian proportion is much higher among Republicans (85%) than among Democrats (62%). The makeup of the Christian coalition within each party is vastly different as well. The largest Christian groups among Republicans are all white: white evangelical Protestants (30%), white mainline Protestants (20%), and white Catholics (18%). On the Democratic side, the largest groups are Black Protestants (16%), Hispanic Catholics (12%), white Catholics (10%), and white mainline Protestants (9%). Overall, Republicans are 71% white Christian and 14% Christian of color, while Democrats are 24% white Christian and 38% Christian of color.
The remainder of each party — 39% of Democrats and 15% of Republicans — belong to other religions or are religiously unaffiliated. Three in ten Democrats (31%) are religiously unaffiliated; 3% are Jewish; Muslims, Buddhists, Hindus, and Unitarian Universalists account for about 1% each; and another 1% belong to other religions. On the Republican side, 12% are religiously unaffiliated, 1% are Jewish and 1% belong to all other religions.
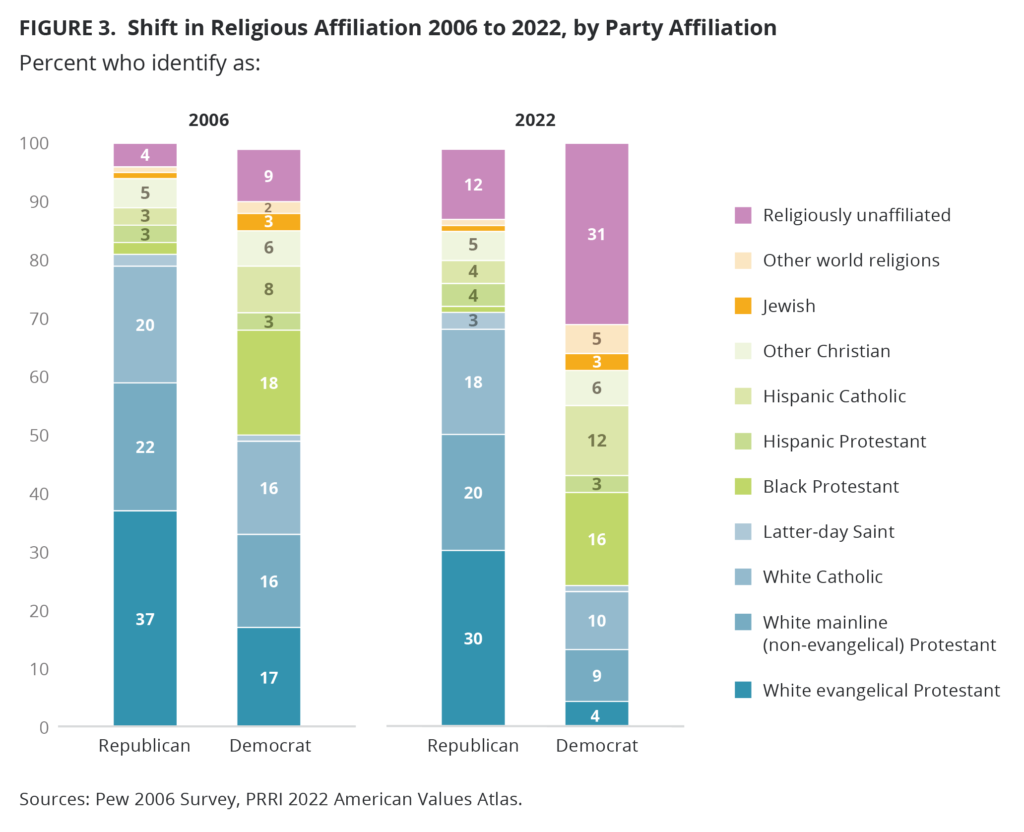
Though the religious makeup of the parties has not shifted significantly in the past year, both parties have seen considerable shifts in the religious makeup of their constituencies over the past 16 years. Democrats have seen a much more sweeping shift than Republicans, with the party going from 85% Christian in 2006 to 62% in 2022 (a 23-percentage-point change), while Republicans saw only a nine-percentage-point shift, from 94% to 85% Christian. Democrats also saw the share of white evangelical Protestants in their ranks drop from 17% to 4%, while the share of religiously unaffiliated Democrats increased from 9% to 31%. The proportion of white evangelicals among Republicans has decreased as well, but not by nearly so much — going from 37% to 30% — and the increase in those who are religiously unaffiliated was also smaller, going from 4% to 12%.
Dramatic differences in religious affiliation by age group have contributed to the change in the nation’s religious landscape. As of 2022, 55% of those ages 18–29 are Christian (down slightly from 58% in 2021), as are 62% of those ages 30–49 (similar to 64% in 2021), 74% of those ages 50–64 (unchanged from 76% in 2021), and 77% of those ages 65 and over (unchanged from 78% in 2021). The racial makeup of the Christians in these age groups varies considerably as well. In the youngest group, 29% are white, while 34% are white in the 30–49 group, along with 48% in the 50–64 age group and 59% of Christians 65 and older. The proportion of white Christians has decreased by one to two percentage points across every age group since 2021.
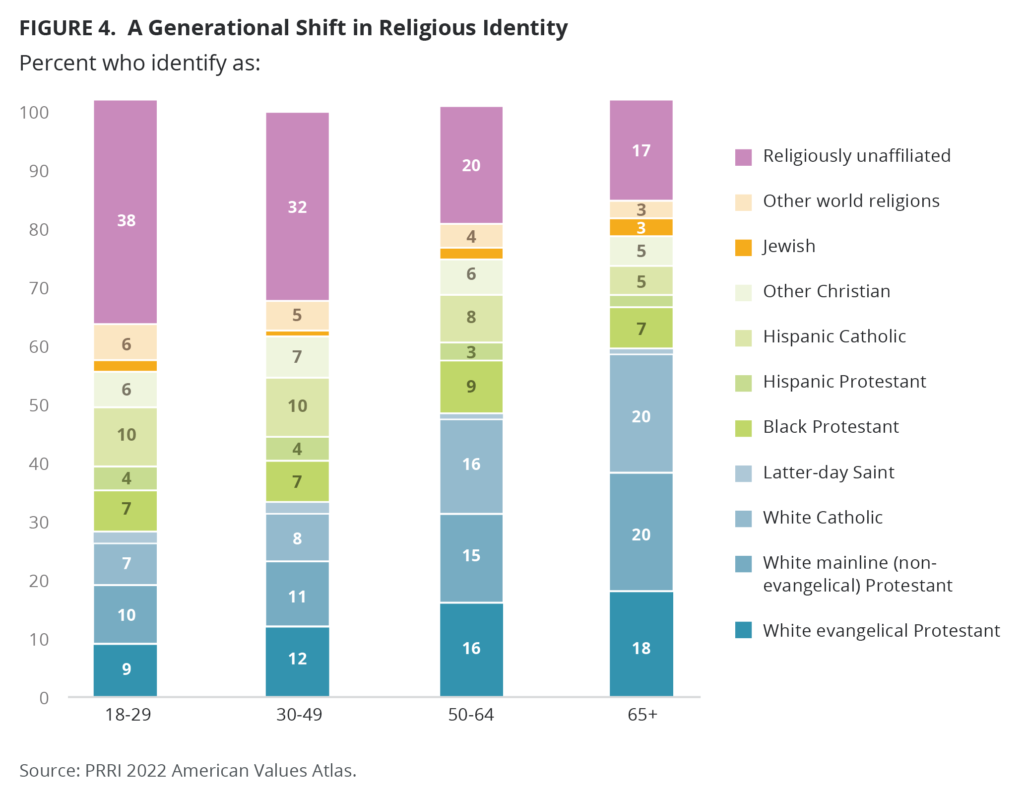
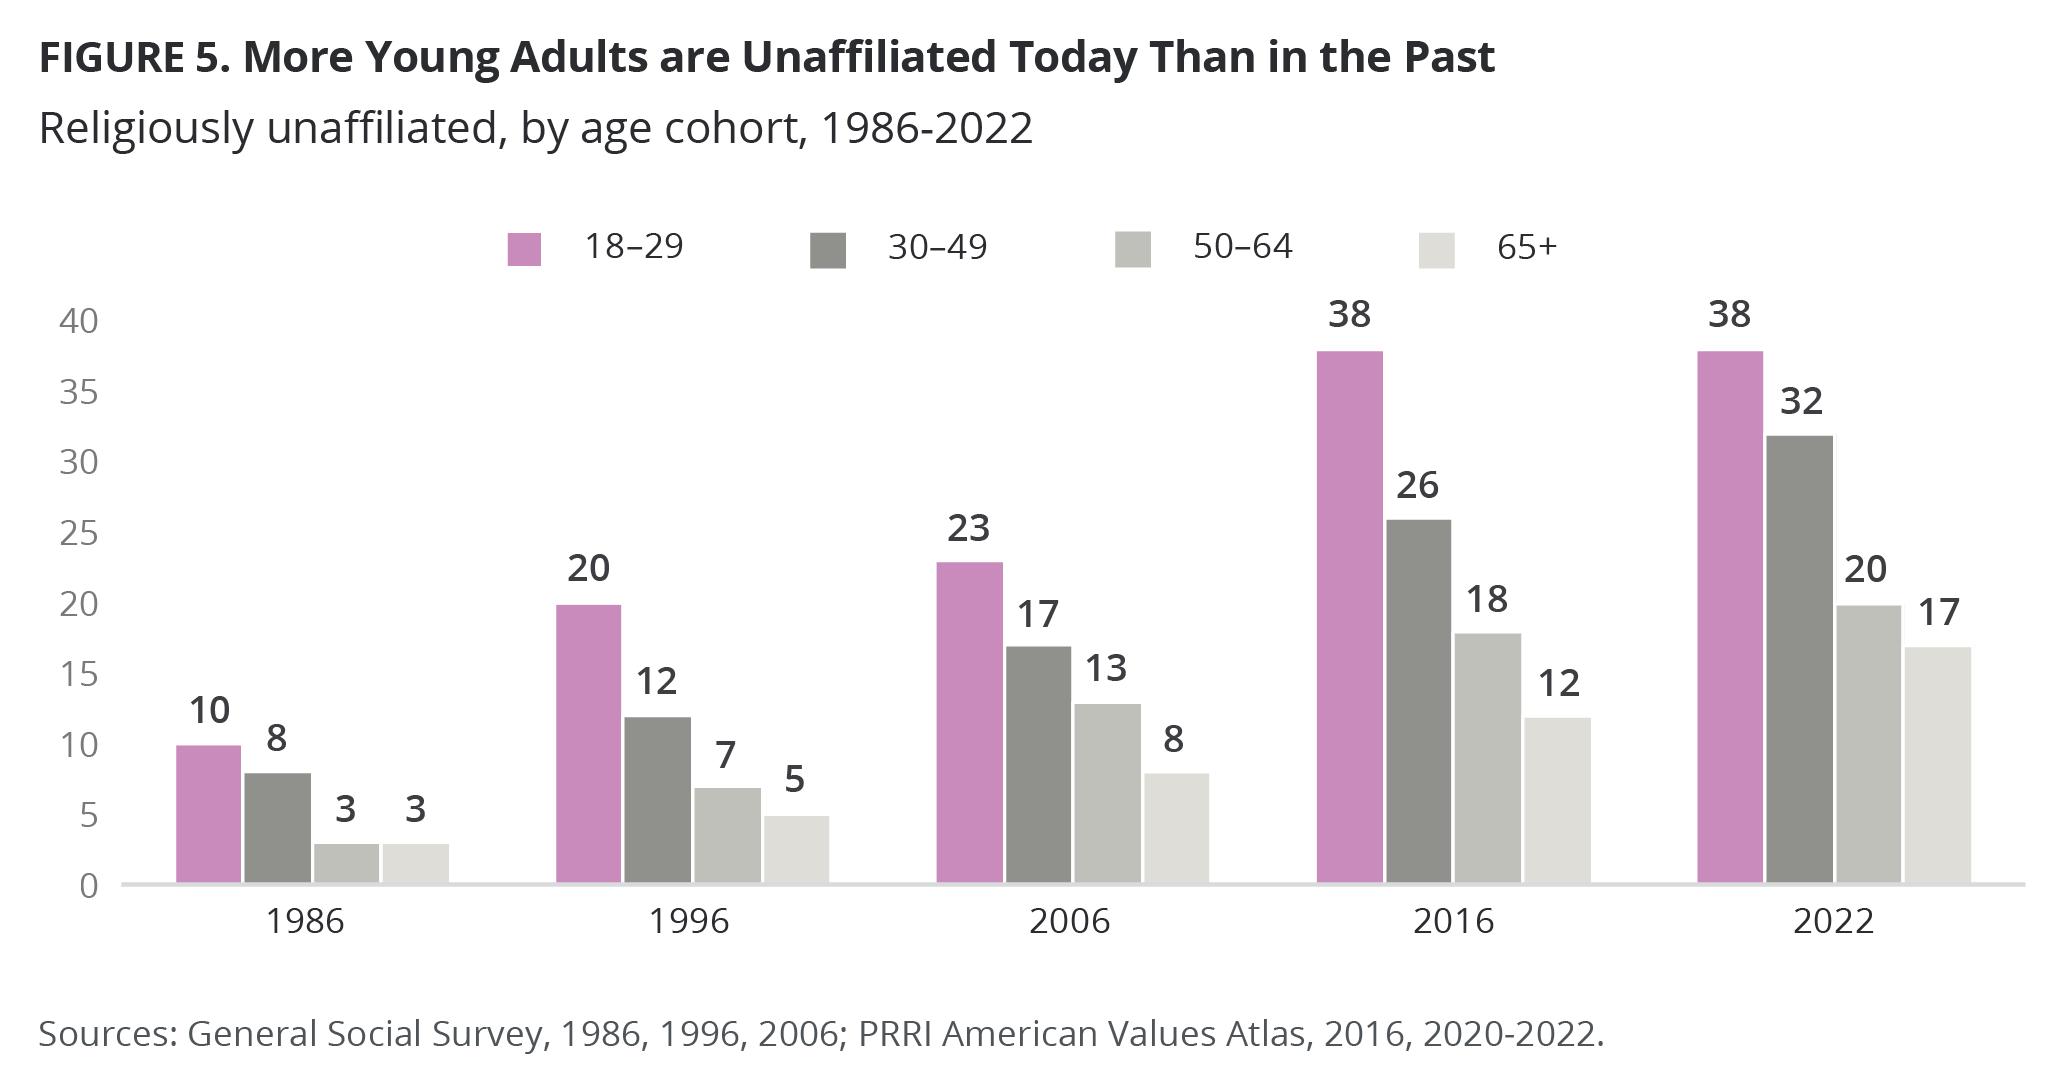
The reason for this change is that younger Americans are more likely to be religiously unaffiliated or to belong to non-Christian religions. Nearly four in ten Americans ages 18–29 (38%) are religiously unaffiliated, an increase from 34% in 2021. About a third of those ages 30-49 (32%) are unaffiliated, similar to the proportion in 2021, when 31% were unaffiliated. Over age 50, however, there is a substantial dropoff: 20% of those ages 50–64 are religiously unaffiliated (similar to 19% in 2021), as are 17% of those ages 65 and over (similar to 16% in 2021). Nearly one in ten young Americans (8%) are members of a non-Christian religion, as are 6% of those in all other age groups.
Young Americans ages 18-29 have dominated the growth in the religiously unaffiliated category over the past four decades, but the percentage of those in this age group who are unaffiliated has remained stable around 34–38% since 2016. However, as the cohorts age, the growth in religiously unaffiliated Americans has started to show up more in the 30-49 age category, which is up to 32% unaffiliated from 26% in 2016. The 50-64 group has seen a smaller bump, with the religiously unaffiliated going from 18% in 2016 to 20% in 2022, while the 65-and-older age group has jumped from 12% unaffiliated in 2016 to 17% in 2022.
Younger Americans closely resemble the Democrats in religious makeup, with more diversity in religious affiliation and more than three in ten claiming no religious affiliation at all. Democrats have a higher percentage of Christians of color than the 18-29 age group, and the young cohort includes a larger proportion of unaffiliateds than do Democrats. Republicans resemble older Americans — the vast majority are white Christian, and, while the religiously unaffiliated portion is growing, it is not a substantial constituency within the party. However, Republicans are more likely to be white evangelical Christians than those ages 65 and older, and the proportion of unaffiliated Americans is higher in the older age category than among Republicans.
Methodology
This portion of the 2022 American Values Atlas consists of demographic information drawn from 40,000 interviews of adults (age 18 and up) living in all 50 states in the United States who are part of the Ipsos KnowledgePanel.
Respondents are recruited to the KnowledgePanel using an address-based sampling methodology based on the United States Postal Service’s Delivery Sequence File — a database that contains all delivery addresses in the country. As such, it covers all households regardless of their phone status, providing a representative online sample. Unlike opt-in panels, households are not permitted to “self-select” into the panel, and participants are generally limited on the number of surveys they can take within a given time period.
The initial sample drawn from the KnowledgePanel was adjusted using pre-stratification weights in order to approximate the adult U.S. population defined by the latest March supplement of the Current Population Survey. Next, a probability proportional to size (PPS) sampling scheme was used to select a representative sample.
To reduce the effects of any non-response bias, a post-stratification adjustment was applied based on demographic distributions from the most recent American Community Survey (ACS). The post-stratification weight rebalanced the sample based on the following benchmarks: age, race and ethnicity, gender, Census division, metro area, education, and income. The sample weighting was accomplished using an iterative proportional fitting (IFP) process that simultaneously balances the distributions of all variables. Weights were trimmed to prevent individual interviews from having too much influence on the final results. In addition to an overall national weight, separate weights were computed for each state to ensure that the demographic characteristics of the sample closely approximated the demographic characteristics of the target populations. The state-level post-stratification weights rebalanced the sample based on the following benchmarks: age, race and ethnicity, gender, education, and income.
The margin of error for the national survey is +/- 0.7 percentage points at the 95% level of confidence, including the design effect for the survey of 1.8. In addition to sampling error, surveys may also be subject to error or bias due to question wording, context, and order effects. Additional details about the KnowledgePanel can be found on the Ipsos website: https://www.ipsos.com/en-us/solution/knowledgepanel