

The 2021 PRRI Census of American Religion update is an update to the groundbreaking 2020 PRRI Census of American Religion, the first study to provide reliable county-level religious affiliation data.
The 2021 PRRI American Values Atlas, a project of 40,000 surveys throughout 2021, shows that most trends in religious affiliation moved little between 2020 and 2021. Notably, the proportion of white Christians in the country, which had declined from 72% in 1990 to 42% in 2018, has converged at 44% in 2020 and 45% in 2021.[1] The proportion of those who are religiously unaffiliated has steadied as well, after rising from 16% in 2006 to nearly 26% in 2018. After a brief downward blip to 23% in 2020, 25% of Americans are in the religiously unaffiliated category, the 2021 AVA shows.
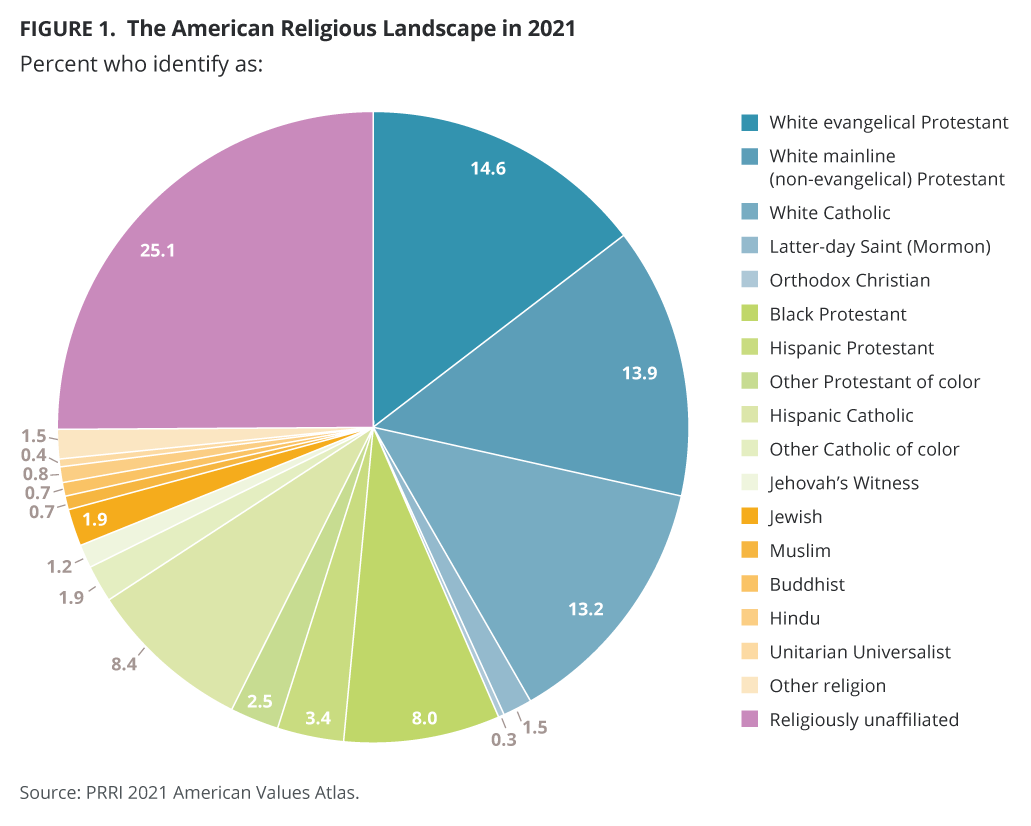
An additional quarter of the country is comprised of Christians of color, meaning Christians who are Black, Hispanic, Asian American, Native American, multiracial, or any other race or ethnicity. This figure is also essentially unchanged from 2020. The remaining six percent of Americans belong to a different religion, including those who are Jewish, Muslim, Hindu, Buddhist, Unitarian Universalist, or any other world religion.
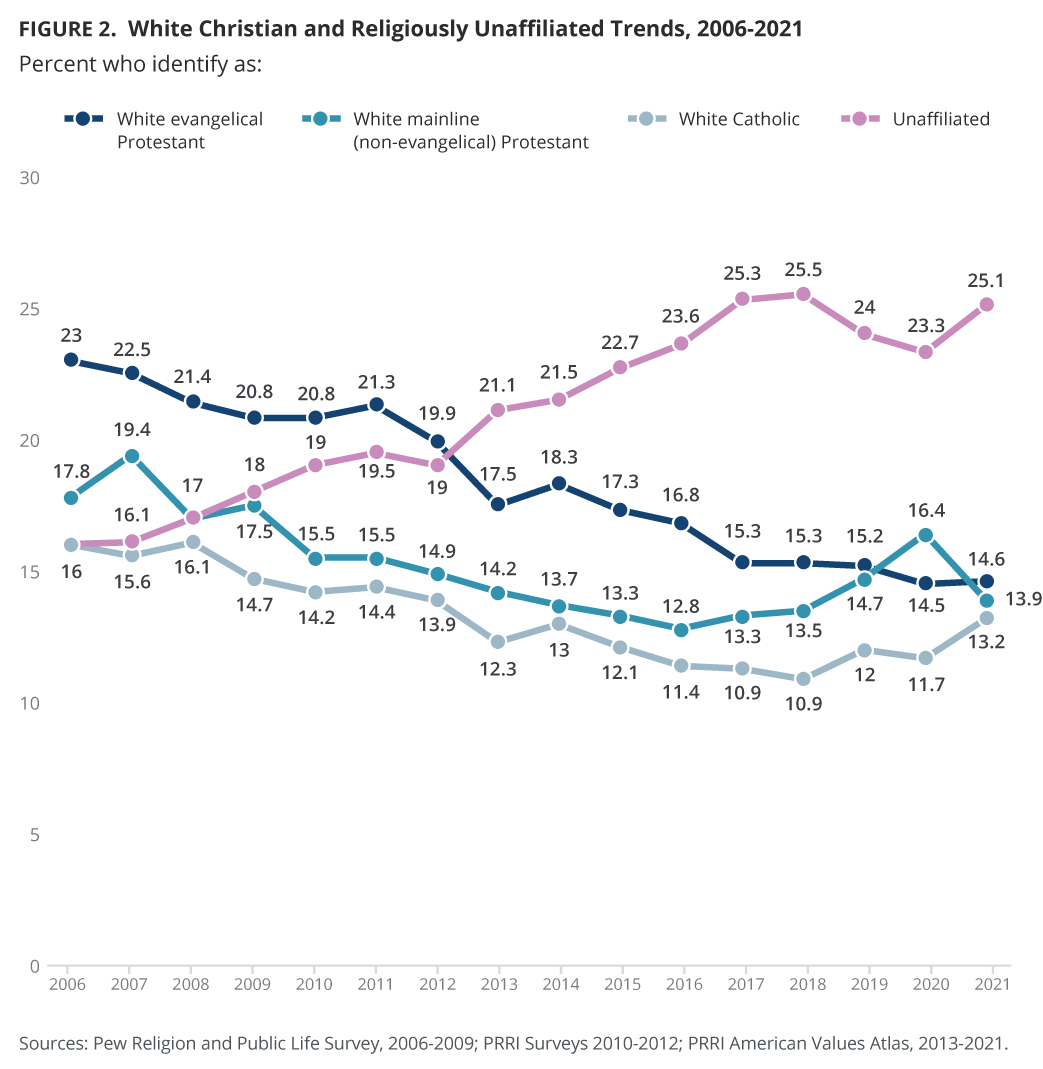
The white Christian portion of the U.S. adult population includes 15% who are white evangelical Protestant, 14% who are white mainline (non-evangelical) Protestant, 13% who are white Catholic, and small proportions of white Latter-Day Saints, Jehovah’s Witnesses, and Orthodox Christians. White evangelical Protestants have steadily declined as a proportion of the population since 2006 (23%), to between 14% and 15% over the last three years. White mainline (non-evangelical) Protestants are a similar proportion (14%), and white Catholics are at 13% of the population in 2021. Both white mainline Protestants and white Catholics have declined as a proportion of the population since 2006 (18% and 16%, respectively), but the drop-off has been less severe than that of white evangelical Protestants. The religiously unaffiliated category has absorbed much of the fall-off.
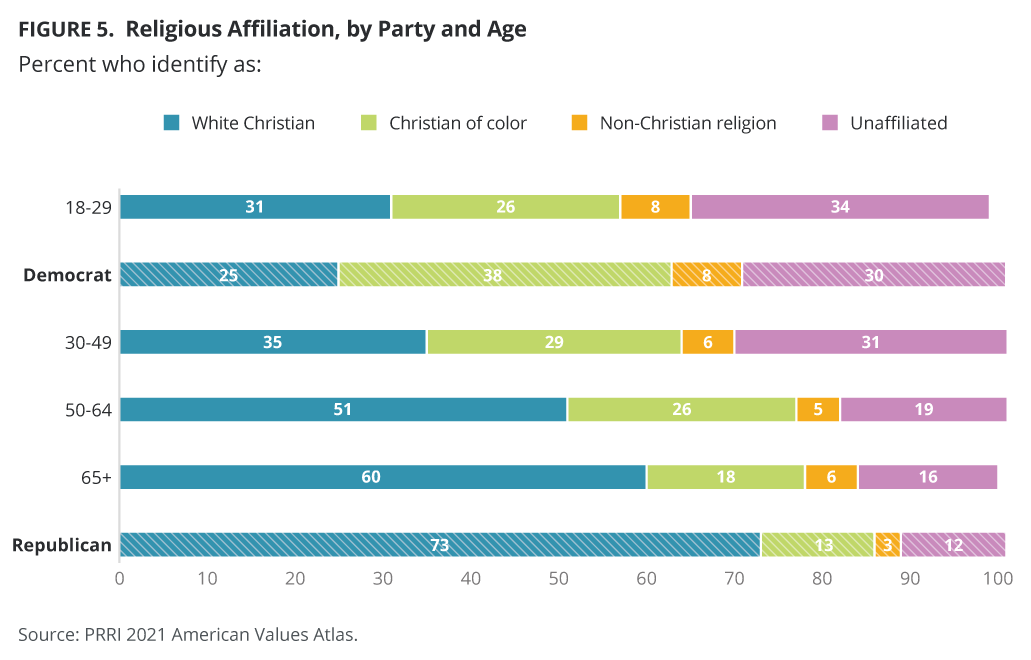
Both major political parties are majority Christian, but the total Christian proportion is much higher for Republicans (85%) than Democrats (62%). The makeup of the Christian coalition is vastly different within the parties as well. The largest Christian groups among Republicans are all white: white evangelical Protestants (31%), white mainline Protestants (20%), and white Catholics (19%). On the Democrat side, the largest groups are a multiracial coalition of Black Protestants (17%), Hispanic Catholics (12%), white mainline Protestants (10%), and white Catholics (10%). Overall, Republicans are 73% white Christian and 13% Christian of color, compared to 25% white Christian and 38% Christian of color among Democrats.
The remainder of each party — 38% of Democrats and 15% of Republicans — belong to other religions or are religiously unaffiliated. Three in ten Democrats (30%) are religiously unaffiliated, three percent are Jewish, and about one percent each are Muslim, Buddhist, Hindu, and Unitarian Universalist, with one percent belonging to other religions. On the Republican side, 12% are religiously unaffiliated, with one percent Jewish and one percent all other religions.
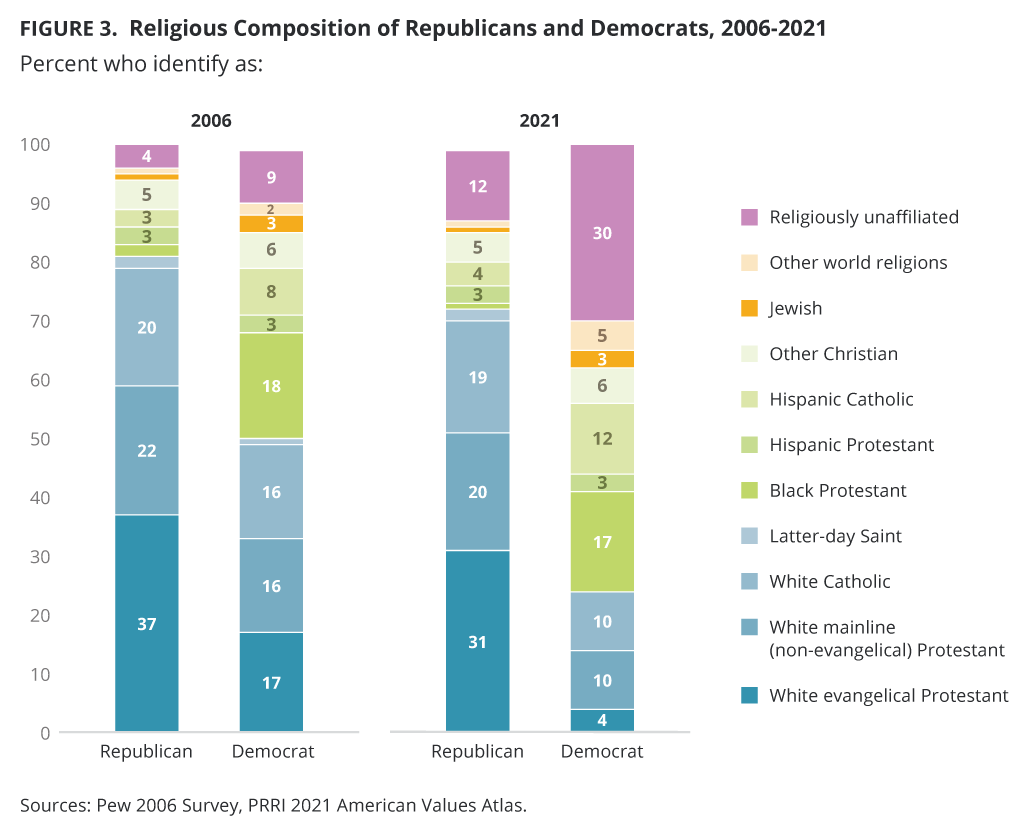 Both parties have seen considerable shifts in the religious makeup of their constituencies over the last 15 years, but Democrats have seen a much more sweeping shift, from 85% Christian in 2006 to 62% in 2021 (23 percentage points), than Republicans did, going from 94% to 85% Christian (9 percentage points). The largest changes have occurred within the Democrats’ ranks, dropping from 17% white evangelical Protestant to four percent, and increasing from nine percent religiously unaffiliated to 30%. The proportion of white evangelicals among those who are Republican has decreased as well, but not by nearly so much — from 37% to 31% — and the increase in those who are religiously unaffiliated was also smaller, from four percent to 12%.
Dramatic differences in religious affiliation by age group have contributed to the change in the nation’s religious landscape. As of 2021, 58% of those ages 18–29 are Christian, as are 64% of those ages 30–49, 76% of those ages 50–64, and 78% of those ages 65 and over. The racial makeup of the Christian groups varies considerably by age as well, with 31% white Christian in the youngest group, 35% in the middle-age group, 51% in the 50–64 age group, and 60% white Christian among those 65 and older.
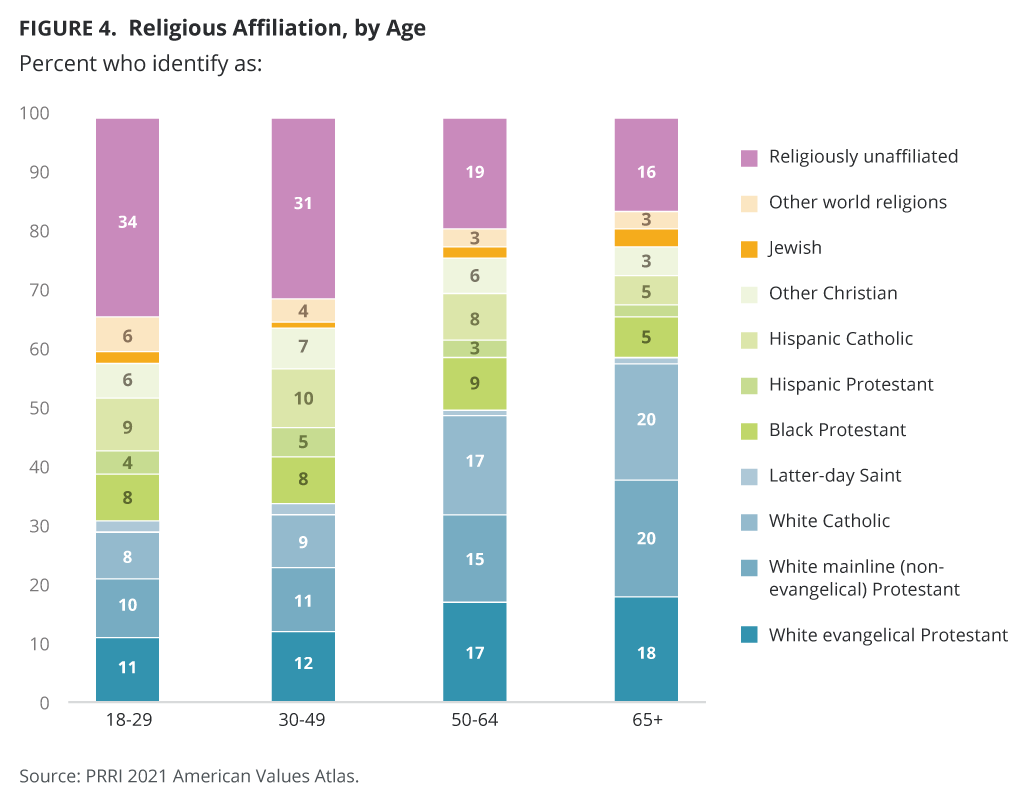
The difference is, of course, younger Americans are more likely to be religiously unaffiliated or belong to non-Christian religions. One-third of Americans ages 18–29 (34%) are religiously unaffiliated, as are 31% of those ages 30–49. Over age 50, however, there is a substantial dropoff: 19% of those ages 50–64 are religiously unaffiliated, as are 16% of those ages 65 and over. Nearly one in ten young Americans (8%) are members of another religion, as are six percent of those ages 30–49, five percent of those ages 50–64, and six percent of those ages 65 and older.
Younger Americans closely resemble the Democrats’ religious makeup, with more diversity by religious affiliation and a plurality claiming no religious affiliation at all. Republicans resemble older Americans — the vast majority are white Christian, and while the religiously unaffiliated portion is growing, it is not a substantial constituency within the party.
[1]Due to rounding, many numbers appear to be farther apart than they are. For example, the percentage of white Christians in 2020 is 44.1, and in 2021 it is 44.7. This difference is right at the edge of statistical significance, with a design-effect adjusted margin of error of +/- 0.6 percentage points.


