
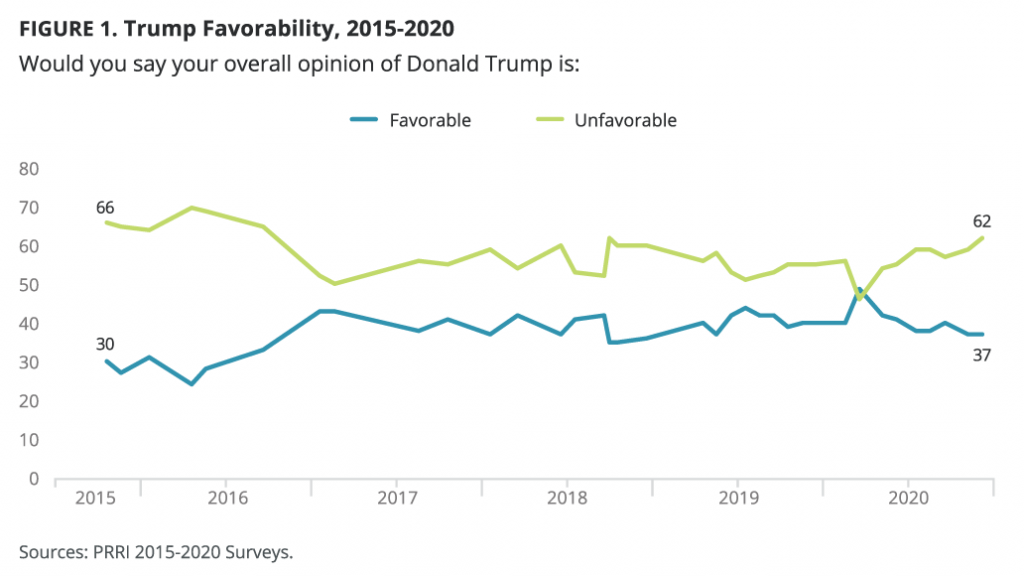
In the wake of President Donald Trump’s defeat in the 2020 presidential election and his refusal to concede, Americans’ views of the president have not shifted meaningfully. Less than four in ten Americans (37%) hold favorable views of Trump, while 62% hold unfavorable views of him, including a 44% plurality of Americans who hold very unfavorable views of him. This continues the pattern of remarkable rating stability across Trump’s presidency, although his unfavorable numbers have trended slightly upward in the latter half of 2020.
Party Affiliation
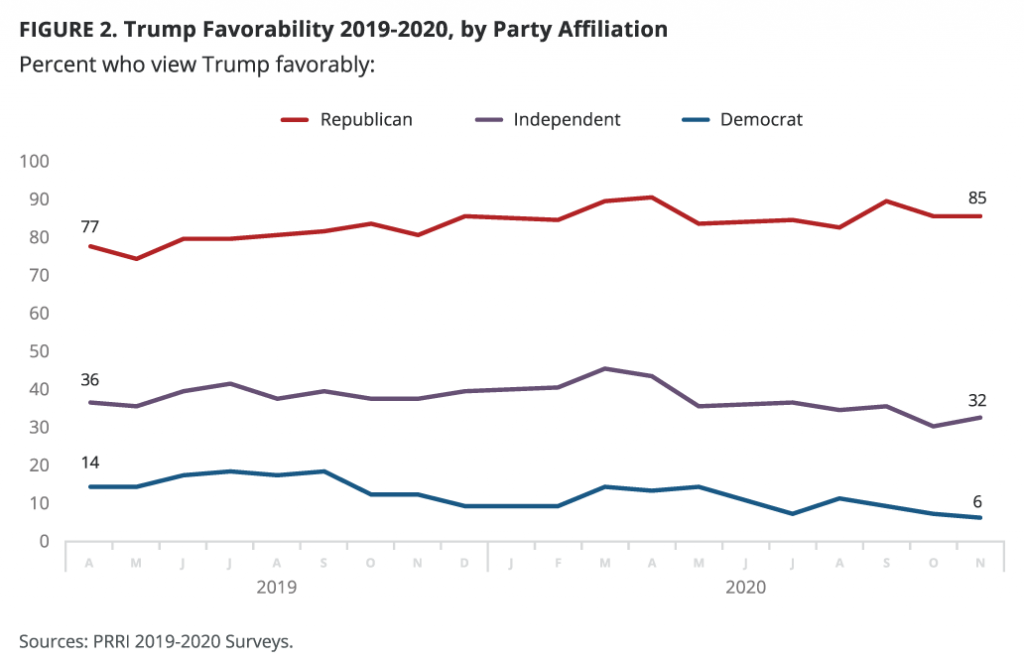
More than eight in ten Republicans (85%) hold favorable views of Trump, compared to just six percent of Democrats and 32% of independents. These shares remain largely unchanged from previous months.
Religious Affiliation
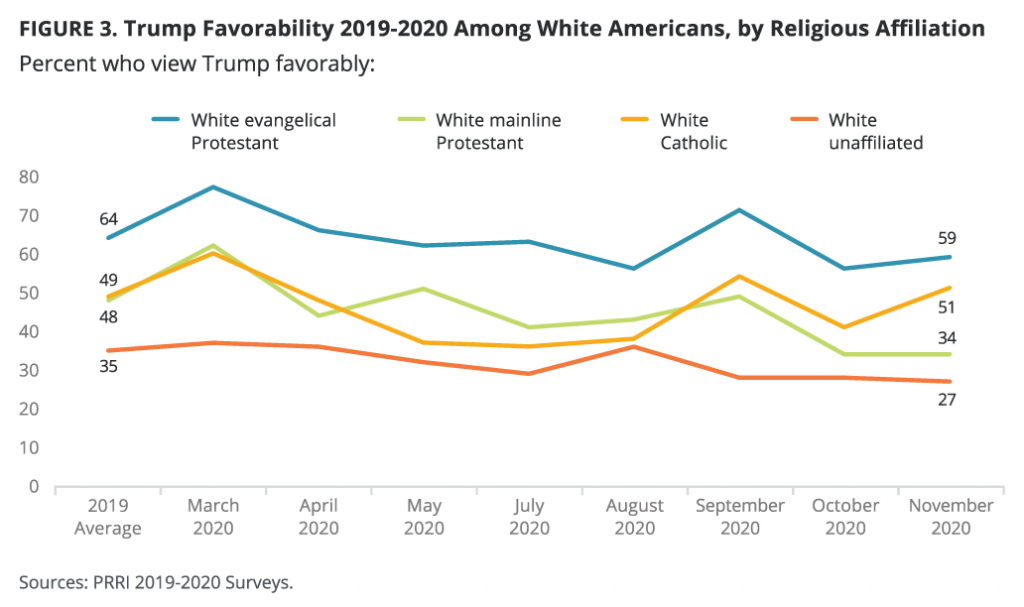
White Christian groups continue to express more favorable views of Trump than other religious groups. White evangelical Protestants continue to be most likely to hold favorable views of Trump (59%), similar to the share observed among this group in October (56%), but down from their share in September (71%). A slight majority of white Catholics (51%) hold favorable views of Trump, up from 41% in October. White mainline Protestants (34%) continue to feel less favorably toward Trump than other white Christian groups.
Nonwhite Christians and religiously unaffiliated Americans continue to express low ratings of Trump. Just one in four nonwhite Protestants (25%) and one in four religiously unaffiliated Americans (26%) view Trump favorably.
Race and Ethnicity, Gender, and Education
Just over four in ten white Americans (43%) hold favorable views of Trump, compared to just 13% of Black Americans and 29% of Hispanic Americans.[1]These groups have not shifted meaningfully in the last several months.
Gender divides persist in the perceptions of Trump. Men (41%) are more likely to hold favorable views of Trump than women (32%). White men (47%) and white women (40%) are both slightly more likely to express favorable views of Trump.
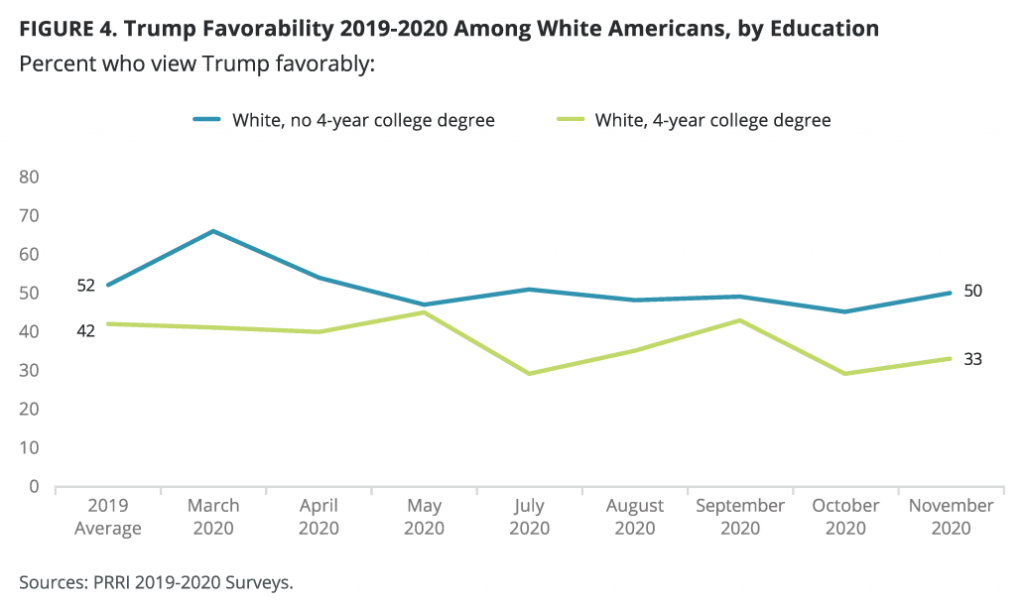
White Americans without college degrees continue to hold more favorable views of Trump than those who have four-year degrees. Currently, half of white Americans with less than a four-year college degree (50%) hold favorable views of Trump, which is consistent with previous months. Around one-third of white Americans with at least a four-year degree (33%) hold favorable views of the president, which is similar to the share recorded among this group in October (29%), but lower than the shares recorded in September (43%) and in previous months.
Biden Favorability
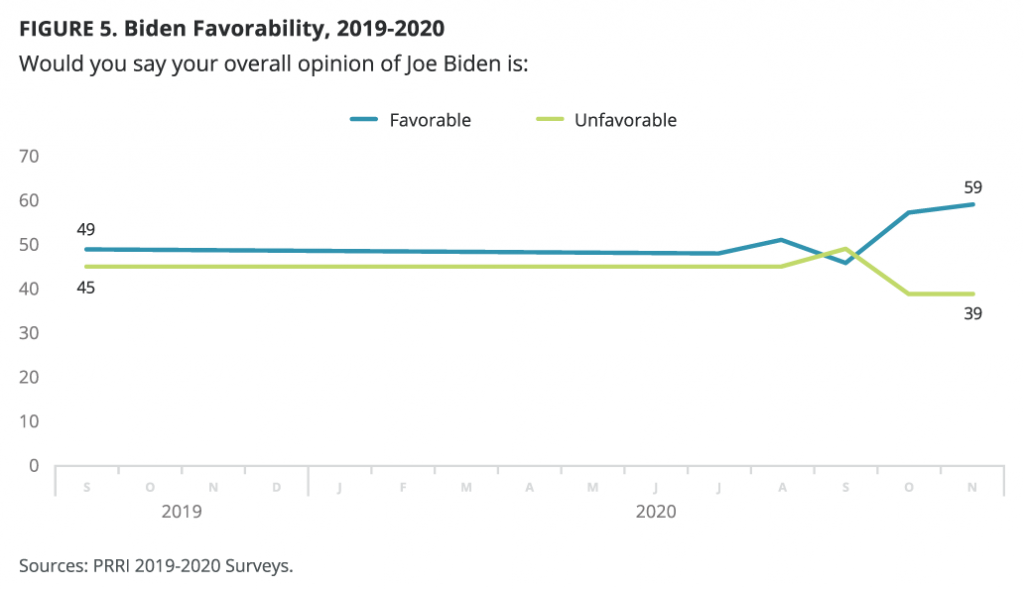
Compared to Trump’s relatively flat favorability ratings in the leadup and aftermath of the presidential election, Americans’ impressions of Democratic President-elect Joe Biden have improved since September. In September, less than half of Americans held favorable views of Biden (46%). This share grew to a solid majority in October (57%) and stayed at a similar level after the election (59%).
Party Affiliation
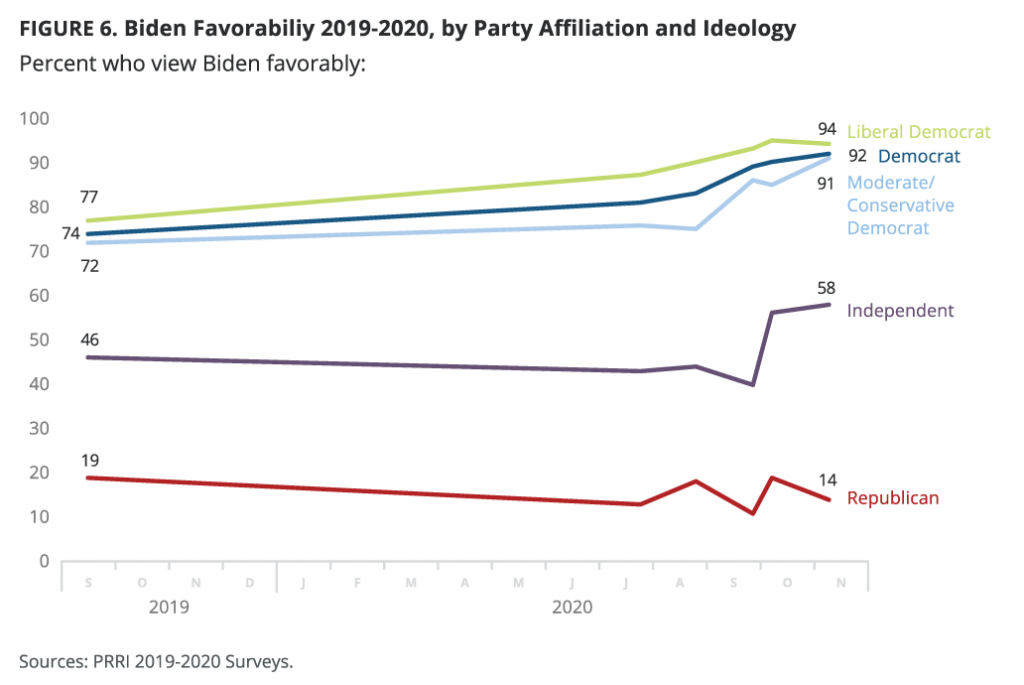
Between September and October, independents became more likely to rate Biden favorably, a shift he has maintained after the election. In September, 40% of independents held favorable views of Biden, increasing to 56% in October and 58% in November. About nine in ten Democrats held favorable views of Biden in September (89%), October (90%), and November (92%). However, the share of Democrats who held strongly favorable views of Biden steadily increased, from 40% in September to 46% in October and 53% in November. Republicans’ views of Biden only shifted slightly across September (11%), October (19%), and November (14%).
Much of the shift in intensity among Democrats came from the conservative and moderate members of the party. In September, 37% of moderate and conservative Democrats held favorable views of Biden, which grew marginally, to 41% in October and to 52% in November.
Religious Affiliation
Biden’s favorability ratings among major religious groups remained relatively stable between October and November. Differences between October and November are not statistically significant for religious groups, despite some marginal shifts. More than six in ten nonwhite Protestants (68%), white mainline Protestants (64%), and religiously unaffiliated Americans (61%) hold favorable views of Biden. A slim majority of white Catholics (51%) hold favorable views of Biden, and around four in ten white evangelical Protestants say the same (42%).
Race, Gender, and Education
Favorable views of Biden increased most among Black Americans while remaining stable among white and Hispanic Americans. Between October and November, ratings of Biden among Black Americans increased from 65% to 80%, including an increase in the share who rate him very favorably, which increased from 37% to 49%.[2] Favorability ratings among white and Hispanic Americans remained steady from October (54% and 67%, respectively) to November (54% and 67%, respectively). Biden’s favorability among white and Hispanic Americans has increased somewhat from September (42% and 52%, respectively).
Women (64%) are slightly more likely than men (53%) to rate Biden favorably, though the gender gap in ratings of Biden is much smaller than it is in ratings of Trump. Currently, half of white men (50%) express favorable views of Biden (similar to the 52% recorded in October), along with 57% of white women (similar to the 56% recorded in October). Both white men and white women were more likely to hold favorable views of Biden in either October or November than they were in September (36% among white men and 49% among white women in September).
White Americans are divided along education lines, with less than half of white Americans with less than a four-year college degree (48%) saying they have a favorable view of Biden, compared to six in ten of those with at least a four-year degree (62%). These shares are similar to those recorded in October (51% and 58%, respectively); however, they are greater than they were in September (38% and 49% in September).
Endnotes
[1] The number of cases for Black Americans in November is n=85.
[2]The number of cases for Black Americans in October is n=82 and in November is n=85.


