

As the coronavirus spreads across the U.S., there is increasing evidence that minority groups are experiencing disproportionate impacts. Across the country, Hispanics are dying at 1.4 times the rate of whites, making up an increasing proportion of COVID-19 deaths. More specifically, as of August 4, 2020, it is estimated that out of the more than 155,000 COVID-19 U.S. deaths, nearly 27,500 Hispanics have died from the virus or about one out of every five deaths. With the November presidential election less than 100 days away, what does this mean for Hispanic Americans’ views of President Trump?
Even though Hispanic Americans tend to have less favorable views of Trump than Americans in general, surprisingly, their views of Trump have become somewhat more favorable in 2020. Data from the American Values Atlas (AVA) shows that throughout 2019, on average, 28% of Hispanic Americans viewed Trump favorably, compared to 41% of all Americans. In 2020 so far, more than one-third (36%) of Hispanic Americans view Trump favorably, a significant increase from 2019.
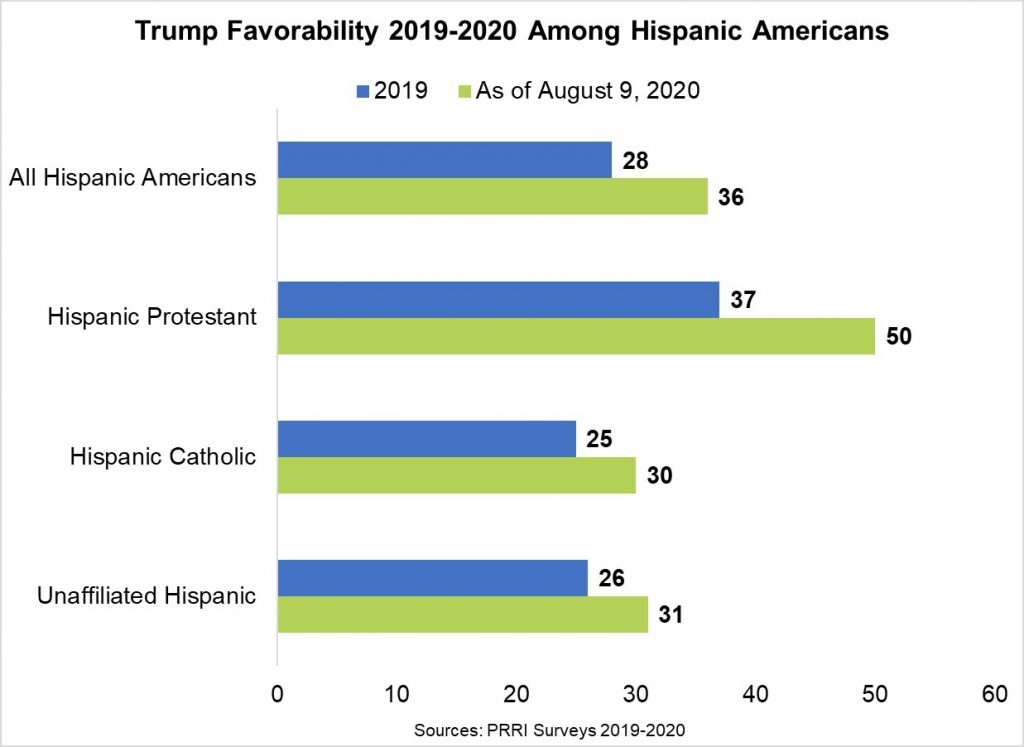
Hispanic Americans tend to be viewed as a monolith, yet this group differs in many ways. For example, Hispanic Americans vary in their religious affiliation. According to AVA 2019 data, nearly half of Hispanic Americans identify as Catholic (49%), followed by 23% who identify as Protestants and 21% as unaffiliated, which may help explain a tendency to lean more conservative and more favorable toward Trump as he widely appeals to Christian groups. Interestingly, among Hispanic Protestants, 37% expressed favorable views of Trump in 2019. In 2020, so far, half (50%) expressed favorable views of Trump – a 13 percentage point increase. Among Hispanic Catholics, there is also a slight surge in their views of Trump. In 2019, one in four (25%) Hispanic Catholics expressed favorable views of Trump, in 2020 so far, 30% view Trump favorably. Among unaffiliated Hispanic Americans, their favorable views about Trump rose, but the change is not statistically significant (26% in 2019, 31% end of July 2020).
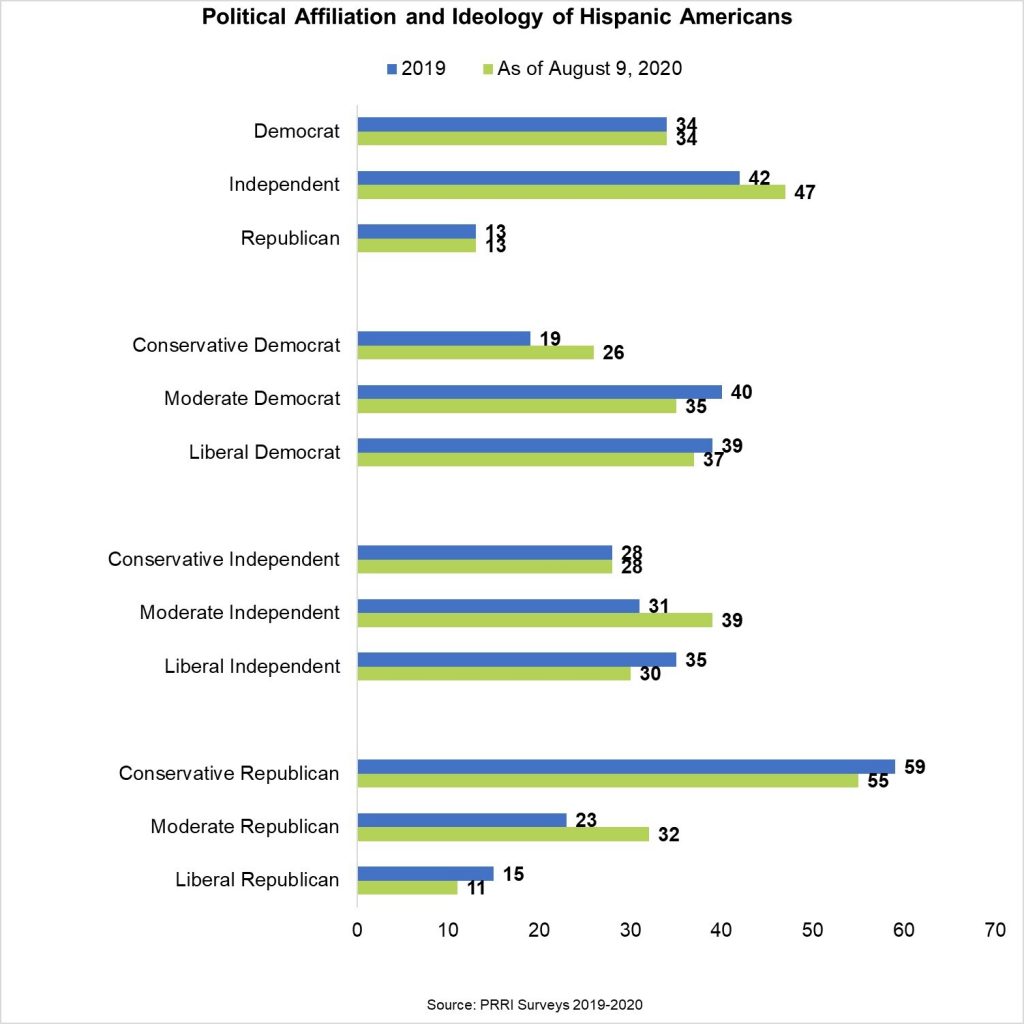
Many also assume that Hispanic Americans are a politically monolithic group mainly composed of Democrats and liberals. AVA 2019 shows this is not necessarily the case. More than four in ten (42%) Hispanic Americans identify as independents, about one-third (34%) identify as Democrats and 13% identify as Republicans. In addition, nearly one-third (32%) identify as moderates, the same percentage of those who identify as liberals, and 28% who identify as conservative. When looking at partisanship and ideology together, the majority (59%) of Hispanic Republicans identify as conservatives, while about four in ten (39%) Hispanic Democrats identify as liberals. Independent Hispanics tend to identify more as liberals than as conservatives (35% vs. 28%) in 2019. In 2020, so far, there seems to be a small increase in the share of Hispanic Democrats who identify as conservative, which may help explain why there is a slight increase in favorable views of Trump. In 2019, nearly two in ten (19%) Hispanic Democrats identified as conservative; so far in 2020, more than one in four (26%) do so and this change is statistically significant. Interestingly, the share of Hispanic moderate Republicans grew from 23% in 2019 to 32% in 2020, so far.
Hispanic Americans are one of the fastest-growing ethnic groups in the United States, making up about 19% of the American population in 2020 and are expected to increase to 28% in 2060. As political polarization in the United States rises during the pandemic, where Hispanic Americans live also helps understand why this group may have grown slightly more favorable toward Trump. According to AVA 2019 data, the majority of the Hispanic population is clustered in California (21%), Texas (13%), Florida (10%), and New York (8%), which explains their diversity in political views. Nearly half of Hispanic Republicans identify as conservatives in California (48%) and New York (47%), and solid majorities do in Florida (71%) and Texas (58%).[1]
[1]These results need to be interpreted with caution as the number of conservatives in New York is <100 (N=67).


