Introduction
Previous research conducted throughout 2021 by PRRI and IFYC has shown that religious affiliation is correlated with vaccine acceptance, hesitancy, and refusal. This report explores the relationship between religious identity and vaccination rates at the local level. It combines county-level religion estimates from PRRI’s 2020 Census of American Religion with county-level COVID-19 vaccination data from the Centers for Disease Control and Prevention (CDC) and state sources to examine those patterns at the county level.[1]
The report focuses on only the largest religious groups in the country – those comprising more than 10% of the population — in order to reliably analyze the relationship between vaccination and religious populations across counties in all regions of the country. That includes white evangelical Protestants, white mainline (non-evangelical) Protestants, white Catholics, and the religiously unaffiliated.[2]
In addition to their geographic dispersion, these religious affiliation groups represent some of the most likely — and the least likely — religious groups to get vaccinated. In June of this year, a PRRI–IFYC survey found that white evangelical Protestants were the least likely group to be vaccine acceptant: Only 56% said they had gotten vaccinated against the coronavirus or would get the vaccine as soon as possible. Other white Christian groups were much more vaccine acceptant, including 74% of white mainline Protestants and 79% of white Catholics. Additionally, 75% of religiously unaffiliated Americans say they have gotten vaccinated or will get vaccinated as soon as possible.
The analysis finds that:
- Counties with greater shares of white evangelical Protestants have lower rates of vaccination.
- There is very little relationship between a county’s share of white mainline Protestants and vaccination rates.
- Counties with greater shares of white Catholics have higher rates of vaccination.
- Counties with greater shares of religiously unaffiliated Americans have higher rates of vaccination.
- Counties with greater religious diversity have higher rates of vaccination.[3]
- The urban-rural divide is a strong geographic correlate of vaccination rates, but a closer look reveals that religious affiliation is related to vaccination rates within both urban and rural counties.
County-Level Vaccination Rates
Vaccination rates are not evenly distributed across the country. As of late August, residents of rural areas and residents of states across the South and the Midwest have been slower to embrace vaccinations than people in other parts of the country.
For the purposes of analysis in this report, we are defining vaccination rates as the percentage of residents over the age of 12 who are fully vaccinated. This includes all Americans who are currently eligible for vaccination and who have received either the single-dose Janssen vaccine or two doses of the Pfizer or Moderna vaccines.
White Evangelical Protestants and Vaccination
According to the PRRI 2020 Census of American Religion, white evangelical Protestants make up 14.5% of the American population. They are most heavily concentrated in the South and the lower Midwest.
PRRI–IFYC data from June showed that white evangelical Protestants were the least likely religious group to say they had either gotten at least one vaccine dose or would do so as soon as possible (56%). Nearly one-quarter (24%) of white evangelical Protestants say they will not get vaccinated. Unsurprisingly, there is a negative relationship between a county’s share of white evangelical Protestant residents and vaccination rates: Larger percentages of white evangelical Protestants in a county are associated with lower rates of vaccination.
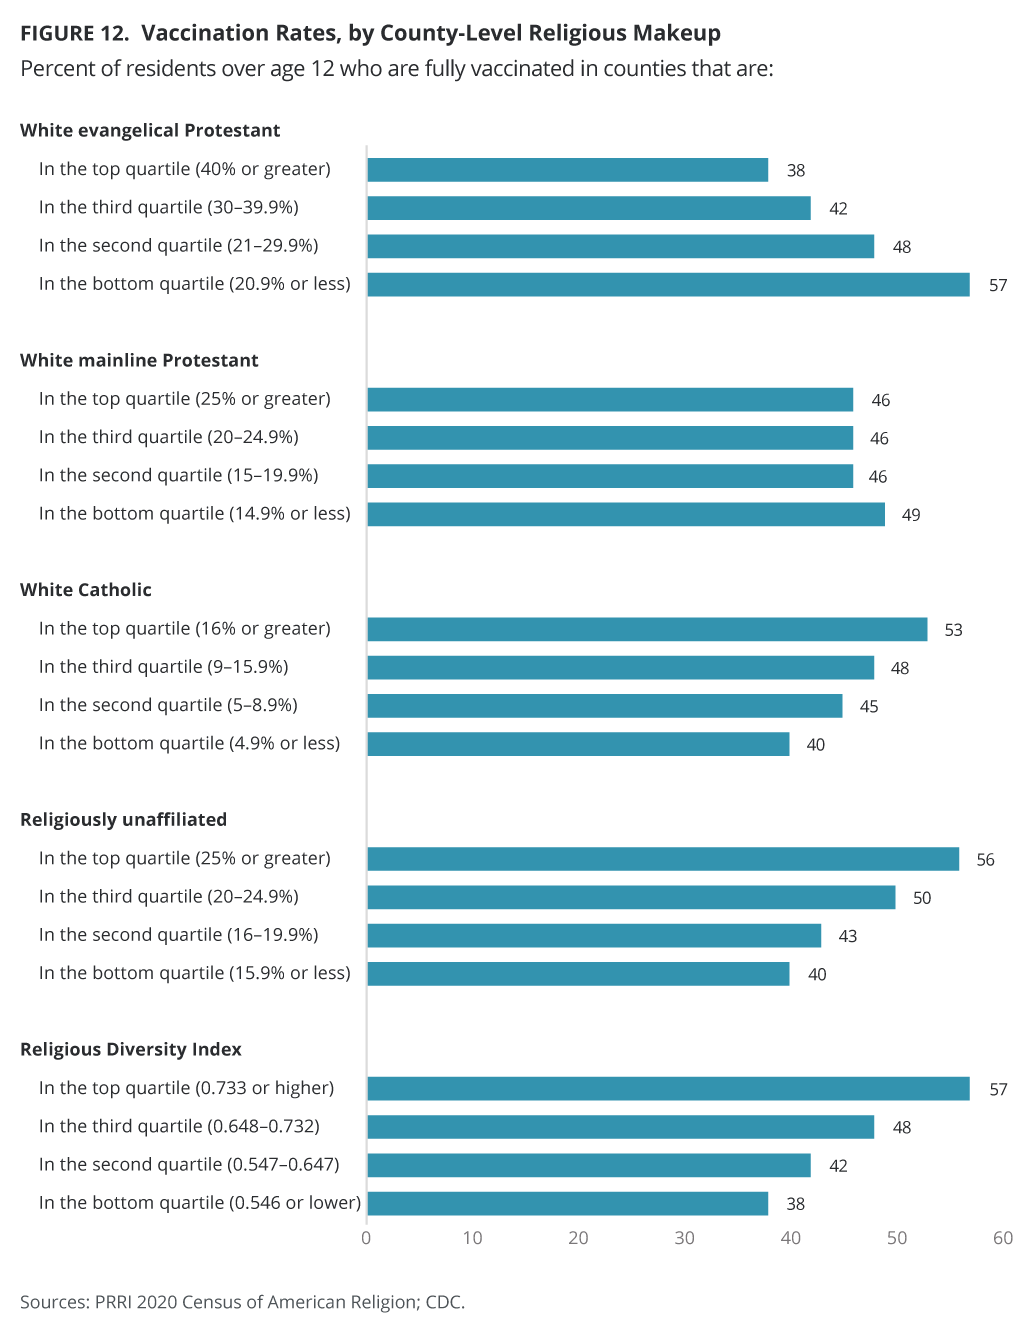
In counties equal to or above the median percentage of white evangelical Protestants (30%), four in ten residents over age 12 (41%) have been fully vaccinated. In counties where less than 30% of residents are white evangelical Protestants, a slim majority (53%) are fully vaccinated. In counties in the bottom quartile of white evangelical Protestant share (counties that are less than 20% white evangelical Protestant), 58% of residents are fully vaccinated.
White Mainline (Non-Evangelical) Protestants and Vaccination
White mainline (non-evangelical) Protestants make up 16% of the American population, according to the PRRI 2020 Census of American Religion. White mainline Protestants are most heavily concentrated in the Midwest. June PRRI–IFYC data found that white mainline Protestants were slightly more vaccine acceptant (74%) than all Americans (71%).
There is very little relationship between a county’s share of white mainline Protestants and the share of residents over age 12 who are fully vaccinated. In counties where the share of white mainline Protestants is equal to or above the median (20%), 46% of residents are fully vaccinated, compared to 48% of residents of counties below the median share. Even in counties with particularly large shares of white mainline Protestants (25% or greater in the top quartile), 46% of residents are vaccinated, compared to counties with particularly small shares (less than 15% in the bottom quartile) of white mainline Protestants, where 49% of residents are vaccinated.
White Catholics and Vaccination
According to the PRRI 2020 Census of American Religion, white Catholics make up 12% of the American population and are most heavily concentrated in the Northeast, the Midwest, and southern Louisiana.
PRRI–IFYC data from June showed that white Catholics were the most vaccine acceptant white Christian group, with 79% saying they had either gotten at least one dose of a vaccine or would get it as soon as possible.
There is a positive relationship between a county’s share of white Catholics and the rate of vaccination. In counties with an equal or above-the-median share of white Catholics (9%), half of residents (50%) are vaccinated, compared to 43% of residents of counties below the median share of white Catholics. In counties where the share of white Catholics is in the top quartile (16% or greater), a slim majority of residents over age 12 (52%) are vaccinated. In counties where the share of white Catholics is in the bottom quartile (less than 5%), four in ten residents are fully vaccinated (40%).
Religiously Unaffiliated Americans and Vaccination
According to the PRRI 2020 Census of American Religion, religiously unaffiliated Americans make up just shy of one-quarter of the American population (23%). Larger shares of religiously unaffiliated Americans live in the West and the Northeast but are generally distributed around the country.
PRRI–IFYC data from June found that three in four religiously unaffiliated Americans were vaccine acceptant (75%), slightly greater than all Americans (71%).
There is a positive relationship between the share of religiously unaffiliated Americans in a county and the share of residents over age 12 who are fully vaccinated. As the share of unaffiliated residents increases, so too do vaccination rates.
In counties where the share of religiously unaffiliated residents is equal to or above the median (20%), a slim majority over age 12 are vaccinated (51%). In counties with a share of unaffiliated residents below the median, 41% of residents are vaccinated. In counties with shares of religiously unaffiliated residents in the top quartile (25% or more), 55% of residents are fully vaccinated. In counties with shares in the bottom quartile (less than 16% religiously unaffiliated), 40% of residents are vaccinated.
Religious Diversity and Vaccination
To measure religious diversity in the United States, this report uses an index developed to measure variations in the concentration of global religious populations. The index is calculated so that a score of 1 signifies complete diversity—every religious group is of equal size—and a score of 0 indicates a complete lack of diversity and one religious group comprises the entire population of a given county. The median religious diversity score in counties with available vaccination data is 0.651. Religious diversity is typically highest in large urban areas and lowest in the southern parts of the country and in rural areas.
In all counties above the median diversity index score of 0.651, 53% of residents over age 12 are fully vaccinated, compared to 41% of residents below the median. In the top quartile of most religiously diverse counties (counties with scores equal to or greater than 0.738), 58% of residents are fully vaccinated. In the bottom quartile of the least religiously diverse counties (counties with scores less than 0.549), 38% of residents are fully vaccinated.
Summary of Religious Affiliation and County-Level Vaccination Rates
Breaking each of the key religious groups into quartiles reveals the same clear trend lines. Counties with the highest shares of religiously unaffiliated Americans, white Catholics, and greater religious diversity have the highest rates of vaccination, and counties with the largest shares of white evangelical Protestants are some of the least vaccinated. Vaccination rates generally do not differ based on the share of white mainline (non-evangelical) Protestants.
The Urban and Rural Divide in Vaccination Rates
One potential caveat to these findings is that there is an urban-rural divide in vaccination rates that also correlates with religious affiliation patterns. For example, PRRI–IFYC data from June found a distinct geographic divide in vaccination attitudes. Around three in four Americans in urban (75%) and suburban areas (73%) were significantly more likely than residents of rural areas (59%) to say they had gotten at least one dose of a vaccine or would get it as soon as possible. In the vaccination data, in large counties (those with at least 100,000 residents), 57% of residents are vaccinated, compared to 44% of residents of small counties (those with less than 100,000 residents). And the PRRI Census of American Religion notes that white evangelical Protestants are more prevalent in rural areas, while white Catholics and the religiously unaffiliated are more likely to live in suburban and urban areas.
But we find evidence that religious affiliation is not simply a proxy for the rural-urban divide. Notably, religious affiliation is correlated with vaccination rates, even within groupings of urban and rural counties.
In order to look more closely at the relationships between vaccination, geography, and religious affiliation, we divide counties into four categories for each religious affiliation group:
- Large counties that have higher densities of a religious group;
- Large counties that have lower densities of a religious group;
- Small counties that have higher densities of a religious group;
- Small counties that have lower densities of a religious group.
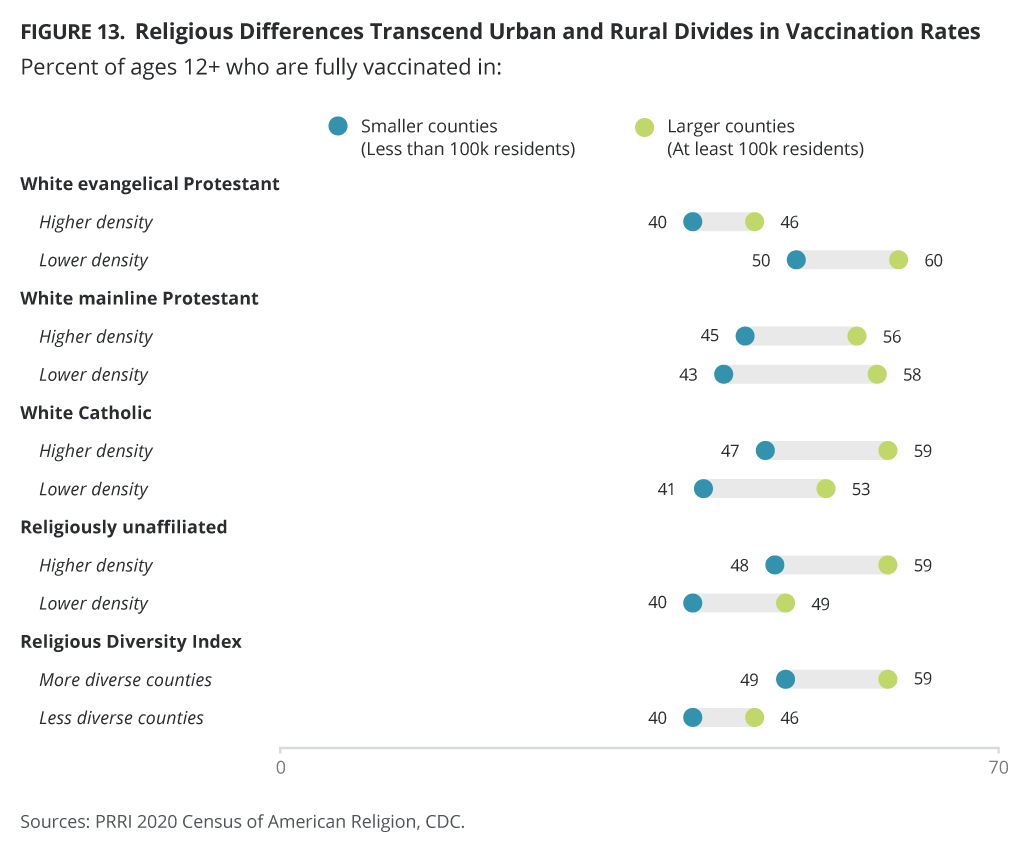
If the urban-rural divide is the primary driver of vaccination rates, we should see little difference in vaccination rates based on religious affiliation within each county-size grouping. For example, the proportion of fully vaccinated people in larger counties with higher white Catholic populations would be similar to the proportion of fully vaccinated people in larger counties with smaller white Catholic populations. Instead, with the exception of white mainline Protestants, we continue to see significant differences in vaccination rates that are driven by religious affiliation densities.
White evangelical Protestants
Counties with larger shares of white evangelical Protestants (at or above the median share of 30%) are less likely to be vaccinated than counties with smaller shares, regardless of county size. In small counties with larger shares of white evangelical Protestants, 40% of residents are fully vaccinated, while 50% of residents of small counties with smaller shares of white evangelical Protestants are fully vaccinated.
In large counties, the gap is smaller, but the pattern is similar. In large counties with larger shares of white evangelical Protestants, 46% of residents are fully vaccinated, compared to 60% of residents of larger counties with smaller shares of white evangelical Protestants.
White Mainline Protestants
There is little relationship between the share of white mainline Protestants and vaccination rates, and there are only minimal differences in large and small counties by the share of white mainline Protestants. In small counties with larger shares of white mainline Protestants (at or above the median share of 20%), 45% of residents are fully vaccinated, compared to 43% of residents of small counties with smaller shares of white mainline Protestants.
In large counties with larger shares of white mainline Protestants, 56% of residents are fully vaccinated, compared to 58% of residents of large counties with smaller shares of white mainline Protestants.
White Catholics
Counties with larger shares of white Catholics (at or above the median share of 9%) generally have higher rates of vaccination than those with smaller shares. In small counties with larger shares of white Catholics, 47% of residents are vaccinated, compared to 41% of residents of small counties with smaller shares of white Catholics.
In large counties with larger shares of white Catholics, nearly six in ten residents (59%) are fully vaccinated, compared to less than half of residents of large counties with smaller shares of white Catholics (53%).
Religiously Unaffiliated Americans
Counties with larger shares of religiously unaffiliated Americans (at or above the median share of 20%) generally have higher vaccination rates than those with smaller shares. In small counties with larger shares of religiously unaffiliated residents, 48% of residents are fully vaccinated, compared to 40% of residents of small counties with smaller shares of religiously unaffiliated residents.
In large counties with larger shares of religiously unaffiliated residents, 59% of residents are fully vaccinated, compared to 49% of residents in large counties with smaller shares of unaffiliated residents.
Religious Diversity
Counties that are more religiously diverse generally have higher rates of vaccination than less diverse counties. Residents of small counties that are more religiously diverse are more likely to be fully vaccinated than in small counties that are less religiously diverse. In more religiously diverse small counties (scores of at least 0.651), 49% of residents are fully vaccinated, compared to 40% of residents in less diverse counties.
In large counties, the gap is even greater. In more diverse large counties, 59% of residents are vaccinated, compared to just 46% of residents in less diverse large counties.
Methodology
Vaccination Data Methodology
To create this analysis, we primarily used county-level vaccination data as of August 26, 2021, from the CDC’s updating dataset. While this is the most complete dataset of county-level vaccination rates, it is worth noting that the quality of the data differs from state to state, and not all states are included in the CDC dataset. To mitigate these limitations, we took the following steps to ensure greater integrity in the data:
- Using county-level vaccination data from the Texas Department of State Health Services and the Hawaii Department of Health for those states, which were not included in the CDC dataset.
- The states of Georgia, Idaho, Vermont, Virginia, and West Virginia were not included because more than one-quarter of county-level data is missing from their reporting.
- California does not report county-level vaccination data in counties with fewer than 20,000 residents.
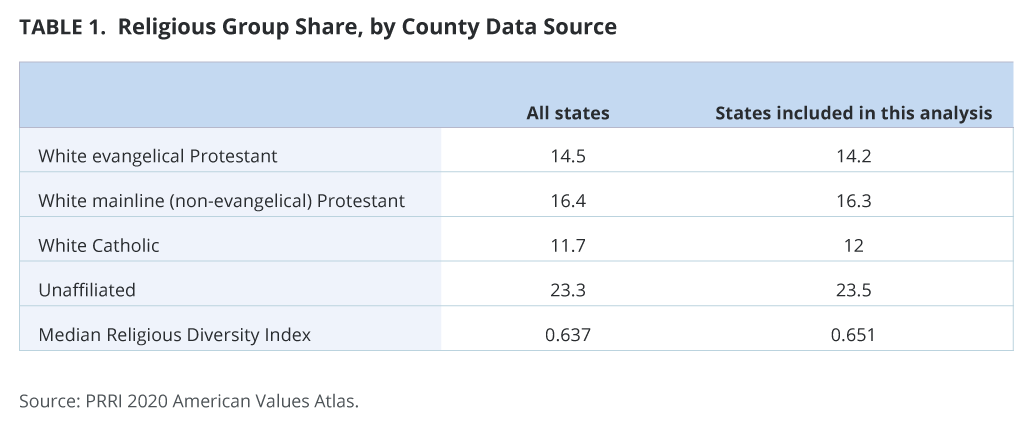
Dropping the five states with incomplete reporting does not meaningfully alter the religious makeup of the dataset used for this analysis. According to PRRI’s 2020 American Values Atlas, the shares of religious groups used in this analysis are similar to the religious makeup of the country as a whole.
County-Level Model Methodology
To create the 2020 Census of American Religion, PRRI worked with NORC to use the American Values Atlas survey data from 2013 to 2019, which includes interviews with random samples of 459,822 U.S. adults (ages 18 and over) to generate county-level estimates for each religious affiliation in 3,142 counties in all 50 states, plus the District of Columbia, using a technique called small area estimation modeling. NORC has developed and implemented small area estimation models on several key projects for government and social science surveys. The estimates have varying measurement error based on the size of the county and the number of surveys completed in each county. Smaller counties have larger measurement error.
The small area modeling approach for this project modeled weighted survey estimates of each religious affiliation by county and year. Since the distribution of religious denominations are correlated across time, the small area model captures county-level correlations across time through a time-series component to improve estimates for the most current year. Furthermore, the model incorporates external auxiliary data (that is predictive of the distribution of religious denominations) at the county-level from the 2014–2018 five-year American Community Survey. The best set of predictors for each religious denomination was selected using a variable selection approach known as LASSO. Model-based estimates for each religious denomination and county were generated using a standard small area estimation approach referred to as “Empirical Best Linear Unbiased Prediction.” Finally, model-based estimates for each religious denomination were generated for all counties in the U.S., not limited to counties with survey data.
Endnotes
[1]County-level vaccination data for Georgia, Idaho, Virginia, West Virginia, Vermont, and certain counties in California are excluded due to incomplete reporting.
[2]Any groups less than 10% of the population are excluded from analysis. Hispanic and Black Christian groups, smaller Christian groups, and non-Christian religious groups have populations that are concentrated in a few areas of the country, with very small percentages in large swaths of the country, making a comparative analysis across geography less reliable.
[3]The religious diversity for each state was calculated using the Religious Diversity Index, a variant of the Herfindahl-Hirschman Index, a widely used measure of diversity among human and biological populations. See “The Herfindahl-Hirschman Index: A Concentration Measure Taking the Consumer’s Point of View,” Charles R. Laine, The Antitrust Bulletin, June 22, 1995.