Perceptions of Discrimination and Support for Anti-Discrimination Legislation
Discrimination Against Lesbian and Gay People
One-third of Americans (32%) say that discrimination against lesbian and gay people has increased over the last 12 months, and 15% say that it has decreased. There are no significant differences among Americans who know someone who is gay or lesbian compared to those who do not know anyone who is gay or lesbian.
Nearly half of Democrats (48%) say that discrimination against lesbian and gay people has increased in the last 12 months—three times the proportion of Republicans (15%).
White evangelicals are less likely than any other religious group to say that discrimination has increased (16%), followed by Latter-day Saints (22%), white Catholics (25%), white mainline Protestants (26%), and Jewish Americans (29%). About one-third of Hispanic Protestants (32%), other Protestants of color (32%), other Christians (34%), and unaffiliated Americans (36%) agree, as do 43% of adherents of other non-Christian religions. About half of Black Protestants (49%) and Hispanic Catholics (51%) say that discrimination against lesbian and gay people has increased.
Half of Black Americans (49%) say that discrimination has increased, followed by Hispanic Americans (44%), Americans of another race (37%), and multiracial Americans (30%).
A small but significant gender gap exists for perception of discrimination against lesbian and gay people: 30% of men and 34% of women say discrimination has increased in the last 12 months.
Perceptions of Discrimination Against Transgender People
Americans’ perceptions of discrimination against transgender people are similar to their views about discrimination against lesbian and gay people. Four in ten (39%) say discrimination has increased, 12% say discrimination has decreased, and 46% say it has stayed the same. About half of people who know someone who is transgender (49%) say that discrimination against transgender people has increased in the last 12 months, compared to just 36% of those who don’t know anyone who is transgender.
Democrats (59%) are roughly three times as likely as Republicans (19%) to say discrimination against transgender people has increased.
Again, white evangelical Protestants (22%) are the least likely religious group to say discrimination against transgender people has increased over the last 12 months, as are less than three in ten Latter-day Saints (27%). One-third or more white mainline Protestants (33%), Hispanic Protestants (34%), white Catholics (36%), Jewish Americans (38%), and other Protestants of color (39%) say discrimination has increased. Four in ten or more other Christians (40%), other non-Christian religious people (41%), and unaffiliated Americans (46%) hold this view. Majorities of Hispanic Catholics (54%) and Black Protestants (56%) say discrimination against transgender people has increased.
Americans of all racial and ethnic groups are more likely to say that discrimination has risen against transgender people than they are to say that discrimination has risen against gay and lesbian people. White Americans are eight percentage points more likely to say discrimination against transgender people has increased (34%) than they are to say discrimination against lesbian and gay people (26%) has increased. Other groups show the same general trend, but the differences are not statistically significant.
Women (42%) are more likely than men (36%) to say discrimination against transgender people has increased.
Nondiscrimination Laws to Protect LGBTQ People
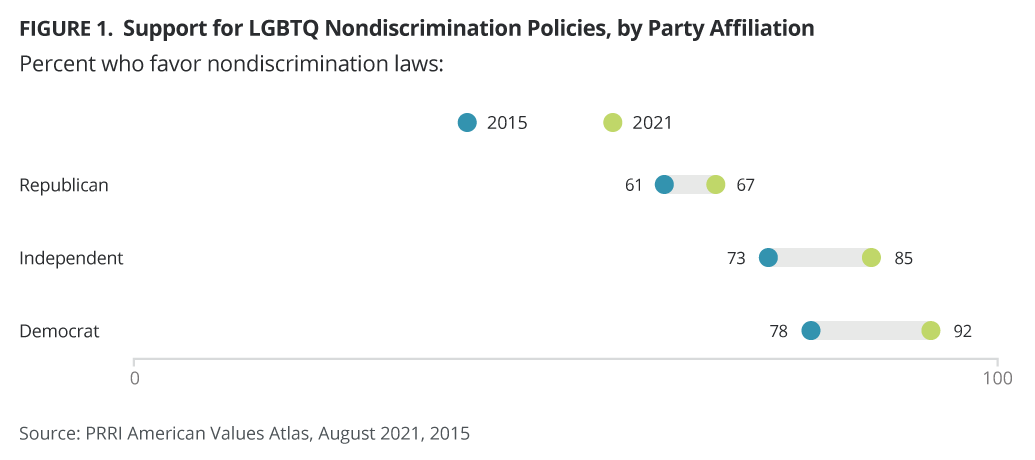
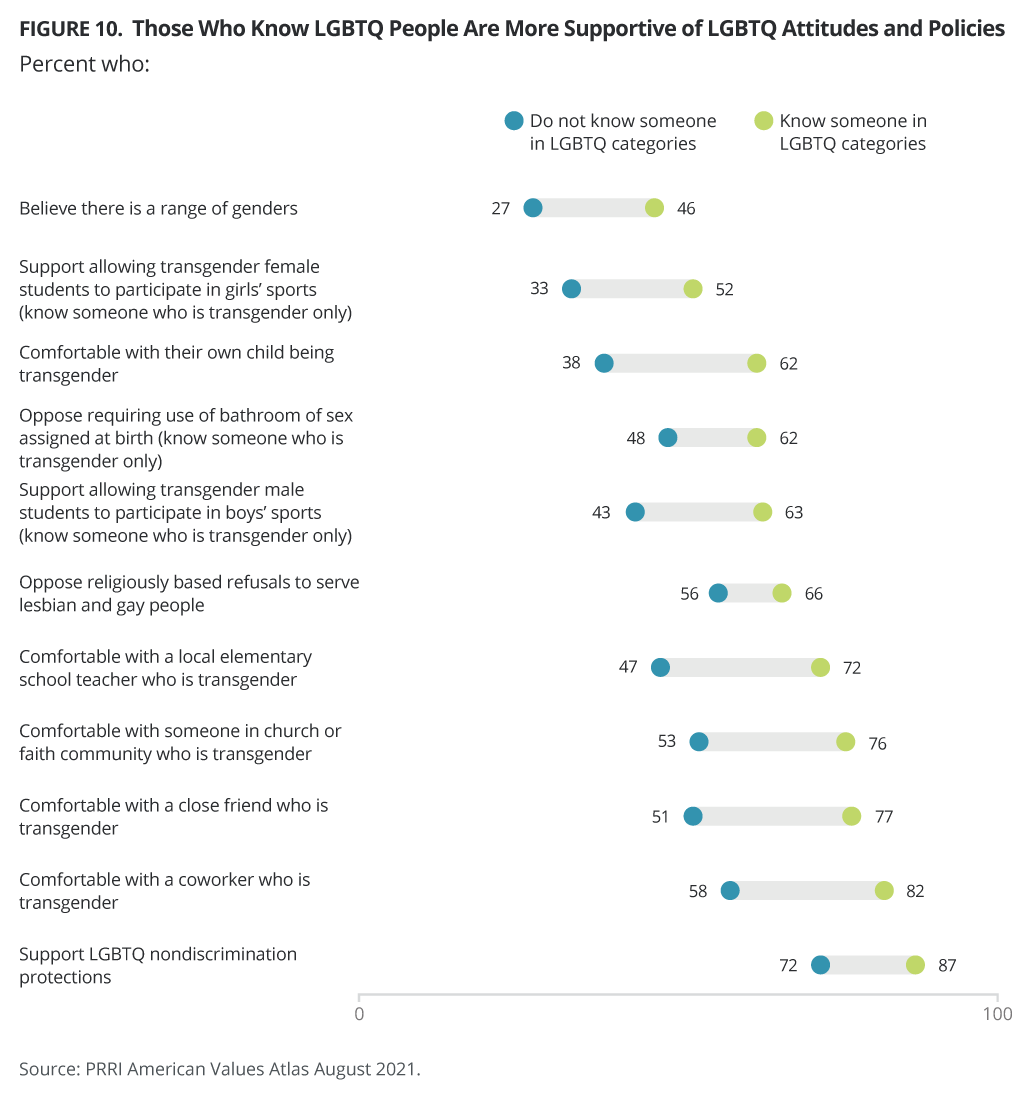
A large majority of Americans (82%) favor laws that protect LGBTQ people from discrimination in jobs, public accommodations, and housing. The proportion of Americans who support nondiscrimination legislation has risen more than 10 percentage points since 2015. Knowing any person who is LGBTQ has a meaningful impact on support for nondiscrimination laws. Among those who do not know an LGBTQ-identifying person, 72% support the laws, compared to 87% of those who do.
Notably, support for laws that protect LGBTQ people from discrimination is strongly bipartisan. Majorities of Republicans (67%), independents (85%), and Democrats (92%) favor nondiscrimination protections for LGBTQ Americans.
Majorities of all major religious groups support LGBTQ nondiscrimination policies. Among major religious groups, religiously unaffiliated Americans are the most likely to support LGBTQ nondiscrimination policies, with 91% in favor. Large majorities of most other religious groups support such policies as well, including Latter-day Saints (88%), other Protestants of color (87%), Black Protestants (86%), other non-Christian religions (85%), other Christians (84%), white Catholics (82%), white mainline Protestants (82%), Hispanic Catholics (81%), Jewish Americans (79%), and Hispanic Protestants (74%). White evangelical Protestants (66%) continue to be the least likely major religious group to support nondiscrimination policies, although support has risen six percentage points since 2015 (60%).
Eight in ten white Americans (81%) support nondiscrimination laws. A similar percentage of Black (83%) and Hispanic Americans (84%) favor nondiscrimination laws. Almost nine in ten Americans of another race (87%) and multiracial Americans (87%) favor the laws.
Women (84%) are somewhat more likely than men (81%) to favor nondiscrimination protections.
Differences exist between Americans with and without college degrees. Nearly nine in ten college graduates (88%) support nondiscrimination laws, whereas eight in ten Americans without college degrees support the laws. Furthermore, college graduates are much more likely to strongly favor nondiscrimination laws (56%) than those who did not graduate from college (38%).
Religiously Based Refusals to Serve LGBTQ People
A majority of Americans (63%) oppose allowing small business owners to refuse service to LGBTQ people if doing so violates their religious beliefs, and only 36% support allowing religiously based service refusals. Americans who know someone who is LGBTQ (34%) are somewhat less likely than those who do not know anyone who is LGBTQ (42%) to favor religiously based service refusals.
Republicans (61%) are more than three times as likely as Democrats (18%) to favor allowing businesses to refuse service to LGBTQ people. More than one-third of independents (36%) agree.
Notably, white evangelical Protestants remain the only major religious group in which a majority favors religiously based service refusals, and their support for these exemptions is increasing. A majority of white evangelical Protestants (62%) say that they support allowing small business owners to refuse to serve LGBTQ people, up from 54% in 2019 and 51% in 2015. Less than half of all other religious groups favor religiously based service refusals. This includes around four in ten or more Latter-day Saints (46%), Jewish Americans (42%), and white mainline Protestants (40%), and less than four in ten other Protestants of color (38%), Hispanic Protestants (37%), white Catholics (37%), and Black Protestants (35%). Fewer than three in ten Hispanic Catholics (29%), other Christians (26%), and other non-Christian religious Americans (26%) agree. Religiously unaffiliated Americans are the least likely to favor allowing service refusals (22%).
White Americans (39%) are more likely to favor allowing service refusals than all other racial or ethnic groups. About three in ten Black Americans (31%) and Hispanic Americans (31%) favor letting business owners refuse service to LGBTQ customers.
Men (40%) are more likely than women (32%) to support religiously based refusals to serve LGBTQ people.
Slightly more Americans with college degrees oppose service refusals (66%) compared to those without college degrees (61%).
Most Americans Think LGBTQ Discrimination Is Illegal
Large majorities of Americans believe that LGBTQ discrimination is illegal at the federal level: for a doctor or health care professional to refuse to treat someone (81% today vs. 79% in 2019); for a business to fire or deny someone a job (79% today, up from 67% in 2019); or for a property owner to refuse to rent a house or apartment to someone (73% today, up from 60% in 2019) because they are lesbian, gay, bisexual, or transgender. There are few differences by demographic groups on opinions of the legality of these types of discrimination. When the survey asked about these practices in 2019, all were legal at the federal level, although some states had protections for LGBTQ residents in some categories, but Americans still mostly thought the actions were illegal at the federal level. In 2020, the Supreme Court ruled that employment discrimination against LGBTQ people is illegal, and a 2021 executive order expanded that ruling to cover health care and housing.[1]
It is legal at the federal level for a business owner to refuse the provision of products or services to LGBTQ individuals, although a slim majority of Americans (55%) continues to incorrectly believe it is illegal, the same percentage who thought so in 2019 (55%).
A majority of Americans (68%) correctly say it is legal under federal law for a church or religious organization to refuse to perform a wedding for an LGBTQ couple. This knowledge has increased significantly, from 51% in 2019.
Anti-Transgender Legislation: Sports and Bathroom Policies
Transgender Students and High School Athletics
Americans express differing opinions about whether transgender students should be permitted to participate in high school sports. Less than half of Americans (46%) strongly favor or favor a transgender student who was assigned female at birth but who now identifies as male participating with other male students in high school athletic events. A slim majority (52%) oppose or strongly oppose this idea. Support for participation seems to have declined: In 2018, when PRRI asked the question in a yes or no format, 61% of Americans affirmed their support for allowing transgender boys to participate with cisgender male students in high school sports.
There is a nearly 50-point partisan gap on this question. Democrats (68%) are significantly more likely than Republicans (19%) to support allowing male transgender students to participate in high school athletic events with other male students. Independents (45%) fall near the general population mean. The decline in support among Republicans and independents since 2018 reaches nearly 20 percentage points. At that time, 37% of Republicans and 63% of independents supported allowing transgender boys to participate with cisgender male students. Democrats’ support has fallen by a much smaller proportion, from 74% in 2018 to its current rate (68%).
Support among Republicans and independents varies by media consumption. While support remains very low among all Republicans, those who say they most trust mainstream news sources (26%) are more likely than those who trust Fox News (15%) or far-right media (3%) to support allowing transgender boys to participate in sports with cisgender male students.[2] Among independents, a majority of those who most trust mainstream news sources (53%) support participation, but that proportion is more than halved among those who most trust Fox News (25%).[3]
Personal relationships strongly structure opinions. Around six in ten Americans (63%) who know someone who is transgender, compared to 43% of those who do not know someone who is transgender, favor allowing someone who was assigned female at birth but now identifies as male to participate in high school sports with cisgender male students.
Americans are less likely to support participation in high school events by students who were assigned male at birth but who now identify as female. Over one-third of Americans (36%) believe that these students should be allowed to participate in sporting events with their cisgender female classmates. About six in ten (61%) are opposed to this policy. Again, support for participation seems to have declined: In 2018, when PRRI asked the question in a yes or no format, 50% of Americans affirmed their support for allowing transgender girls to participate with cisgender female students in high school sports.
Fewer Democrats (62%), independents (30%), and Republicans (9%) favor allowing transgender female students to participate in high school athletic events with cisgender female students, but the partisan gaps remain very large. Support has declined drastically among Republicans—by more than two-thirds—since 2018, when 30% supported participation. Independent support has declined by one-third, from 46% in 2018, and support among Democrats has declined by 11 percentage points, from 73% in 2018.
Republicans who most trust Fox News (5%) and far-right news sources (4%) are about half as likely to support allowing transgender female students to participate in high school athletic events with cisgender female students, whereas Republicans who most trust mainstream news sources are twice as likely (20%). Similarly, independents who most trust Fox News (7%) are much less likely than those who trust mainstream sources (35%) to support transgender girls participating in sports with cisgender girls.[4]
A slim majority of Americans who know a transgender person (52%), compared to one-third of Americans who do not know anyone who is transgender (33%), believe that someone who was assigned male at birth but now identifies as female should be allowed to compete in high school sports with cisgender female students.
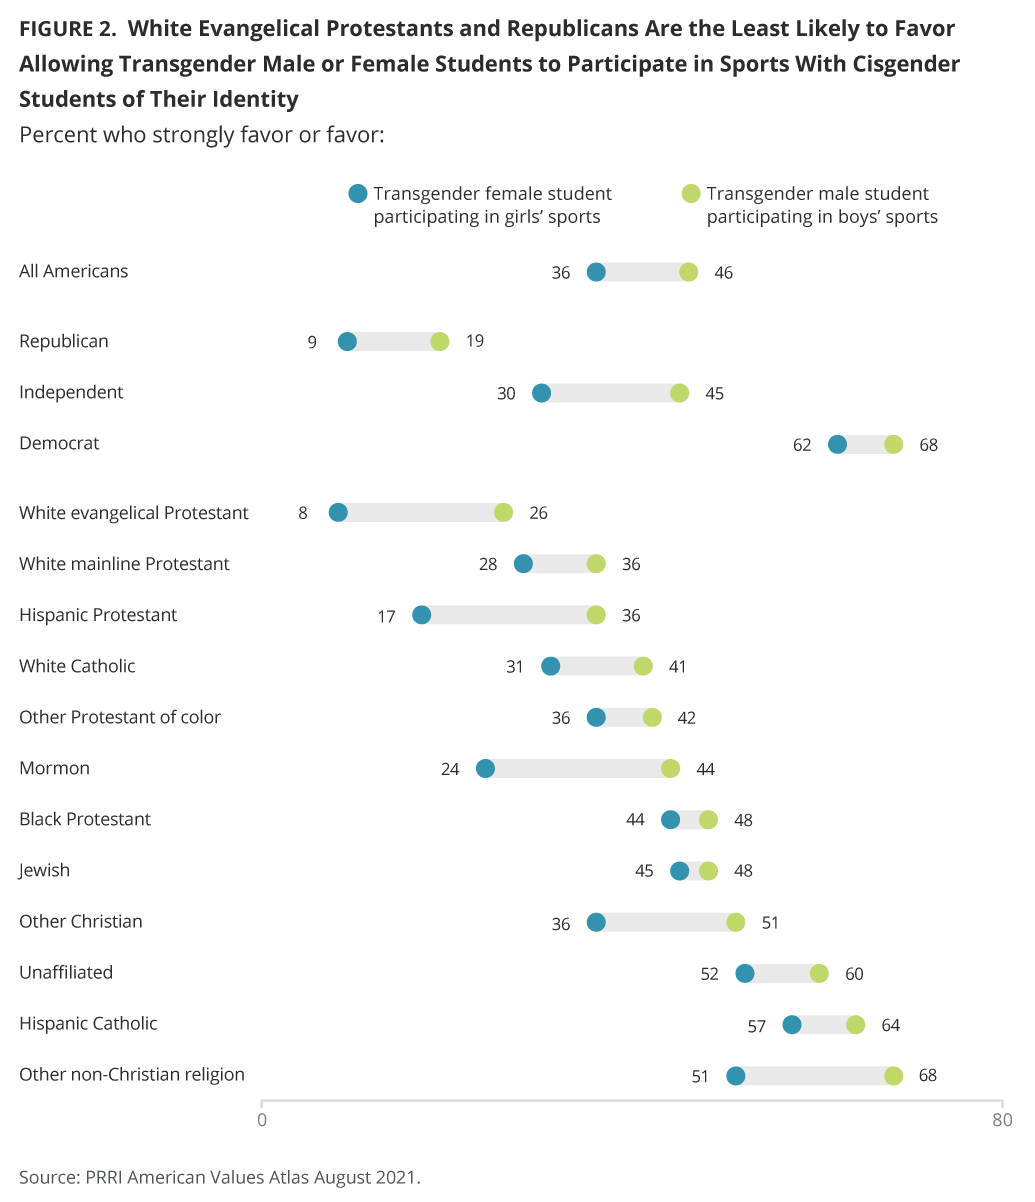
The same trend occurs across all religious groups, with white evangelical Protestants least supportive of either male (26%) or female (8%) transgender students participating in high school athletic events with cisgender students who share their gender identity. By contrast, members of other non-Christian religions (68% male transgender vs. 51% female transgender), Hispanic Catholics (64% male transgender vs. 57% female transgender), and religiously unaffiliated Americans (60% male transgender vs. 52% female transgender) are the only religious groups in which majorities support the participation of both male and female transgender students in high school sports.
Bathroom Accommodations
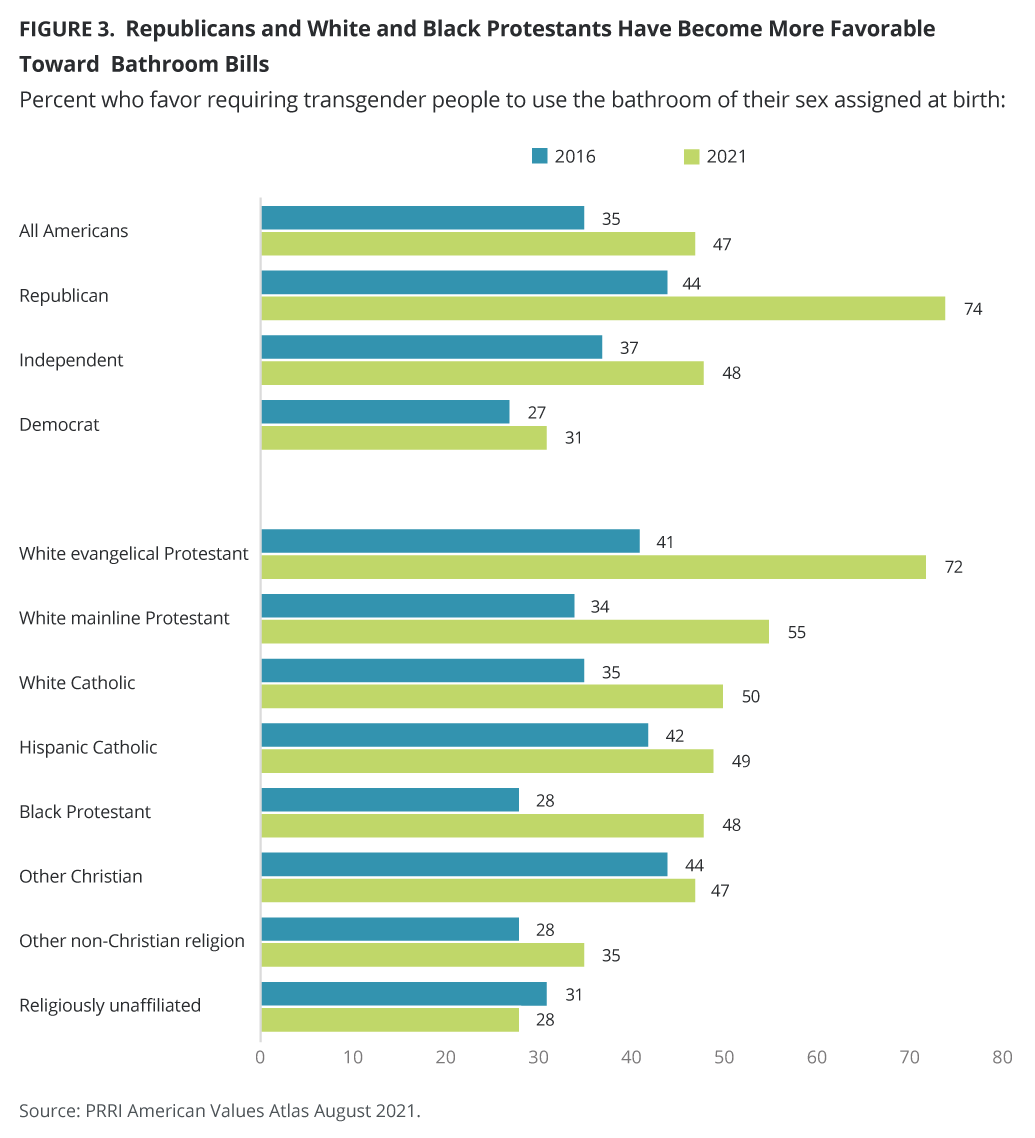
Over the past few years, several so-called bathroom bills—legislation that would require transgender people to use bathrooms consistent with their sex assigned at birth—have appeared in state legislatures. Americans continue to be divided over these policies (47% favor, 50% oppose), similar to rates recorded in 2019 (45% favor, 47% oppose), but are more in favor of these bills than they were in 2016 (35% favor, 53% oppose). This uneven shift is mostly due to the significant proportion of Americans who say they are unsure what to think about the issue (12% in 2016, 8% 2019, and 2% in 2021). Americans who know someone who is transgender are less likely to support restrictive bathroom bills (36%) compared to those who do not know anyone who is transgender (51%).
Compared to 2016, support for restrictive bathroom policies is notably higher among Republicans and independents and across a range of demographics, including religious affiliation, race, education, age, and gender. Among partisans, the biggest shift is among Republicans. Republicans have increased 30 percentage points, to 74% support, from 44% in 2016. Independents are also more likely to support this policy today (48%) than they were in 2016 (37%). Democrats have not shifted significantly since 2016 (31% today vs. 27% in 2016).
White Christian groups are notably more likely to support requiring transgender individuals to use bathrooms that match their assigned sex at birth today than they were in 2016: White evangelical Protestants (72% today vs. 41% in 2016), white mainline Protestants (55% today vs. 34% in 2016), and white Catholics (50% today vs. 35% in 2016) have all increased by at least 15 percentage points. Black Protestants (48%) have grown more supportive of this policy than they were in 2016 (28%). Notably, the only religious group whose views have not shifted significantly are religiously unaffiliated Americans (28% today vs. 31% in 2016).
Other subgroups that show a large increase in support over the past five years for requiring transgender individuals to use bathrooms corresponding to their assigned sex at birth include Black Americans (45% vs. 28% in 2016), white Americans (49% vs. 33% in 2016), white Americans without college degrees (55% vs. 36% in 2016), Americans over the age of 65 (51% vs. 32% in 2016), Americans ages 50–64 (56% vs. 37% in 2016), men (50% vs. 39% in 2016), and women (44% vs. 31% in 2016). White Americans with college degrees increased in support, but not by as large a margin (39% vs. 31% in 2016).
However, not all Americans’ views have shifted on this topic. Hispanic Americans remain near their 2016 support levels (46% in 2021 vs. 43% in 2016), as do multiracial Americans and Americans of other races (37% vs. 35% in 2016), religiously unaffiliated Americans (28% vs. 31% in 2016), and young Americans ages 18–29 (36% vs. 35% in 2016).
Americans’ Comfort Levels With Transgender People
Americans’ Comfort Levels With Transgender People in Their Communities
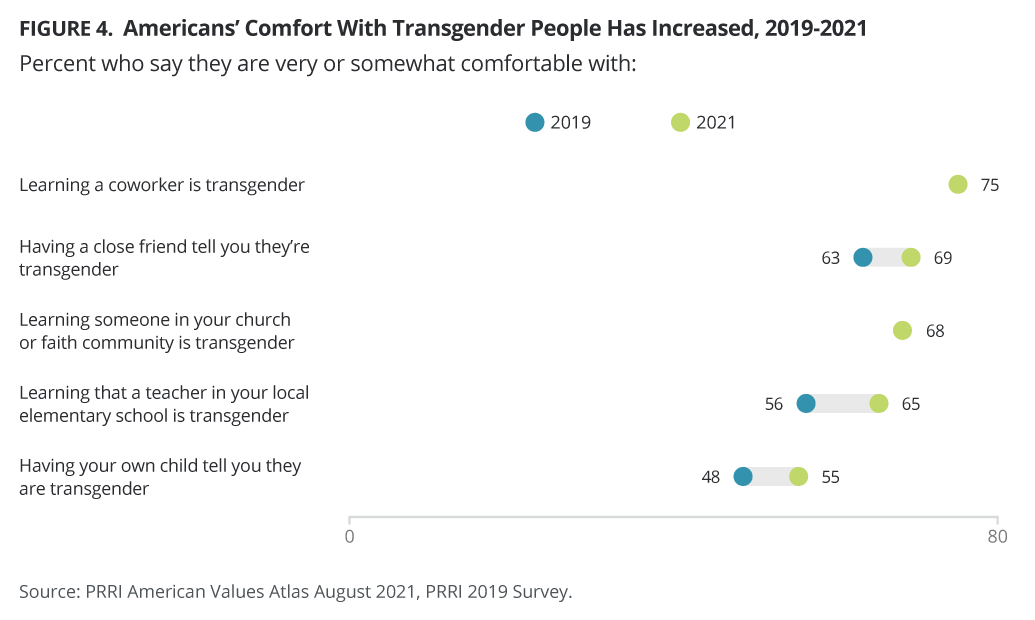
Three in four Americans (75%) say they would be somewhat or very comfortable learning a coworker is transgender. Nearly seven in ten Americans (69%) say they would be somewhat or very comfortable having a close friend tell them they are transgender. This percentage has gone up, from 63% in 2019. In addition, nearly seven in ten Americans (68%) say they would be somewhat or very comfortable learning someone in their church or faith community is transgender, and nearly two-thirds of Americans (65%) report that they would feel somewhat or very comfortable learning that a local elementary school teacher is transgender, up from 56% in 2019.
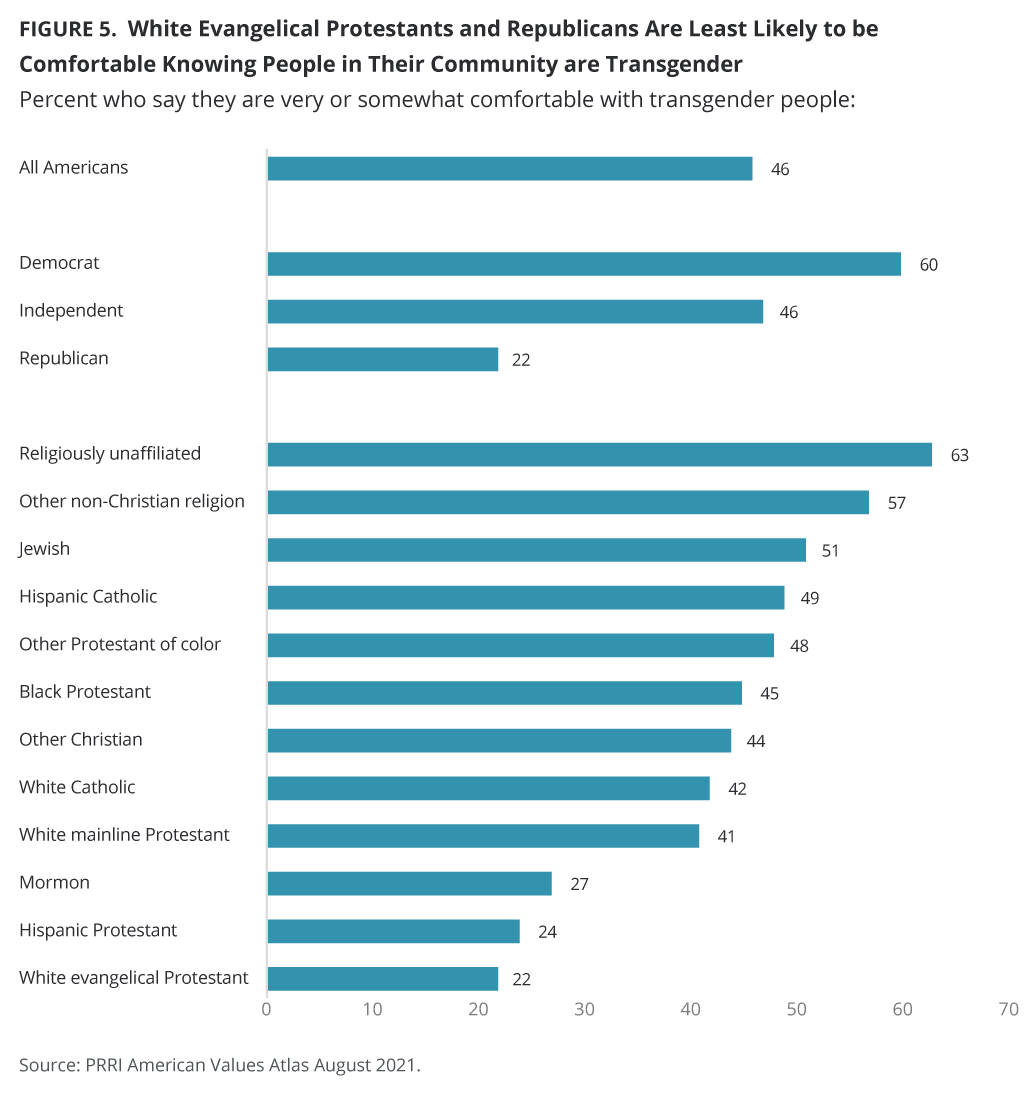
Responses to these four questions are very strongly correlated, so for analysis, a four-point composite index was created to evaluate Americans’ comfort levels with finding out someone they know is transgender, where a score of 1 indicates very uncomfortable, 2 indicates somewhat uncomfortable, 3 indicates somewhat comfortable, and 4 indicates very comfortable.[5] Using this scale, less than half of Americans are very (31%) or somewhat (15%) comfortable with transgender people in their communities, compared to a slim majority who are very uncomfortable (23%) or somewhat (32%) uncomfortable.
Democrats (60%) are about three times as likely as Republicans (22%) to be somewhat or very comfortable finding out someone they know is transgender. Independents (46%) are in line with the general population (46%).
Religiously unaffiliated Americans (63%) and members of other non-Christian religious groups (57%) are the only groups where a majority of members say they are somewhat or very comfortable learning a teacher in a local elementary school, someone in their church or faith community, a close friend, or a coworker is transgender. About half of Jewish Americans (51%), Hispanic Catholics (49%), other Protestants of color (48%), and Black Protestants (45%) say the same. About four in ten other Christians (44%), white Catholics (42%), and white mainline Protestants (41%) say they are comfortable with someone they know being transgender, compared to about one in five Latter-day Saints (27%), Hispanic Protestants (25%), and white evangelical Protestants (21%).
While majorities of multiracial Americans (62%) and Americans who identify as another race (57%) feel somewhat or very comfortable finding out someone they know is transgender, less than half of Hispanic Americans (46%), Black Americans (45%), and white Americans (43%) say the same. However, white Americans with college degrees are substantially more comfortable knowing someone transgender than white Americans without college degrees (54% vs. 39%).
Comfort levels with someone being transgender decrease with age, from Americans ages 18–29 (56%), ages 30–49 (49%), ages 50–64 (41%), and ages 65 and older (36%). Women (49%) are more likely than men (41%) to feel somewhat or very comfortable knowing someone is transgender.
Americans who live in the South (41%) and the Midwest (43%) are notably less likely than Americans who live in the West and the Northeast (51% for both) to say they are comfortable knowing people in their communities are transgender. The same is true among those who live in rural areas (34%), compared to those who live in suburban (47%) or urban (49%) areas.
Having a Transgender Child
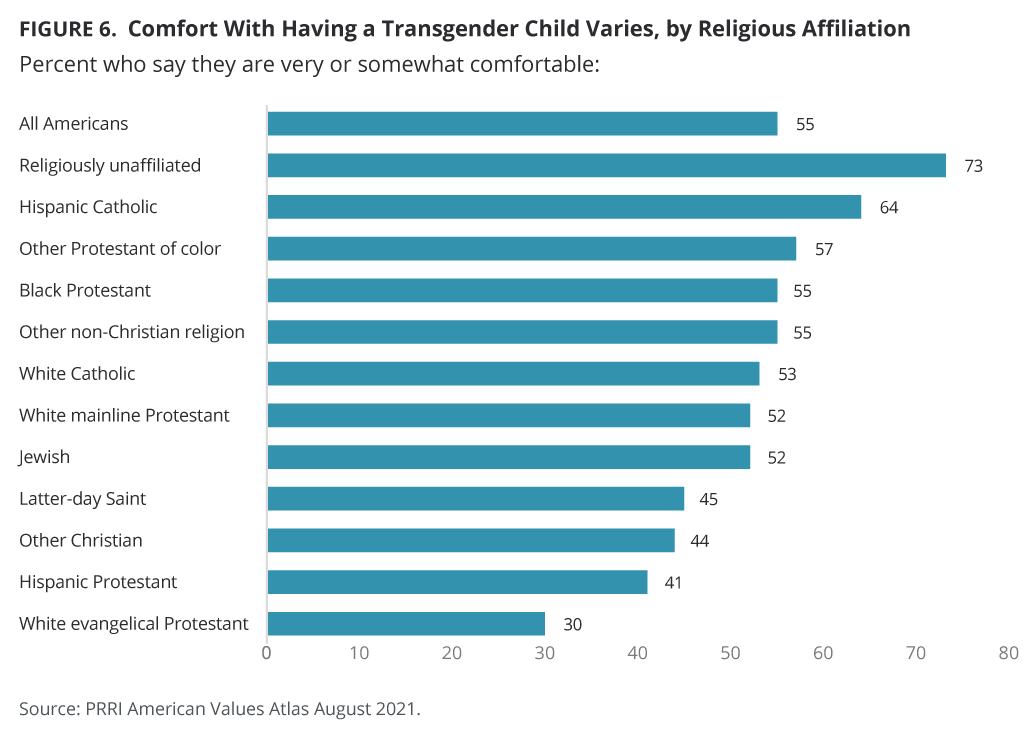
Americans are notably less likely to be somewhat or very comfortable with having their own child tell them they are transgender (55%) than in the other circumstances they were asked about. Still, a majority of Americans (55%) say they would feel somewhat or very comfortable with having their own child tell them they are transgender, an increase from 48% in 2019. Parents of children under age 18 do not differ significantly from those without children under age 18 (55% vs. 58%).
Around three in four Americans who know someone who is transgender (74%), compared to half of Americans who do not know a transgender person (50%), say they would be very or somewhat comfortable having their child tell them they are transgender. Six in ten Americans who know an LGBTQ person, including transgender, gay, lesbian, bisexual, and nonbinary people (62%), compared to less than four in ten Americans who do not know any LGBTQ people (38%), say they would be comfortable with their child telling them they are transgender.
Democrats (68%) and independents (57%) are more likely to report being somewhat or very comfortable having a transgender child today than they were in 2019 (60% and 50%, respectively), while Republicans have not shifted their views (32% vs. 33% in 2019).
Religiously unaffiliated Americans (73%) and Hispanic Catholics (64%) are the most likely to say they are comfortable with having a transgender child. Slim majorities across most religious groups say they would be somewhat or very comfortable with their child being transgender: other Protestants of color (57%), Black Protestants (55%), members of non-Christian religious groups (55%), white Catholics (53%), white mainline Protestants (52%), and Jewish Americans (52%). Latter-day Saints (45%), other Christians (44%), Hispanic Protestants (41%), and white evangelical Protestants (30%) are the least likely to say they would be comfortable with having a transgender child.
Hispanic Americans (61%), Americans of another race (61%), and multiracial Americans (60%) would be more comfortable with their child being transgender than Black Americans (55%) and white Americans (52%) would be, but white Americans with college degrees are notably more comfortable than those without college degrees (58% vs. 50%).
Comfort levels with a transgender child decrease with age, from Americans ages 18–29 (64%), ages 30–49 (56%), ages 50–64 (52%), and ages 65 and older (49%). Women (58%) are more likely than men (51%) to feel somewhat or very comfortable with a transgender child.
Beliefs About Gender Identity
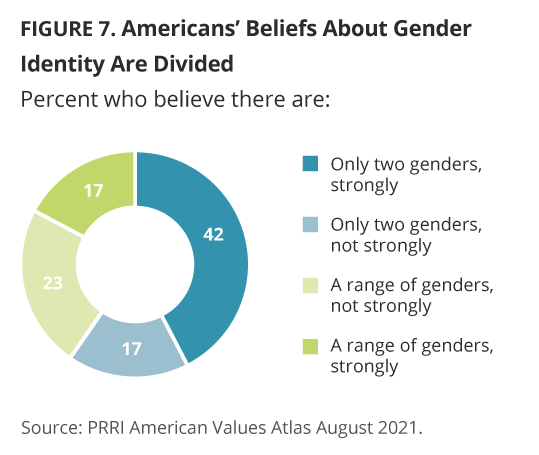
A majority of Americans (59%) believe that there are only two genders. A 42% plurality of Americans feel strongly that there are only two genders (male and female), and an additional 17% believe that there are only two genders but do not feel strongly about it. Around one in four Americans (23%) think that there is a range of many gender identities but do not feel strongly, and less than one in five (17%) feel strongly that there is a range of many possible gender identities. These beliefs are roughly unchanged since 2019.
Americans who know someone who is gay, lesbian, bisexual, transgender, or nonbinary are less likely to believe in a gender binary than those who do not know anyone who is LGBTQ. Among those who know an LGBTQ person, 54% believe that there are only two genders, compared to 73% among those who do not know anyone who is LGBTQ.
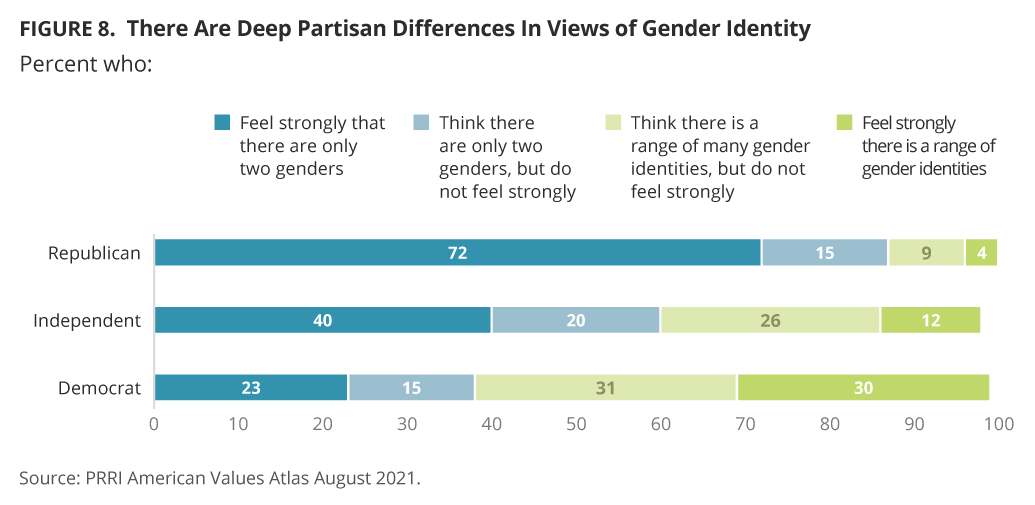
Unsurprisingly, there are deep divides along partisan lines in attitudes toward gender expression. Nearly nine in ten Republicans (87%) believe that there are two genders, including 72% who feel strongly about it. Just 13% of Republicans believe there is a range of gender identities. Republicans who know someone who is LGBTQ are slightly less likely than those who do not know any LGBTQ people to say there are only two genders (85% vs. 92%, respectively). Republicans who know someone who is LGBTQ are much less likely to feel strongly that there are only two genders than Republicans who do not know any LGBTQ people (67% vs. 81%, respectively).
Democrats are more divided on the issue of gender expression. Around four in ten Democrats (38%) believe there are just two genders, including about one in four (23%) who feel strongly that gender is binary. Six in ten Democrats (61%) believe there is a range of gender identities, evenly divided between those who feel strongly (30%) and not strongly (31%).
Democrats are most divided along age and racial and ethnic lines in their attitudes toward gender identity. Nearly seven in ten Democrats under age 50 (69%), compared to a slim majority of Democrats over age 50 (52%), believe that there is a range of gender identities. More than seven in ten white Democrats (72%) believe there is a range of gender identities, compared to fewer Hispanic Democrats (55%) and less than four in ten Black Democrats (39%).
Six in ten independents (60%) believe that there are two genders, including a 40% plurality who feel strongly that there is a gender binary. Just under four in ten independents (38%) feel that there is a range of gender identities, with 12% who feel that way strongly. Interestingly, there is no age gap among independents, though there is among Democrats.
Nearly nine in ten white evangelical Protestants (86%), eight in ten Hispanic Protestants (79%), and three in four Black Protestants (73%) believe there are only two genders. Three-quarters of white evangelical Protestants (74%), two-thirds of Hispanic Protestants, and a majority of Black Protestants (54%) feel strongly that there are only two genders.
Majorities of white mainline Protestants (65%), white Catholics (62%), other Christians (55%), and other Protestants of color (52%) believe that there are only two genders. Less than half of Hispanic Catholics (48%), Jewish Americans (44%), other non-Christian religious Americans (42%), and religiously unaffiliated Americans (38%) think that there are only two genders.
Belief in a gender binary generally increases with age. Young Americans ages 18–30 are some of the least likely to believe that there are only two genders (48%), compared to 56% of those ages 30–49, 66% of Americans ages 50–64, and 62% of Americans over age 65.
Majorities of Black Americans (65%), White Americans (60%), Hispanic Americans (56%), and multiracial Americans (56%), compared to four in ten Americans of other races (40%), believe that there are only two genders.
Men (63%) are more likely than women (54%) to believe that there are only two genders.
Americans with lower levels of traditional education are more likely to believe in a gender binary. Around six in ten Americans with high school degrees or less (62%) and those with some college experience but no four-year degree (64%), compared to fewer of those with four-year college degrees (54%) or postgraduate degrees (45%), say there are only two genders.
White Americans are particularly divided along education lines: 64% of white Americans without college degrees say there are only two genders, compared to 51% of white Americans with at least a four-year degree who say the same.
Personal Relationships With LGBTQ People
Most Americans Know Someone Who Is LGBTQ
Knowing someone who is lesbian, gay, bisexual, transgender, or nonbinary is associated with more positive attitudes toward inclusive LGBTQ policies. More Americans report knowing someone in these categories than in previous PRRI polls.
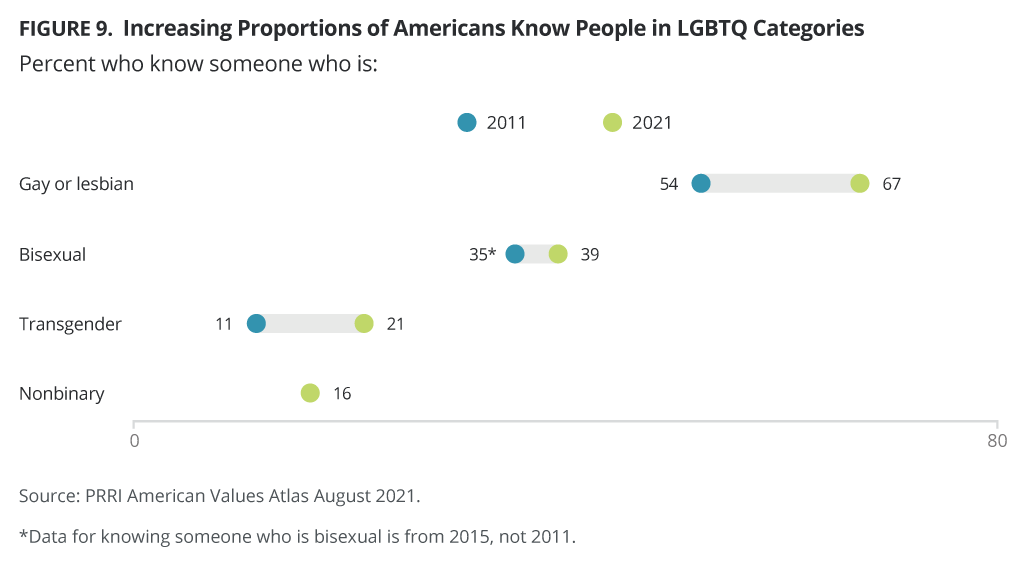
Two-thirds of Americans (67%) say they know someone who is gay or lesbian. Four percent of Americans report that they themselves are gay or lesbian, 25% say a close friend is gay or lesbian, 31% say a family member is gay or lesbian, 28% say someone else they know is gay or lesbian, and 26% say they do not know anyone who is gay or lesbian. In 2011, 54% of Americans said they knew someone who is gay or lesbian.
About four in ten Americans (39%) report that they know someone who is bisexual. Five percent of Americans report that they themselves are bisexual, 14% say a close friend is bisexual, 11% say a family member is bisexual, 19% say someone else they know is bisexual, and 54% say they do not know anyone who is bisexual. In 2015, 35% said they knew someone who is bisexual.
Just over one in five Americans (21%) know someone who is transgender. One percent of Americans report that they themselves are transgender, 5% say that a close friend is transgender, 6% say a family member is transgender, 11% say someone else they know is transgender, and 78% say they do not know anyone who is transgender. In 2011, 11% said they knew someone who is transgender.
Overall, 16% of Americans know someone who is nonbinary. One percent of Americans report that they themselves are nonbinary, four percent of Americans have a close friend who is nonbinary, three percent have a family member who is nonbinary, 11% know someone else who is nonbinary, and three in four (76%) do not know anyone who is nonbinary.[6]
Altogether, 72% of Americans know someone in one or more of these categories, and 28% say they do not. Majorities of all partisans know someone in these categories, although Republicans (64%) are somewhat less likely to report knowing someone than independents (72%) or Democrats (77%).
Hispanic Protestants (63%) and white evangelical Protestants (66%) are the least likely to know someone in these categories, but still, more than six in ten report they do know someone.
Around two-thirds or more of non-Christian religious Americans (68%), Hispanic Catholics (68%), other Christians (68%), and Latter-day Saints (69%) know someone in these LGBTQ categories.[7] Seven in ten or more Jewish Americans (71%), other Protestants of color (72%), white mainline Protestants (74%), white Catholics (75%), religiously unaffiliated Americans (75%), and Black Protestants (78%) know someone in one or more of these categories.[8]
Americans with greater levels of traditional education are more likely to know someone who is LGBTQ. Two-thirds of Americans with high school degrees or less know someone who falls into an LGBTQ category (67%), compared to 73% of those with some college experience but no four-year degree, 77% of those with four-year degrees, and 76% of those with postgraduate degrees.
Interestingly, there are minimal divisions by age for knowing someone who is LGBTQ. Around three-quarters of Americans ages 18–29 (74%), compared to 73% of Americans ages 30–49, 72% of Americans ages 50–64, and 67% of Americans over age 65 say they know someone who is gay, lesbian, bisexual, transgender, or nonbinary.
It Matters Who You Know
There is a correlation between knowing someone who is in these categories and attitudes toward LGBTQ people and policies. Those who know someone in one or more of the above categories are more likely to believe there are more than two genders, to be comfortable with transgender people in their communities, to support allowing transgender students to participate in high school sports with others of their gender identity, to oppose restrictive bathroom bills, to support nondiscrimination policies, and to oppose religiously based refusals to serve gay and lesbian people.
Survey Methodology
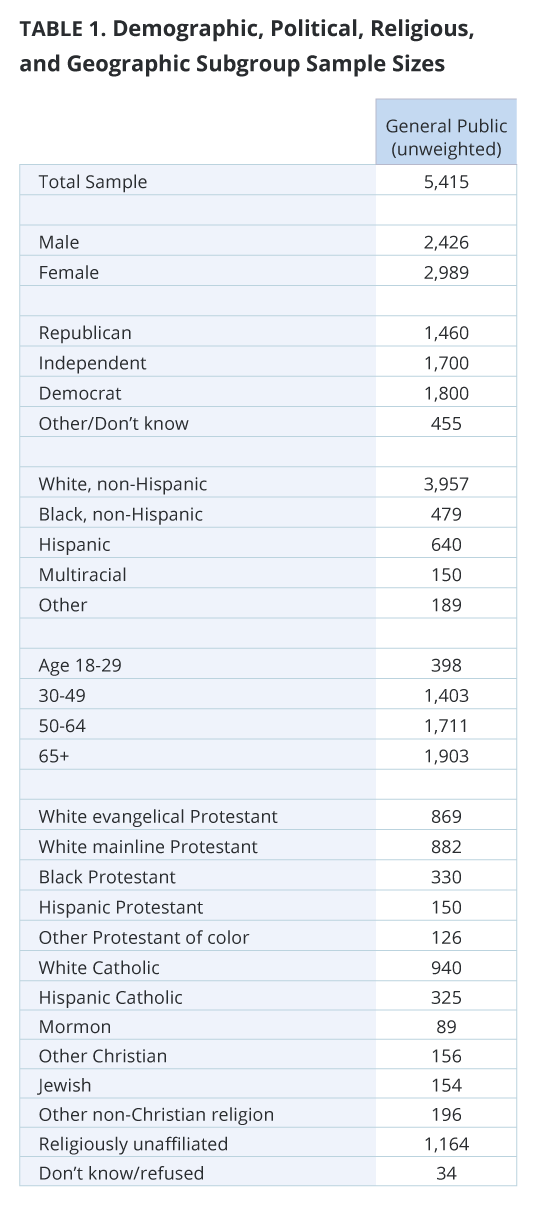
The survey was designed and conducted by PRRI among a representative sample of 5,415 adults (age 18 and up) living in all 50 states in the United States, including 5,032 who are part of Ipsos’s Knowledge Panel and an additional 383 who were recruited by Ipsos using opt-in survey panels to increase the sample sizes in smaller states. Interviews were conducted online between August 9 and 30, 2021.
 Respondents are recruited to the KnowledgePanel using an addressed-based sampling methodology from the Delivery Sequence File of the USPS – a database with full coverage of all delivery addresses in the U.S. As such, it covers all households regardless of their phone status, providing a representative online sample. Unlike opt-in panels, households are not permitted to “self-select” into the panel; and are generally limited to how many surveys they can take within a given time period.
The initial sample drawn from the KnowledgePanel was adjusted using pre-stratification weights so that it approximates the adult U.S. population defined by the latest March supplement of the Current Population Survey. Next, a probability proportional to size (PPS) sampling scheme was used to select a representative sample.
To reduce the effects of any non-response bias, a post-stratification adjustment was applied based on demographic distributions from the most recent American Community Survey (ACS). The post-stratification weight rebalanced the sample based on the following benchmarks: age, race and ethnicity, gender, Census division, metro area, education, and income. The sample weighting was accomplished using an iterative proportional fitting (IFP) process that simultaneously balances the distributions of all variables. Weights were trimmed to prevent individual interviews from having too much influence on the final results. In addition to an overall national weight, separate weights were computed for each state to ensure that the demographic characteristics of the sample closely approximate the demographic characteristics of the target populations. The state-level post-stratification weights rebalanced the sample based on the following benchmarks: age, race and ethnicity, gender, education, and income.
These weights from the KnowledgePanel cases were then used as the benchmarks for the additional opt-in sample in a process called “calibration.” This calibration process is used to correct for inherent biases associated with nonprobability opt-in panels. The calibration methodology aims to realign respondents from nonprobability samples with respect to a multidimensional set of measures to improve their representation.
The margin of error for the national survey is +/- 1.86 percentage points at the 95% level of confidence, including the design effect for the survey of 1.96. In addition to sampling error, surveys may also be subject to error or bias due to question wording, context, and order effects. Additional details about the KnowledgePanel can be found on the Ipsos website: https://www.ipsos.com/en-us/solution/knowledgepanel
Endnotes
[1]In June 2020, the U.S. Supreme Court issued a ruling in the case of Bostock v. Clayton County that rendered employment discrimination on the basis of sexual orientation and gender identity illegal based on an expanded interpretation of Title VII of the Civil Rights Act that classifies such discrimination as sex discrimination. As one of his first executive orders issued in office, President Joe Biden expanded that ruling in early 2021 to cover health care and housing.
[2]Mainstream news sources include broadcast news (ABC, NBC, and CBS), CNN, MSNBC, local news, and public news (such as PBS). Far-right news sources include One America News Network and Newsmax.
[3]The sample size of independents who most trust Fox News is n=73, but the difference is significant.
[4]The sample size of independents who most trust Fox News is n=78, but the difference is significant.
[5]The Cronbach’s alpha for these four questions is 0.94.
[6]PRRI has not previously asked about knowing someone who is nonbinary.
[7]“Other Christian” includes all Christians who are not specified in any other category, including Catholics who are Black, Asian American or Pacific Islander, multiracial, Native American, and any other race or ethnicity; Jehovah’s Witnesses; Orthodox Christians; and any other Christian group. “Other non-Christian religion” includes those who are Muslim, Hindu, Buddhist, Unitarian Universalist, or any other world religion.
[8]“Other Protestant of color” includes all Protestants who are not white, Black, or Hispanic (including Asian American or Pacific Islander, multiracial, Native American, or any other race or ethnicity). Categories were combined due to sample size limitations.