

To view a replay of PRRI’s March 19, 2026, webinar on this topic or the slides presented during the webinar, please click here.
Executive Summary
LGBTQ Americans trend younger, Democratic, liberal, and more religiously unaffiliated than other Americans.
- One in ten Americans identify as LGBTQ. Two in ten Americans ages 18-29 (20%) identify as LGBTQ, compared with smaller shares among those ages 30-49 (11%), ages 50-64 (5%), and ages 65 and older (4%).
- LGBTQ Americans are more likely to identify as Democrats (40%), compared with 28% of all Americans, and are nearly twice as likely to identify as politically liberal (51% vs. 26%, respectively).
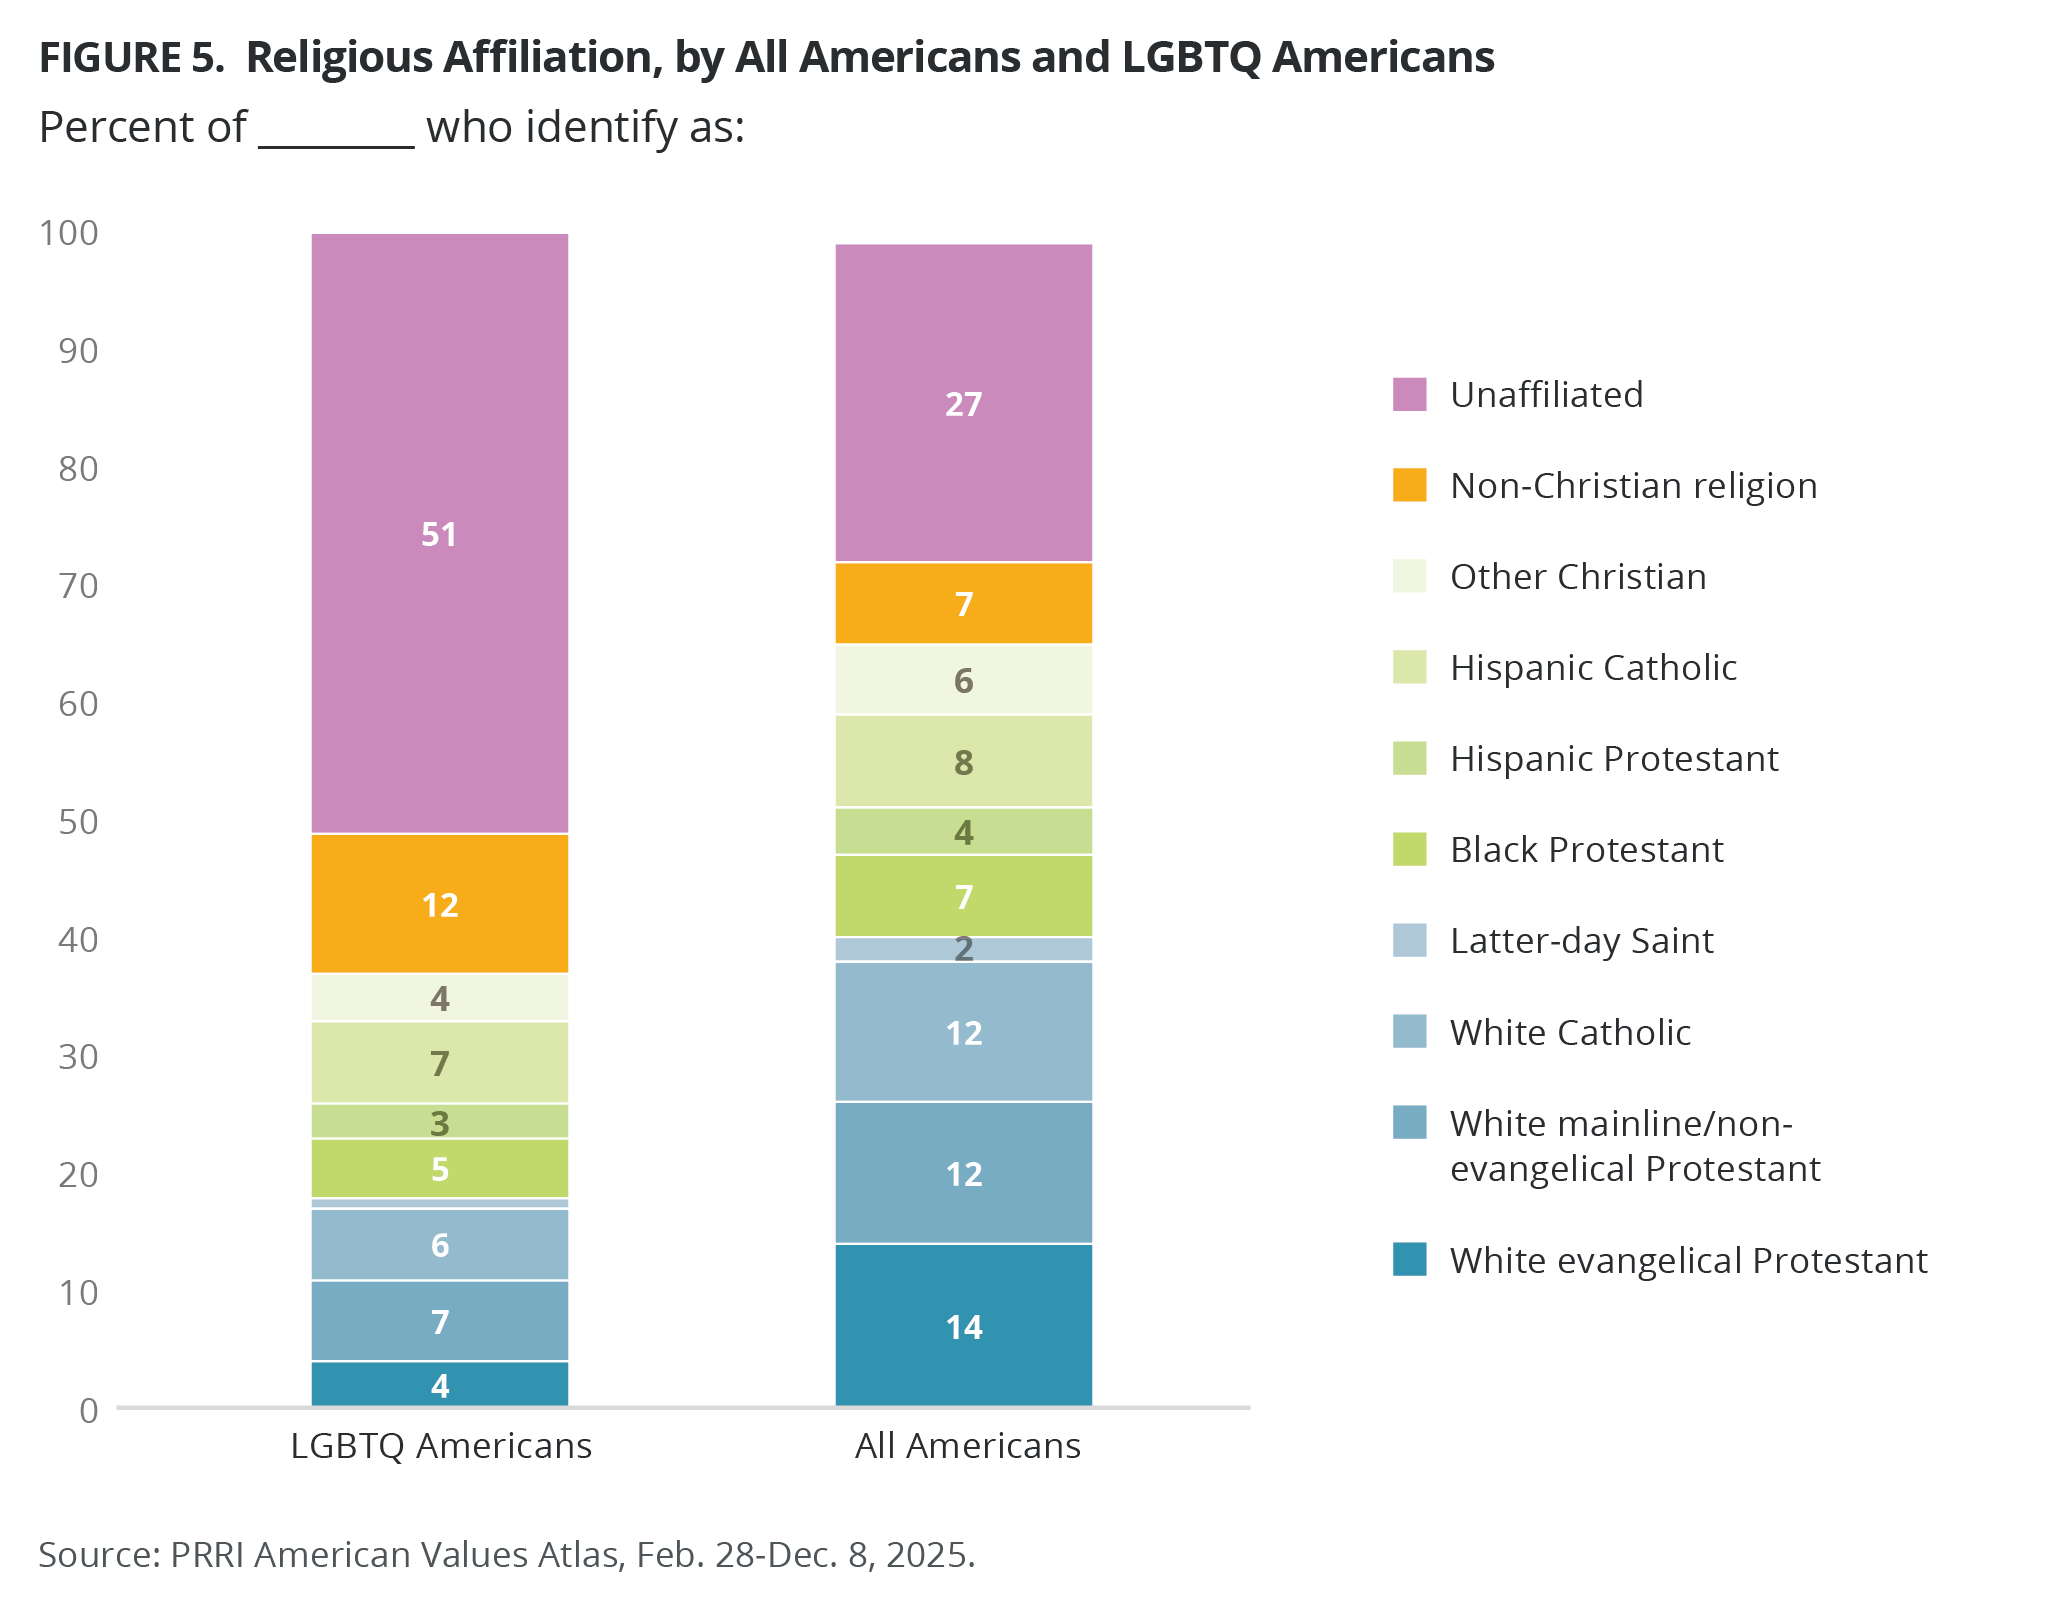
- The majority of LGBTQ Americans identify as religiously unaffiliated (51%), compared with 27% of all Americans.
Views on LGBTQ rights differ strongly by state.
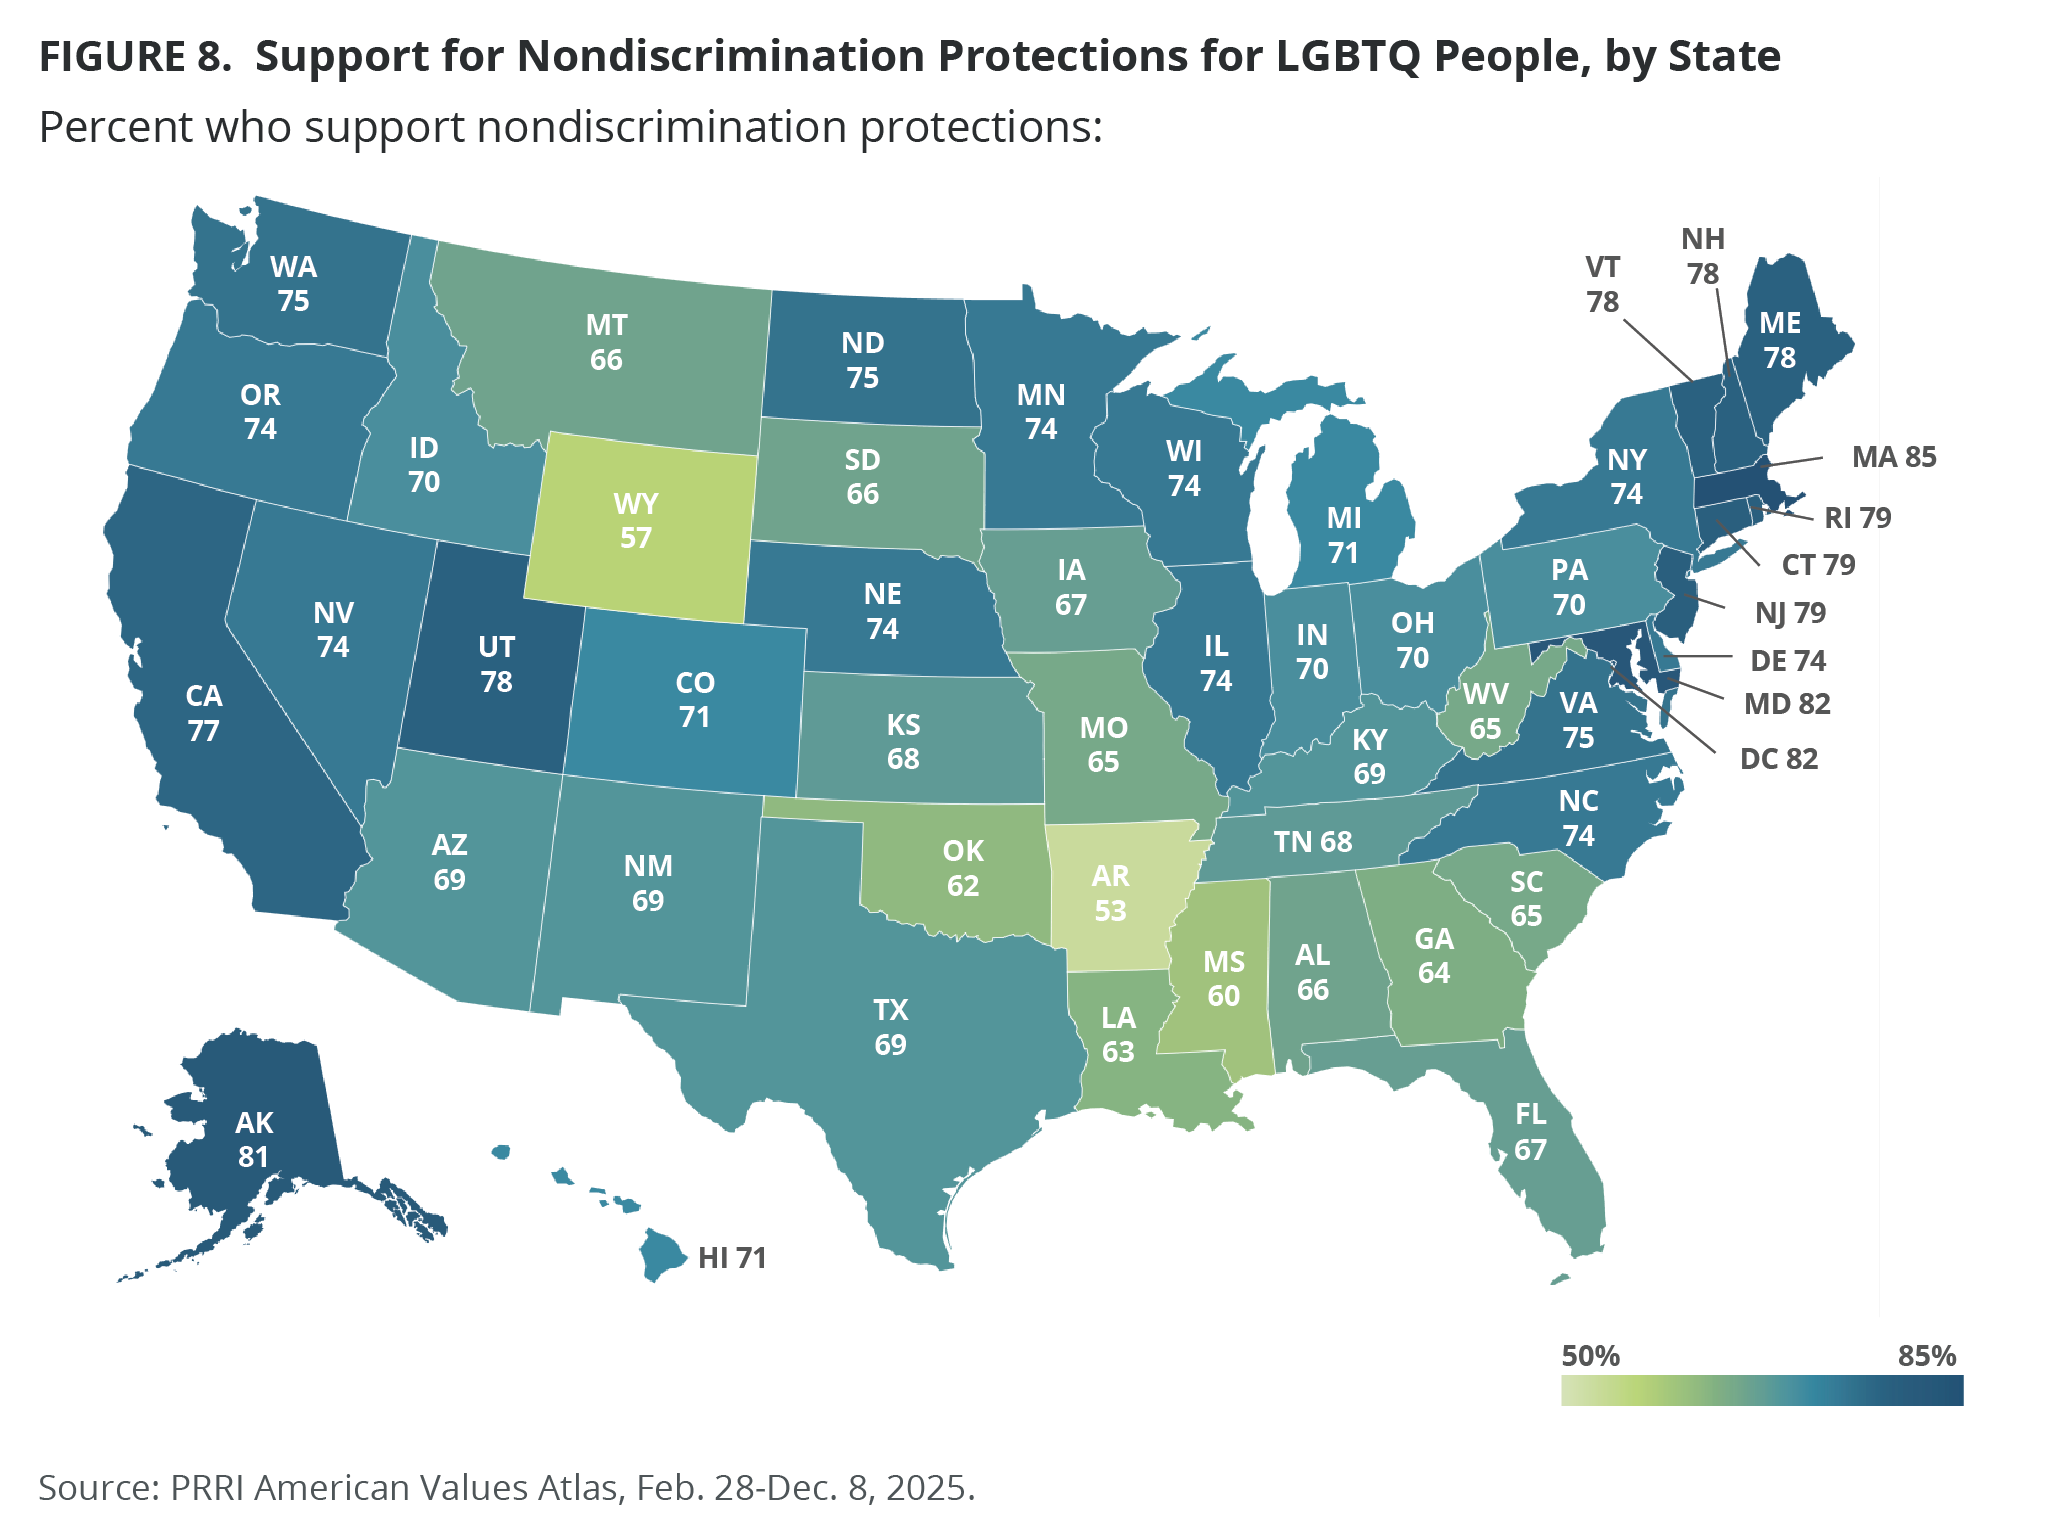
- Massachusetts (85%), Maryland (82%), and Alaska (81%), along with the District of Columbia (82%), hold the highest support for nondiscrimination protections for gay, lesbian, bisexual, and transgender people, while Mississippi (60%), Wyoming (57%), and Arkansas (53%) show the lowest support.
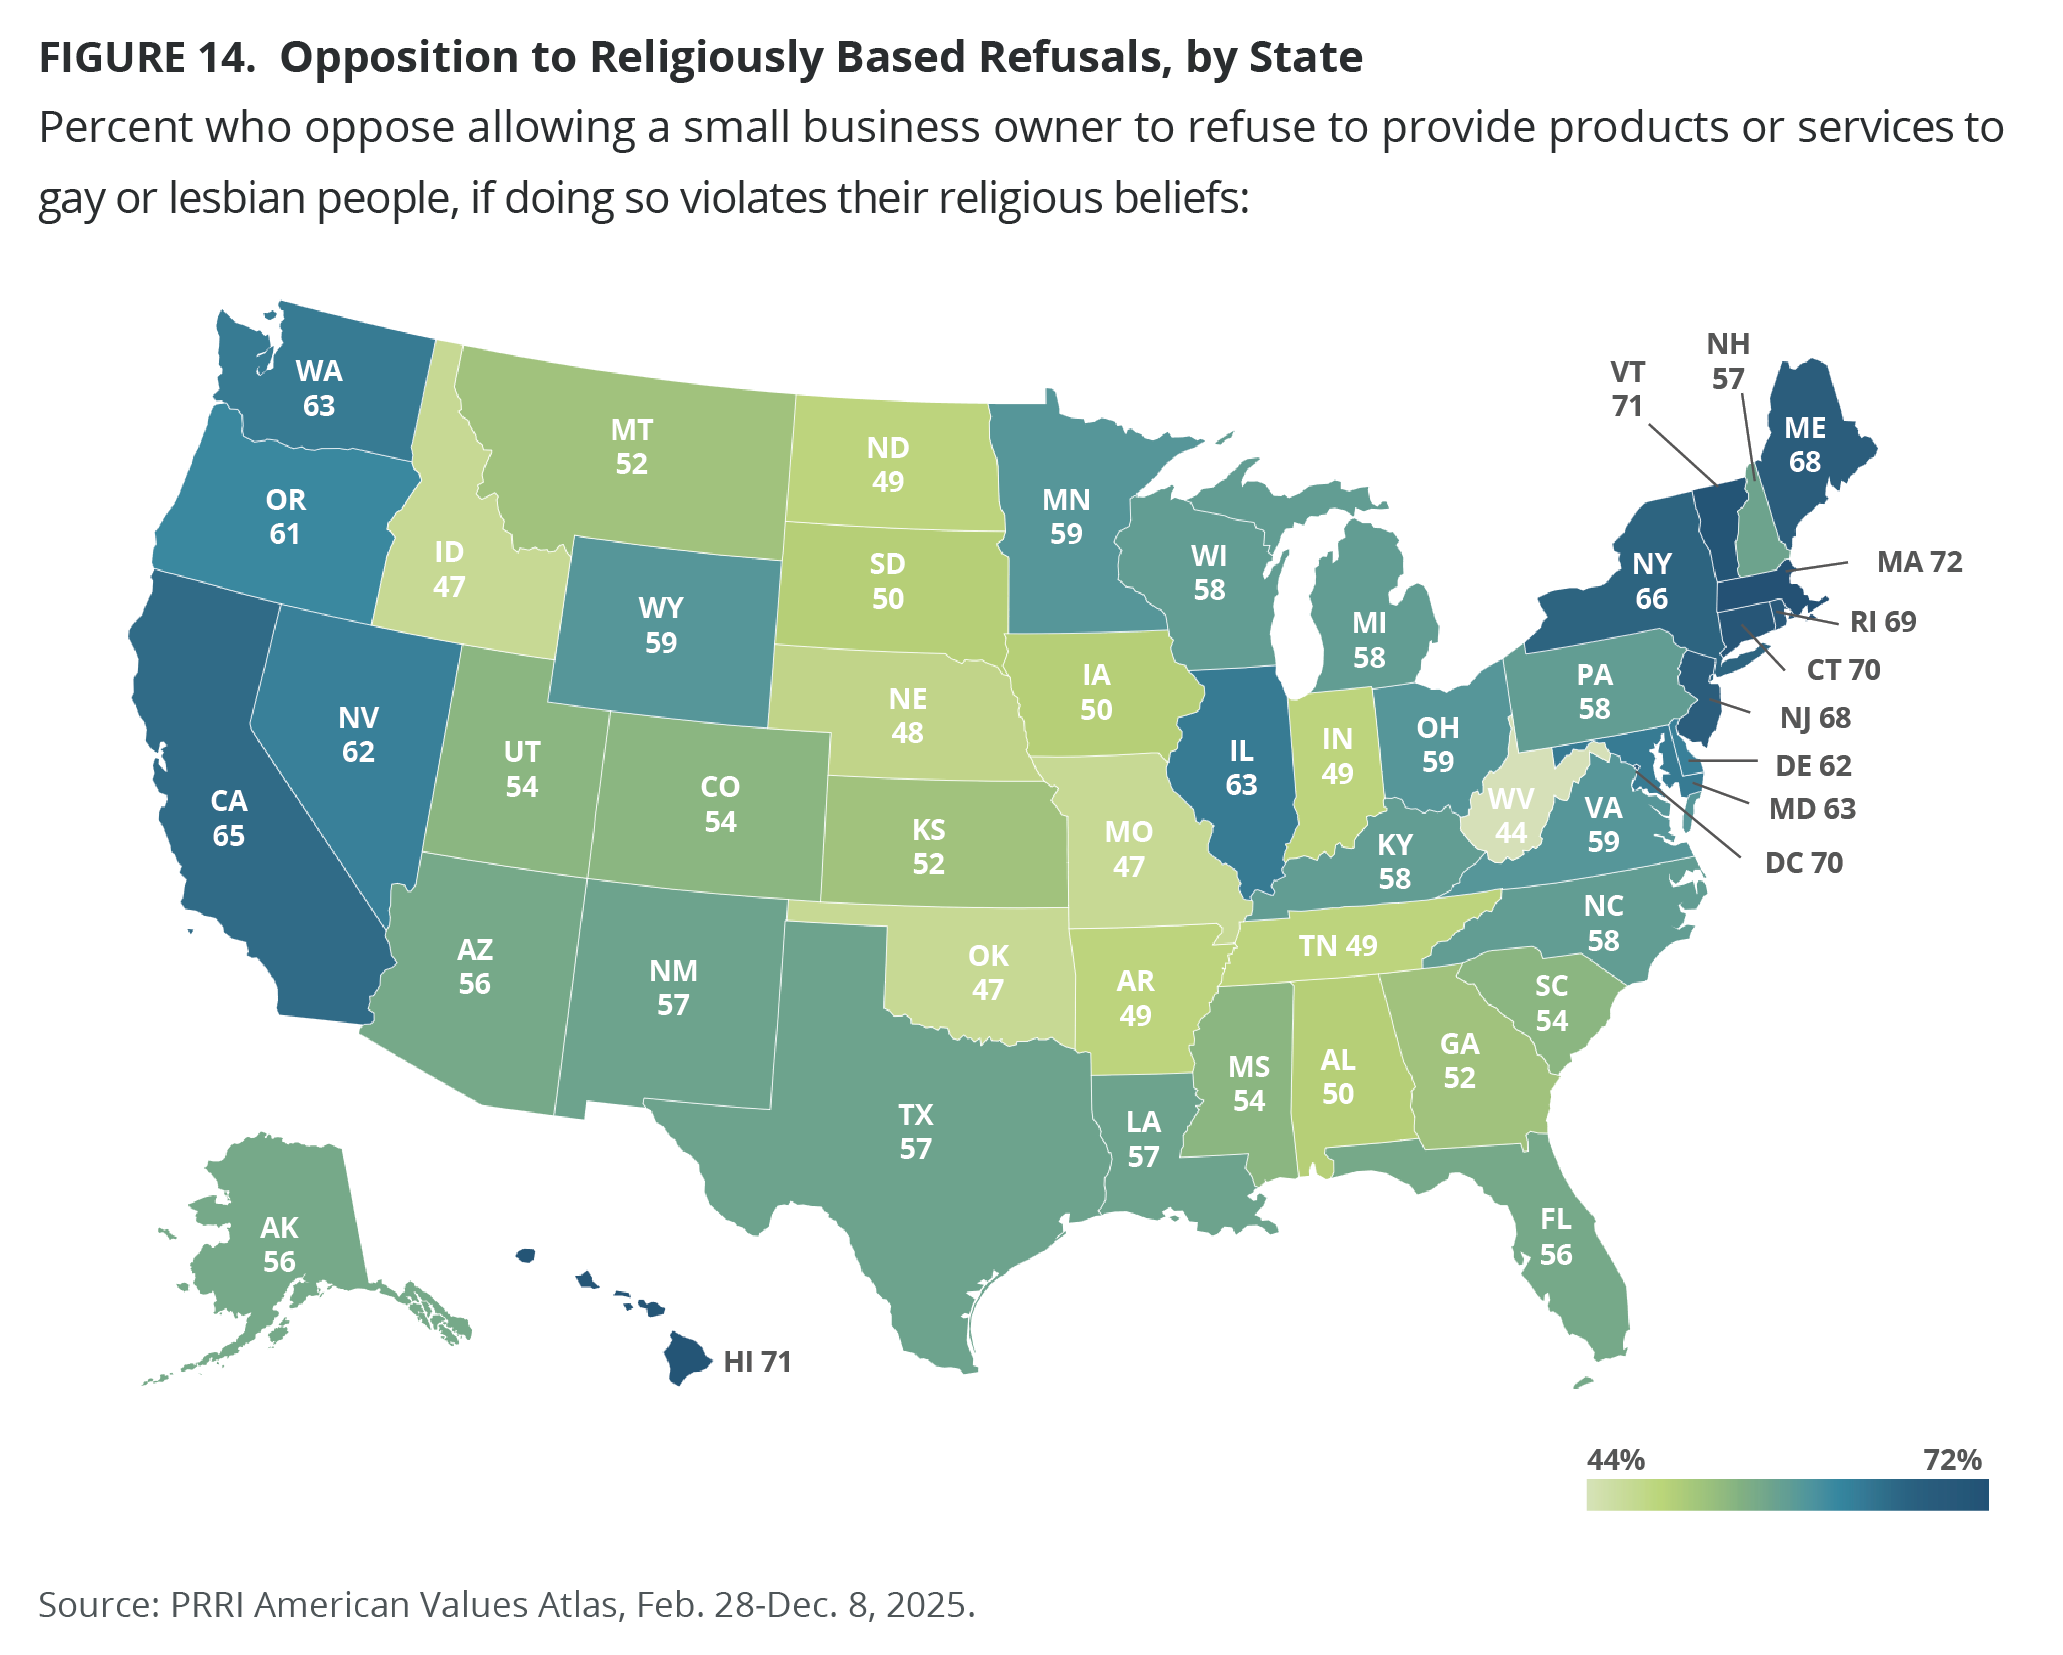
- Massachusetts (72%), Hawaii (71%), Vermont (71%), and Connecticut (70%), along with the District of Columbia (70%), show the strongest opposition to religiously based service refusals, while West Virginia (44%) shows the lowest opposition.
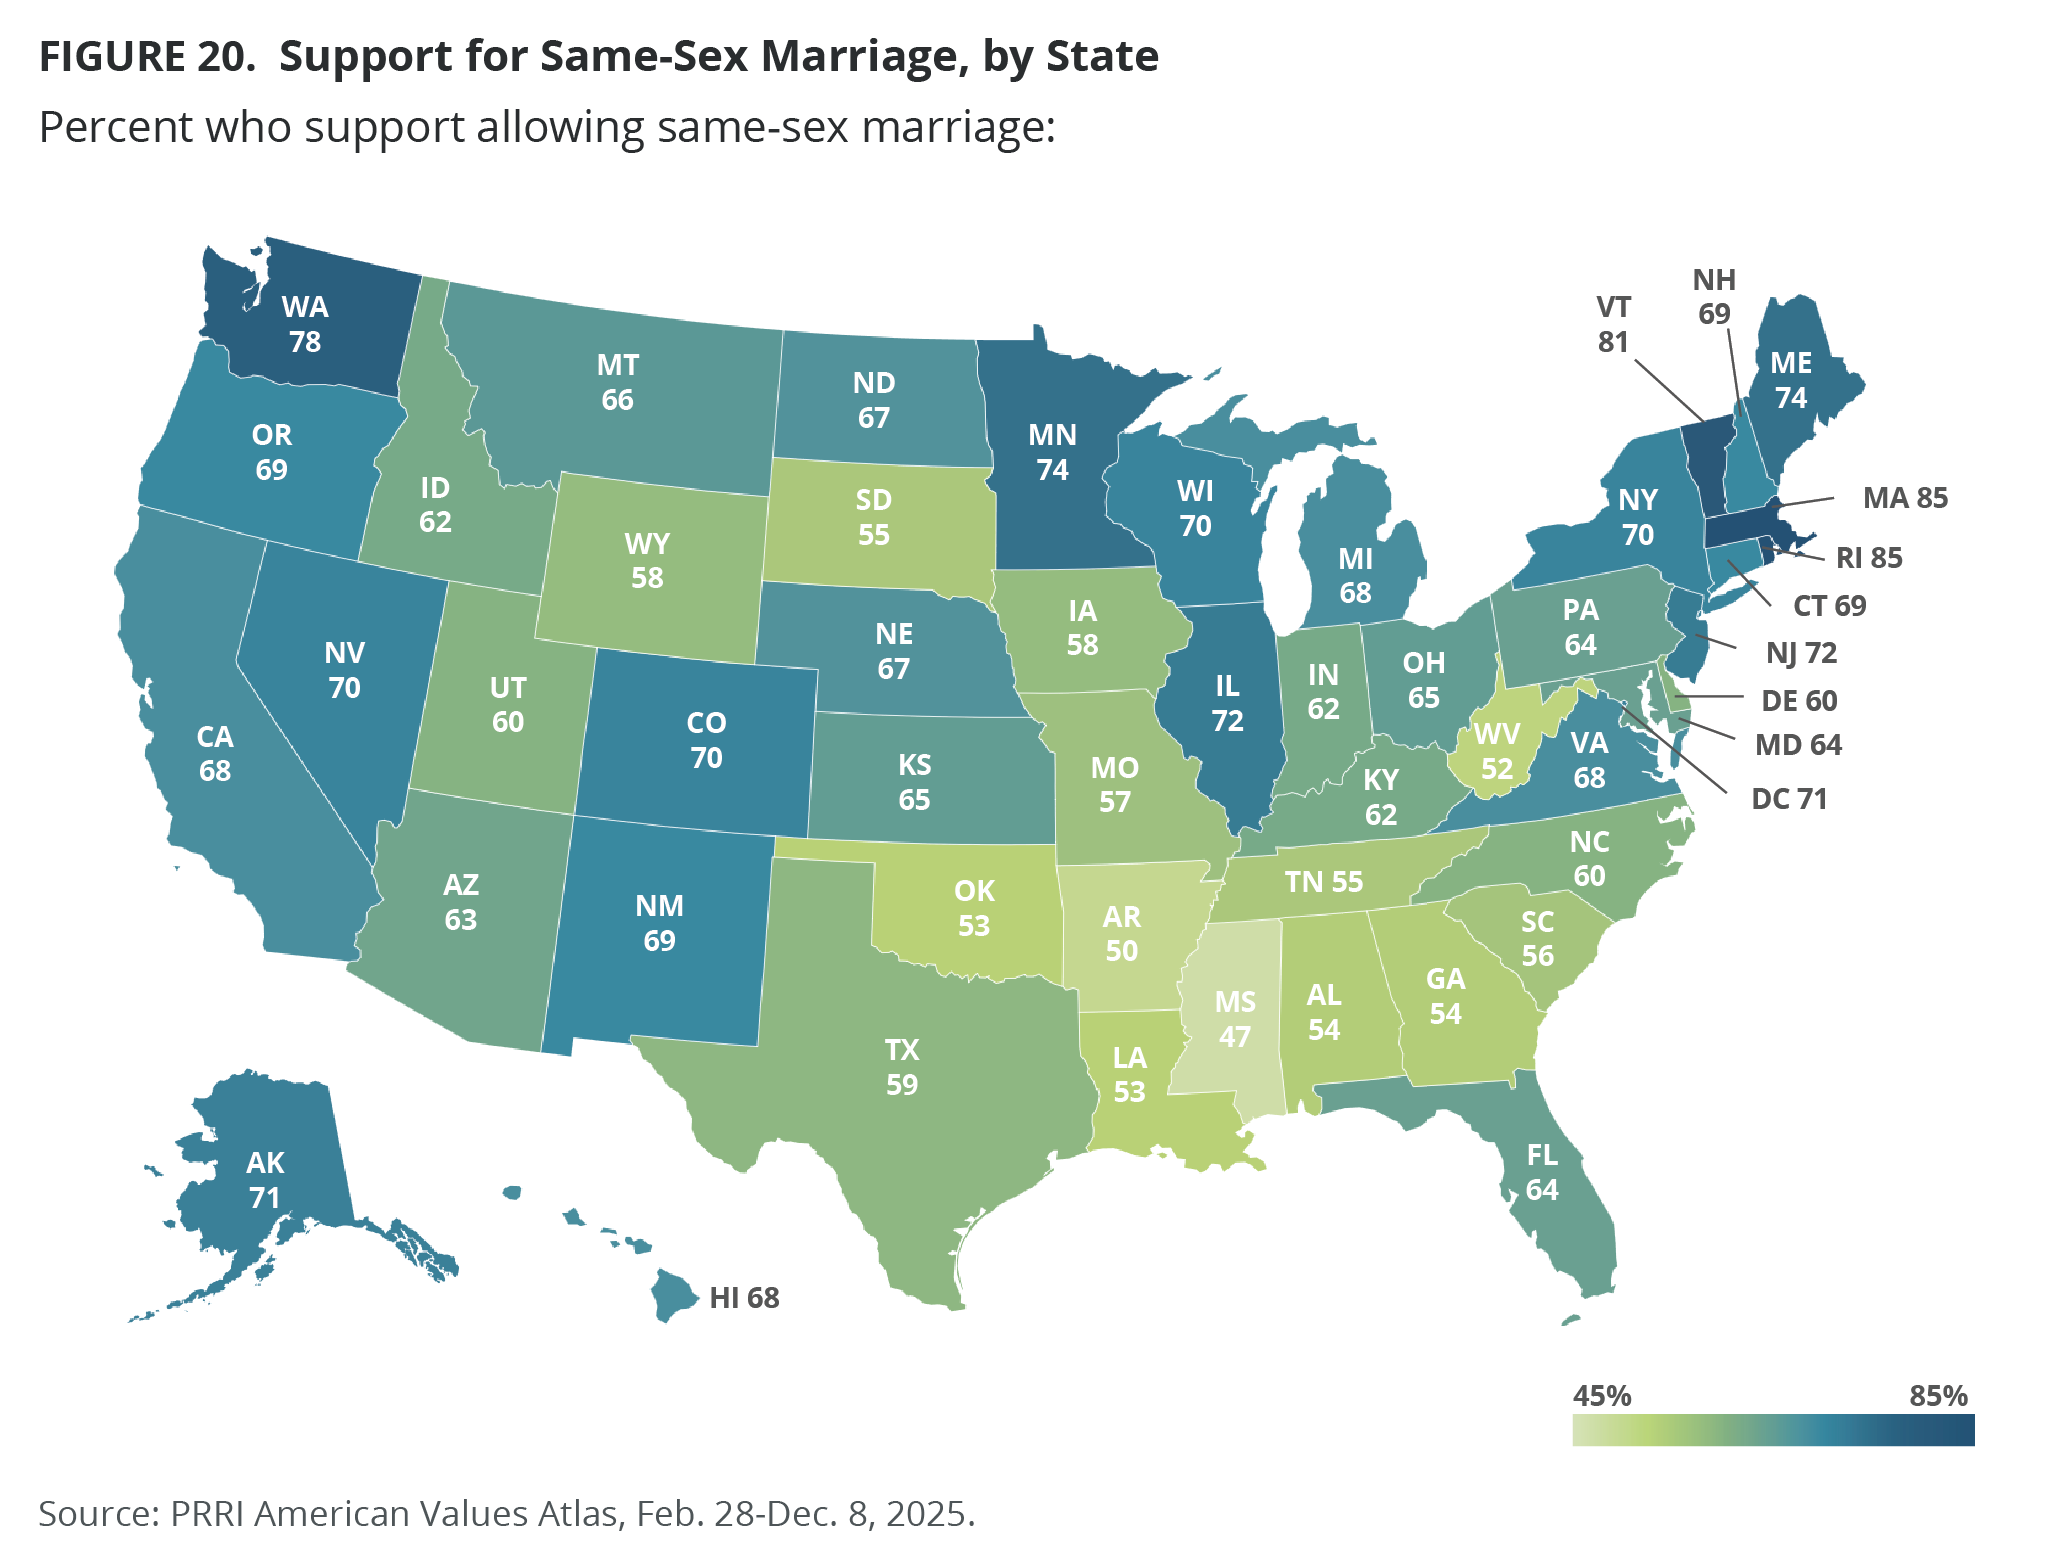
- The only states without majority support for same-sex marriage are Mississippi (47%) and Arkansas (50%). Massachusetts (85%), Rhode Island (85%), and Vermont (81%) show the highest support.
Except for Christian nationalism Adherents, strong majorities of Americans — including most people of faith — support nondiscrimination protections for LGBTQ individuals.
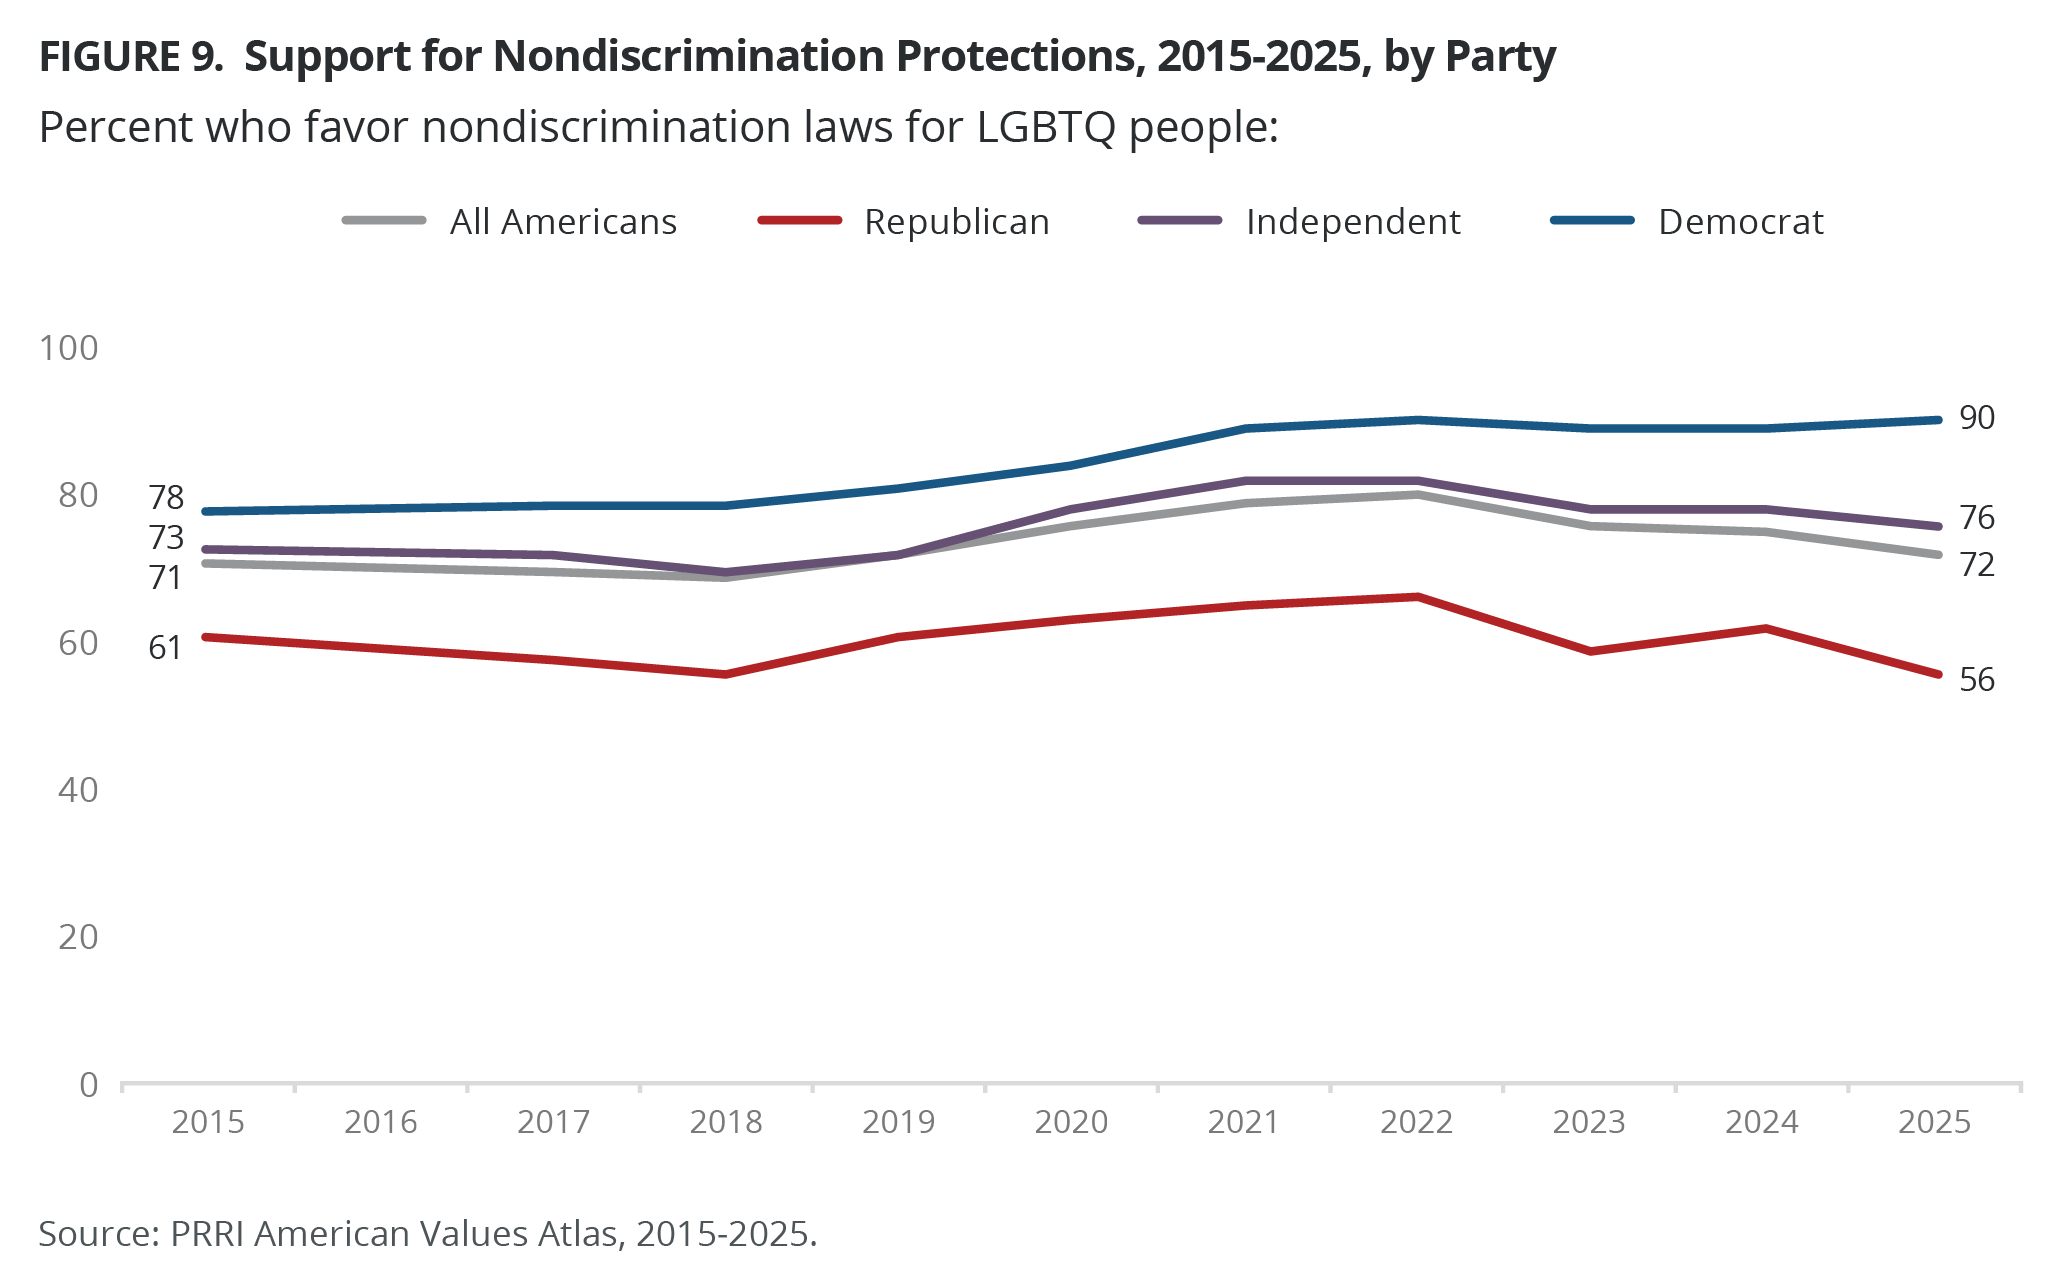
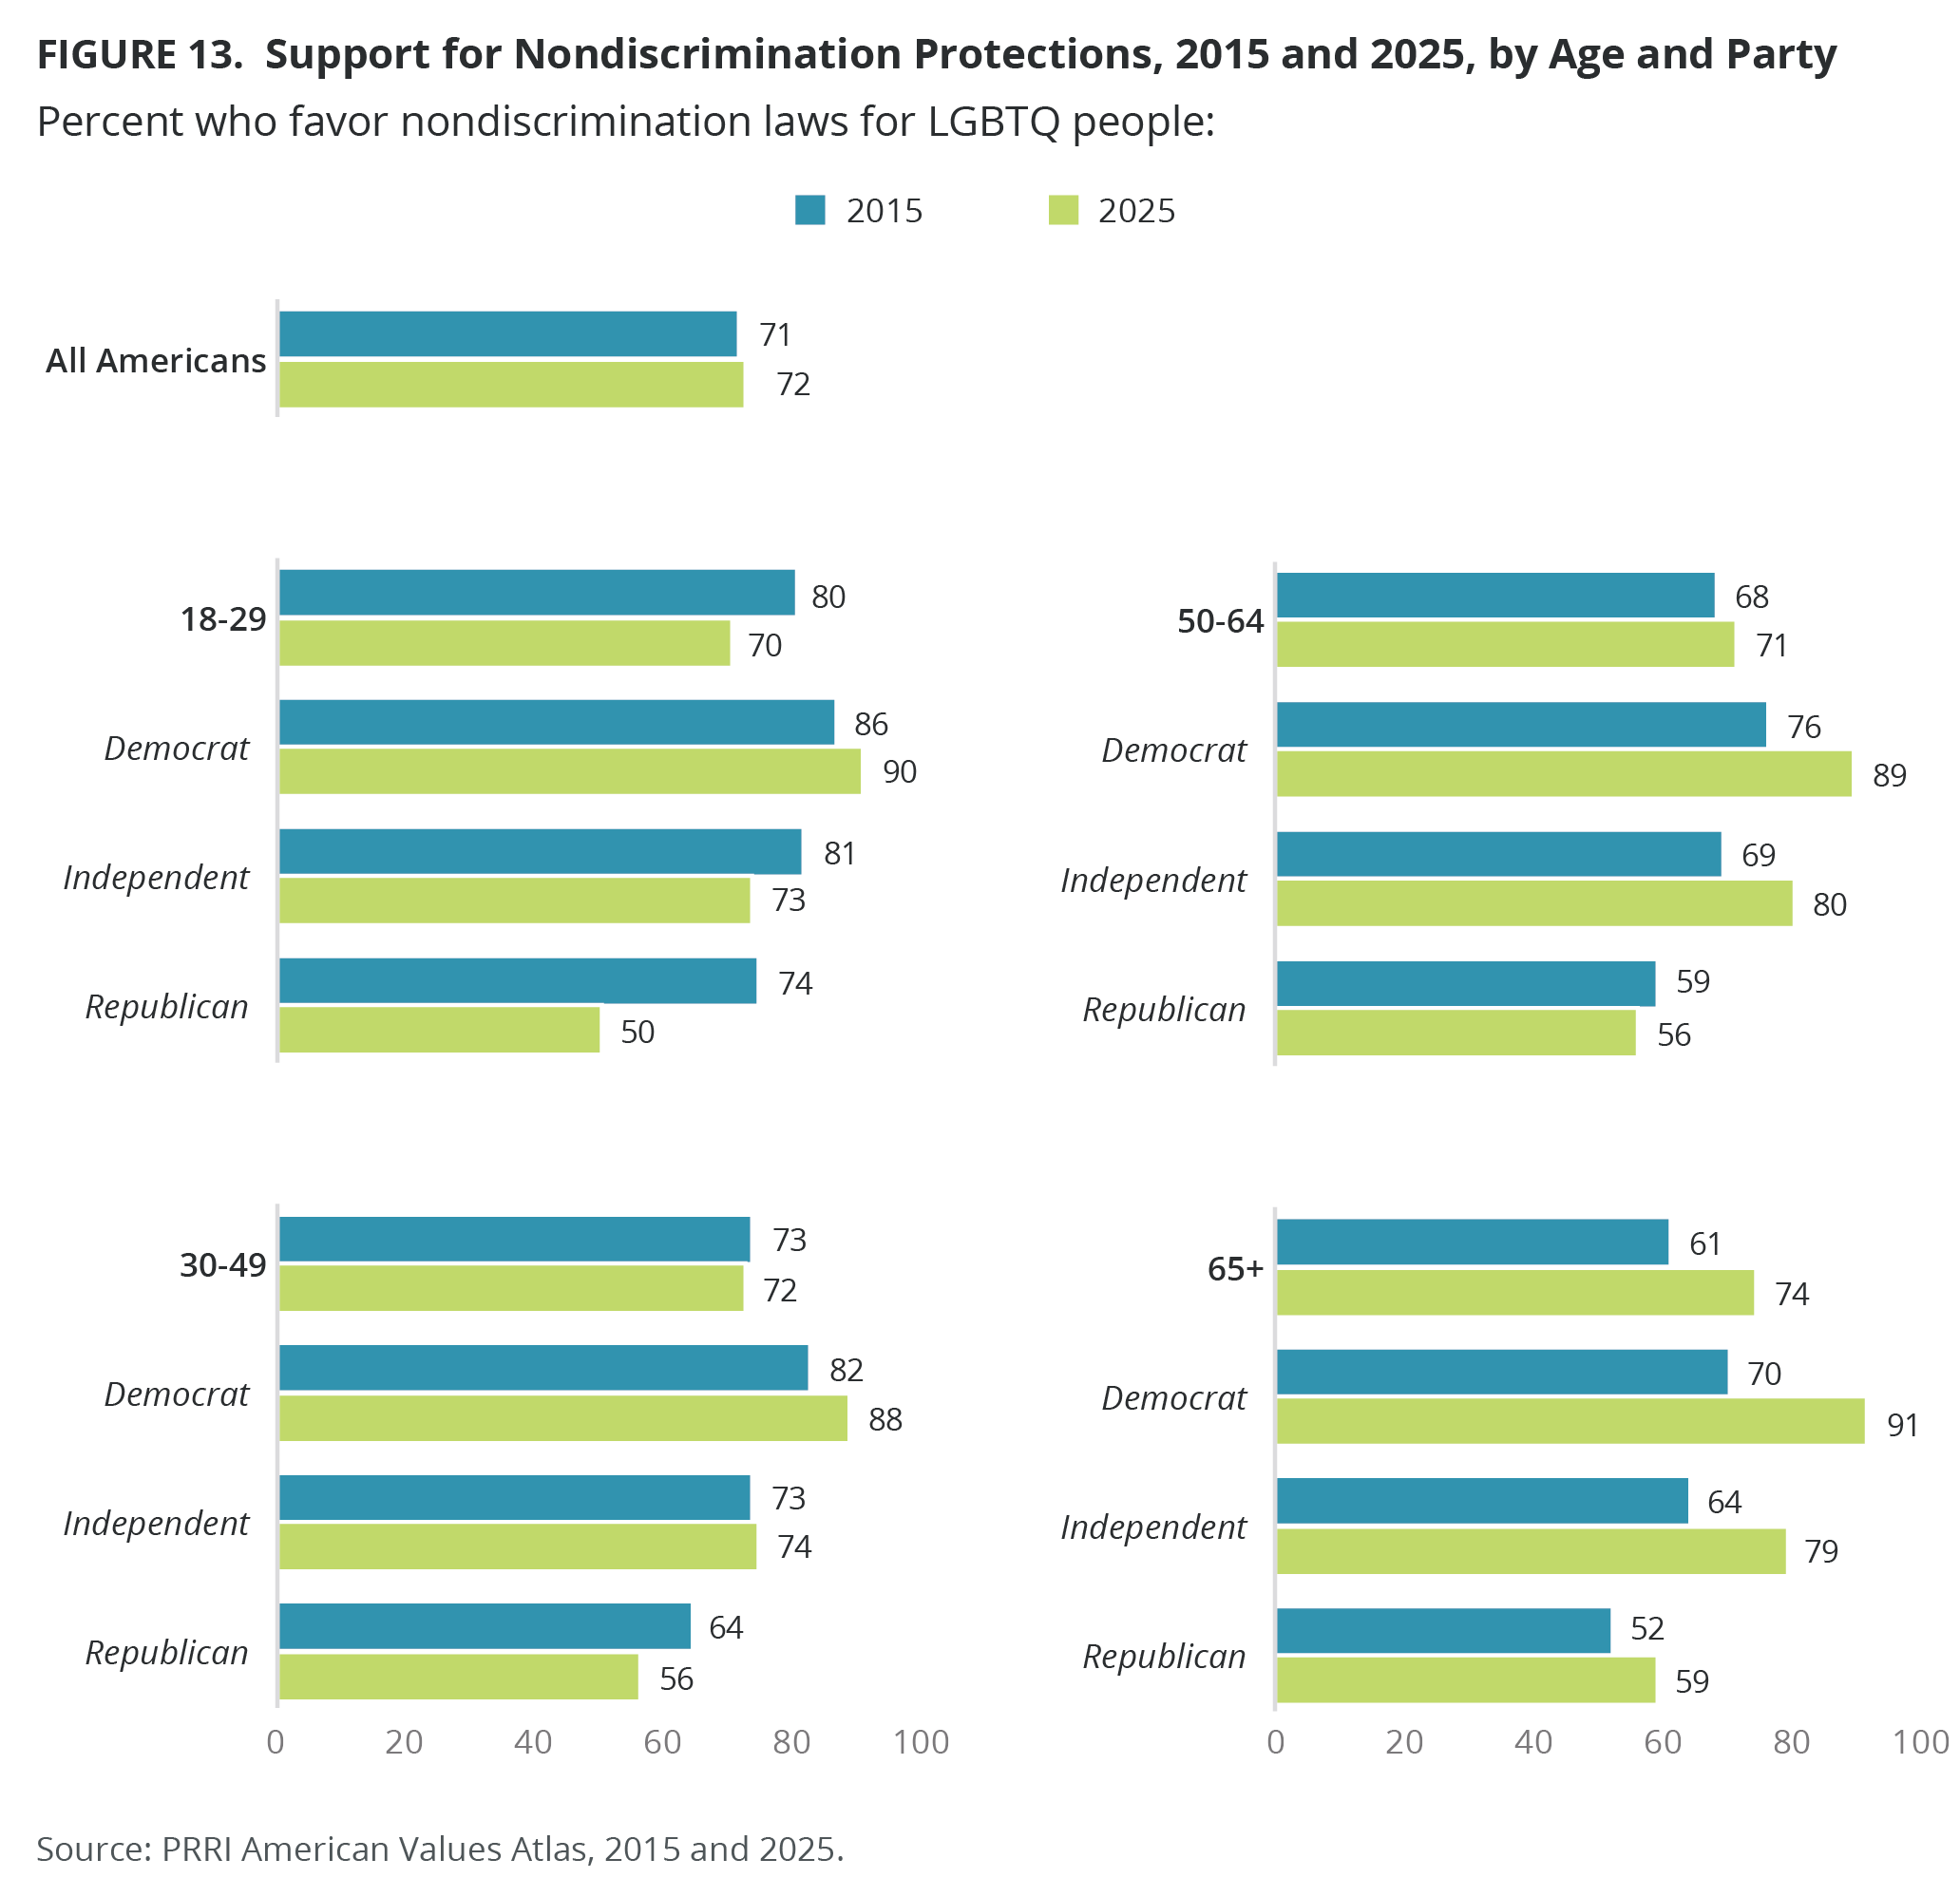
- Most Americans support nondiscrimination protections for LGBTQ people (72%), with Democrats (90%) being the most supportive, followed by independents (76%) and Republicans (56%).
- Majorities of most major religious groups support non-discrimination protections, though support is highest among non-Christians and the religiously unaffiliated.
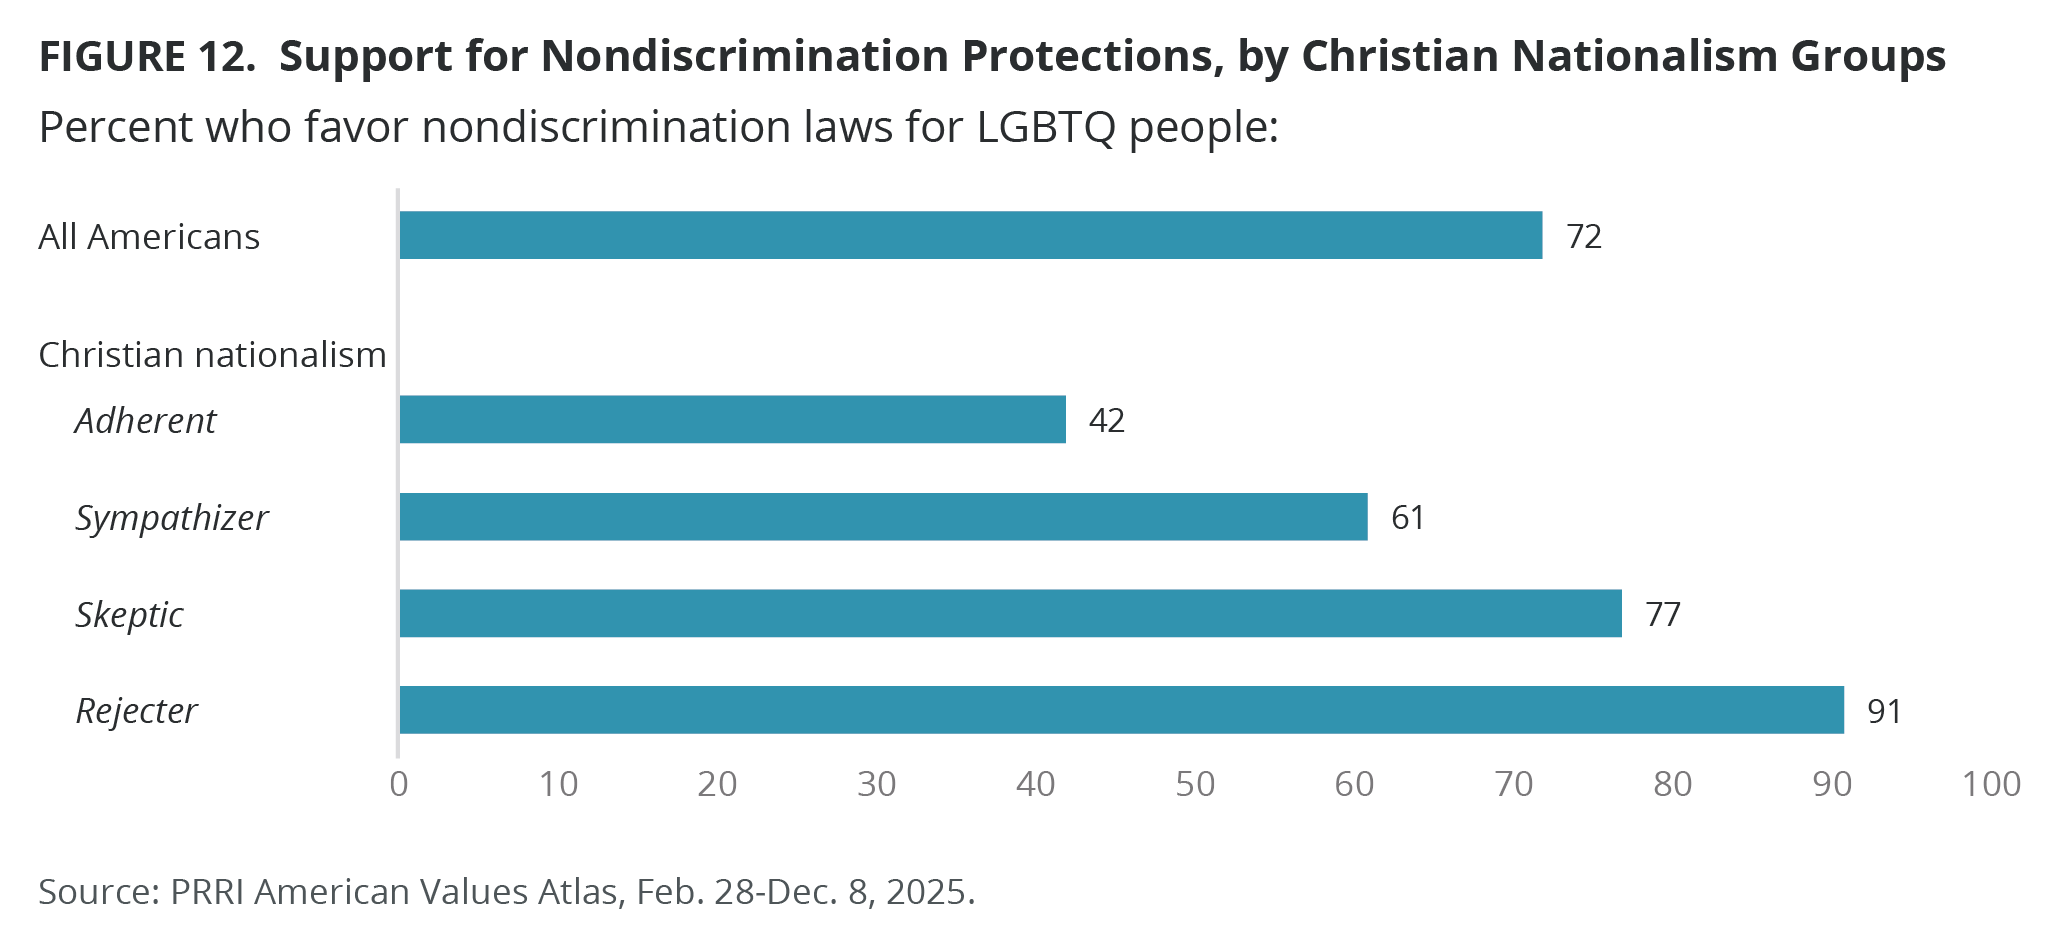
- Christian nationalism Rejecters (91%) are the most likely to support nondiscrimination protections, followed by 77% of Skeptics, 61% of Sympathizers, and 42% of Adherents.
- Over the past decade, Americans ages 18-29 have shown a gradual decrease in support for LGBTQ nondiscrimination laws, from 80% in 2015 to 70% in 2025, largely driven by young Republicans, while seniors 65 and over have increased their support from 61% to 74% over the same period.
Except for Republicans, Christian nationalism Adherents, and Sympathizers, most Americans continue to oppose religiously based service refusals for LGBTQ people.
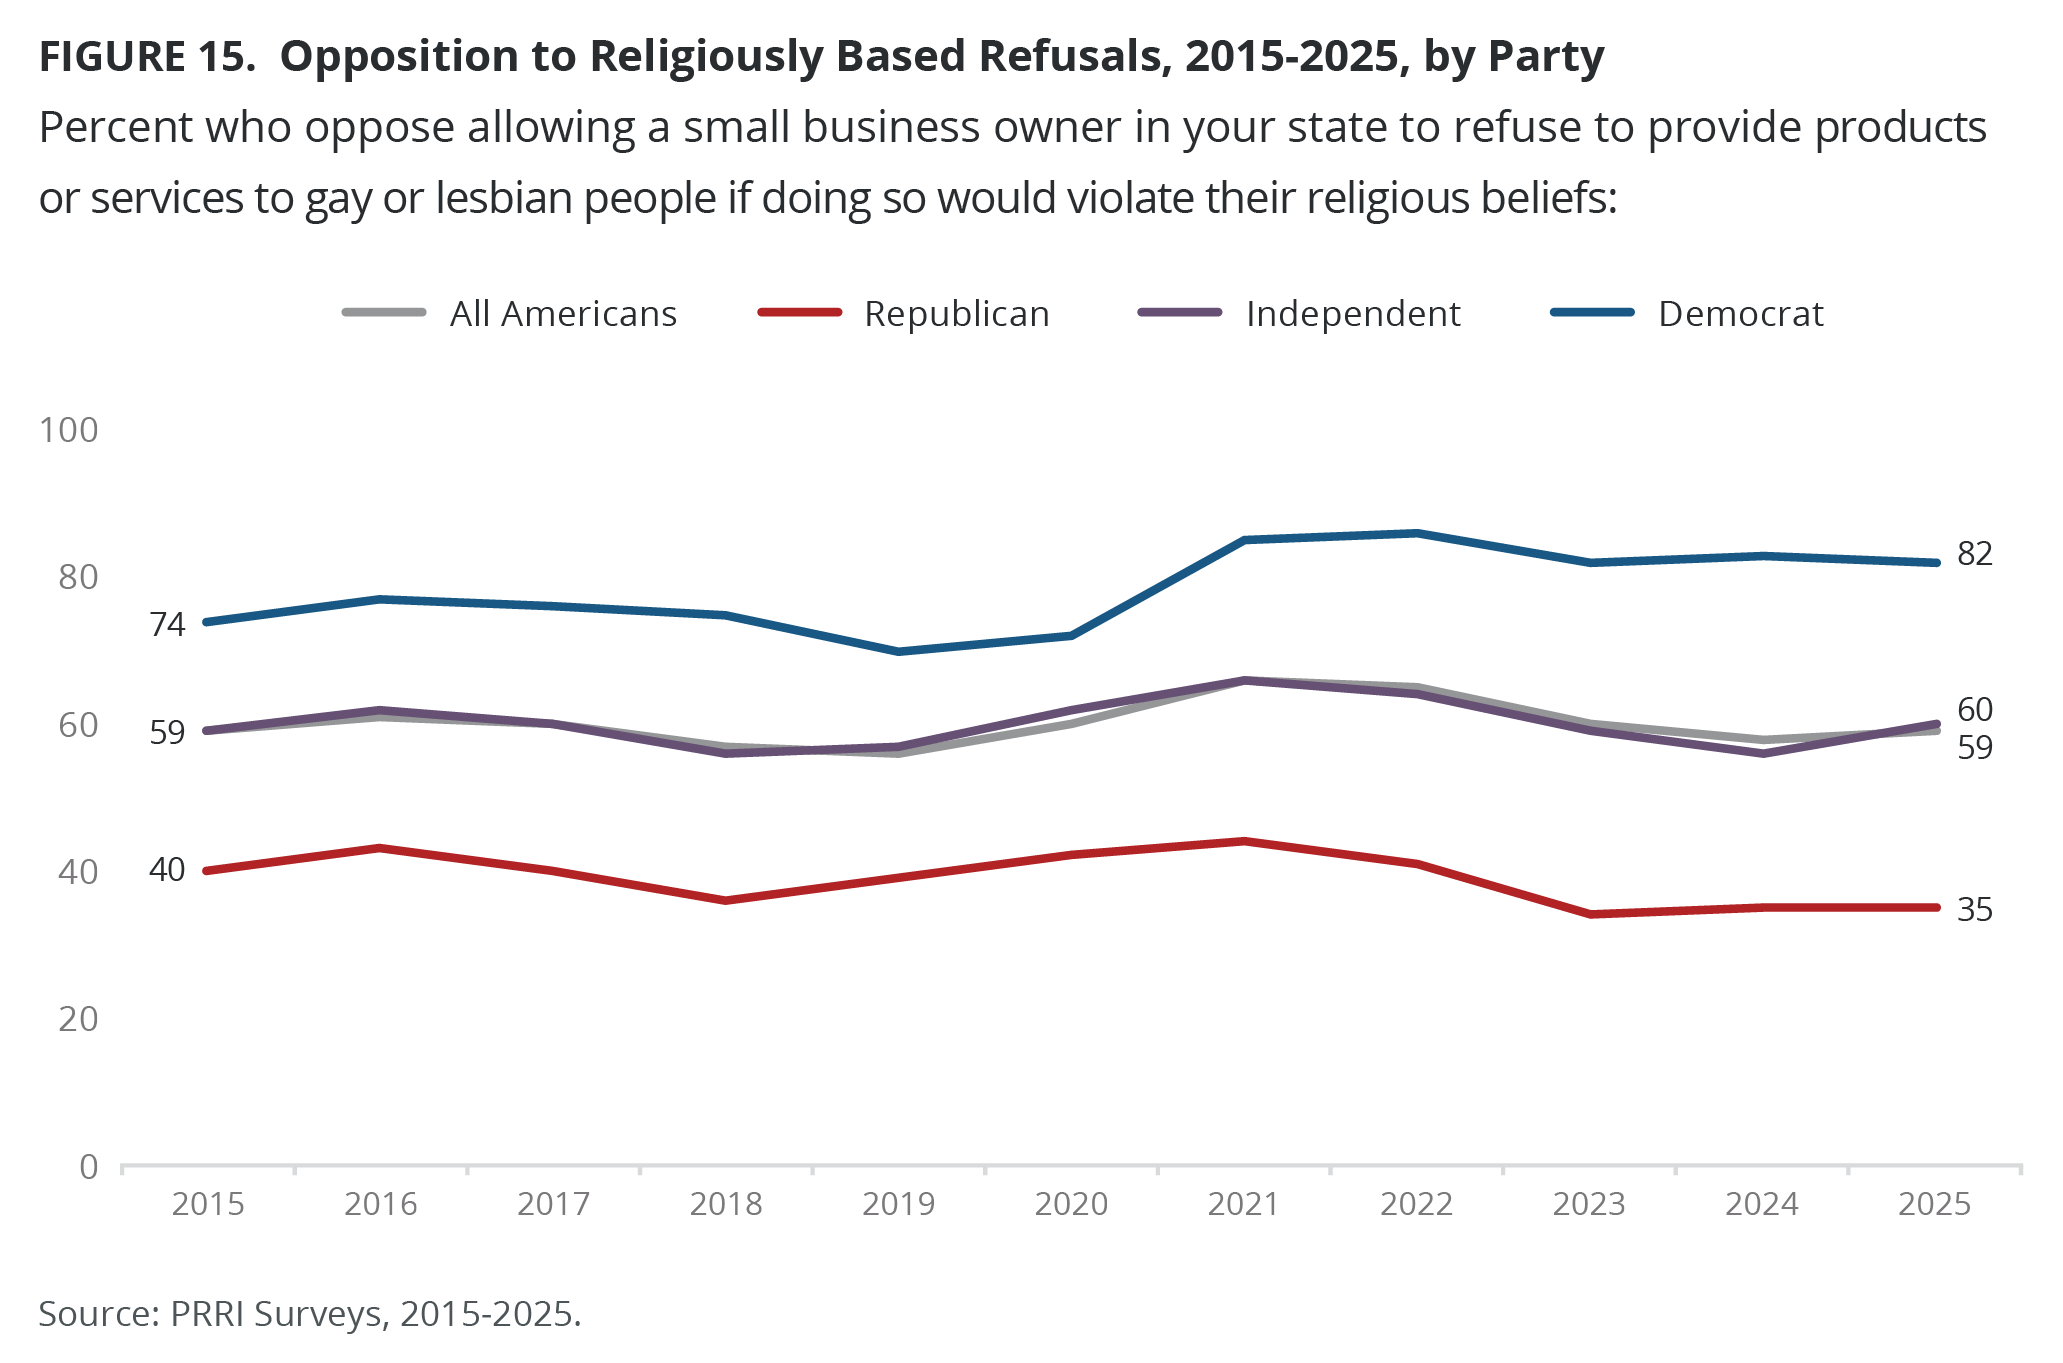
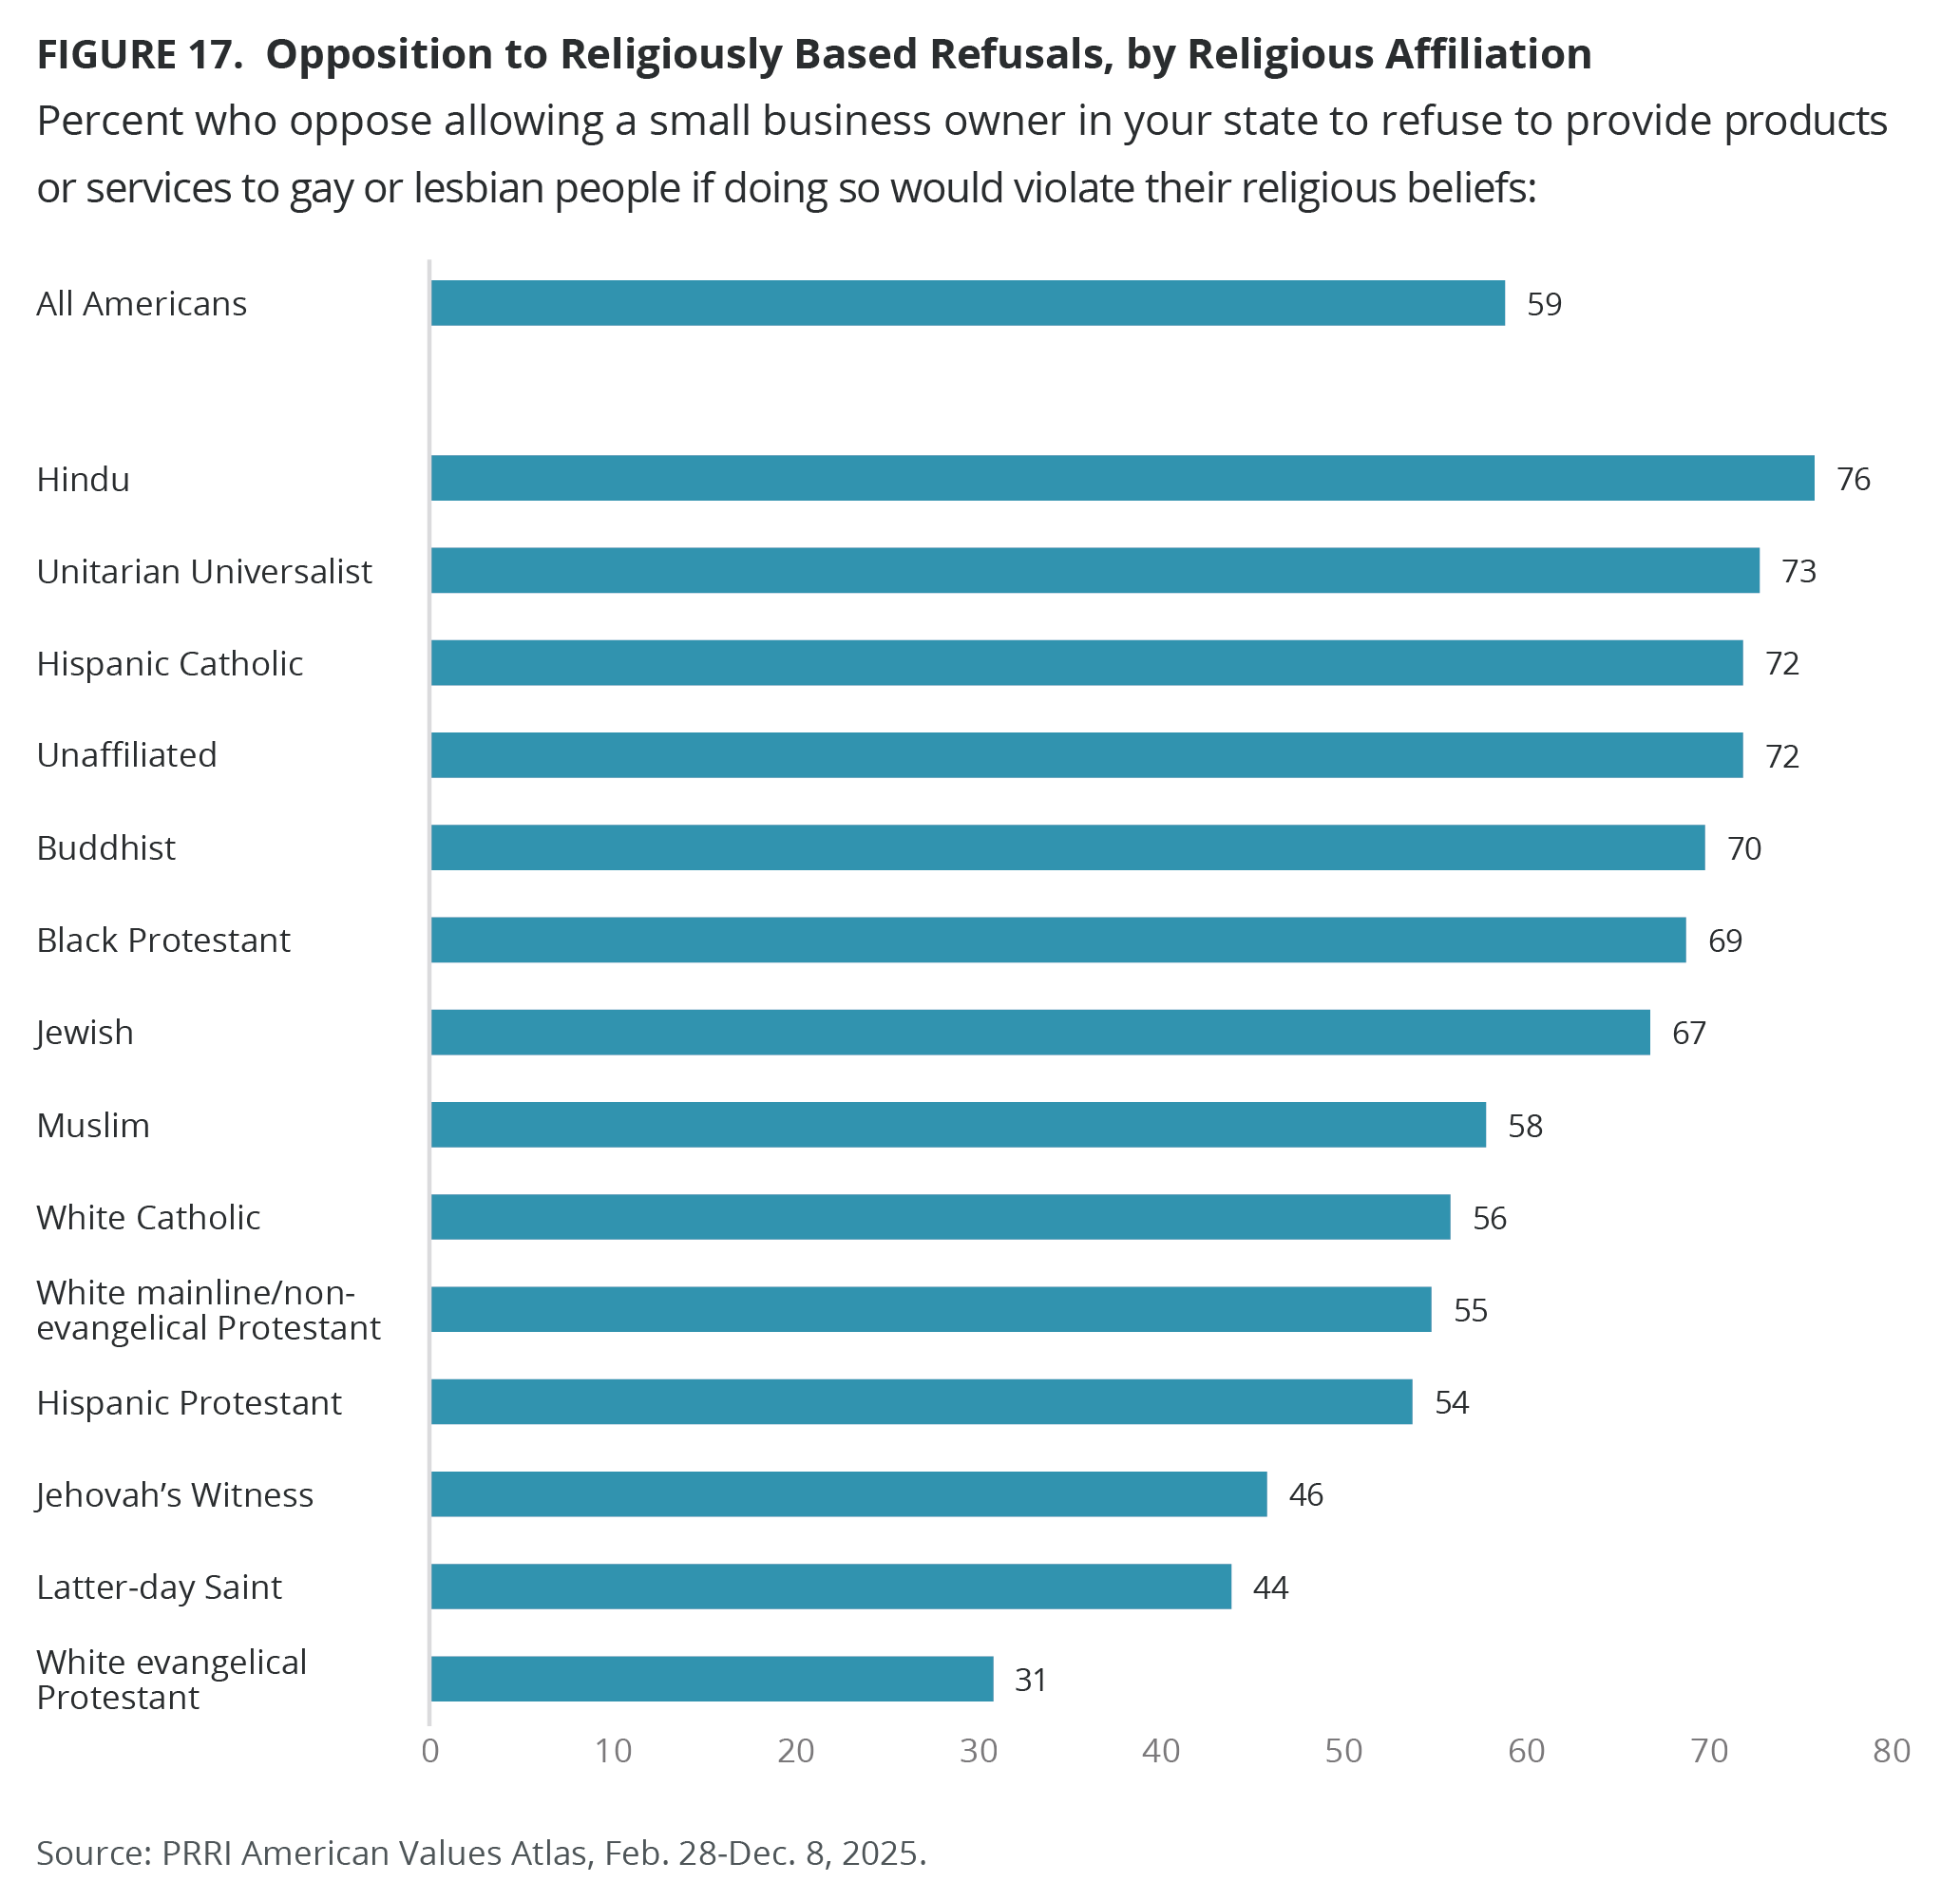
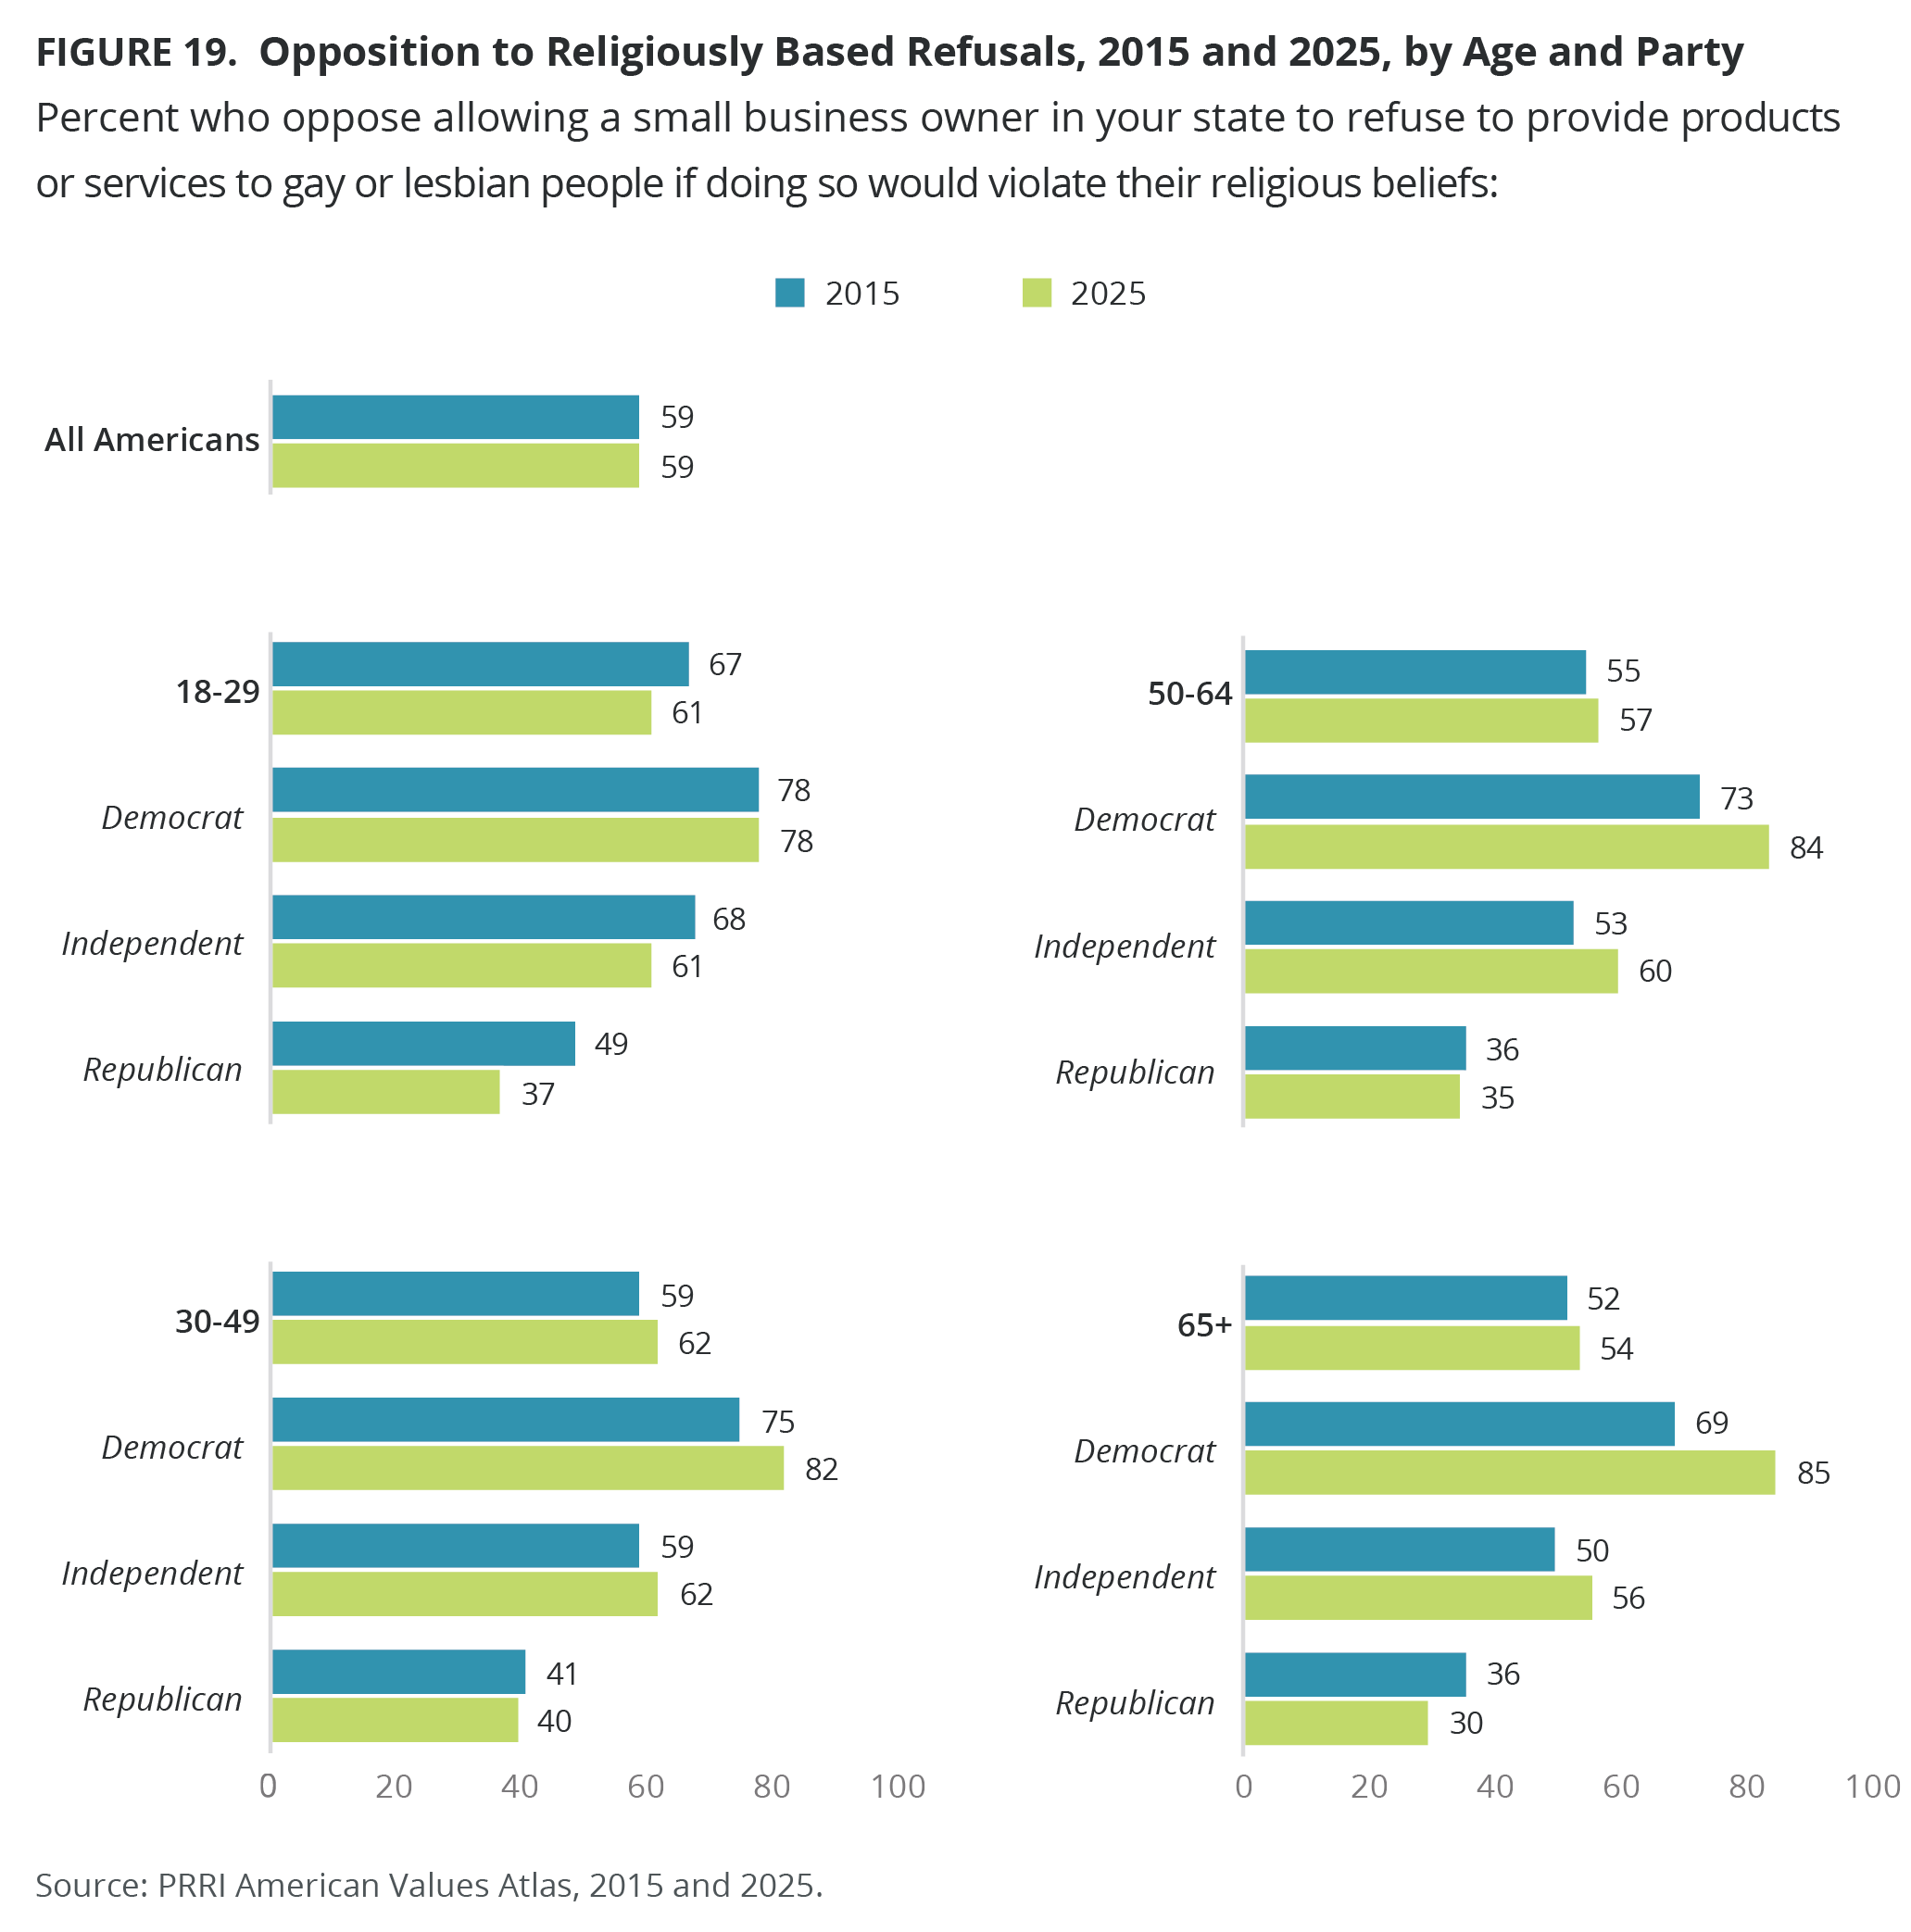
- Most Americans oppose allowing small businesses to refuse service to LGBTQ people on religious grounds (59%), with Democrats (82%) more likely to oppose, compared with independents (60%) and Republicans (35%).
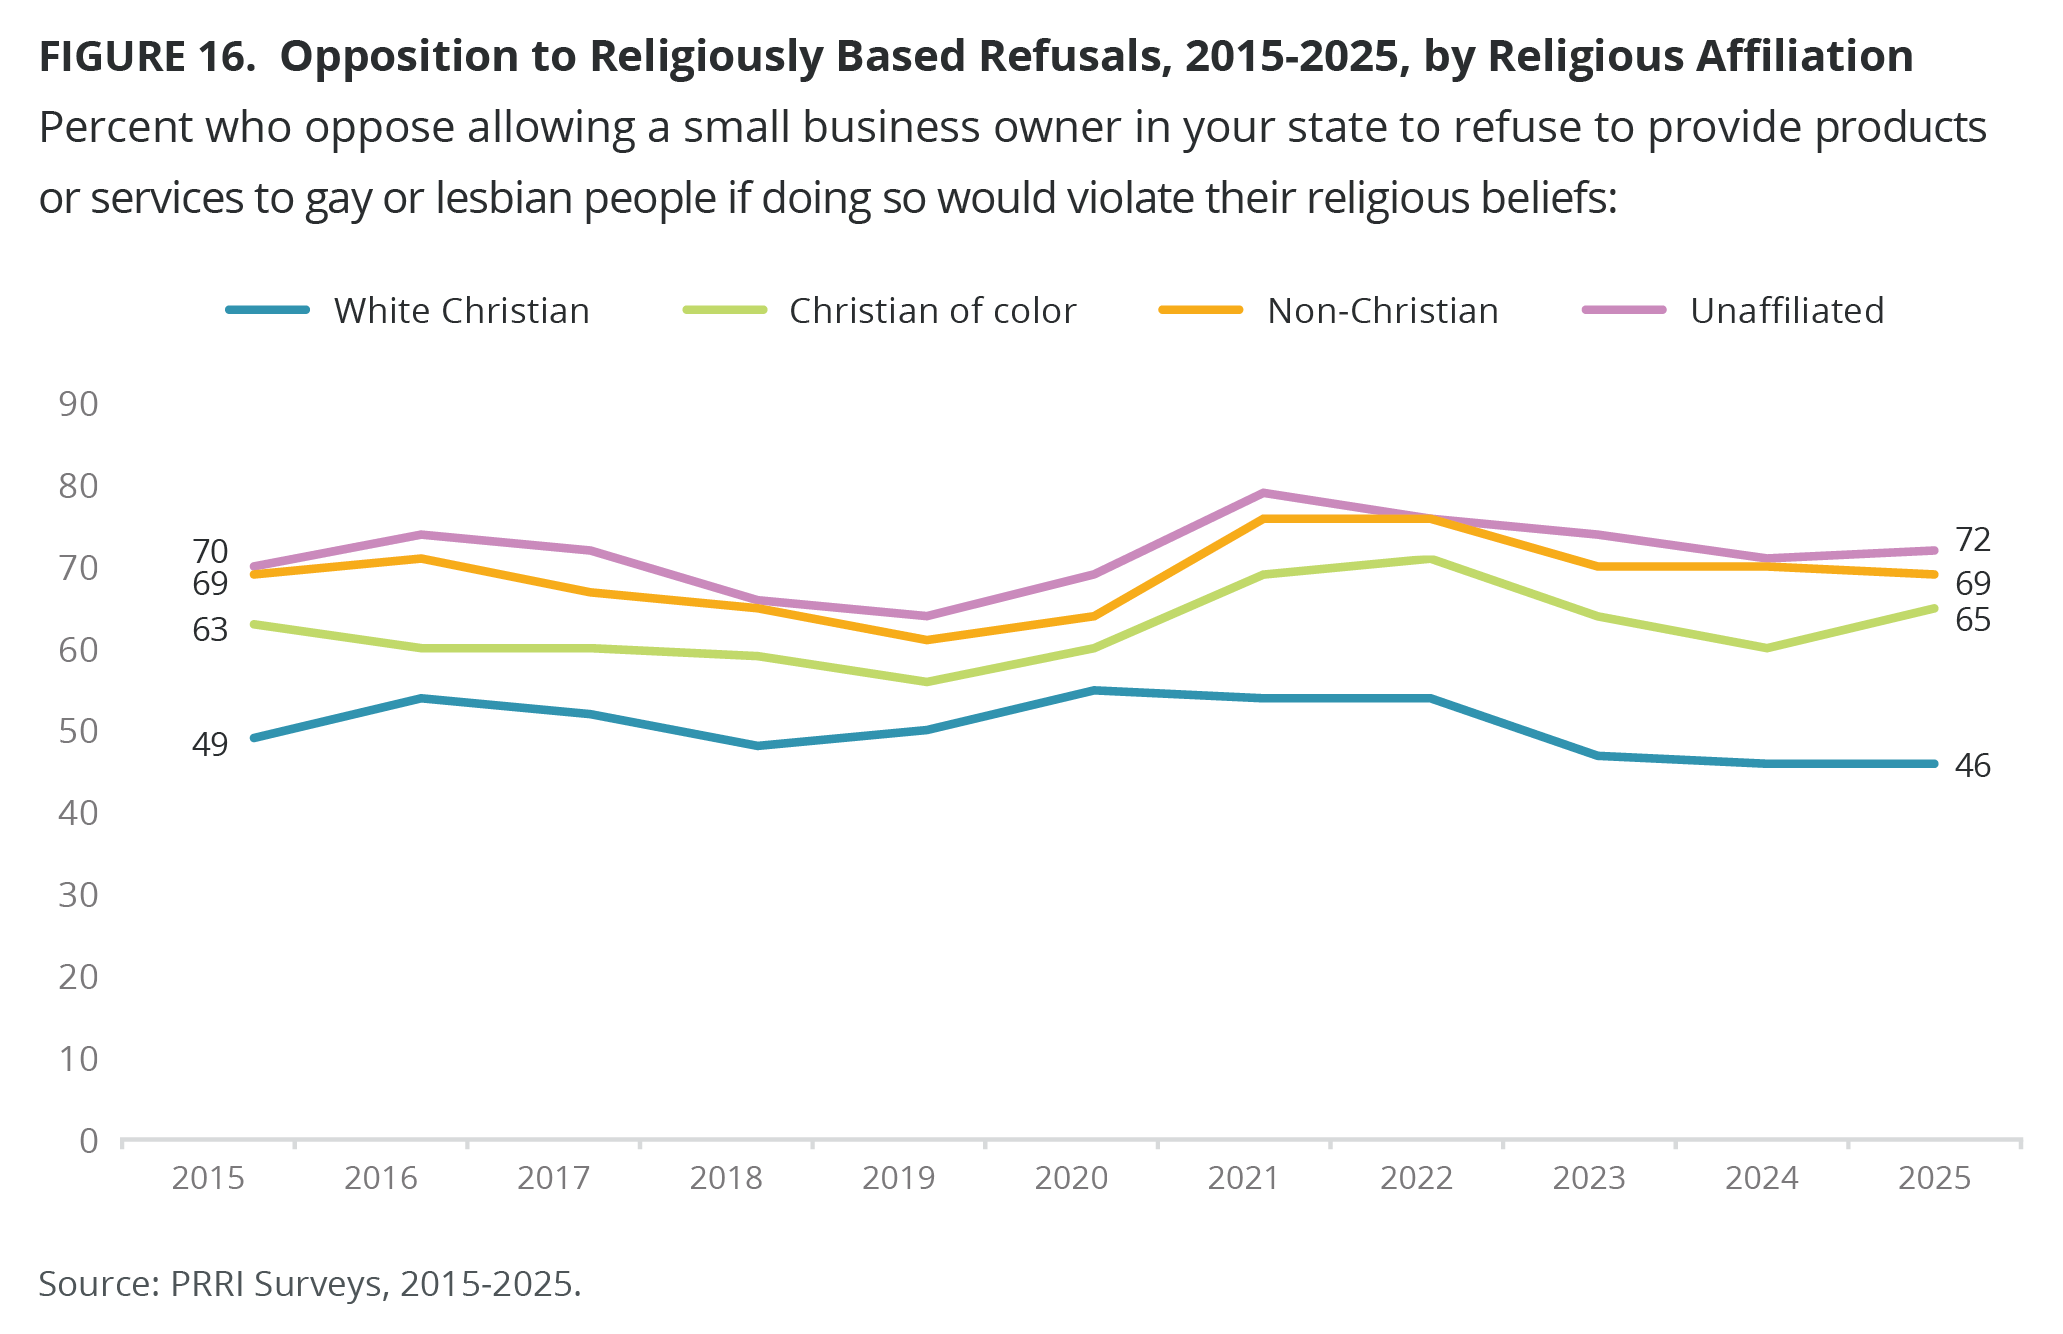
- Opposition among white Christians grew from 49% in 2015 to 55% in 2020, but has declined since to 46%. Opposition among Christians of color, non-Christians, and religiously unaffiliated Americans remains high.
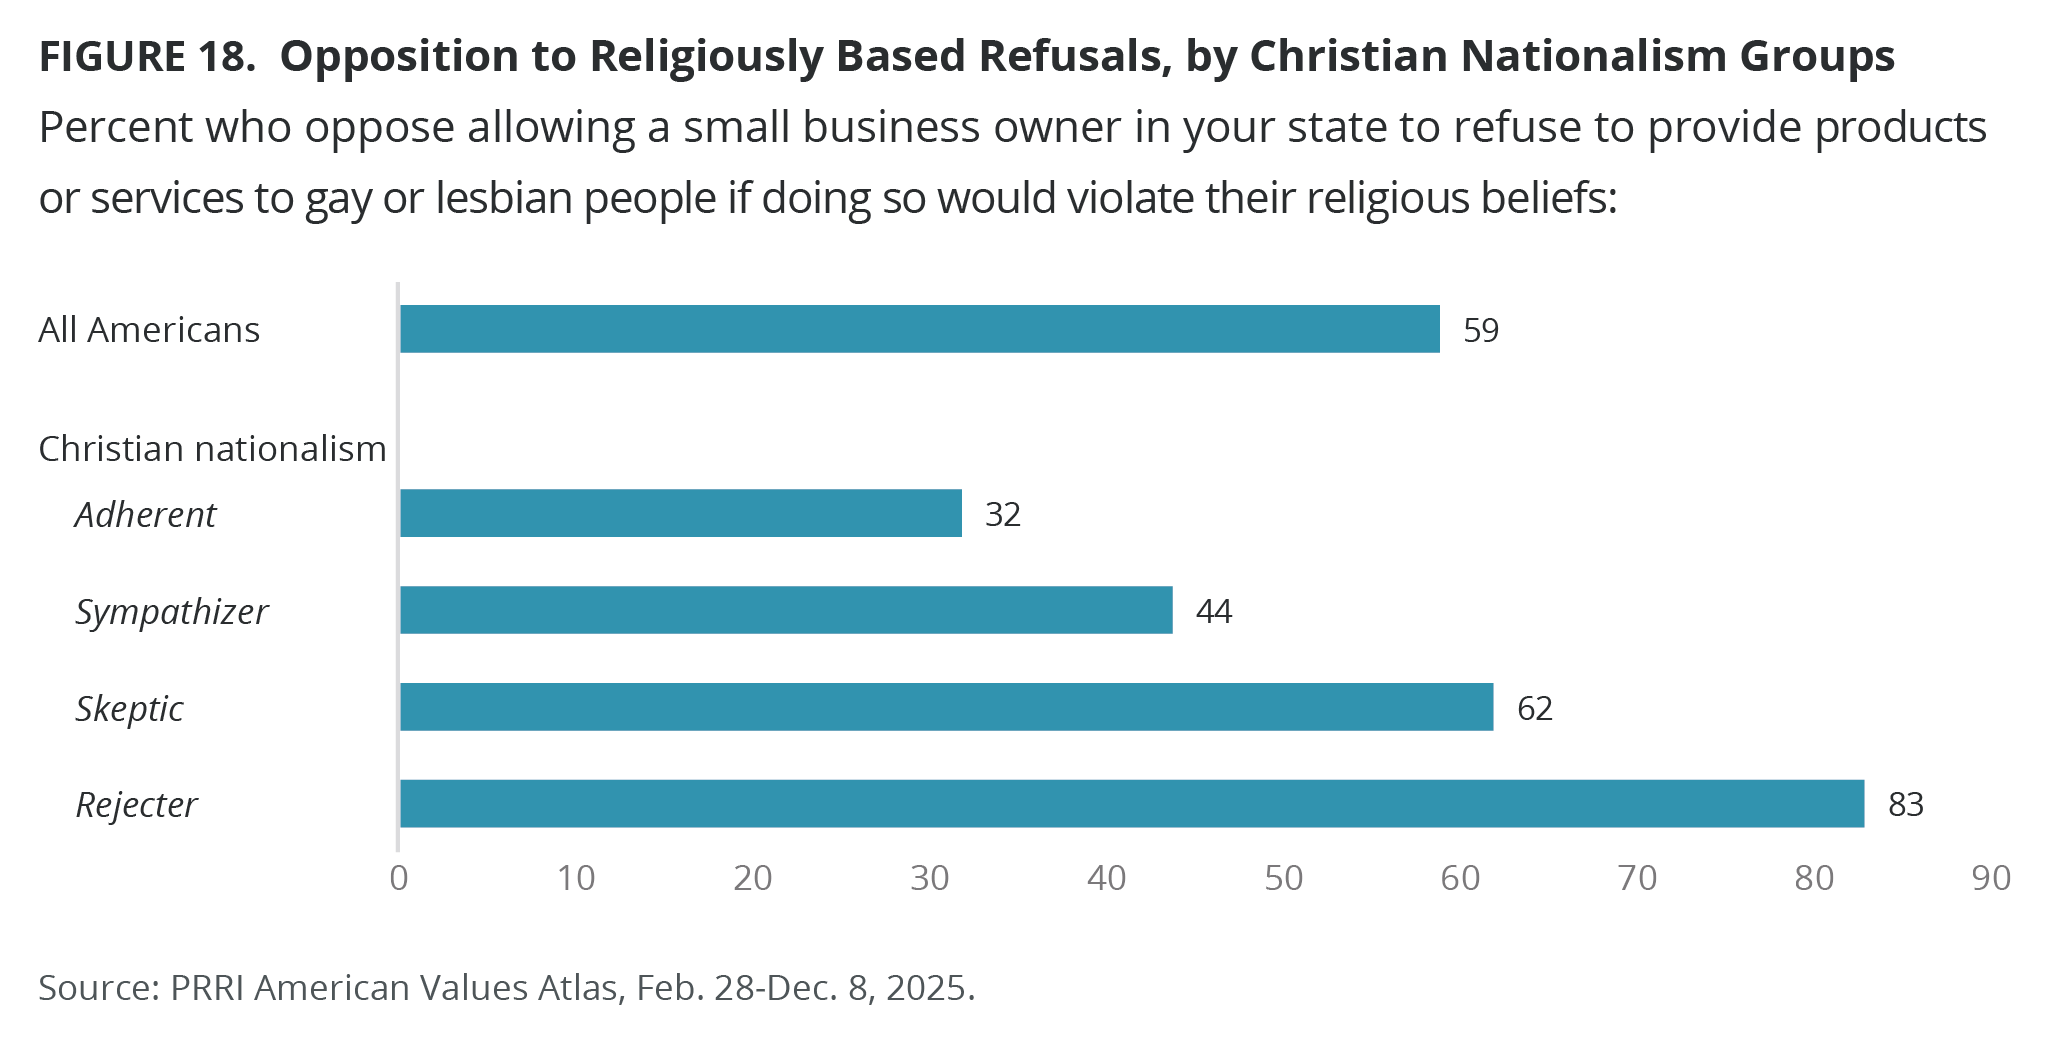
- Christian nationalism Rejecters (83%) are the most likely to oppose religiously based refusals for LGBTQ people, followed by 62% of Skeptics, 44% of Sympathizers, and 32% of Adherents.
Support for same-sex marriage remains high for most Americans, but partisanship, religious affiliation, and Christian nationalist views are linked to differing opinions.
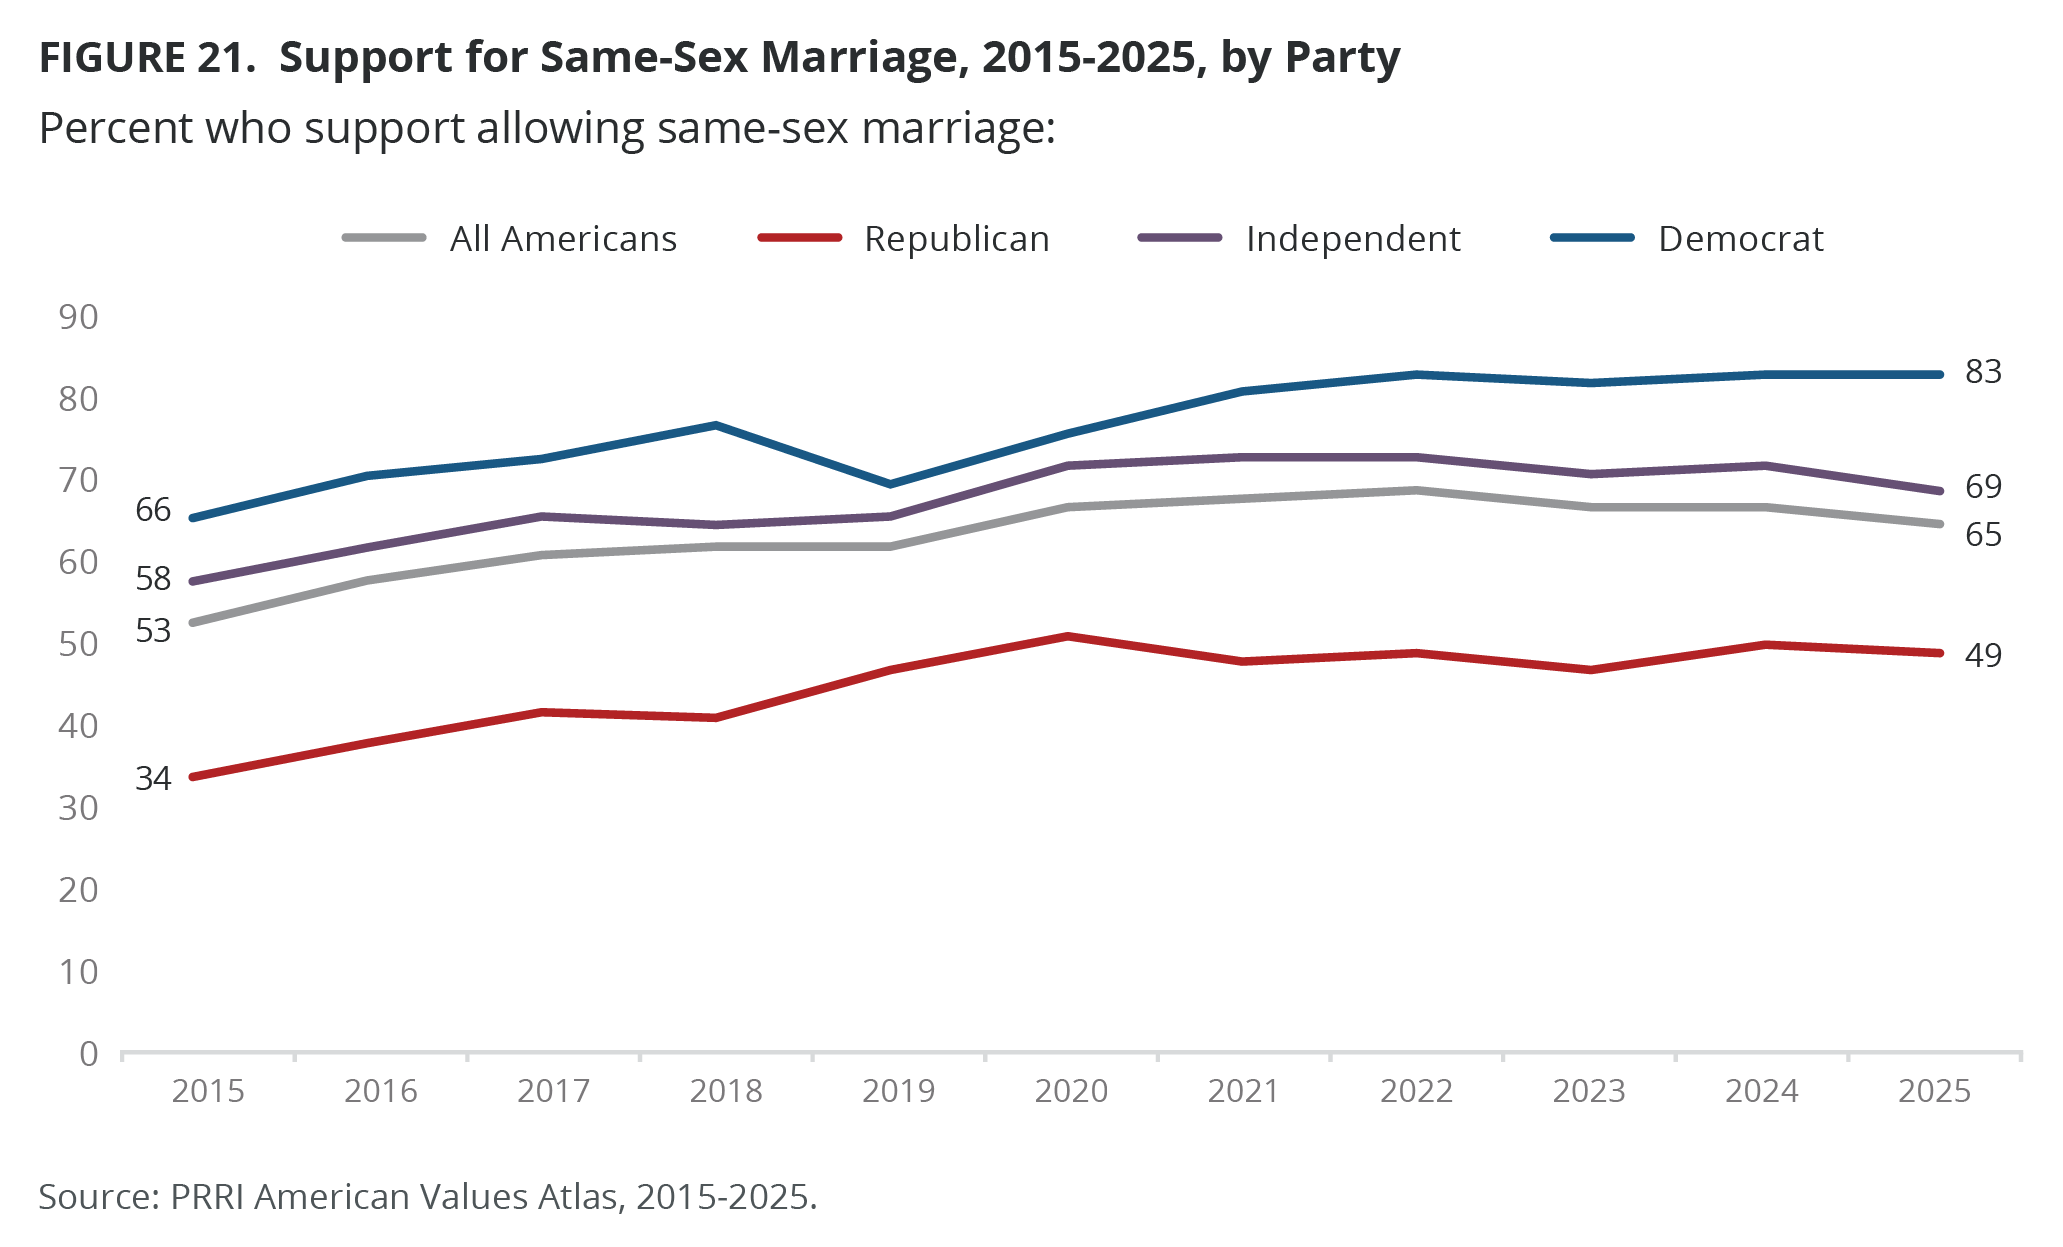
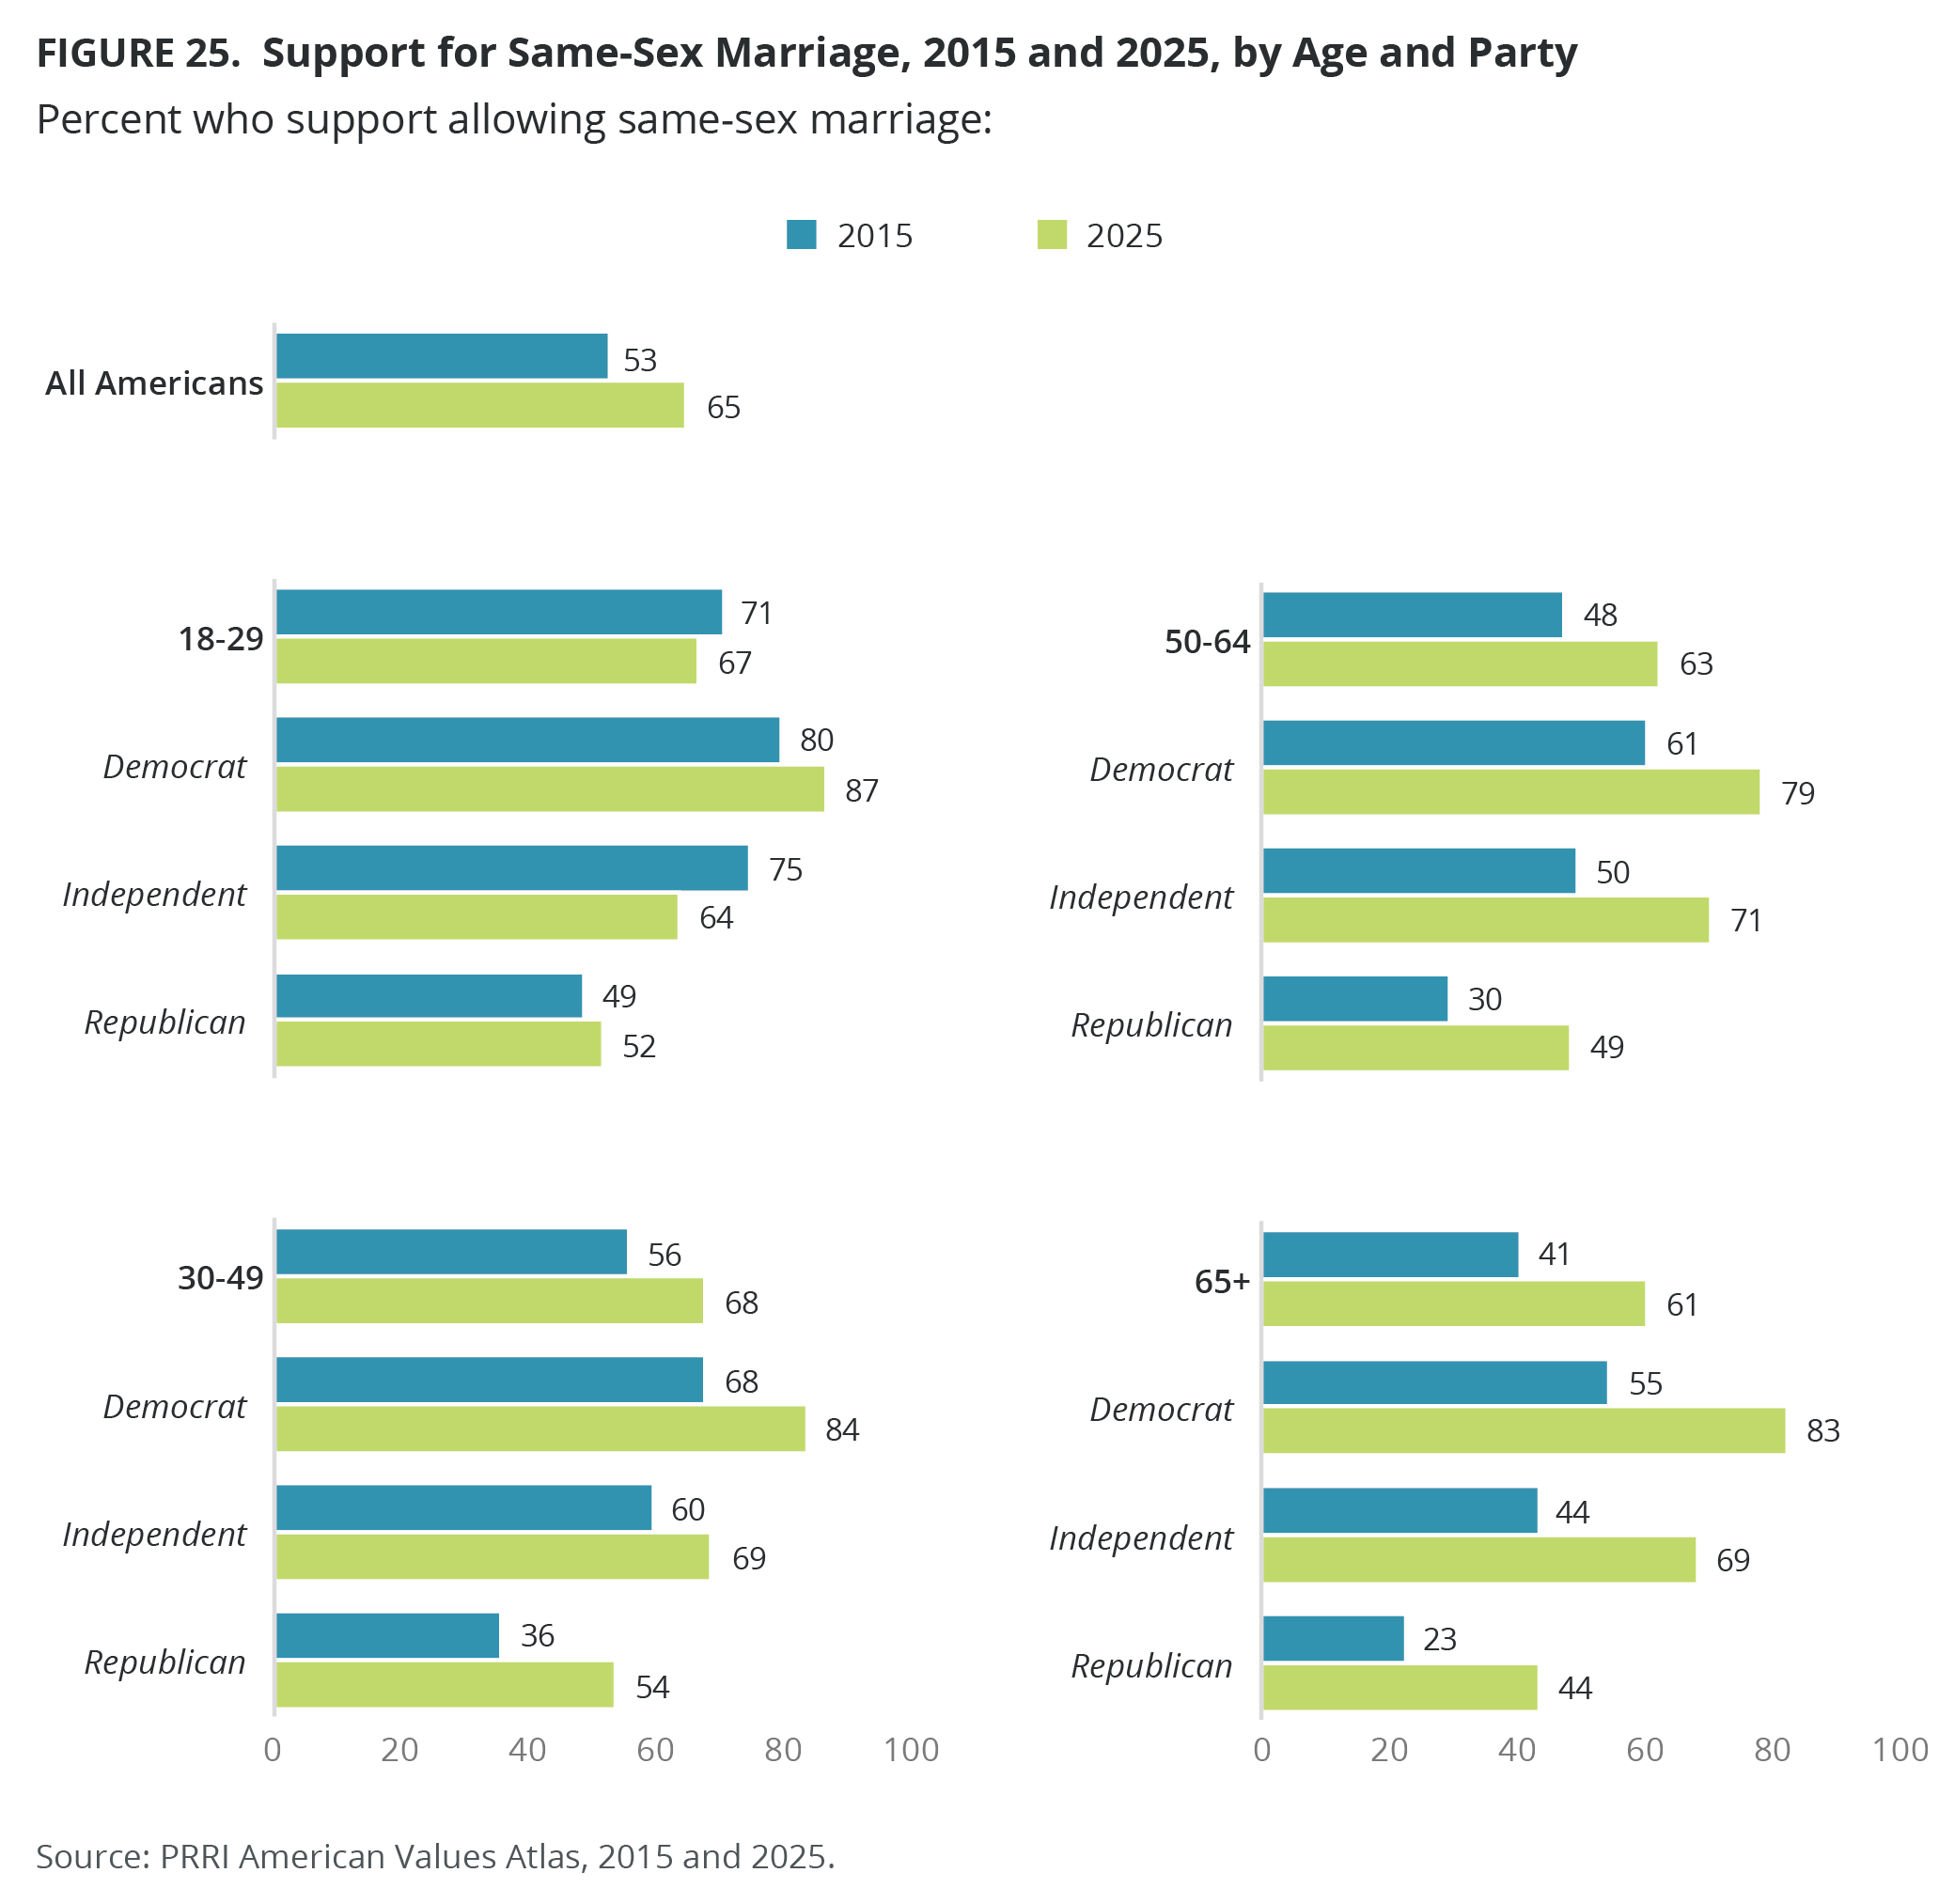
- Support for same-sex marriage remains higher today (65%) than in 2015 (53%). Today, Republicans (49%) are notably less likely than Democrats (83%) and independents (69%) to support same-sex marriage.
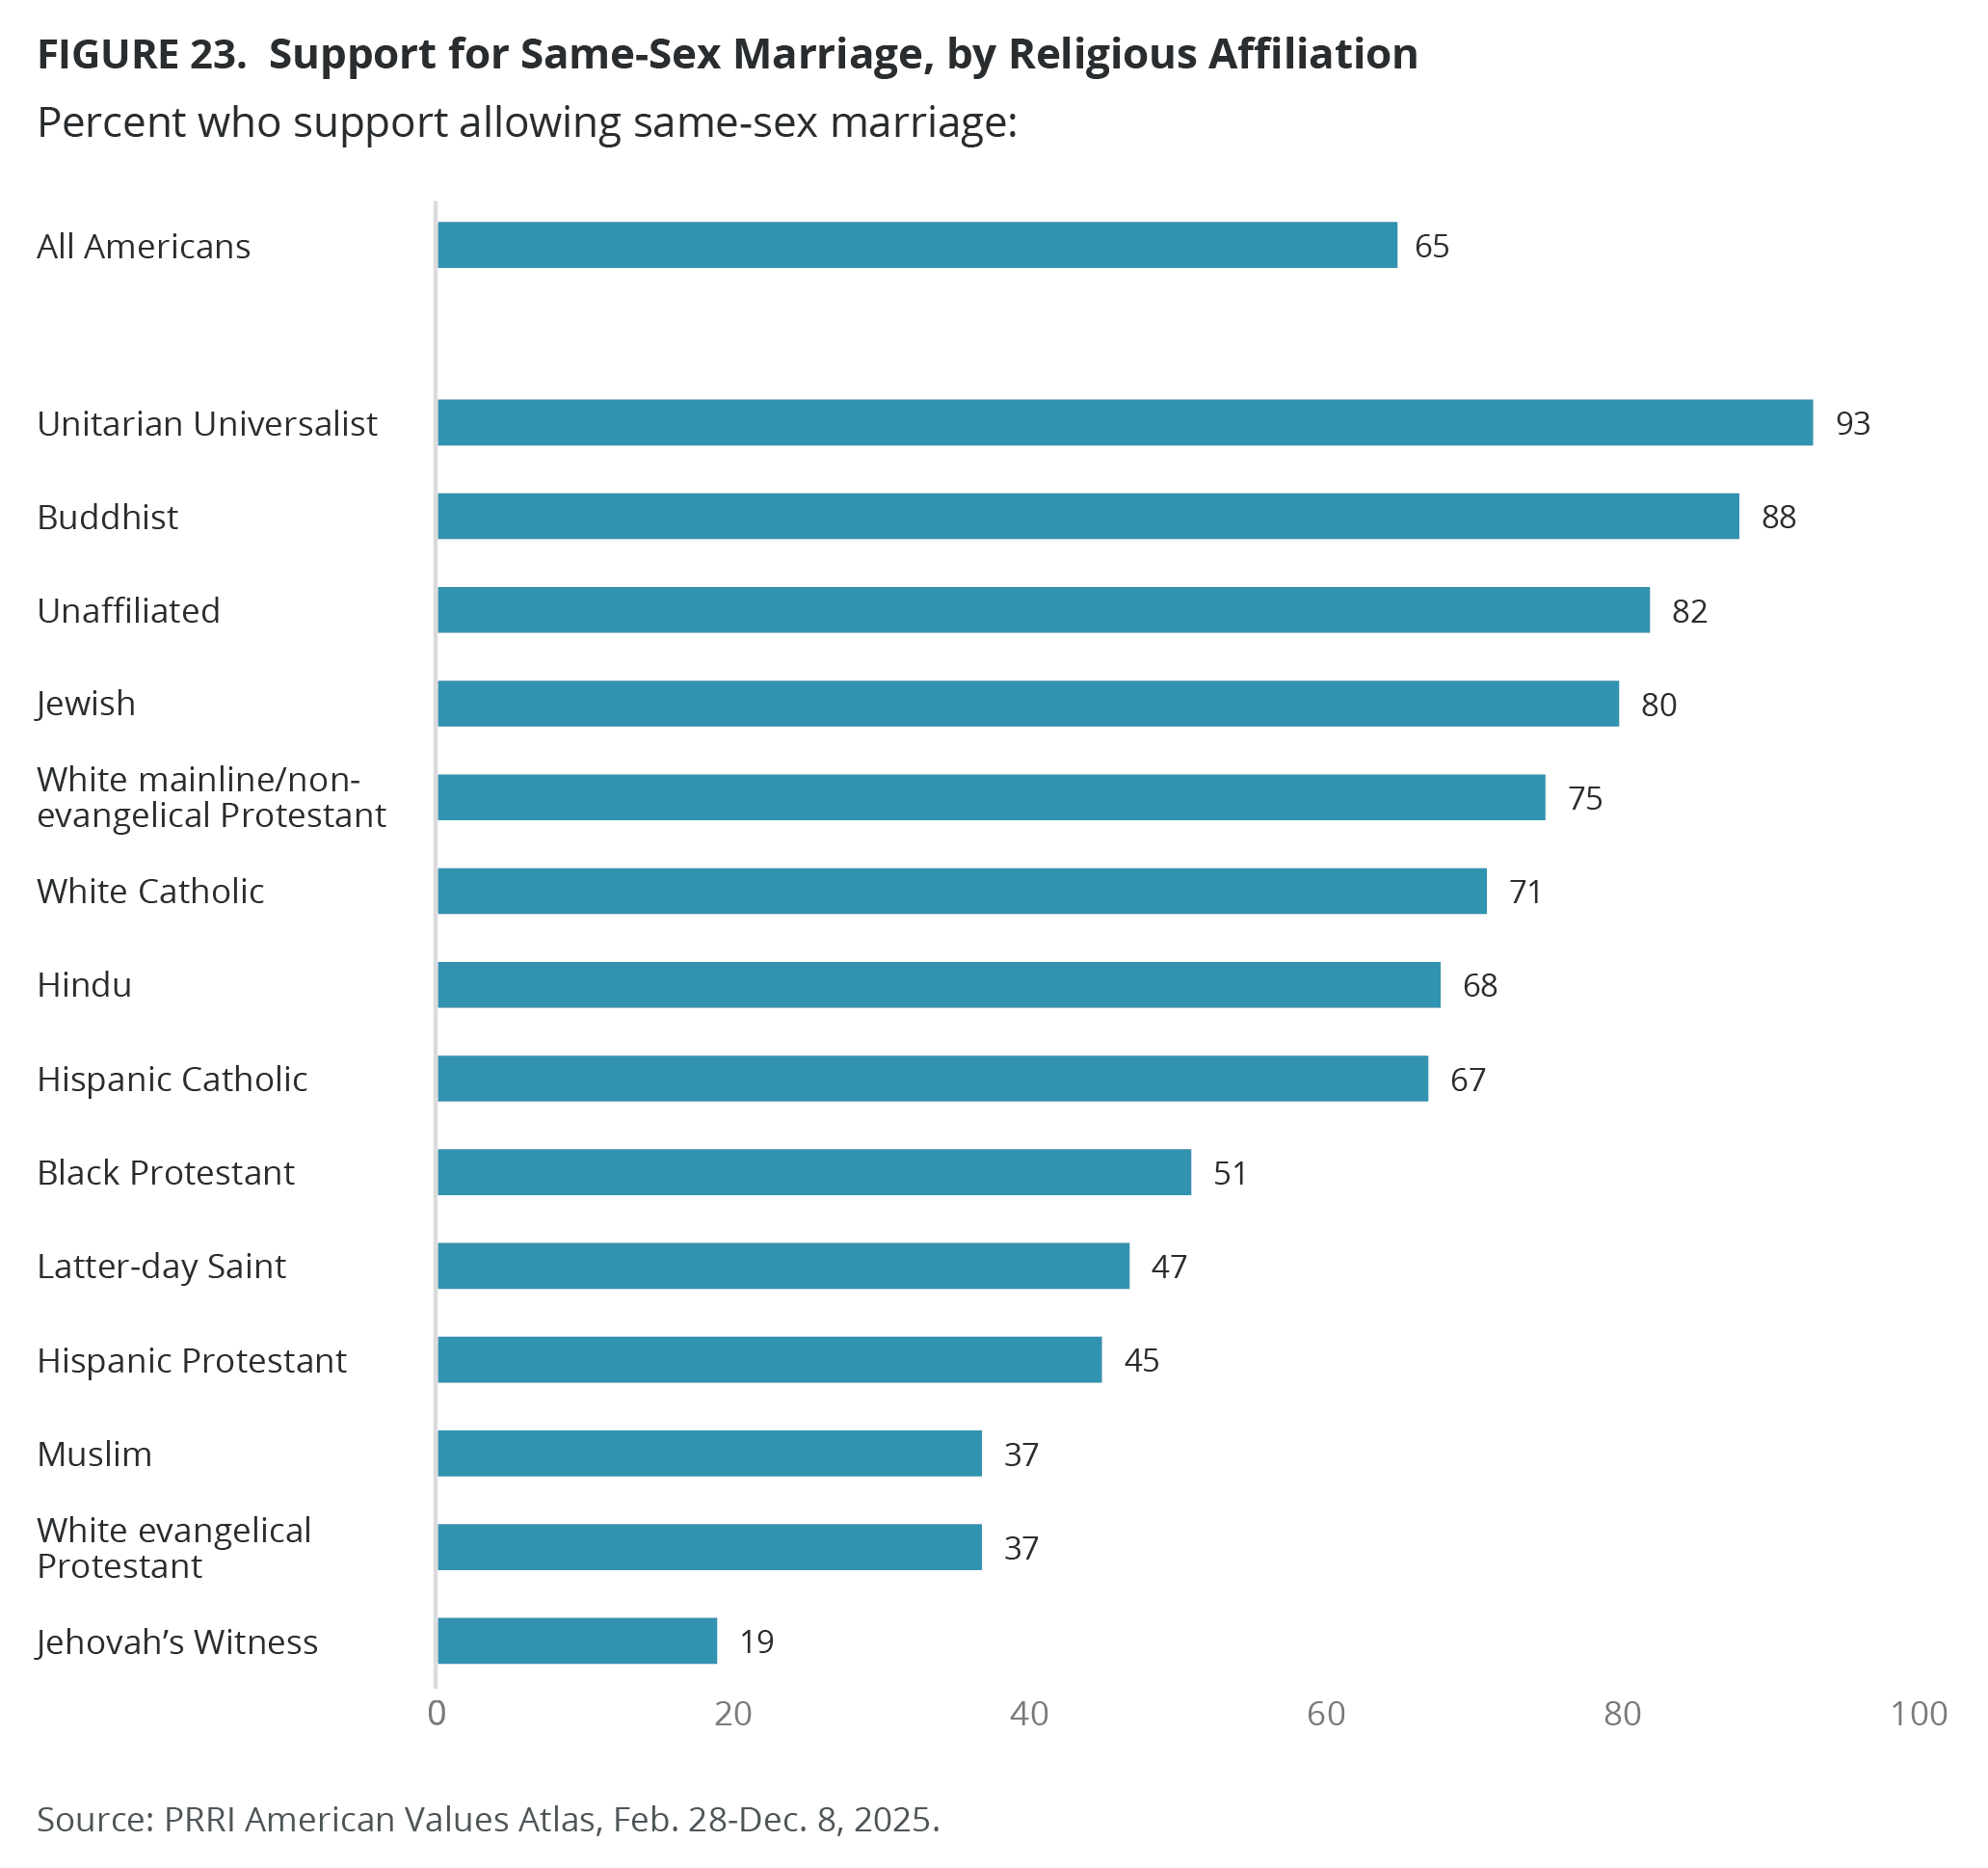
- Majorities of most religious groups support same-sex marriage, except for Latter-day Saints (47%), Hispanic Protestants (45%), white evangelical Protestants (37%), Muslims (37%), and Jehovah’s Witnesses (19%).
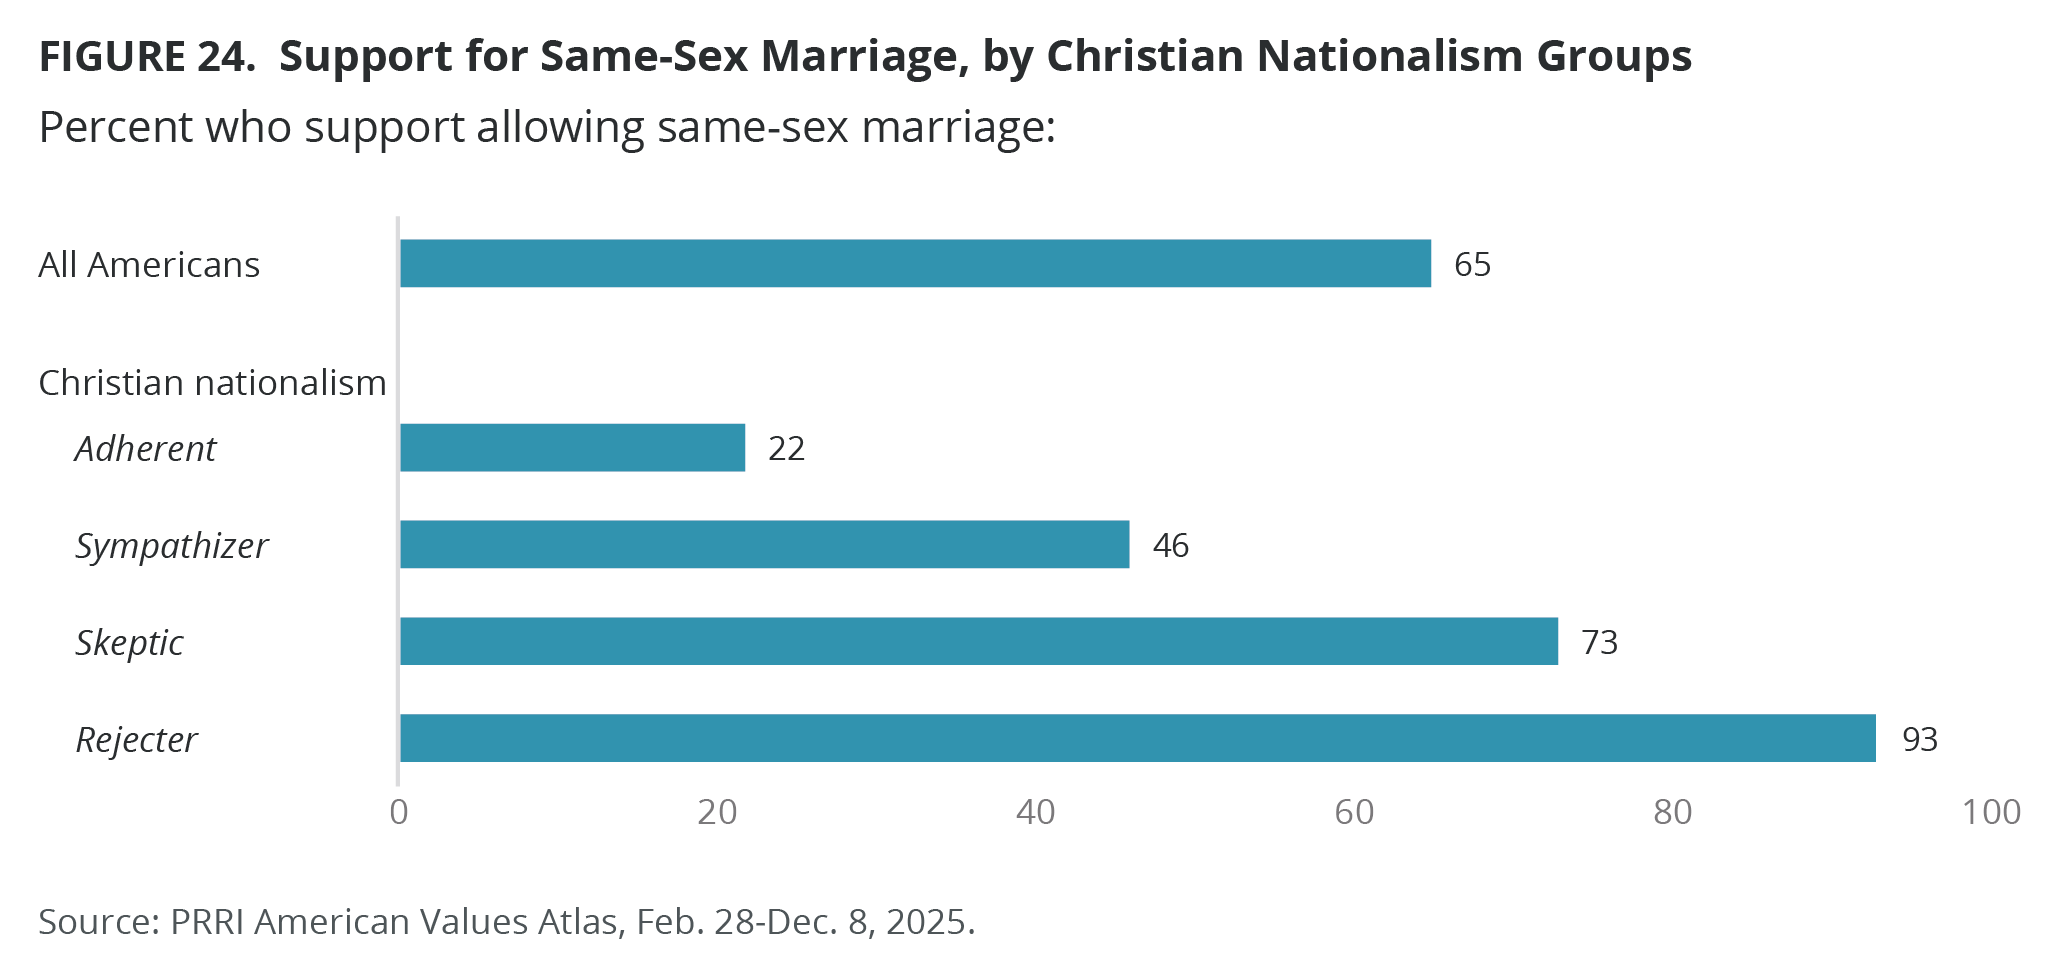
- Nearly all Christian nationalism Rejecters (93%) and three-fourths of Skeptics (73%) support same-sex marriage, compared with 46% of Sympathizers and 22% of Adherents.
- Except for young Americans under 30, support for same-sex marriage has steadily grown across older age groups, gender, race, and education levels.
While most Americans agree that transgender people deserve the same rights and protections as other Americans, just 40% oppose laws that require transgender people to use bathroom of their sex assigned at birth.
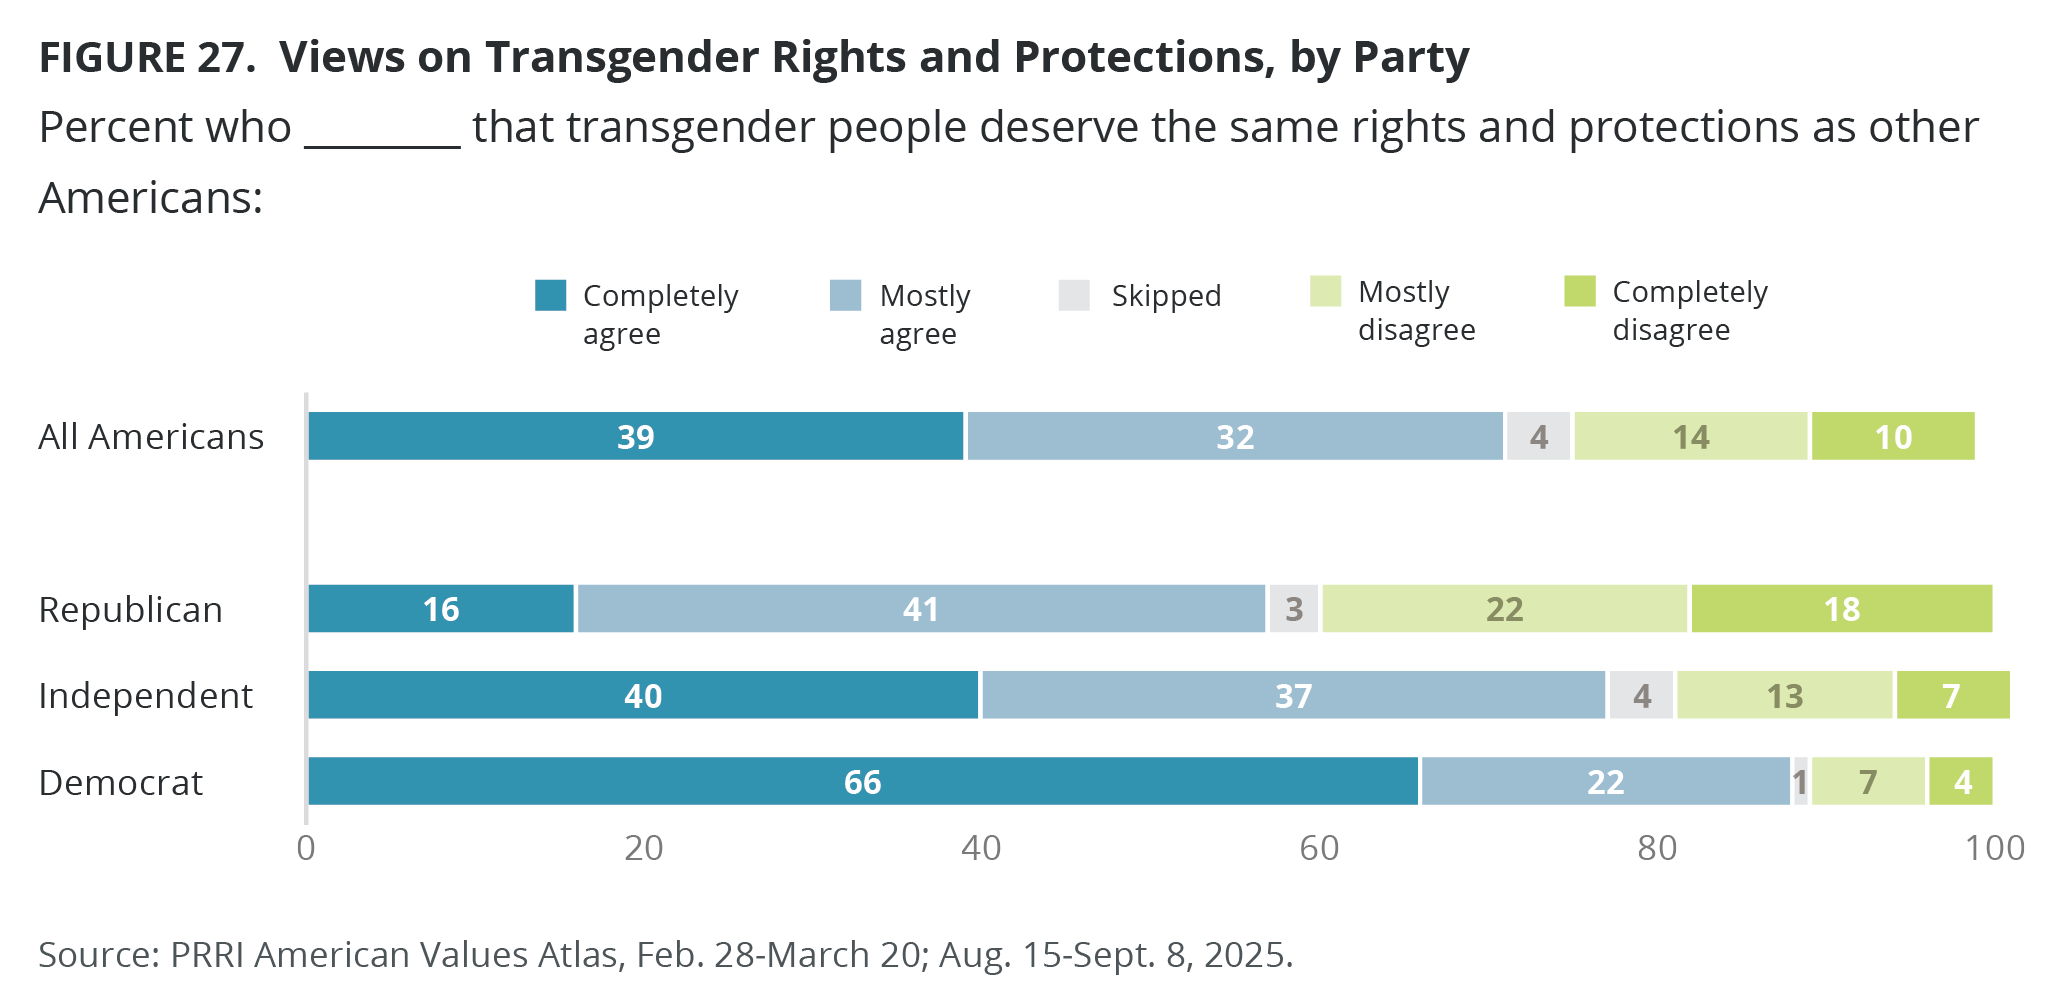
- Seven in ten Americans (71%) agree that “transgender people deserve the same rights and protections as other Americans,” including most Democrats (88%), independents (77%), and Republicans (57%).
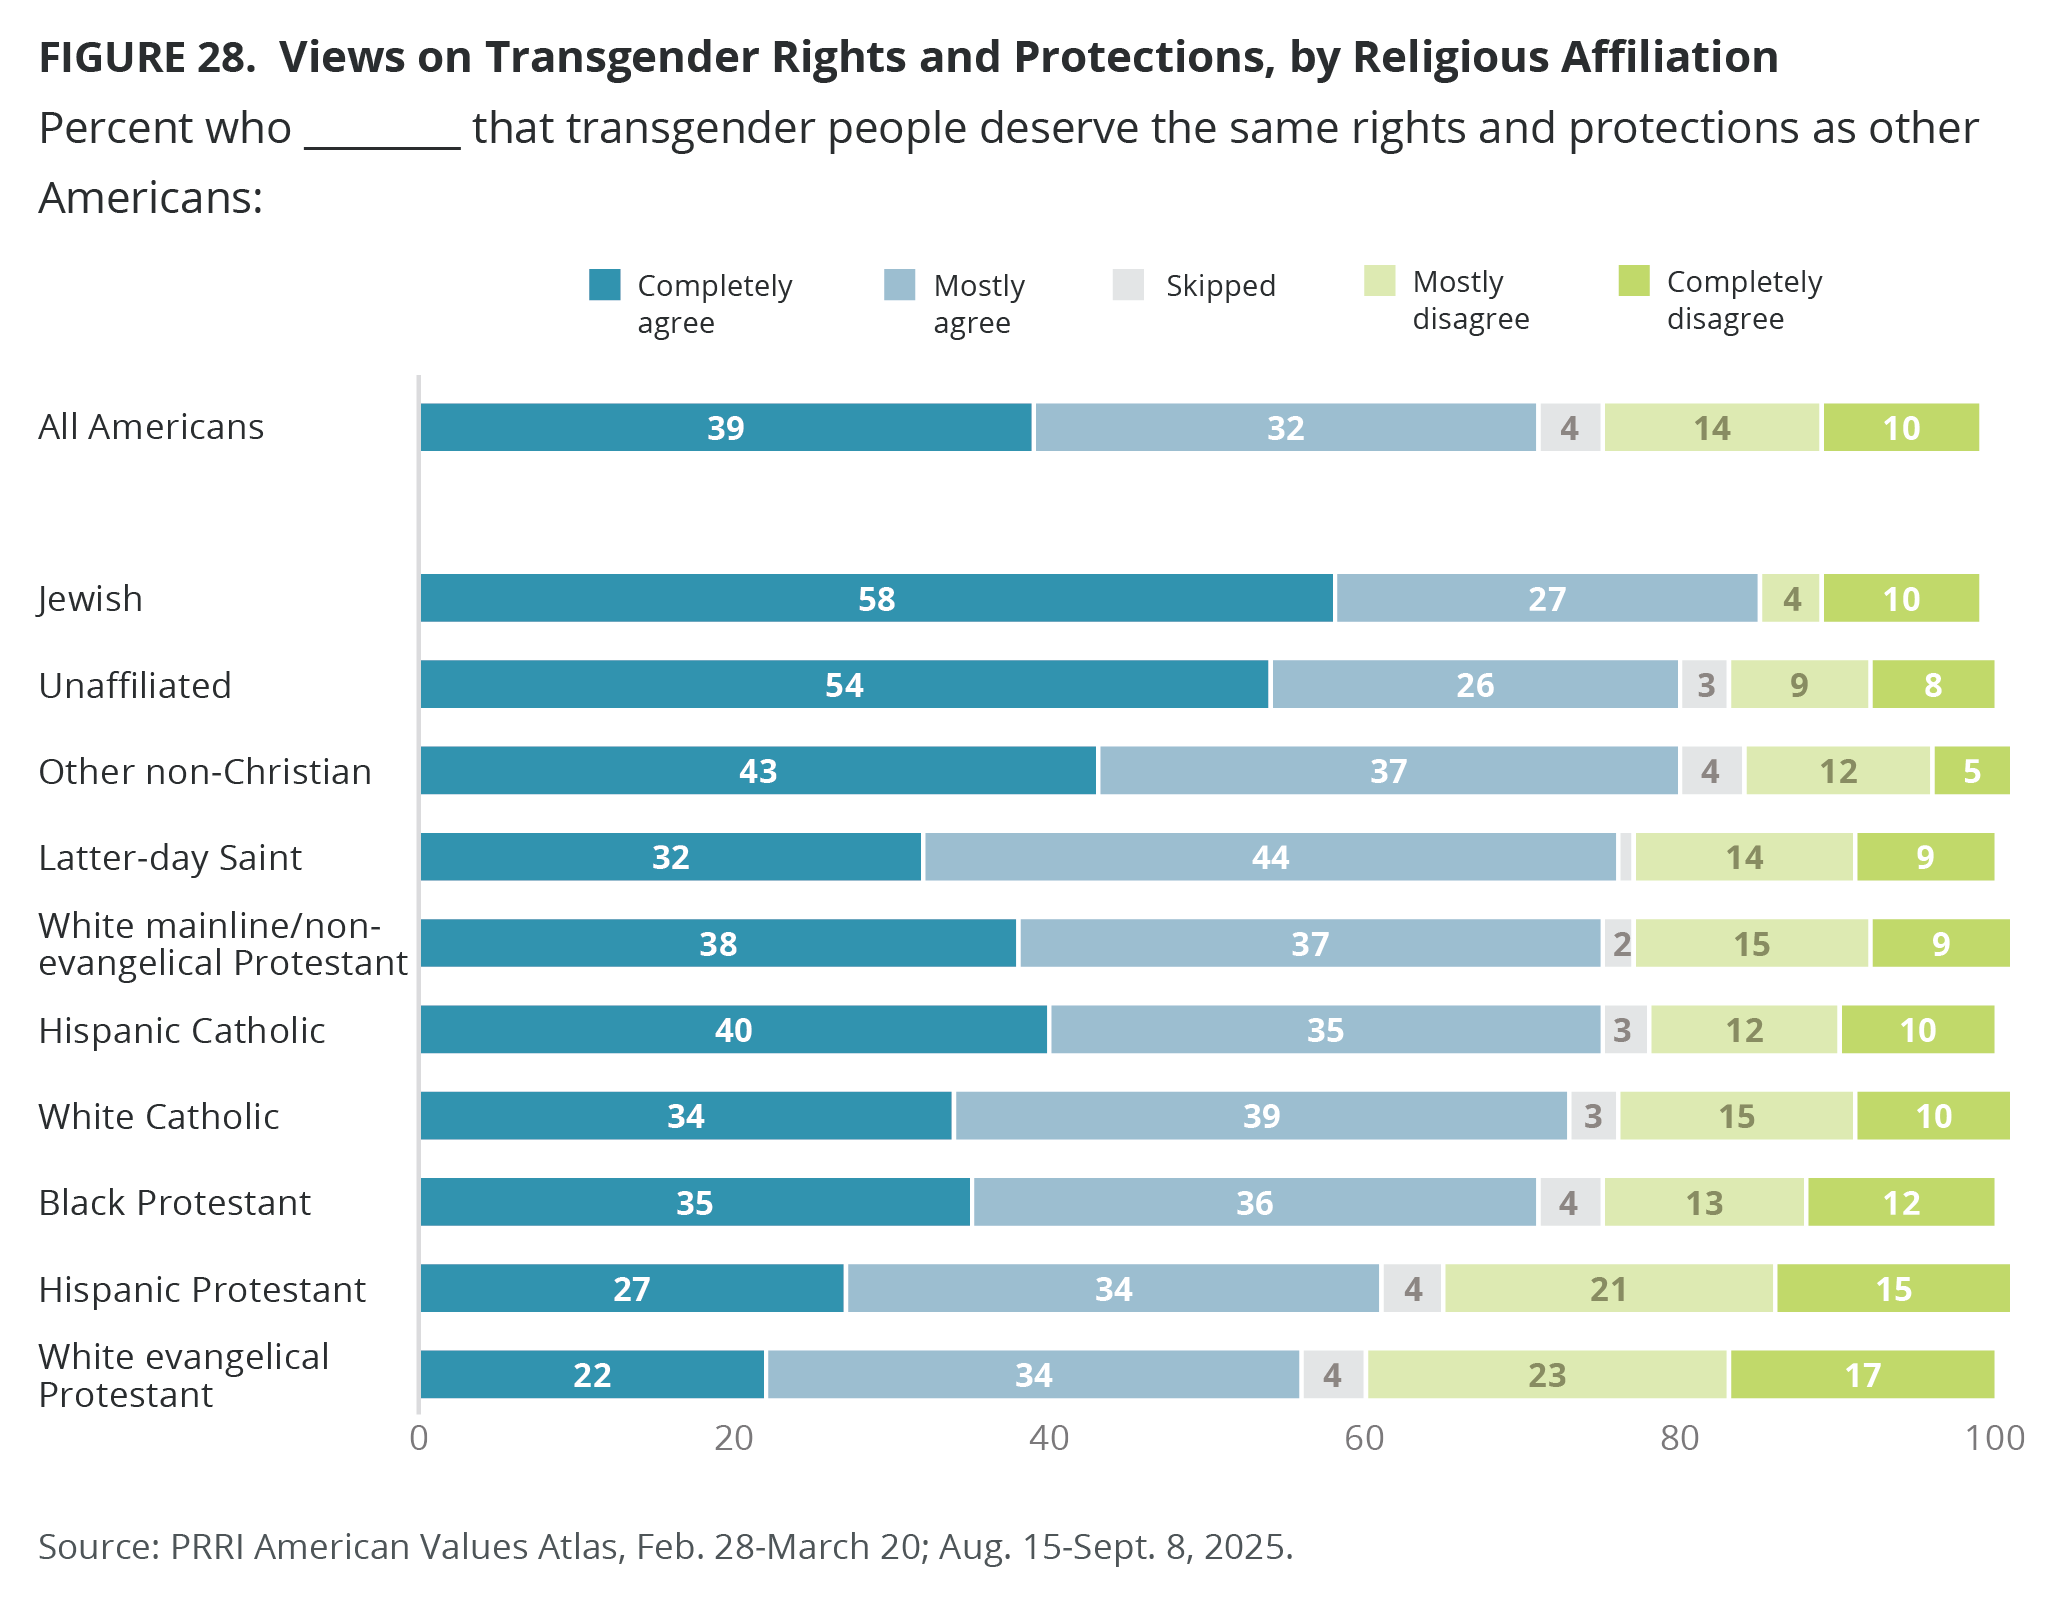
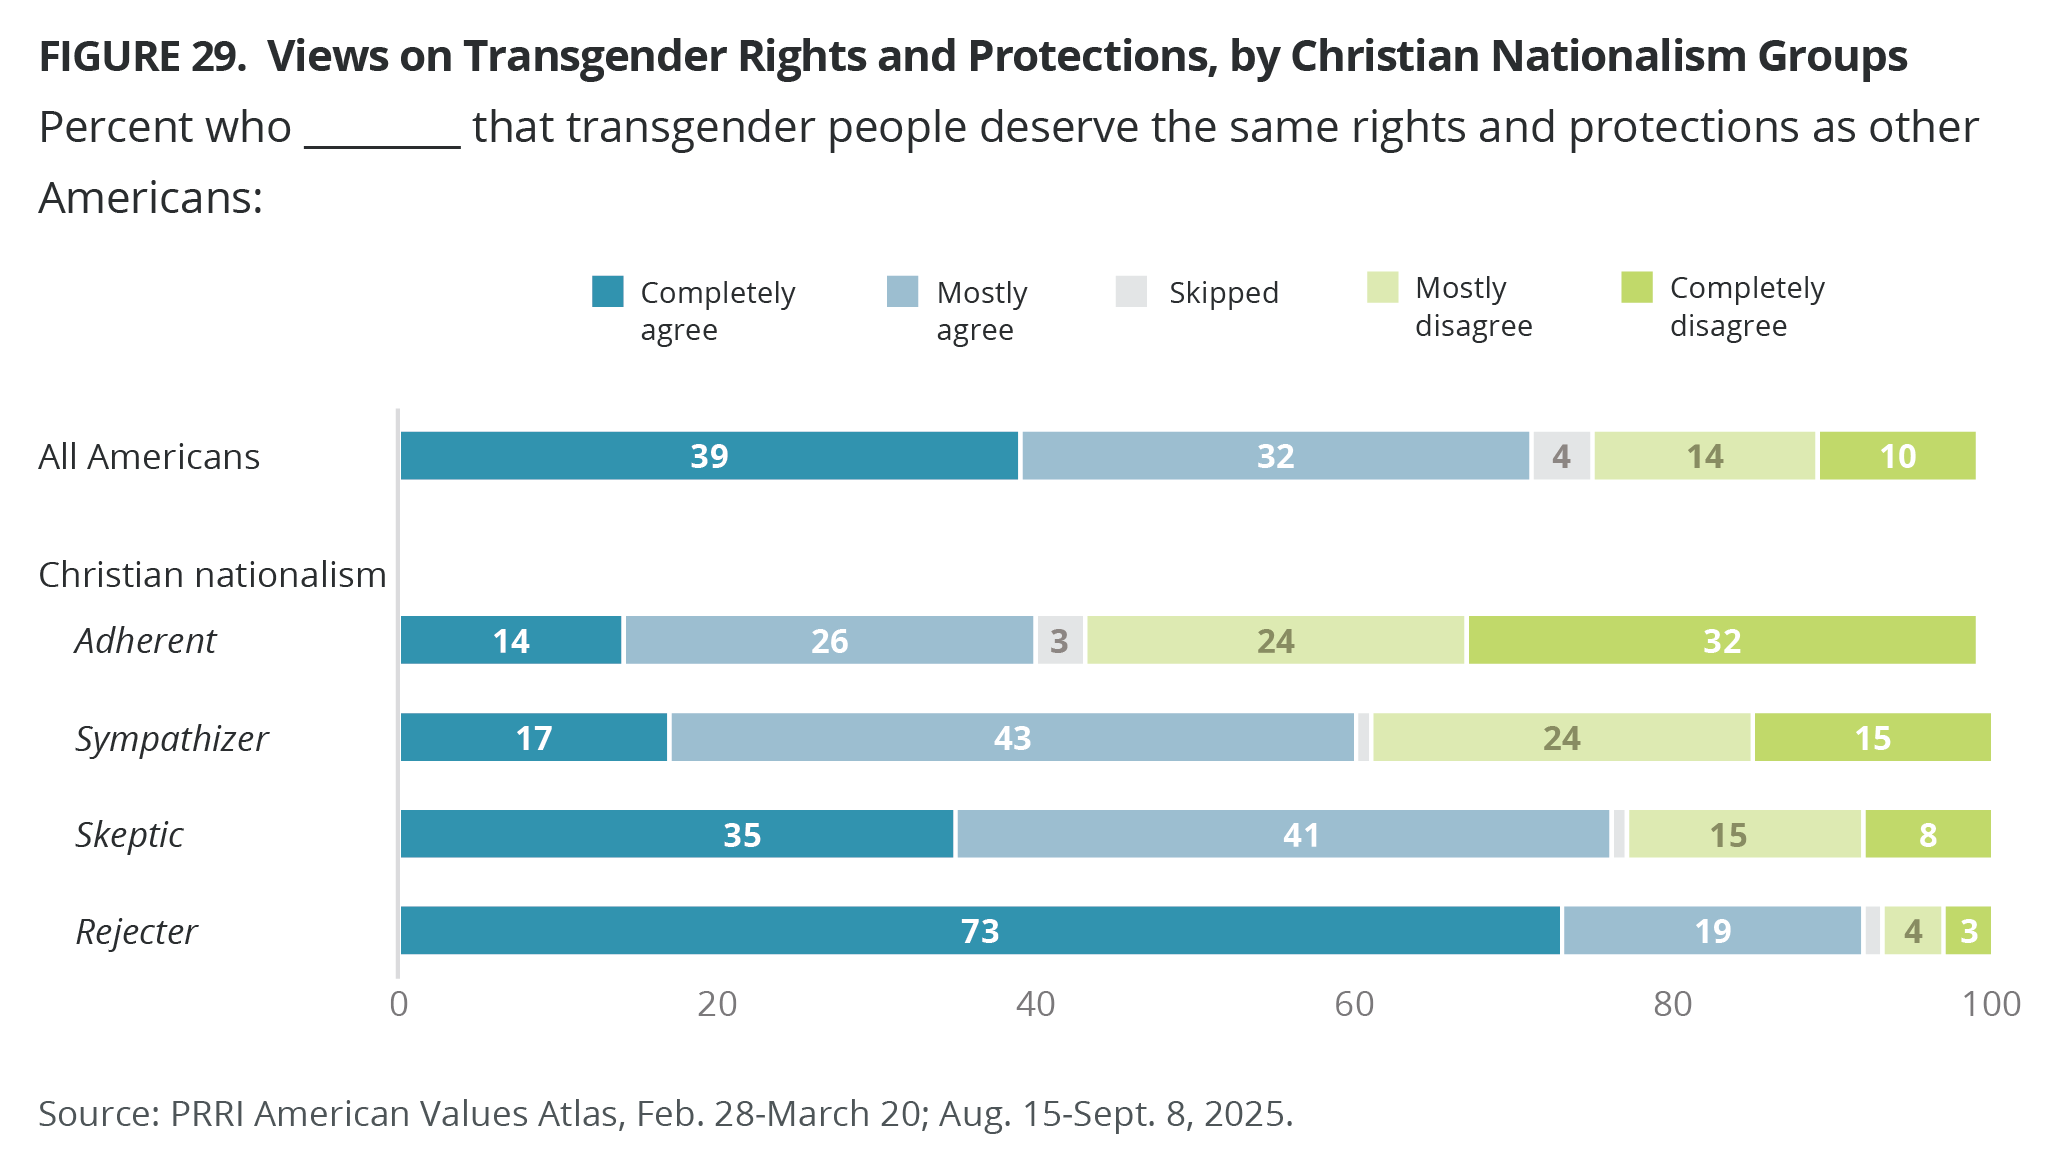
- Except for Christian nationalism Adherents (40%), solid majorities across all religious groups, Christian nationalism groups, age, gender, race, and education levels agree that transgender people deserve the same rights as other Americans.
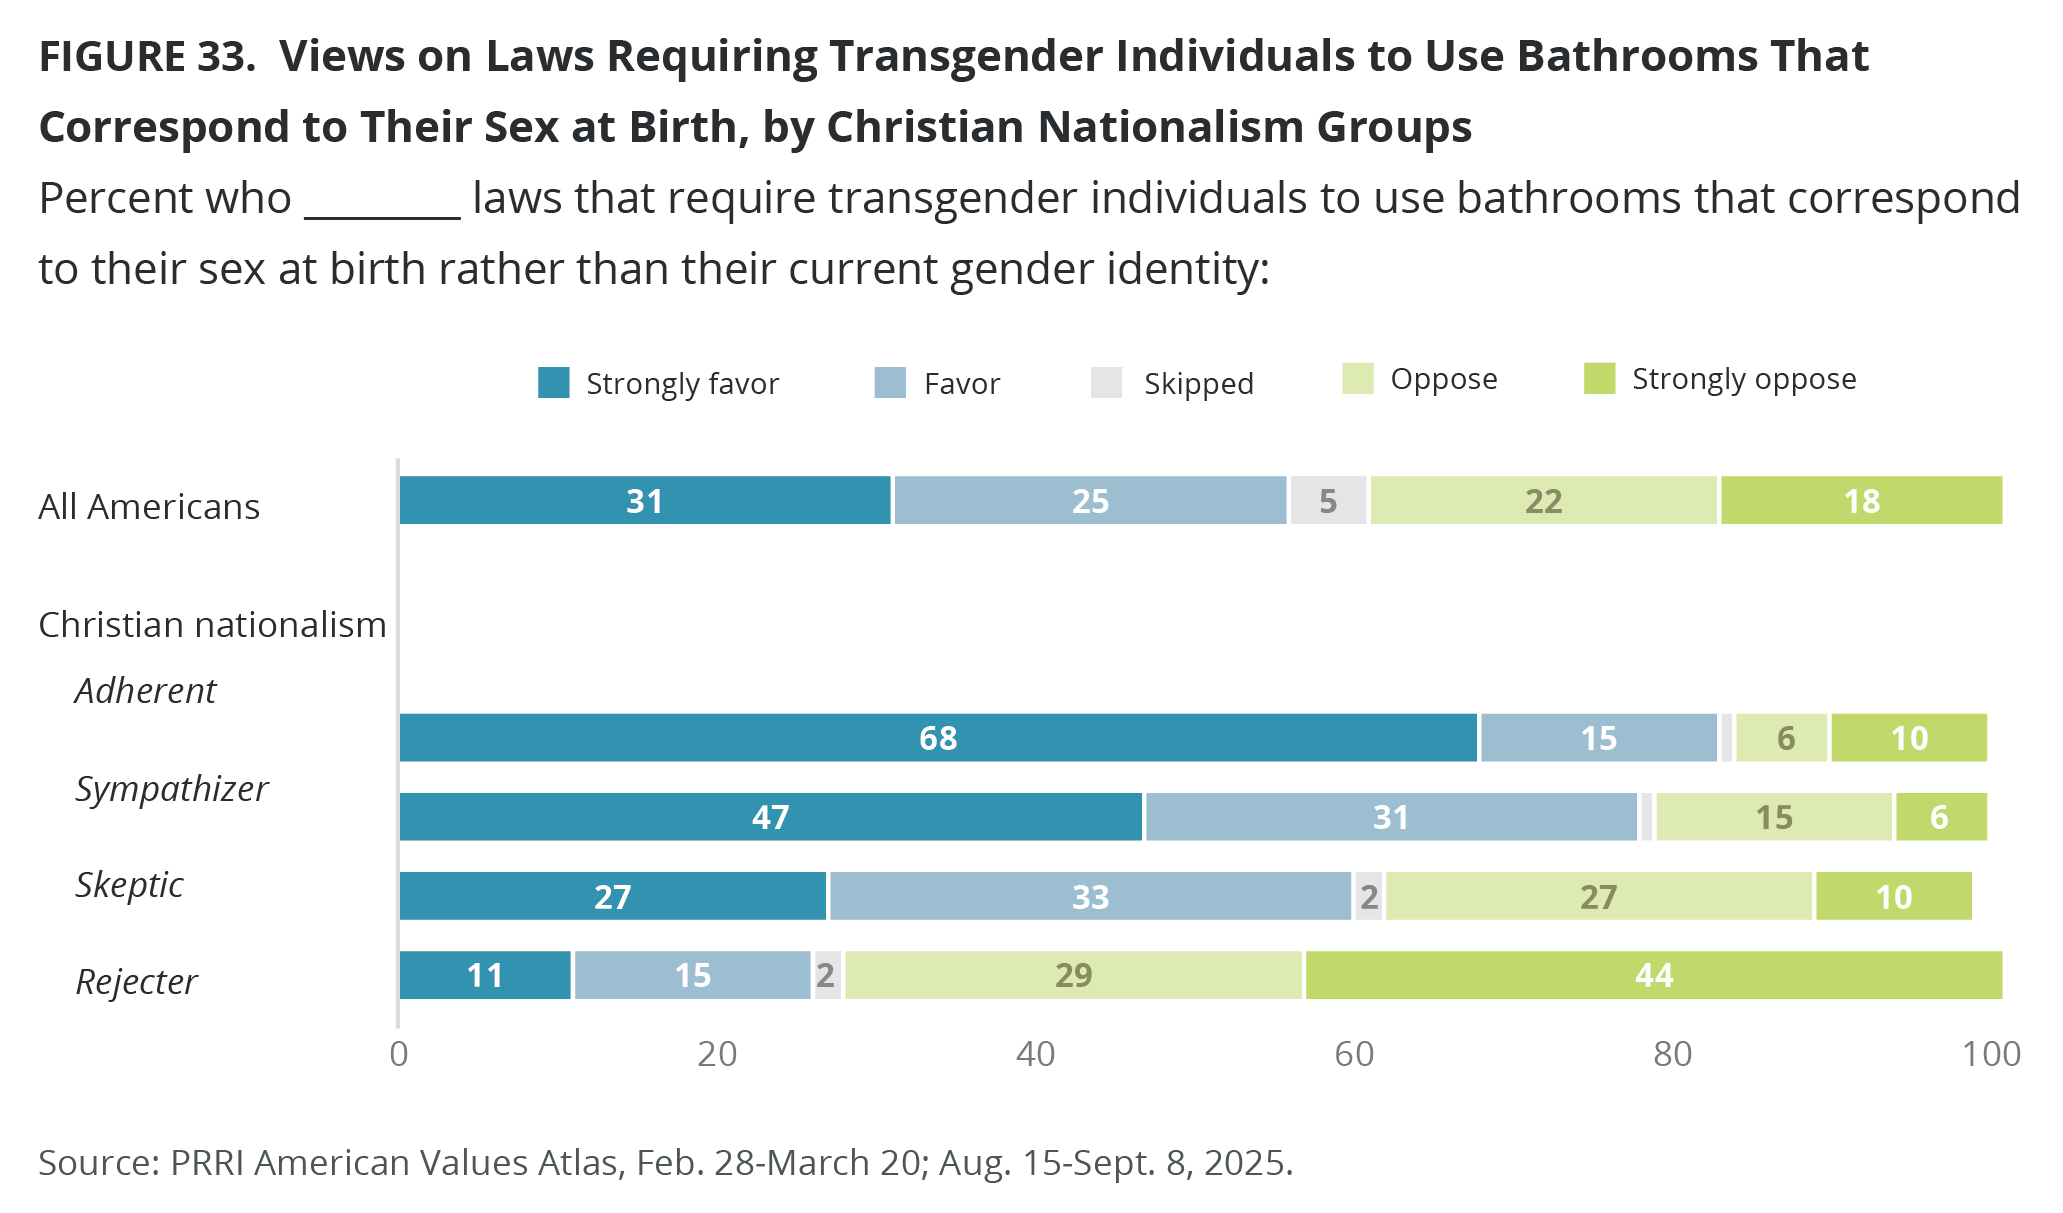
- The majority of Americans (56%) favor laws that require transgender individuals to use bathrooms that correspond to their sex at birth, with most Republicans (81%) in favor, compared with 55% of independents and 32% of Democrats.
- Americans who agree transgender people deserve the same rights and protections as other Americans are less likely to favor laws that require transgender individuals to use bathrooms that correspond to their sex assigned at birth than those who disagree that transgender people deserve the same rights (49% vs. 77%).
Introduction
Throughout 2025, PRRI interviewed more than 22,000 adults as part of the PRRI American Values Atlas, providing a comprehensive profile of the demographic, religious, and political characteristics of LGBTQ Americans. Building on a decade’s worth of insights, this report examines public attitudes on LGBTQ rights across all 50 states, with a focus on three key policy areas: nondiscrimination protections, religious based service refusals, and same-sex marriage. PRRI’s American Values Atlas also explores views on whether transgender Americans deserve the same rights and protections as other Americans.
Measuring LGBTQ Identity
PRRI measures sexual orientation by asking whether respondents identify as gay, lesbian, bisexual, straight, or another identity. Individuals identifying as gay lesbian, bisexual, or something else are classified as LGBTQ, while those identifying as straight are classified as non-LGBTQ.
Gender identity is measured through questions about birth-assigned sex and current gender identity. Respondents are classified as cisgender if their current gender matches their birth-assigned sex, while those whose responses indicated differences — such as identifying as transgender, non-binary, or another identity — are classified as transgender/non-binary.
The final LGBTQ identity category includes all individuals who are transgender, non-binary, or who identify as a sexual minority, while cisgender individuals identifying as straight are categorized as non-LGBTQ.[1] In the 2025 PRRI American Values Atlas, one in ten Americans identify as LGBTQ, including 4% who identify as bisexual, 3% as gay or lesbian, and 2% as “something else.” LGBTQ identity has more than doubled since 2016, from 4% to 10%.
Profile of LGBTQ Americans
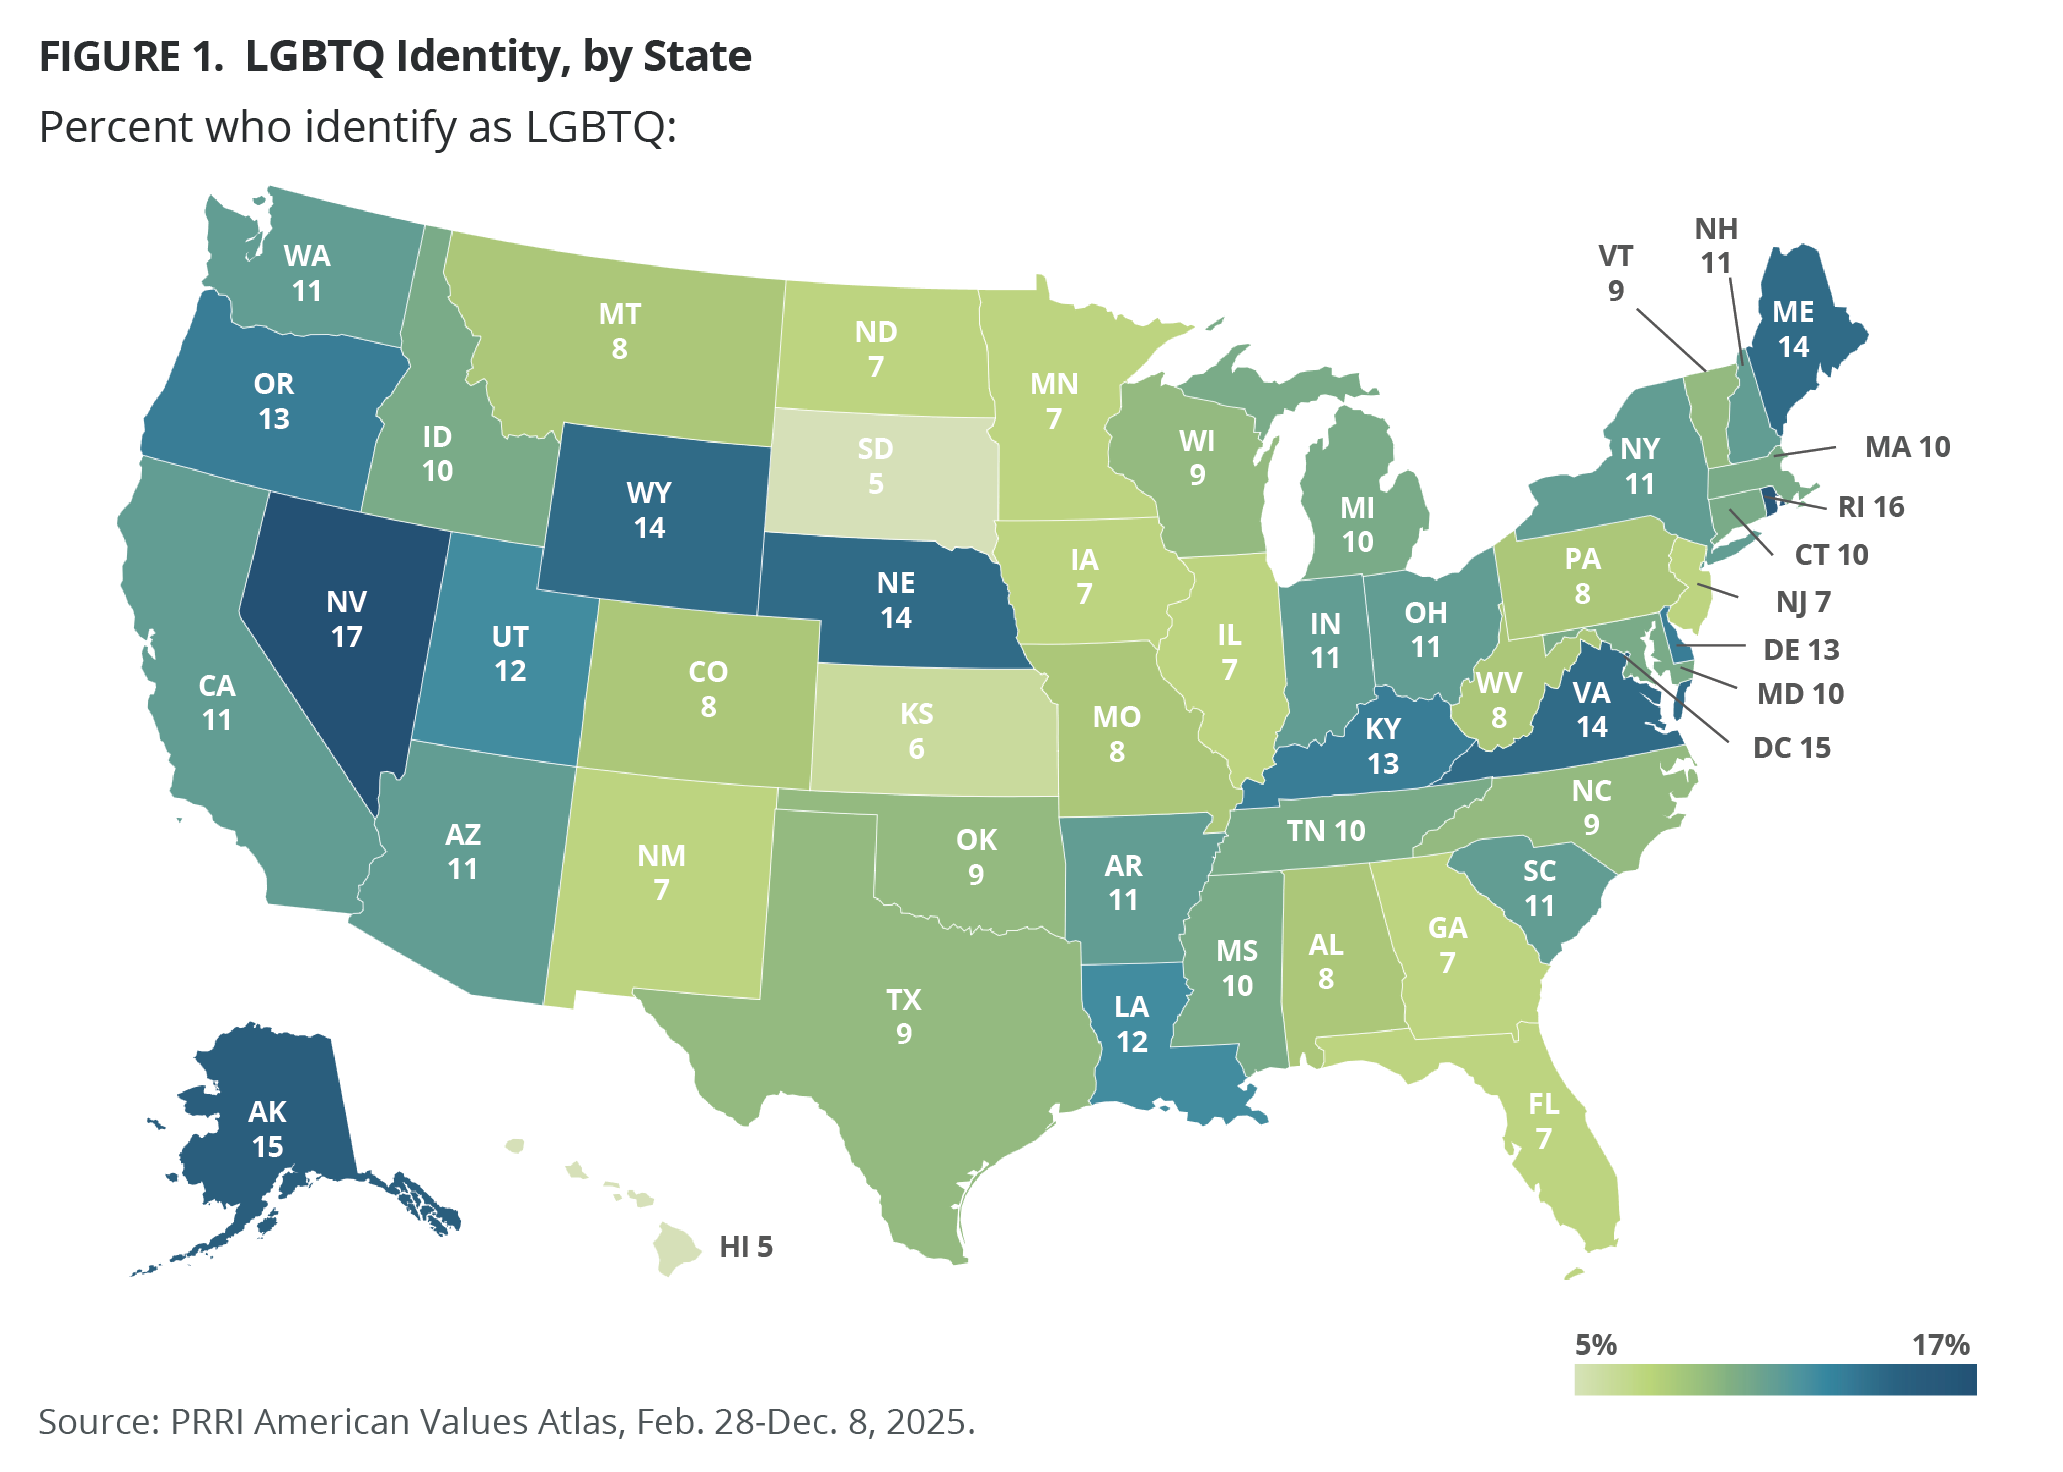
LGBTQ Americans are more likely to reside in the District of Columbia and Western states and less likely to reside in the South and Midwest. While Americans who identify as LGBTQ mirror the American population in many demographics, LGBTQ Americans are more likely than the general population to be younger, Democrats, liberal, religiously unaffiliated, and Christian nationalism Rejecters.
Geography
Higher proportions of LGBTQ Americans reside in the District of Columbia (15%) and in Western states, such as Nevada (17%), Alaska (15%), Wyoming (14%), and Oregon (13%). LGBTQ identity is also prevalent in the Northeast, including Rhode Island (16%) and Maine (14%). In the Midwest, Nebraska (14%) has a higher proportion of LGBTQ residents, while in the South, Virginia (14%), Kentucky (13%), and Delaware (13%) stand out.
The states with the lowest proportions of LGBTQ Americans are Kansas (6%), Hawaii (5%), and South Dakota (5%).
Age and Gender
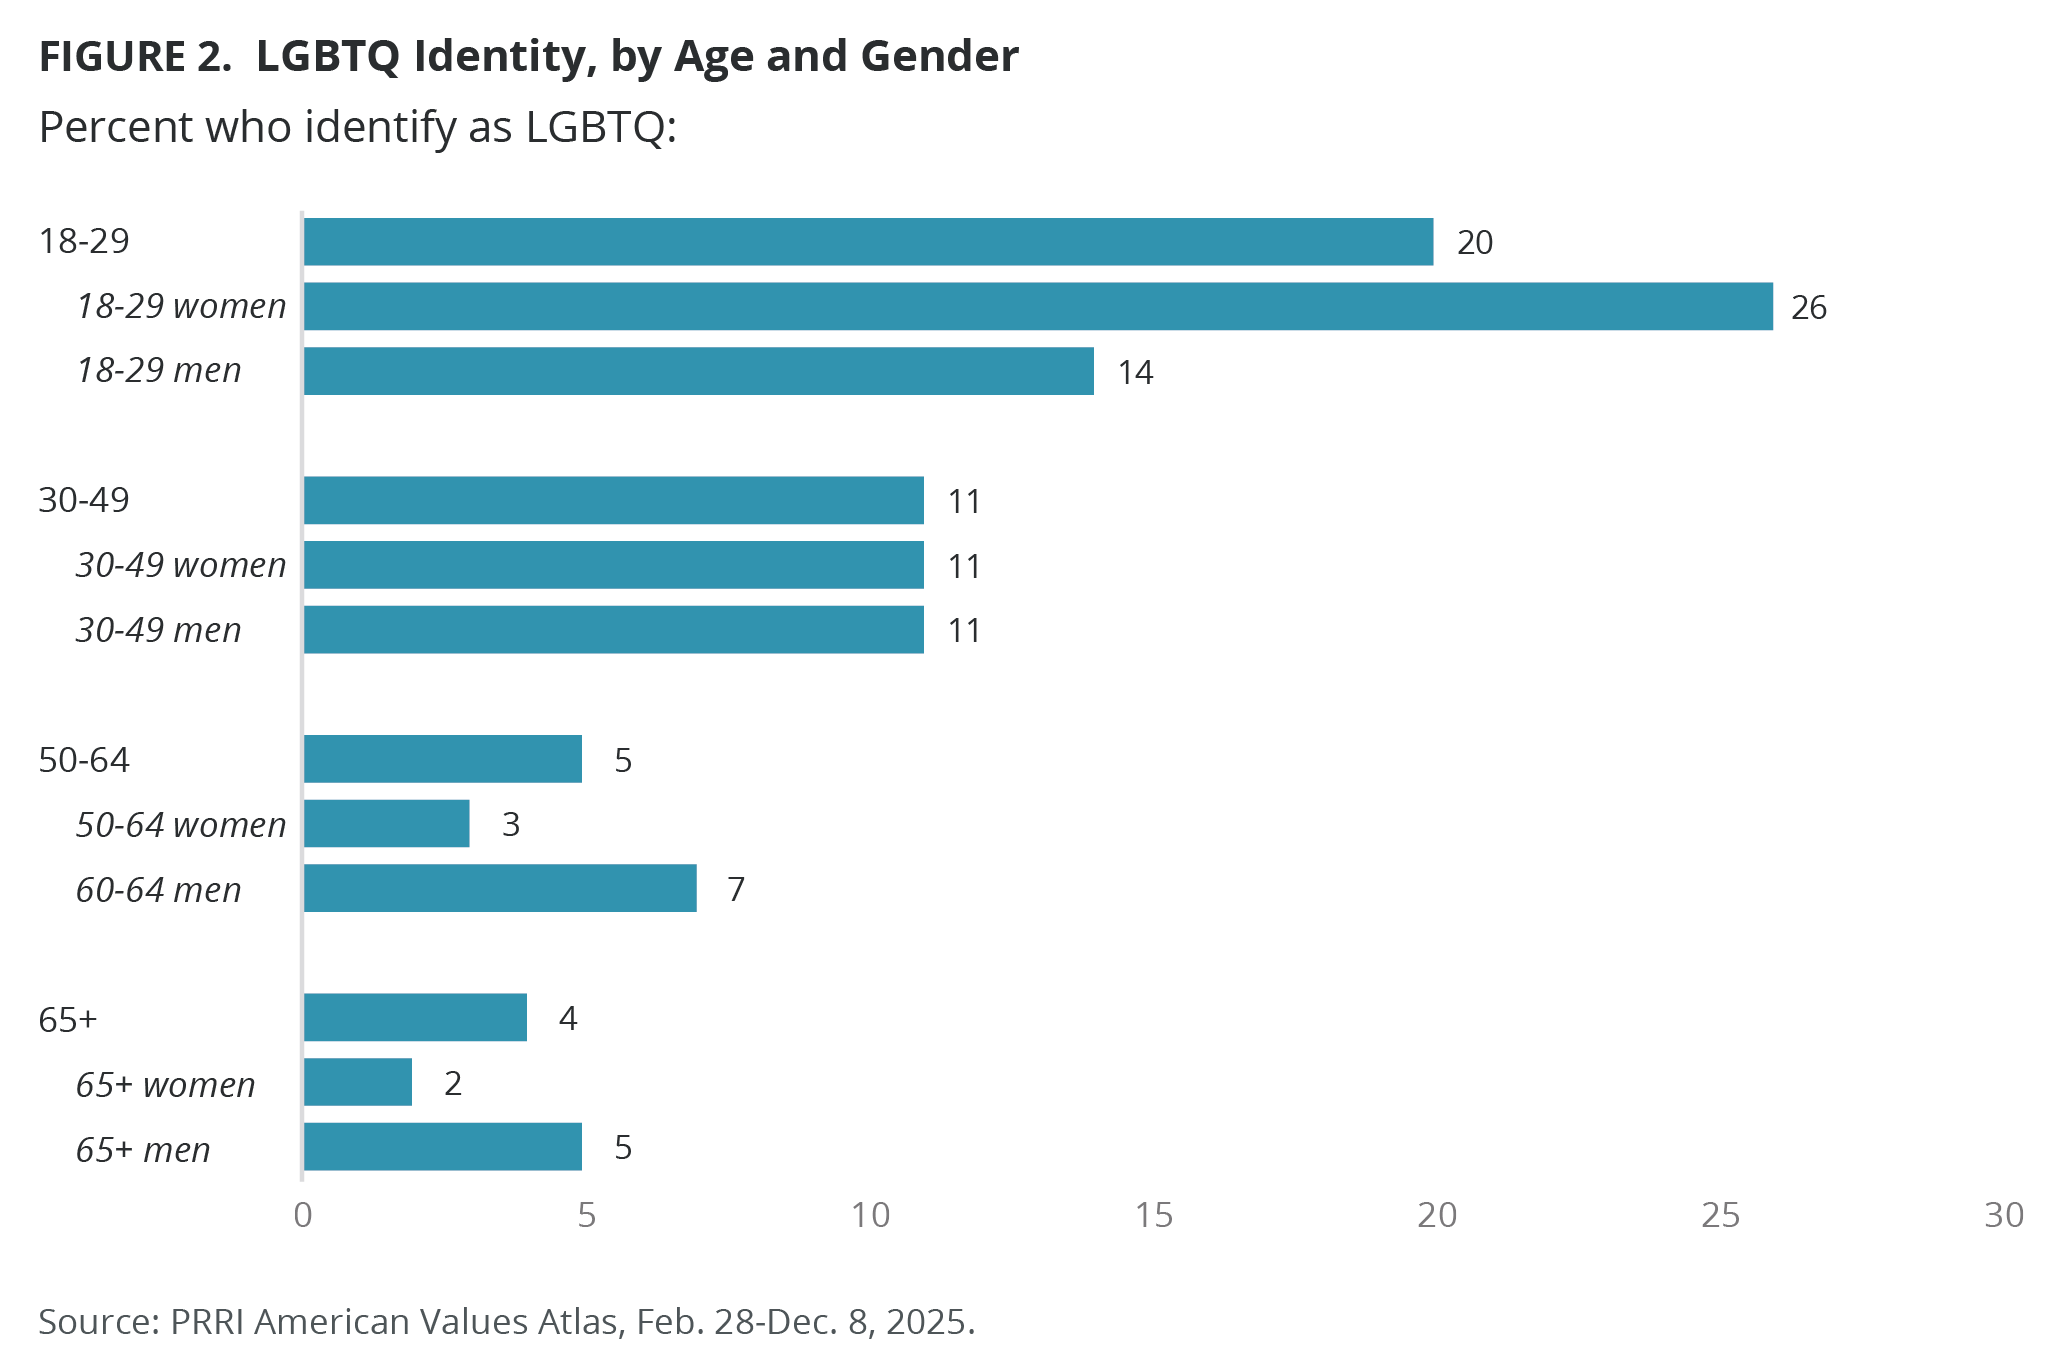
Roughly two in ten Americans ages 18-29 (20%) identify as LGBTQ, compared with smaller shares among older age groups: 11% of those ages 30-49, 5% of those ages 50-64, and 4% of those ages 65 and older.
Although there are little differences between men and women in terms of LGBTQ identity, gender gaps appear across age groups. Women ages 18-29 (26%) are about twice as likely as men in the same age group (14%) to identify as LGBTQ, driven in part by higher identification as bisexual among young women (13% vs. 6%). There are no differences by gender among those ages 30-49. Among older age groups, men are slightly more likely than women to identify as LGBTQ, including among those ages 50-64 (7% vs. 3%) and ages 65 and older (5% vs. 2%).
Party and Political Ideology
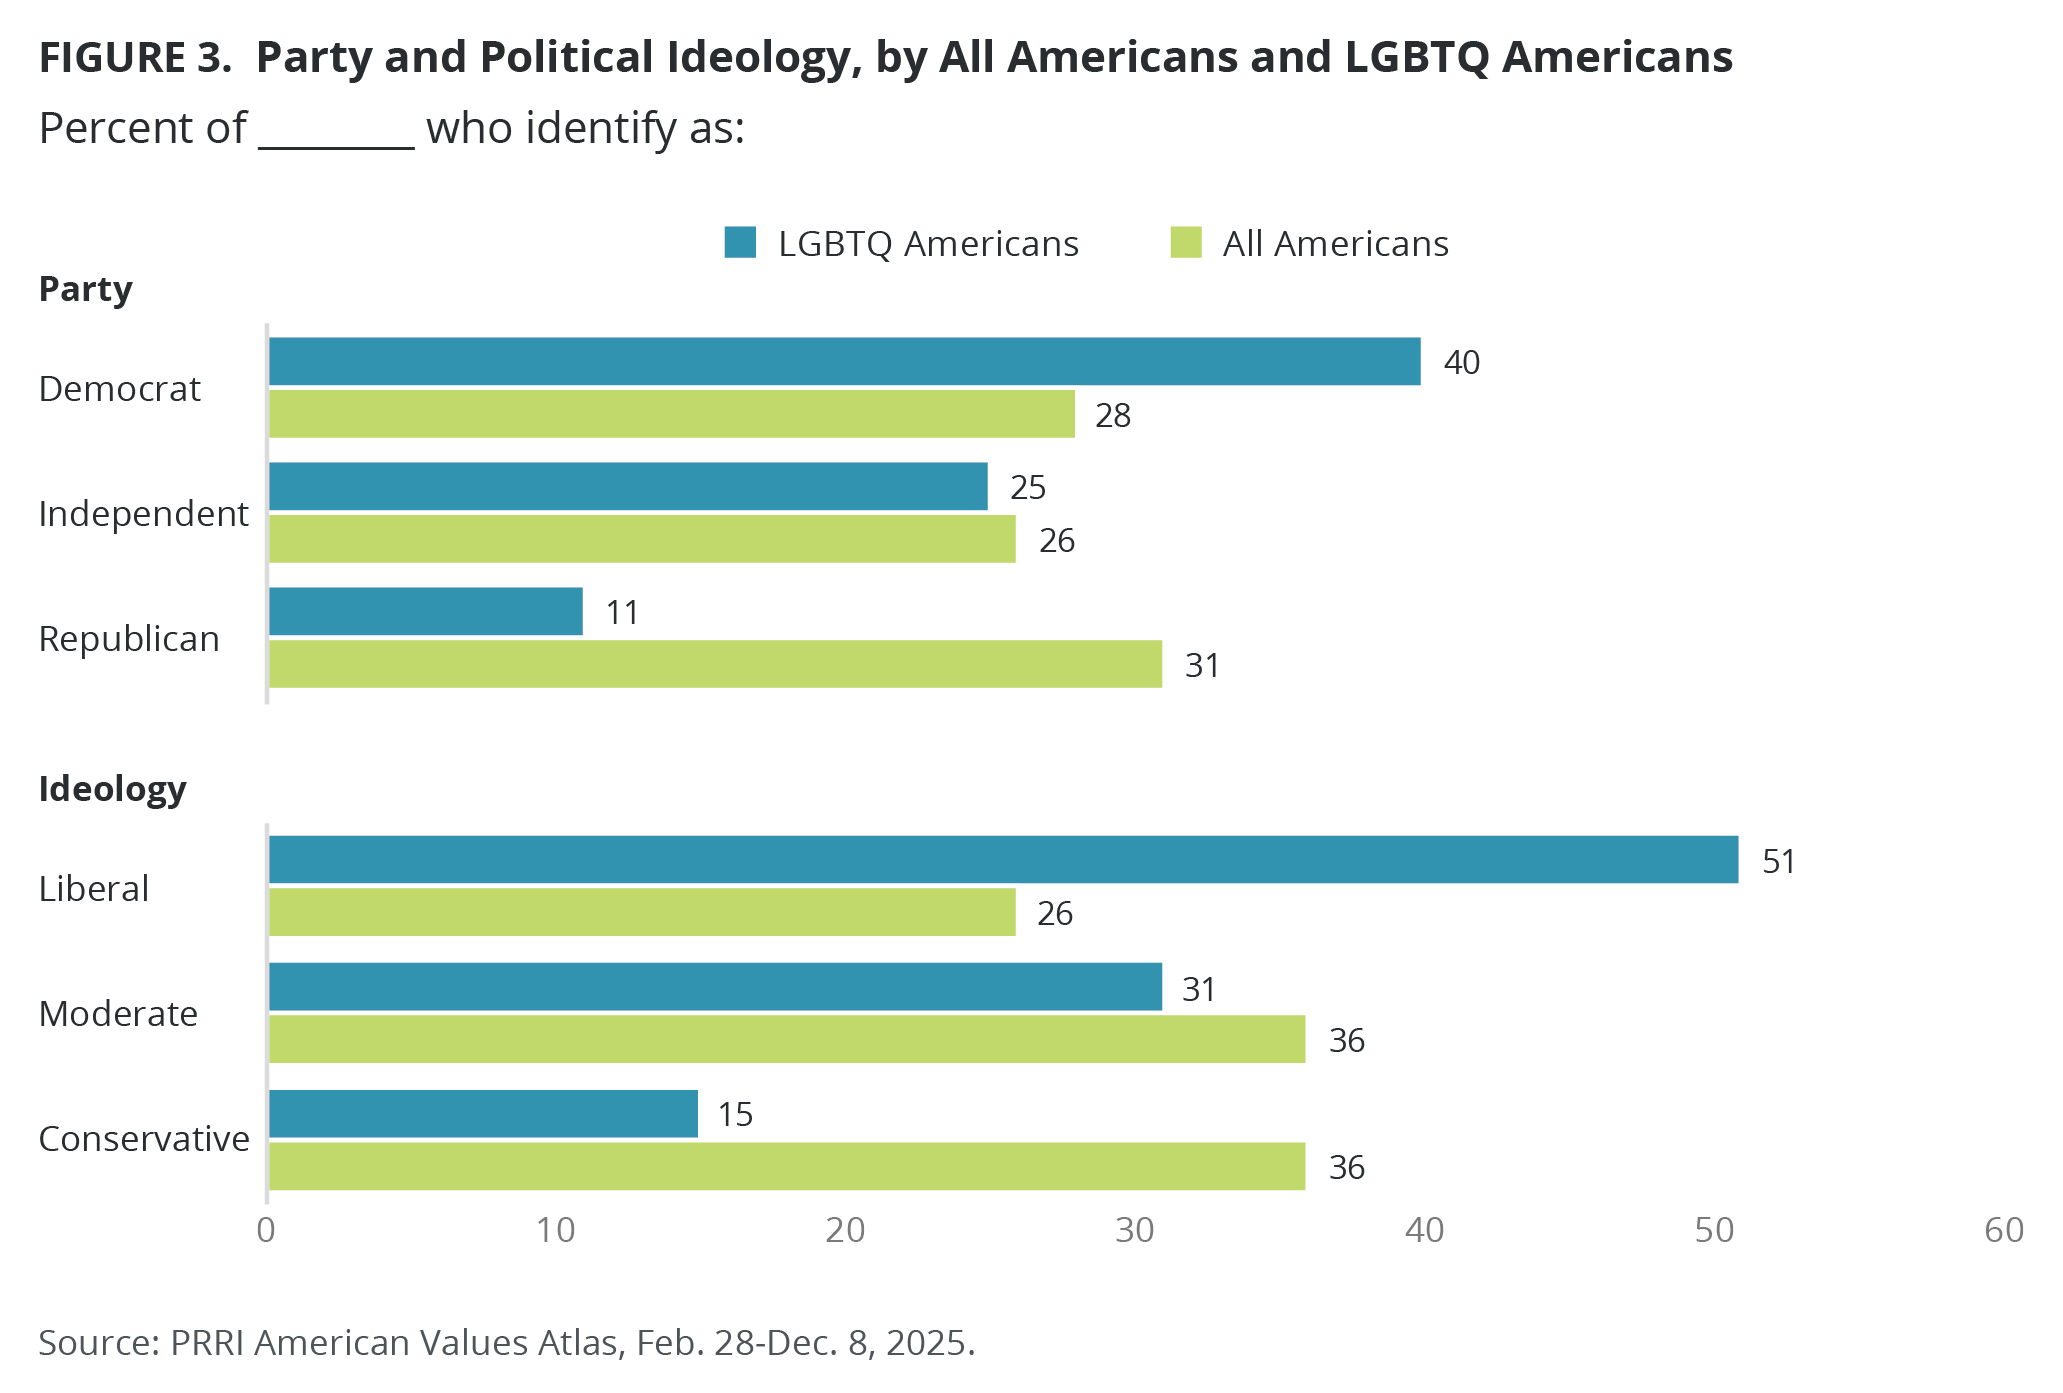
LGBTQ Americans are more likely than the general population to identify as Democrats (40% vs. 28%) and less likely to identify as Republicans (11% vs. 31%). They are, however, equally as likely to identify as independents (25% vs. 26%). Nearly one in four LGBTQ Americans (24%) identify with another political party or are uncertain about their partisan identity, compared with 15% of all Americans.
A slim majority of LGBTQ Americans identify as liberal, twice the rate of all Americans (51% vs. 26%), while they are half as likely to identify as conservative (15% vs. 36%). LGBTQ Americans are also slightly less likely to identify as moderate (31% vs. 36%).
Religious Affiliation and Christian Nationalism
Over half of LGBTQ Americans identify as religiously unaffiliated (51%), roughly twice the rate among all Americans (27%). This share has increased from 46% in 2016. LGBTQ Americans are also more likely to identify with a non-Christian religion than all Americans (12% vs. 7%).[2]
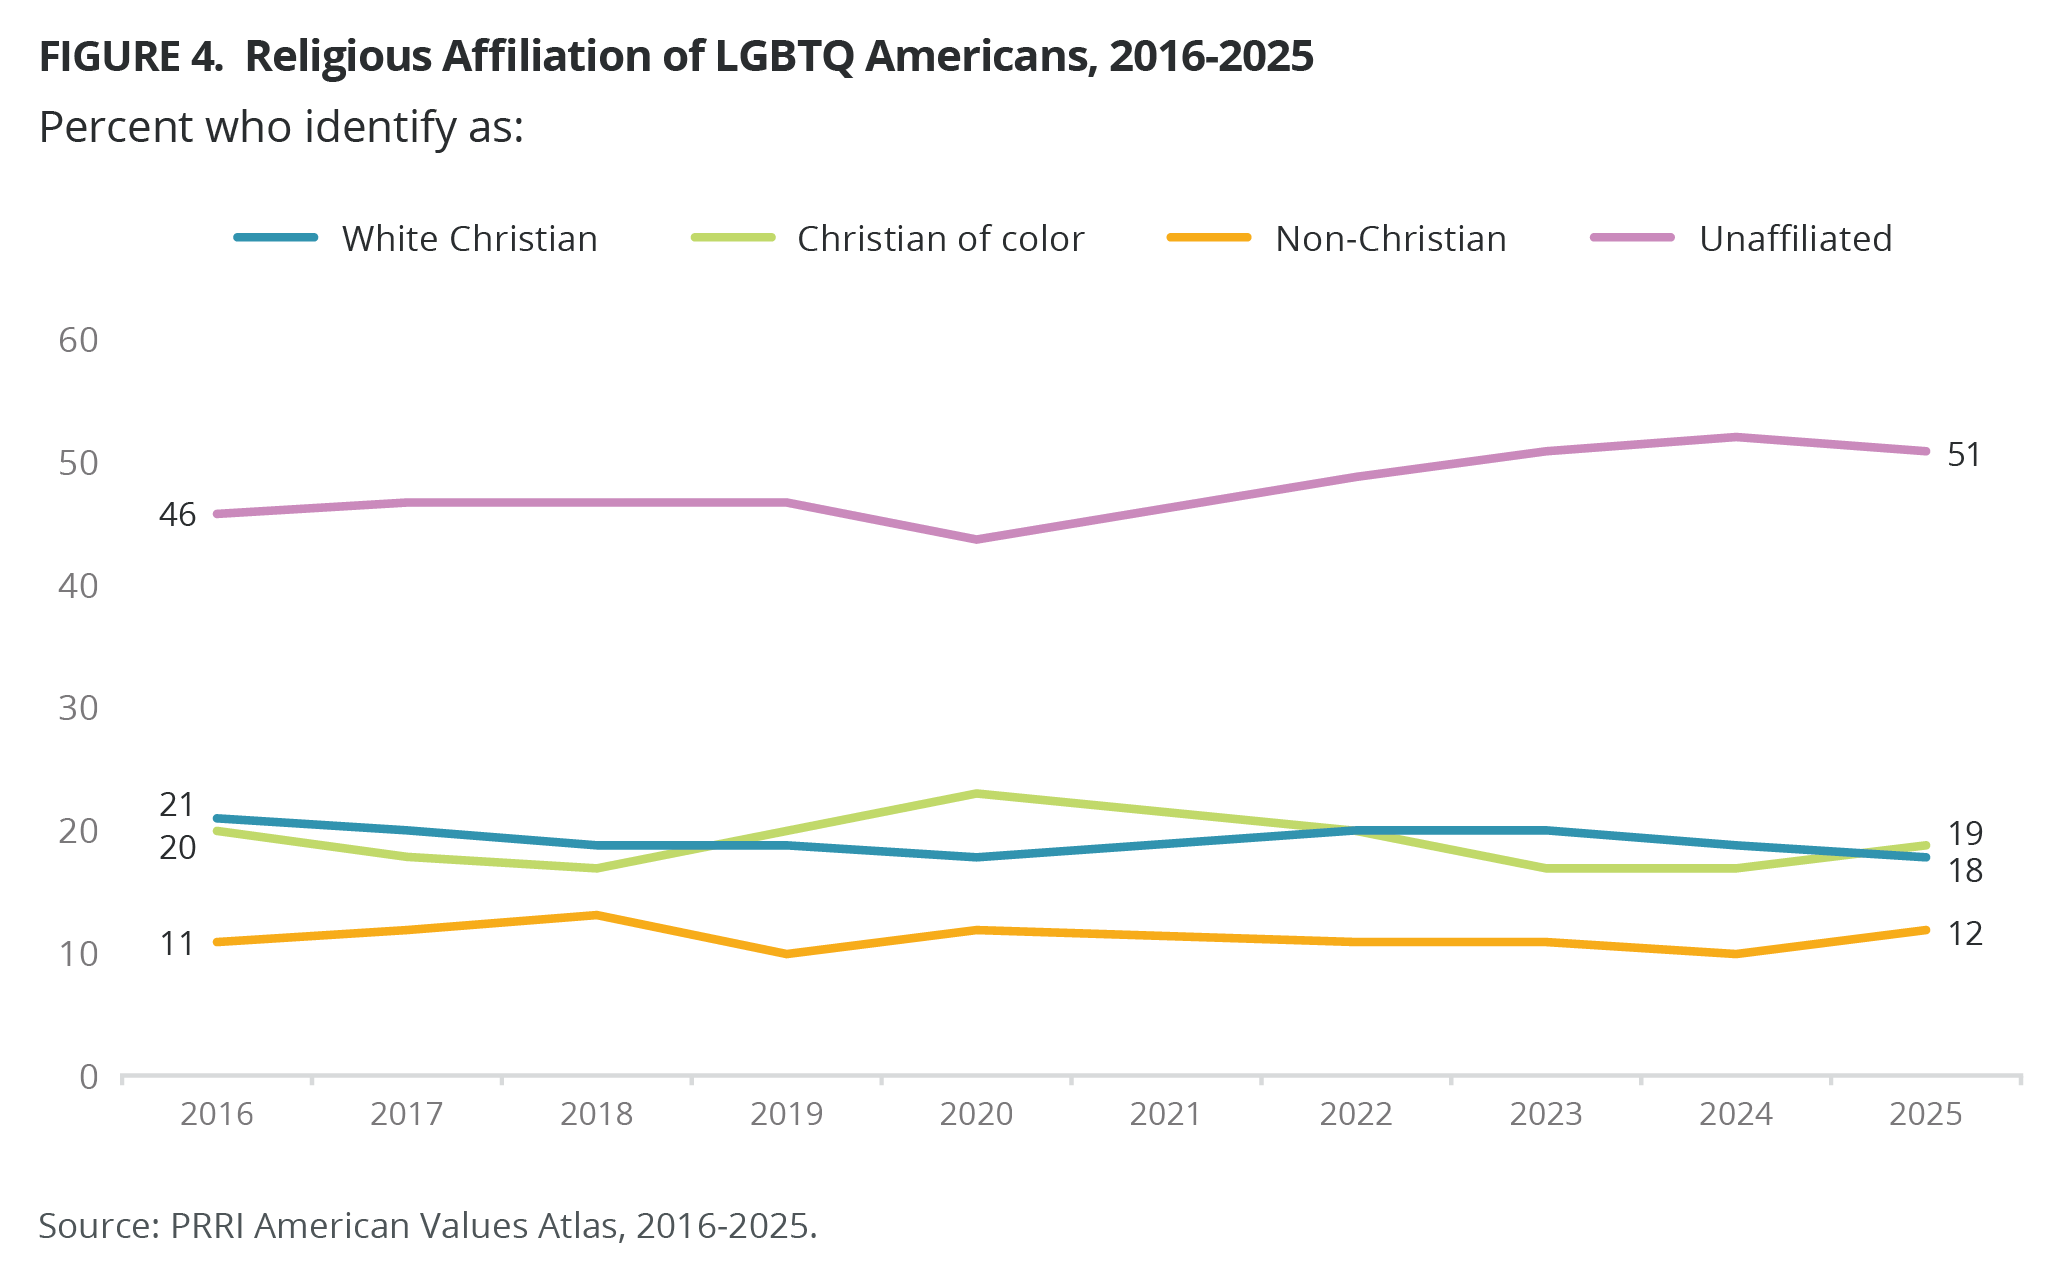
In contrast, LGBTQ Americans are half as likely as all Americans to identify with a white Christian group (18% vs. 40%), including white evangelical Protestant (4% vs. 14%), white mainline/non-evangelical Protestant (7% vs. 12%), and white Catholic (6% vs. 12%). LGBTQ Americans are also less likely than all Americans to identify as Christians of color (19% vs. 25%), though this gap is considerably smaller than the one among white Christians.
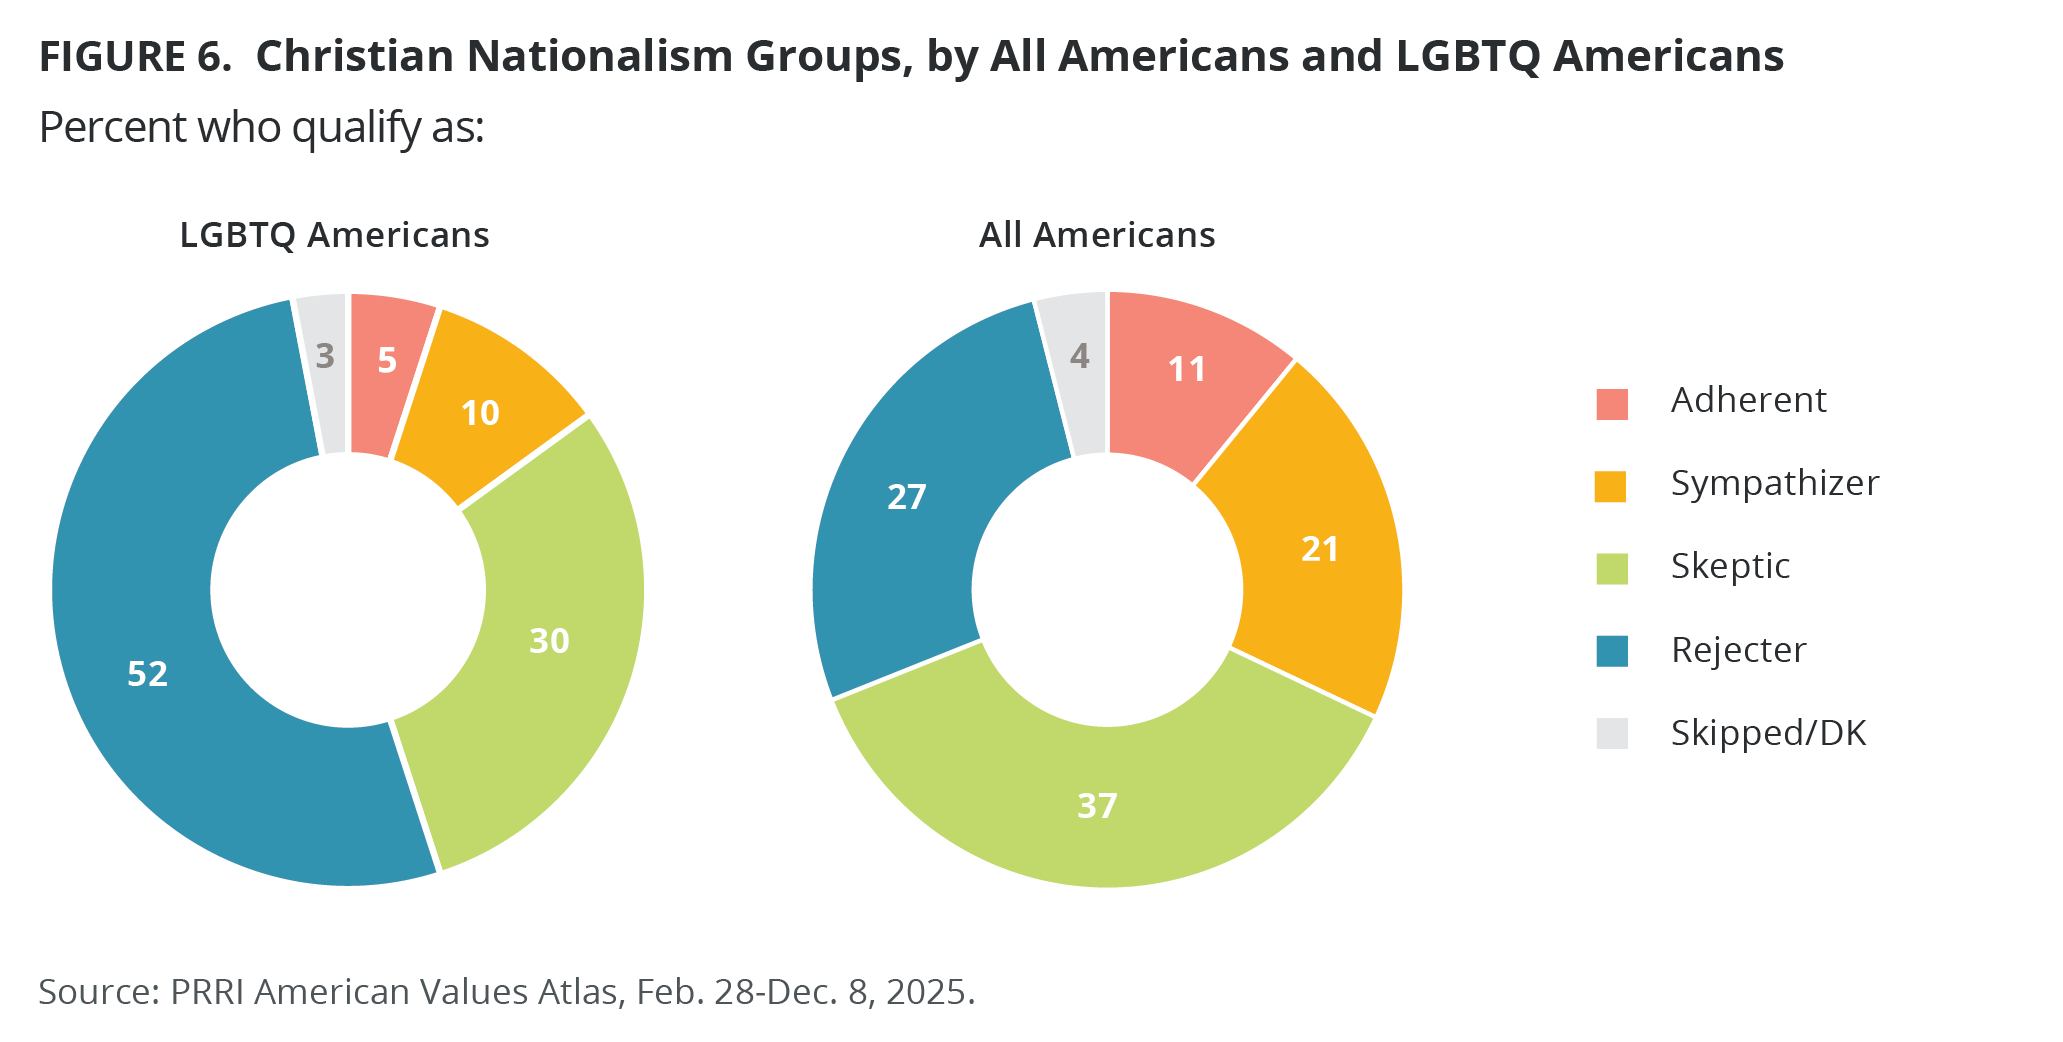
A slim majority of LGBTQ Americans qualify as Christian nationalism Rejecters (52%), roughly twice the rate among all Americans (27%). Correspondingly, LGBTQ Americans are less likely than all Americans to qualify as Christian nationalism Skeptics (30% vs. 37%), Sympathizers (10% vs. 21%), and Adherents (5% vs. 11%).[3]
Attitudes Toward LGBTQ Policies
For the past decade, PRRI has tracked Americans’ support for or opposition to three key LGBTQ-related policies: nondiscrimination laws, religiously based service refusals, and same-sex marriage. The nondiscrimination question is framed as “laws that would protect gay, lesbian, bisexual, and transgender people against discrimination in jobs, public accommodations, and housing.” The service refusal question is worded as “allowing a small business owner in your state to refuse to provide products or services to gay or lesbian people if doing so would violate their religious beliefs” and the same-sex marriage question is worded as “allowing same-sex couples to marry legally.”
Attitudes Toward LGBTQ Policies Over the Past Decade
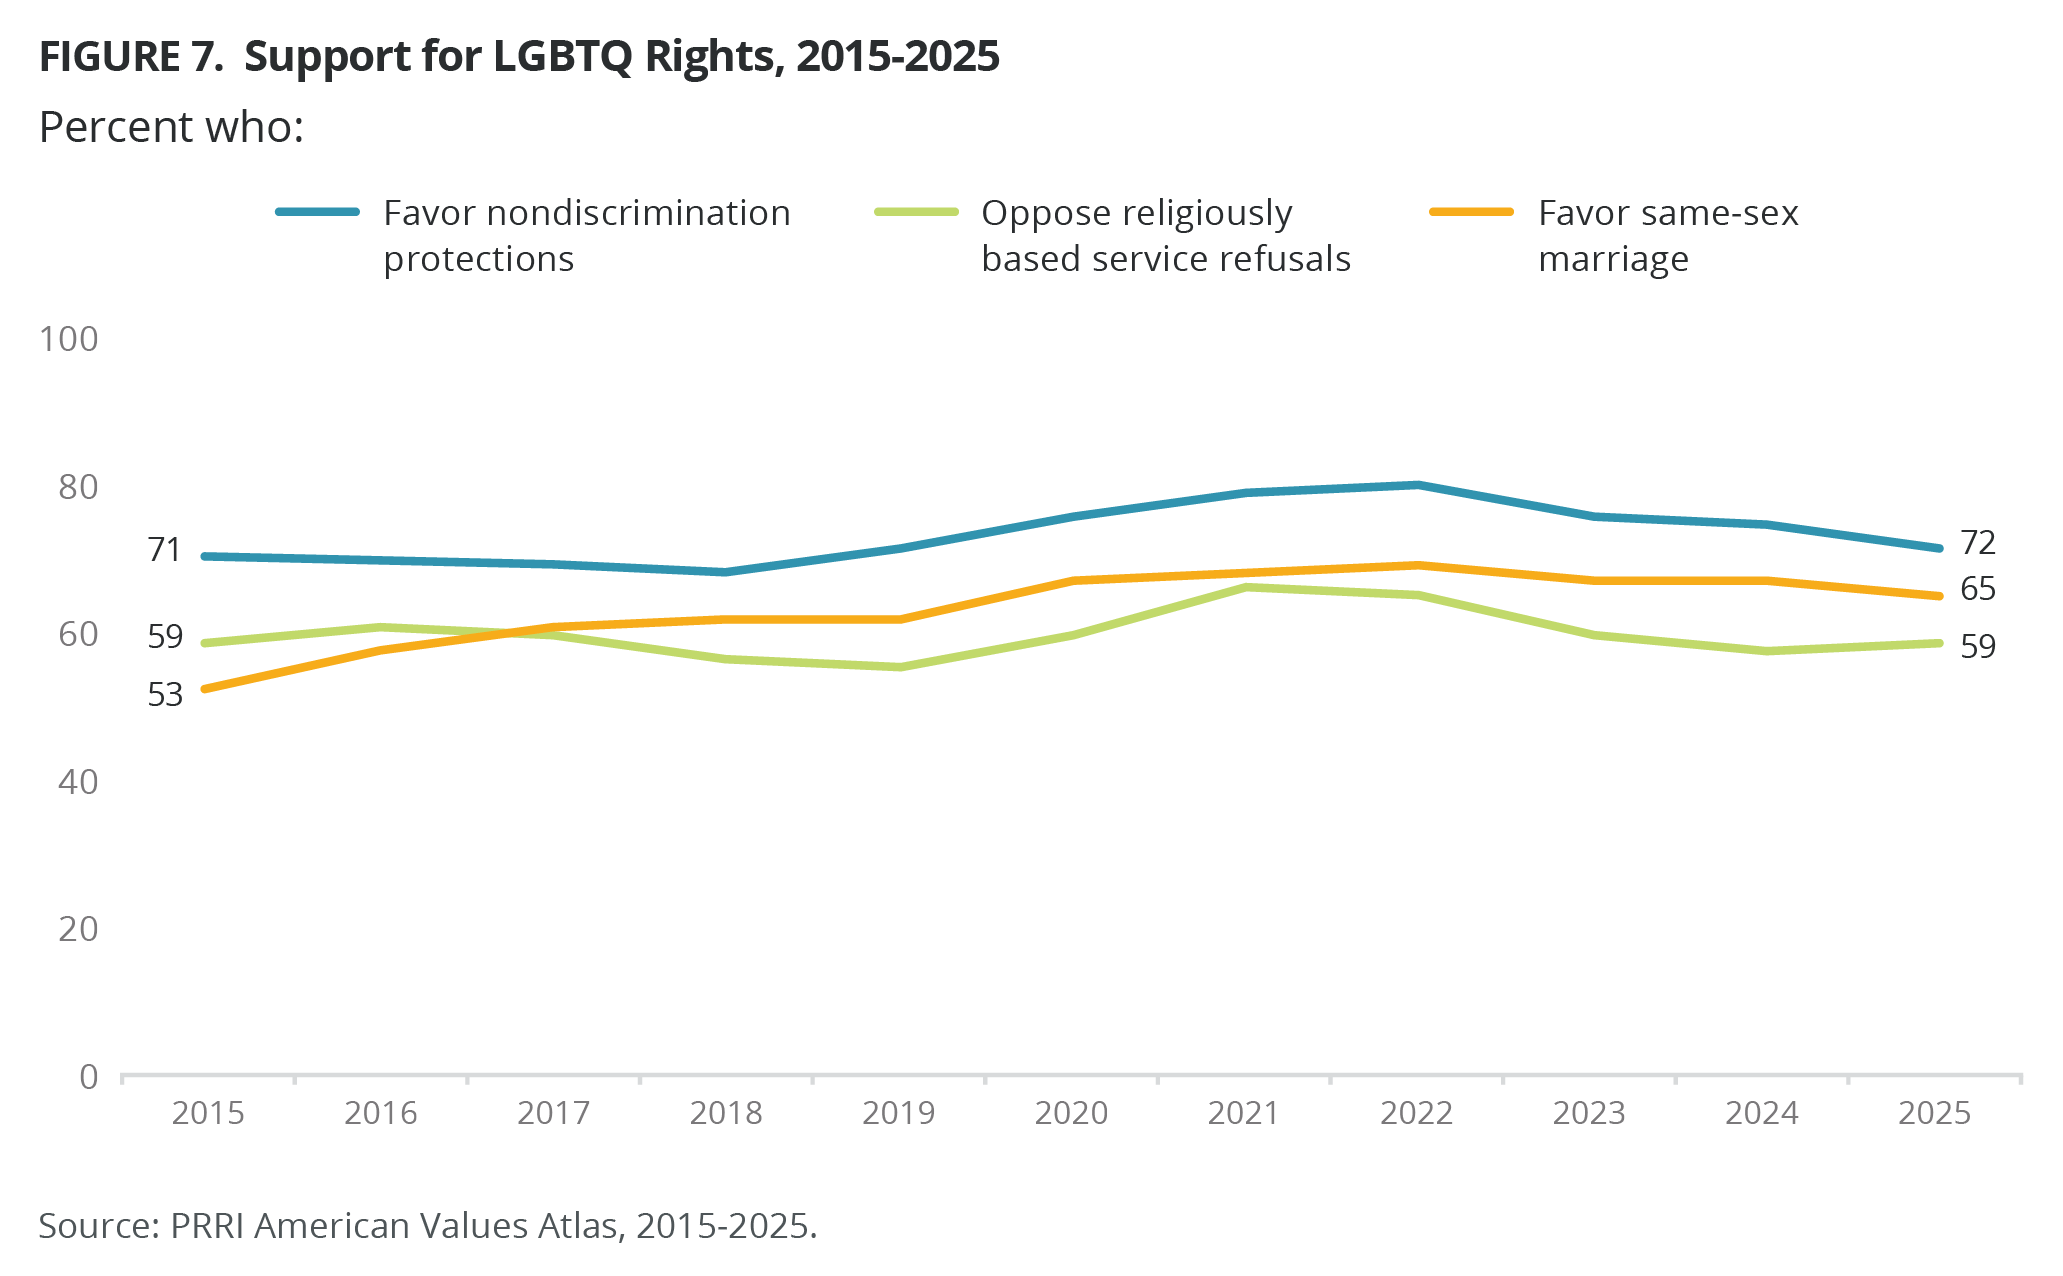
Views on LGBTQ rights have remained broadly supportive over the past decade. Support among Americans for nondiscrimination protections for gay, lesbian, bisexual, and transgender people has stayed consistently high, increasing from 71% in 2015 when the question was first asked to 80% in 2022. Support has since declined to 72% in 2025, similar to 2015 levels.
Opposition to religiously based refusals has fluctuated over time. A majority of Americans have consistently opposed allowing small business owners to refuse service to gay or lesbian customers on religious grounds. Opposition stood at 59% in 2015, increased to 66% in 2021, and declined again to 59% in 2025.
Support for same-sex marriage remains higher today than when PRRI first asked this question. While 53% of Americans favored same-sex marriage in 2015, support increased to 69% by 2022. However, support for same-sex marriage has declined slightly since then, from 67% in both 2023 and 2024 to 65% in 2025.
Though support for LGBTQ rights has remained relatively strong over the past decade, there are differences by states, party, religious affiliation, Christian nationalism groups, and key demographics.
Support for Nondiscrimination Protections
Support for Nondiscrimination Protections in All 50 States
Over eight in ten residents of Massachusetts (85%), the District of Columbia (82%), Maryland (82%), and Alaska (81%) support nondiscrimination laws — well above the national average of 72%. Support in Colorado (71%), Hawaii (71%), and Michigan (71%) is roughly in line with the national average. By contrast, the lowest support for nondiscrimination protections is in Mississippi (60%), Wyoming (57%), and Arkansas (53%).
Party Affiliation
Although majorities of Americans across party lines support nondiscrimination protections for LGBTQ people, Democrats (90%) are more supportive than independents (76%) and Republicans (56%). Since 2015, support has increased by 12 percentage points among Democrats (from 78% to 90%). While Republican support grew from a low of 56% in 2018 to a peak of 66% in 2022, it has declined by 6 percentage points in more recent years, from 62% in 2024 to 56% in 2025. Independents closely mirrored all Americans from 2015-2023. Since 2024, however, they have become noticeably more supportive than all Americans overall (76% vs. 72%, respectively, in 2025).
Religious Affiliation and Christian Nationalism
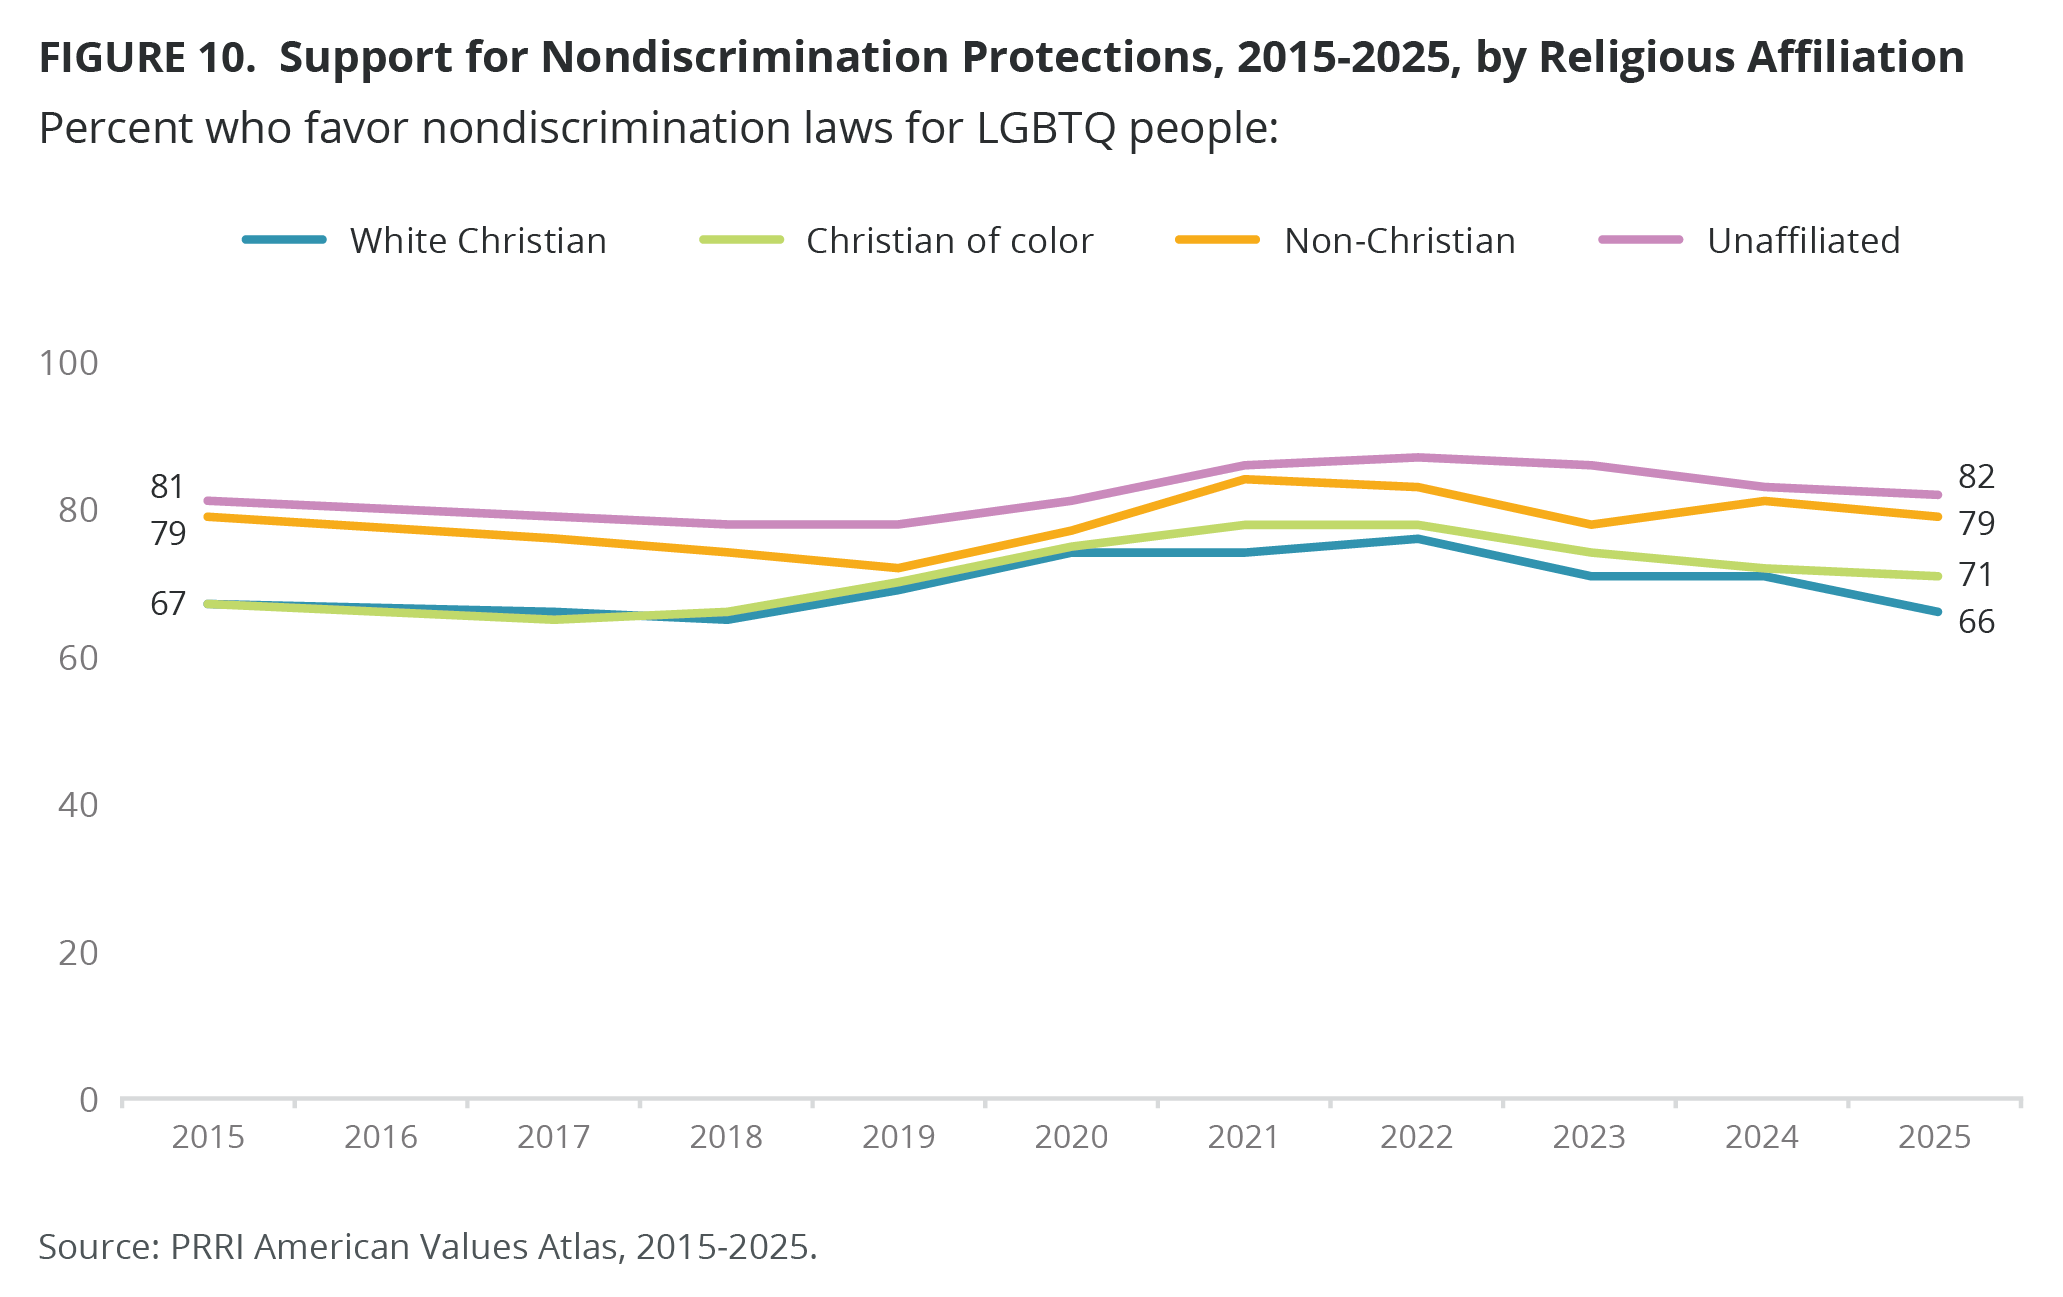
Today, majorities of all religious groups support nondiscrimination laws for LGBTQ people, though support is significantly higher among those who are religiously unaffiliated (82%) and non-Christians (79%), followed by Christians of color (71%) and white Christians (66%). White Christians grew more likely to support these protections, from 67% in 2015 to 76% in 2022, but their support has since declined to 66%. While support for such protections is higher among Christians of color (71%) than white Christians, support among this group has declined from a high of 78% in 2022. Among both the unaffiliated and non-Christians, support went up from roughly eight in ten in 2015 to 86-87% and 83-84%, respectively, in 2021 and 2022, before declining to earlier levels in 2025.
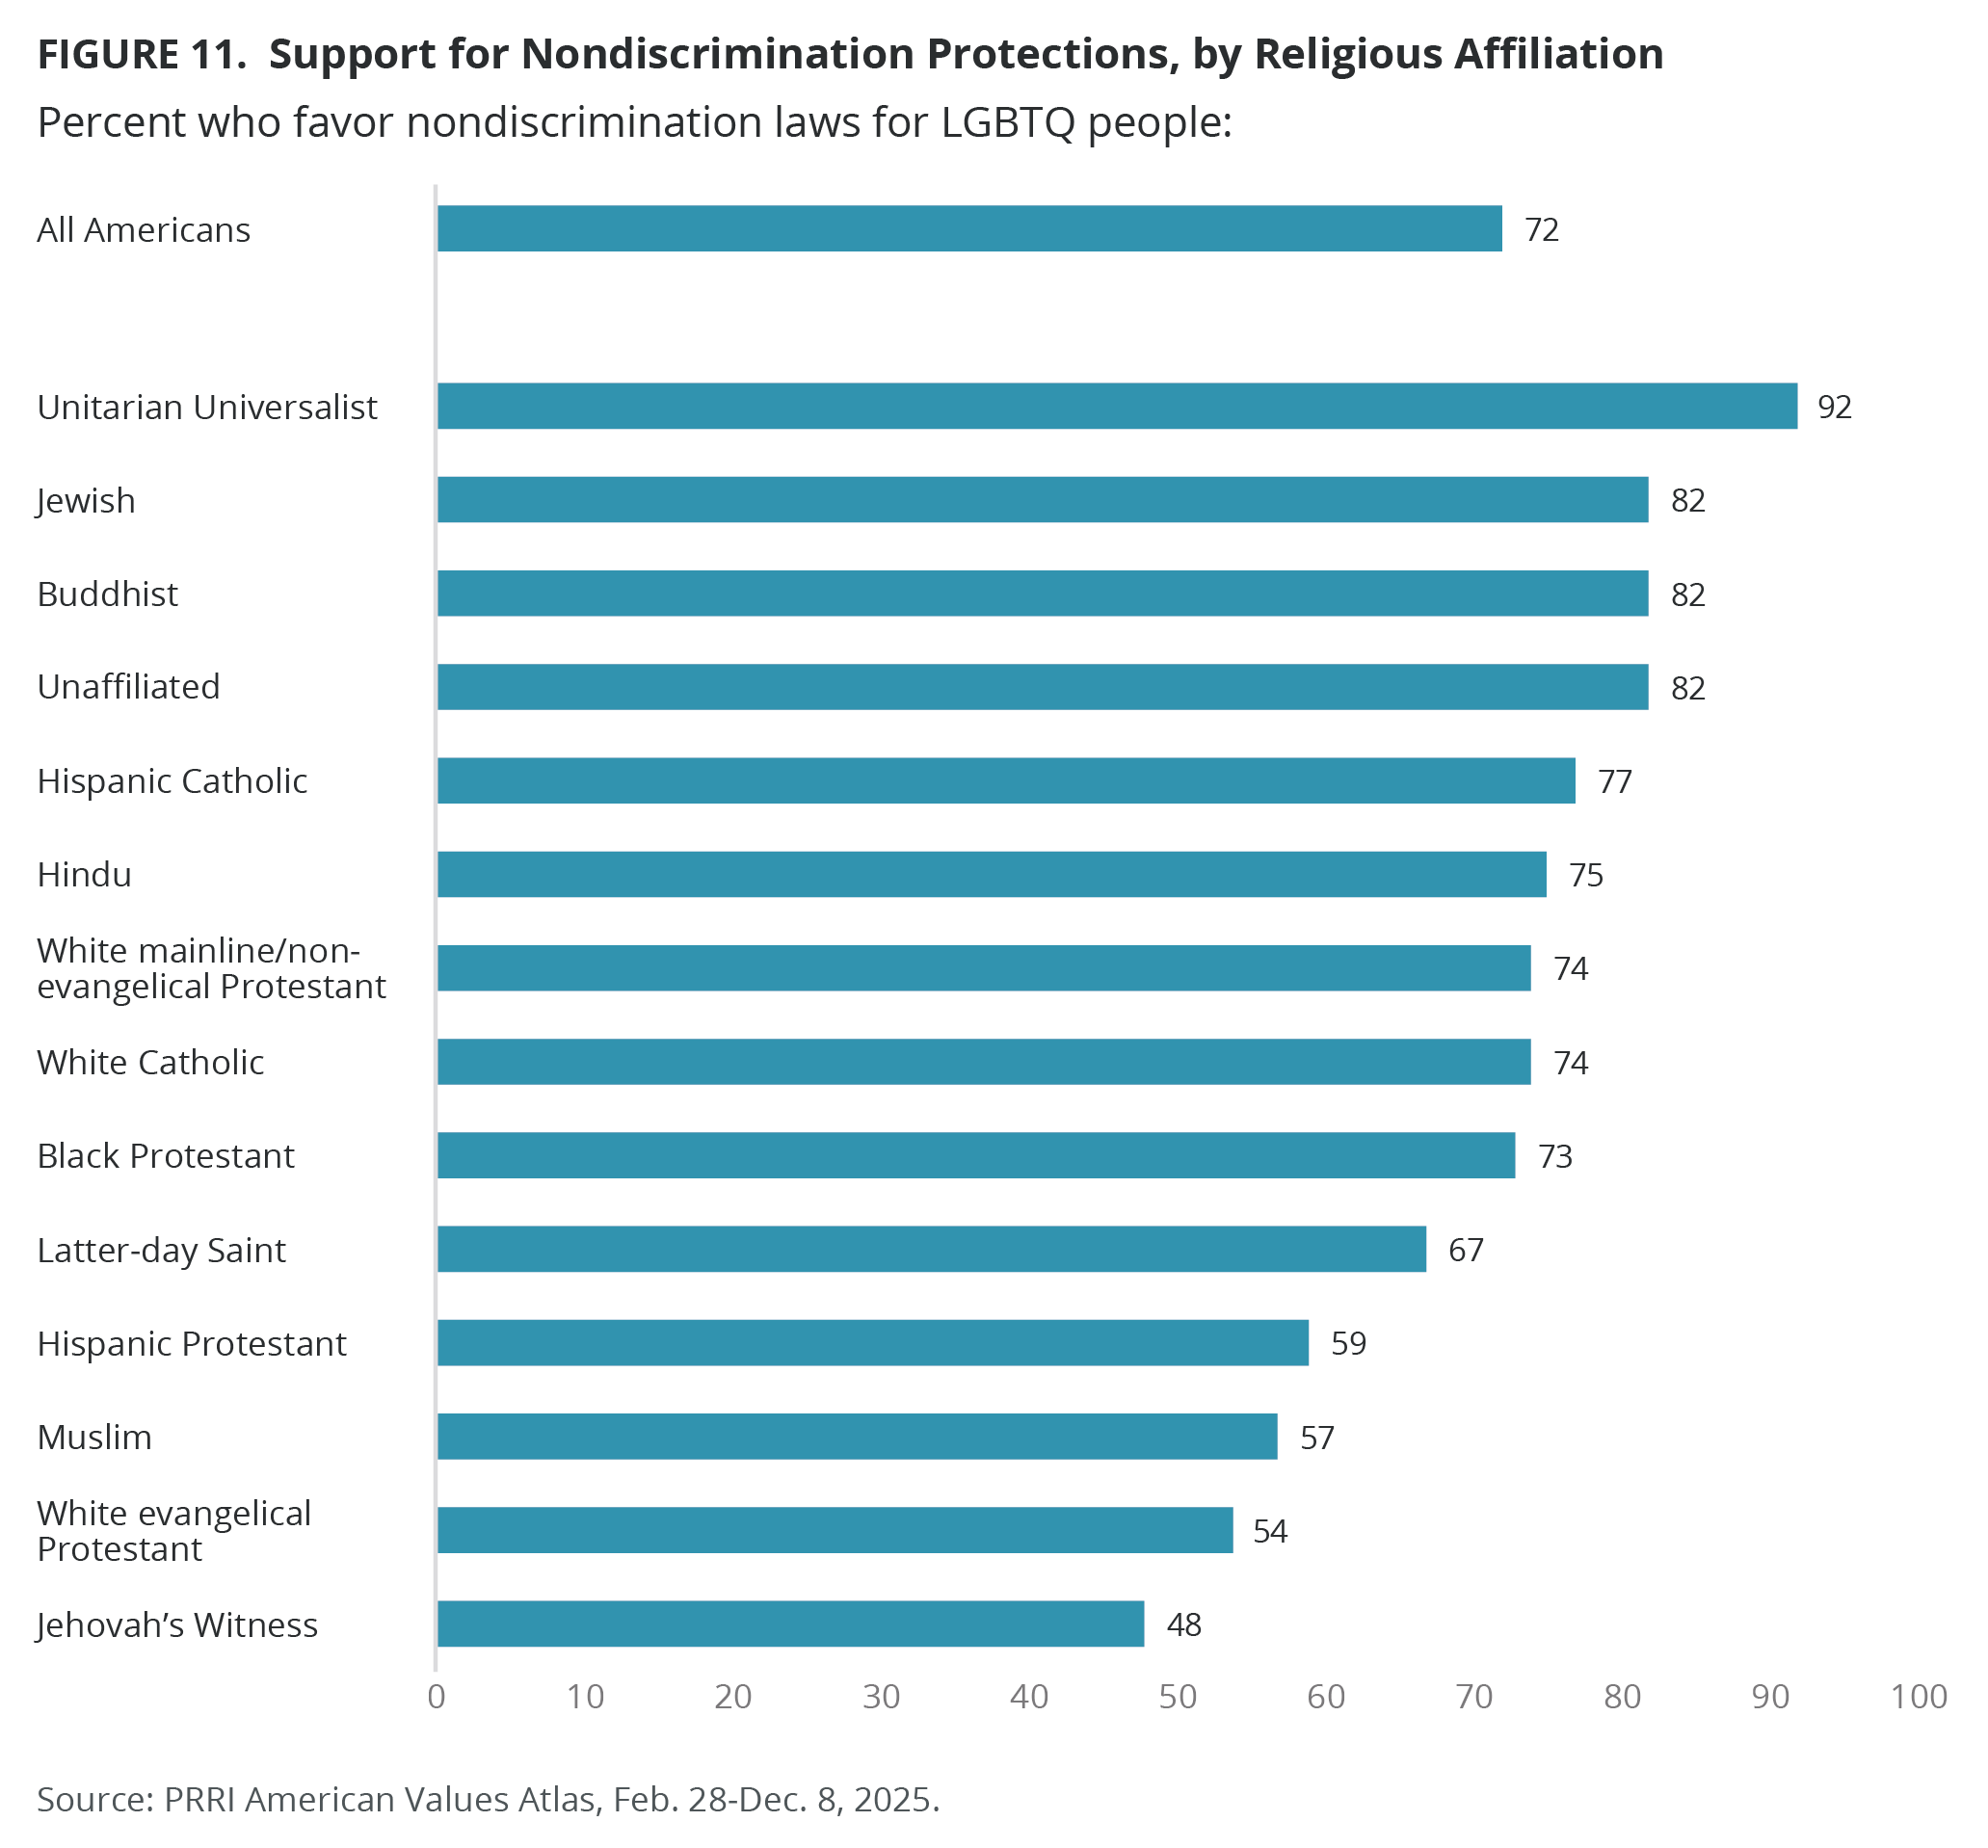
Among white Christian groups, white evangelical Protestants are the least likely to support nondiscrimination protections (54%), about 20 percentage points lower than white mainline/non-evangelical Protestants (74%) and white Catholics (74%). Two-third of Latter-day Saints also show support (67%). Among Christians of color, Hispanic Protestants (59%) are the least likely to support these protections, compared with 73% of Black Protestants and 77% of Hispanic Catholics. Among non-Christians, Muslims (57%) are the least likely to support nondiscrimination protections, while solid majorities of Hindus (75%), Jewish Americans (82%), Buddhists (82%), and Unitarians (92%) express support. Jehovah’s Witnesses (48%) is the only religious group without majority support for nondiscrimination protections.
Christian nationalism Rejecters (91%) are the most likely to support nondiscrimination protections, followed by 77% of Skeptics, 61% of Sympathizers, and 42% of Adherents.
Demographics
In 2025, there is little variation in support for nondiscrimination protections across age groups, with around seven in ten Americans in all age groups in favor. However, young Americans ages 18-29 have experienced a gradual decrease in support over the past decade, from 80% in 2015 to 70% in 2025, largely driven by young Republicans. In 2025, half of Republicans ages 18-29 supported nondiscrimination protections (50%), a 24-point decline from 74% in 2015, when the question was first asked. Independents ages 30-49 have also become less likely to support nondiscrimination protections, from 73% in 2015 to 74% in 2025. By contrast, seniors 65 and over have increased their support from 61% to 74% over the same period, while Americans ages 30-49 and ages 50-64 have remained stable.
Women (74%) and Americans with a four-year degree or higher (78%) are more likely than men (69%) and those without a college degree (67%) to support LGBTQ nondiscrimination laws.
AAPI Americans (77%) are the most likely to support nondiscrimination protections, compared with multiracial (72%), white (72%), Hispanic (72%), and Black Americans (68%).
Opposition to Religiously Based Refusals in All 50 States
About seven in ten residents of Massachusetts (72%), Hawaii (71%), Vermont (71%), and Connecticut (70%), as well as residents in the District of Columbia (70%), show the strongest opposition to religiously based service refusals, about 10 percentage points higher than the national average of 59%. By contrast, the five states with the lowest opposition to religiously based service refusals are Nebraska (48%), Idaho (47%), Missouri (47%), Oklahoma (47%), and West Virginia (44%), significantly lower than the national average.
Party Affiliation
Most Democrats (82%) and independents (60%) oppose religiously based refusals for LGBTQ people, compared with over one-third of Republicans (35%). Since 2015, opposition has increased by 8 percentage points among Democrats (from 74% to 82%). Among Republicans, it has declined by 5 percentage points (from 40% to 35%). Opposition among independents closely mirrors all Americans and has remained stable over time, peaking at 66% in 2021.
Religious Affiliation and Christian Nationalism
Except for white Christian groups (46%), opposition to LGBTQ religiously based refusals remains high among Christians of color (65%), non-Christians (69%), and religiously unaffiliated Americans (72%). Opposition among white Christians grew from 49% in 2015 to 55% in 2020, but has declined since to 46%, slightly lower than in 2015. Opposition among Christians of color grew from 63% in 2015 to 71% in 2022, declined to 60% in 2024, and then rebounded to 65% in 2025. Opposition among non-Christians and religiously unaffiliated Americans peaked in 2021 and 2022 before declining to previous levels in 2025.
Among white Christian groups, white evangelical Protestants (31%) and Latter-day Saints (44%) are the least likely to oppose religiously based refusals for LGBTQ people. Opposition is substantially higher among white mainline/non-evangelical Protestants (55%) and white Catholics (56%). Among Christians of color, Hispanic Catholics (72%) and Black Protestants (69%) are more likely than Hispanic Protestants (54%) to oppose LGBTQ refusals. Among non-Christians, Muslims (58%) are the least likely to oppose religiously based refusals to LGBTQ people, compared with at least two-thirds of Jewish Americans (67%), Buddhists (70%), Unitarians (73%), and Hindus (76%).
Christian nationalism Rejecters (83%) are the most likely to oppose religiously based refusals for LGBTQ people, followed by 62% of Skeptics, 44% of Sympathizers, and 32% of Adherents.
Demographics
Opposition to religiously based refusals for LGBTQ people decreases with age. About six in ten Americans under 30 (61%) and ages 30-49 (62%) oppose, compared with 57% of Americans ages 50-64 and 54% of seniors 65 and over. However, young Americans ages 18-29 have experienced a decrease in opposition from 67% in 2015, again largely driven by young Republicans. In 2025, over one-third of Republicans ages 18-29 opposed religiously based refusals (37%), a 12-point decline from 49% in 2015. Independents ages 30-49 have also become less likely to oppose, from 59% in 2015 to 62% in 2025. Other age groups remained stable over the same period.
While majorities across gender, race, and education oppose religiously based refusals to LGBTQ people, women and Americans of color are more likely to oppose than men and white Americans. There are no differences by levels of education.
Support for Same-Sex Marriage
Support for Same-Sex Marriage in All 50 States
The only states without majority support for same-sex marriage are Mississippi (47%) and Arkansas (50%). Majorities in every other state and the District of Columbia support same-sex marriage, with the highest support in Massachusetts (85%), Rhode Island (85%), and Vermont (81%). In contrast, in addition to Mississippi and Arkansas, states with the least support include Oklahoma (53%), Louisiana (53%), and West Virginia (52%).
Party Affiliation
Over eight in ten Democrats (83%) support same-sex marriage, a 17-percentage-point increase from 66% in 2015. Similarly, seven in ten independents (69%) also favor same-sex marriage, up 11 points from 58% in 2015, though down 4 points from their 2022 peak of 73%. Support for same-sex marriage among independents has remained consistently higher than the national average, by about 4 percentage points, over the past decade. Republicans remain less supportive of same-sex marriage than Democrats and independents, but their support has grown considerably, from 34% in 2015 to 49% in 2025.
Religious Affiliation and Christian Nationalism
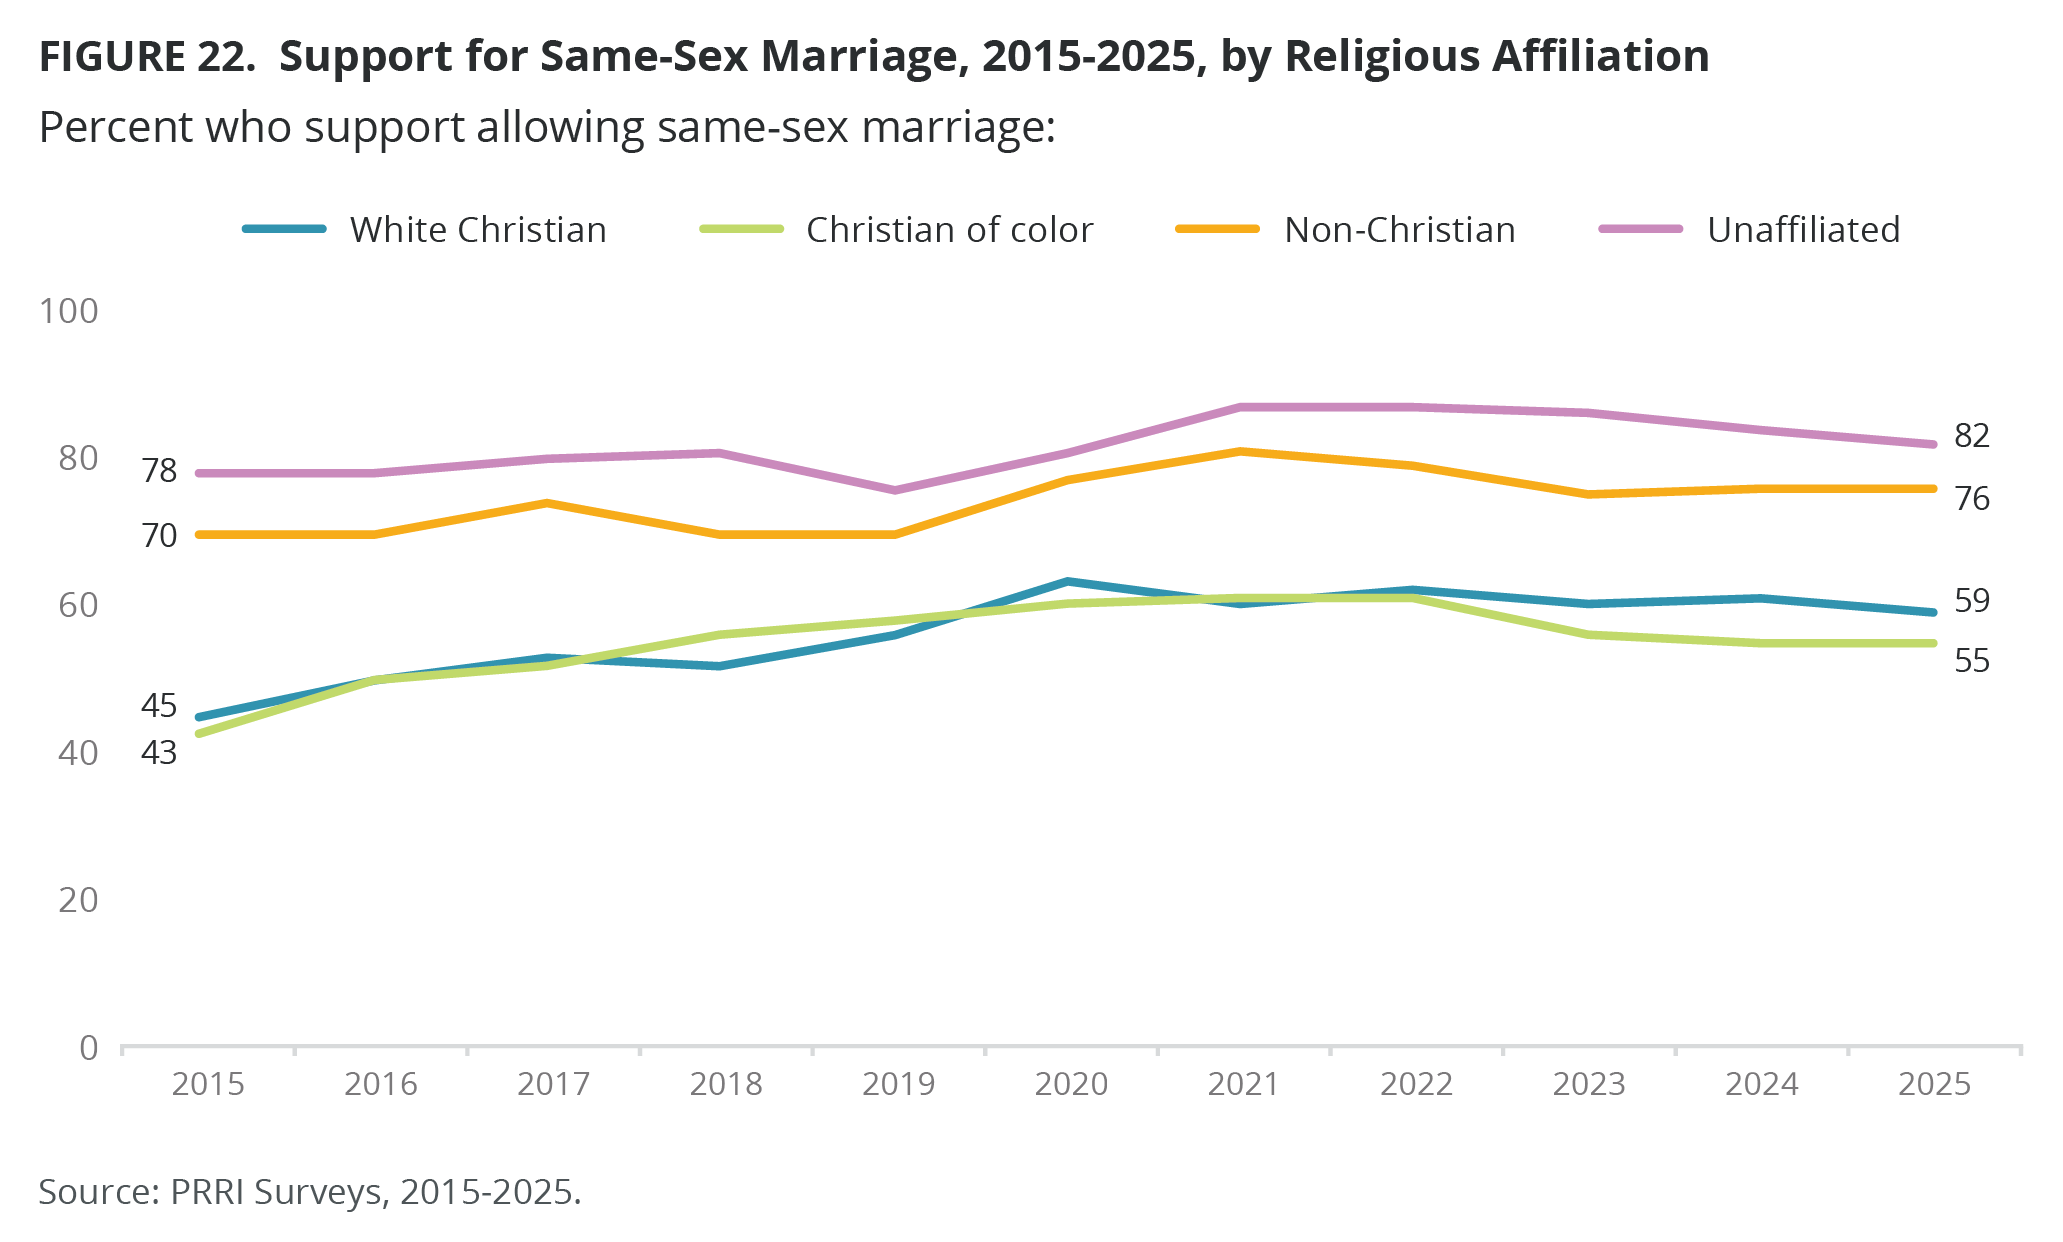
Most religious groups have shown substantial gains in support for same-sex marriage over time, with peaks in 2021 and 2022. White Christians have shown the greatest and most steady increase in support, going from 45% in 2015 to 59% in 2025. Christians of color also show a significant increase in support, from 43% in 2015 to a high of 61% in 2021, before declining to 55% in 2025 — still 12 percentage points higher than in 2015. Support among non-Christians has also grown, from 70% in 2015 to 76% in 2025, with a peak of 81% in 2021. By contrast, support among religiously unaffiliated Americans has remained relatively stable, increasing modestly from 78% to 82% over the same period, with a peak of 87% in 2021.
Among white Christian groups, white evangelical Protestants are the least likely to support same-sex marriage (37%), roughly 35 percentage points lower than white mainline/non-evangelical Protestants (75%) and white Catholics (71%). Nearly half of Latter-day Saints also show support (47%). Among Christians of color, about half of Hispanic Protestants (45%) and Black Protestants (51%) support same-sex marriage, compared with two-thirds of Hispanic Catholics (67%). Among non-Christians, Muslims (37%) are the least supportive, while solid majorities of Unitarians (93%), Buddhists (88%), and Jewish Americans (80%), as well as two-thirds of Hindus (68%), support same-sex marriage. By contrast, just 19% of Jehovah’s Witnesses are in favor.
Nearly all Christian nationalism Rejecters (93%) and three-fourths of Skeptics (73%) support same-sex marriage, compared with 46% of Sympathizers and 22% of Adherents.
Demographics
Younger Americans remain more supportive of same-sex marriage than Americans older than 50, with two-thirds of those ages 18-29 (67%) in favor. However, support among young Americans declined slightly from 71% in 2015 to 67% in 2025, a shift largely driven by young independents. Support among Democrats 18-29 grew from 80% to 87%, while remaining stable among Republicans in the same age group. By contrast, support among young independents declined from 75% to 64%. Over the last decade, support among Americans 30-49 and 50-64 increased by more than 10 percentage points, from 56% to 68% and 48% to 63%, respectively. Among senior Americans, support for same-sex marriage increased by 20 percentage points, from 41% to 61%.
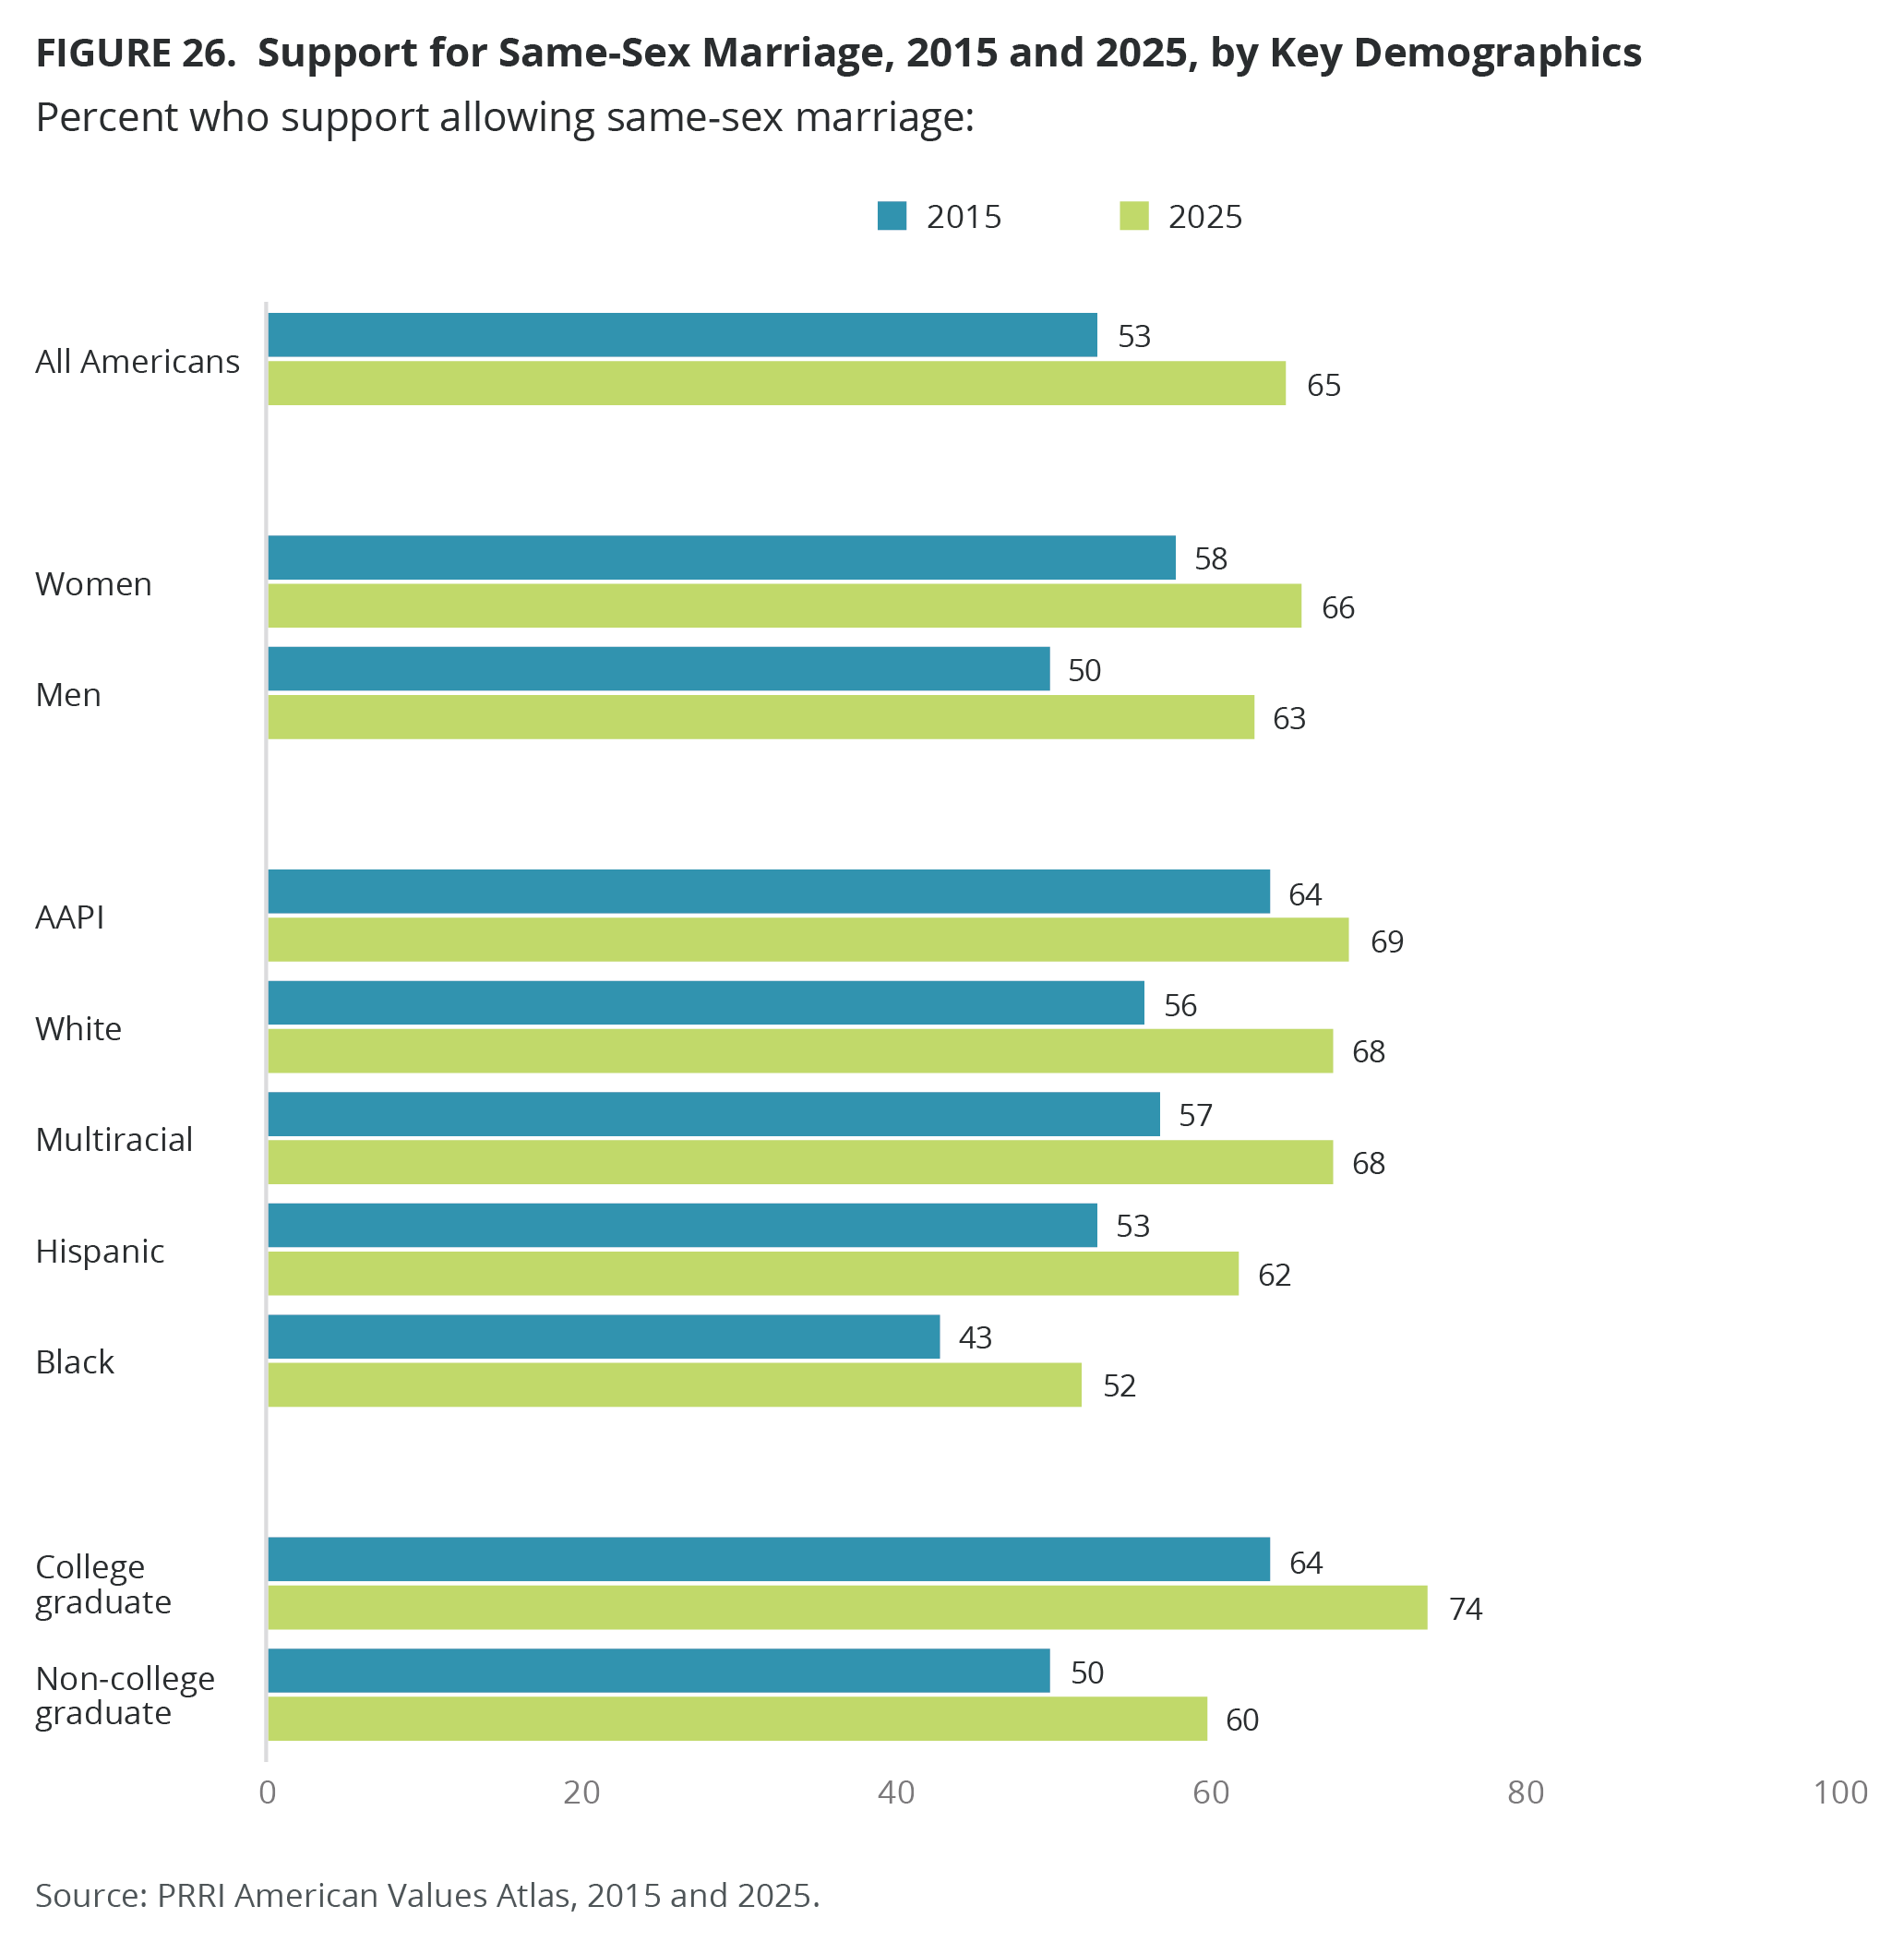
Women (66%) and men (63%) show similar levels of support for same-sex marriage. However, both represent notable increases from 58% and 50%, respectively, in 2015. Support is highest among multiracial (68%), AAPI (69%), and white (68%) Americans, followed by Hispanic (62%) and Black (52%) Americans. Support for same-sex marriage is higher among those with at least a four-year degree (74%) than those without a college degree (60%). Support for same-sex marriage has increased significantly across all racial groups and education levels since 2015.
Views on Transgender Rights
Transgender People Deserve the Same Rights and Protections as Other Americans
A large majority of Americans (71%) agree that “transgender people deserve the same rights and protections as other Americans,” compared with 24% of those who disagree. This is split across party lines with 88% of Democrats and 77% of independents in agreement, compared with 57% of Republicans.
Solid majorities of all religious groups agree that transgender people deserve the same rights and protections as other Americans, including about eight in ten Jewish Americans (85%), members of other non-Christian religions (80%), and religiously unaffiliated Americans (80%). This is followed by around three-quarters of Latter-day Saints (76%), Hispanic Catholics (75%), white mainline/non-evangelical Protestants (75%), white Catholics (73%), and Black Protestants (71%), as well as around six in ten Hispanic Protestants (61%) and white evangelical Protestants (56%).
Among Christian nationalism Adherents, only 40% agree that transgender people deserve the same rights and protections of other Americans, compared with majorities of Christian nationalism Sympathizers (60%), Skeptics (76%), and Rejecters (92%).
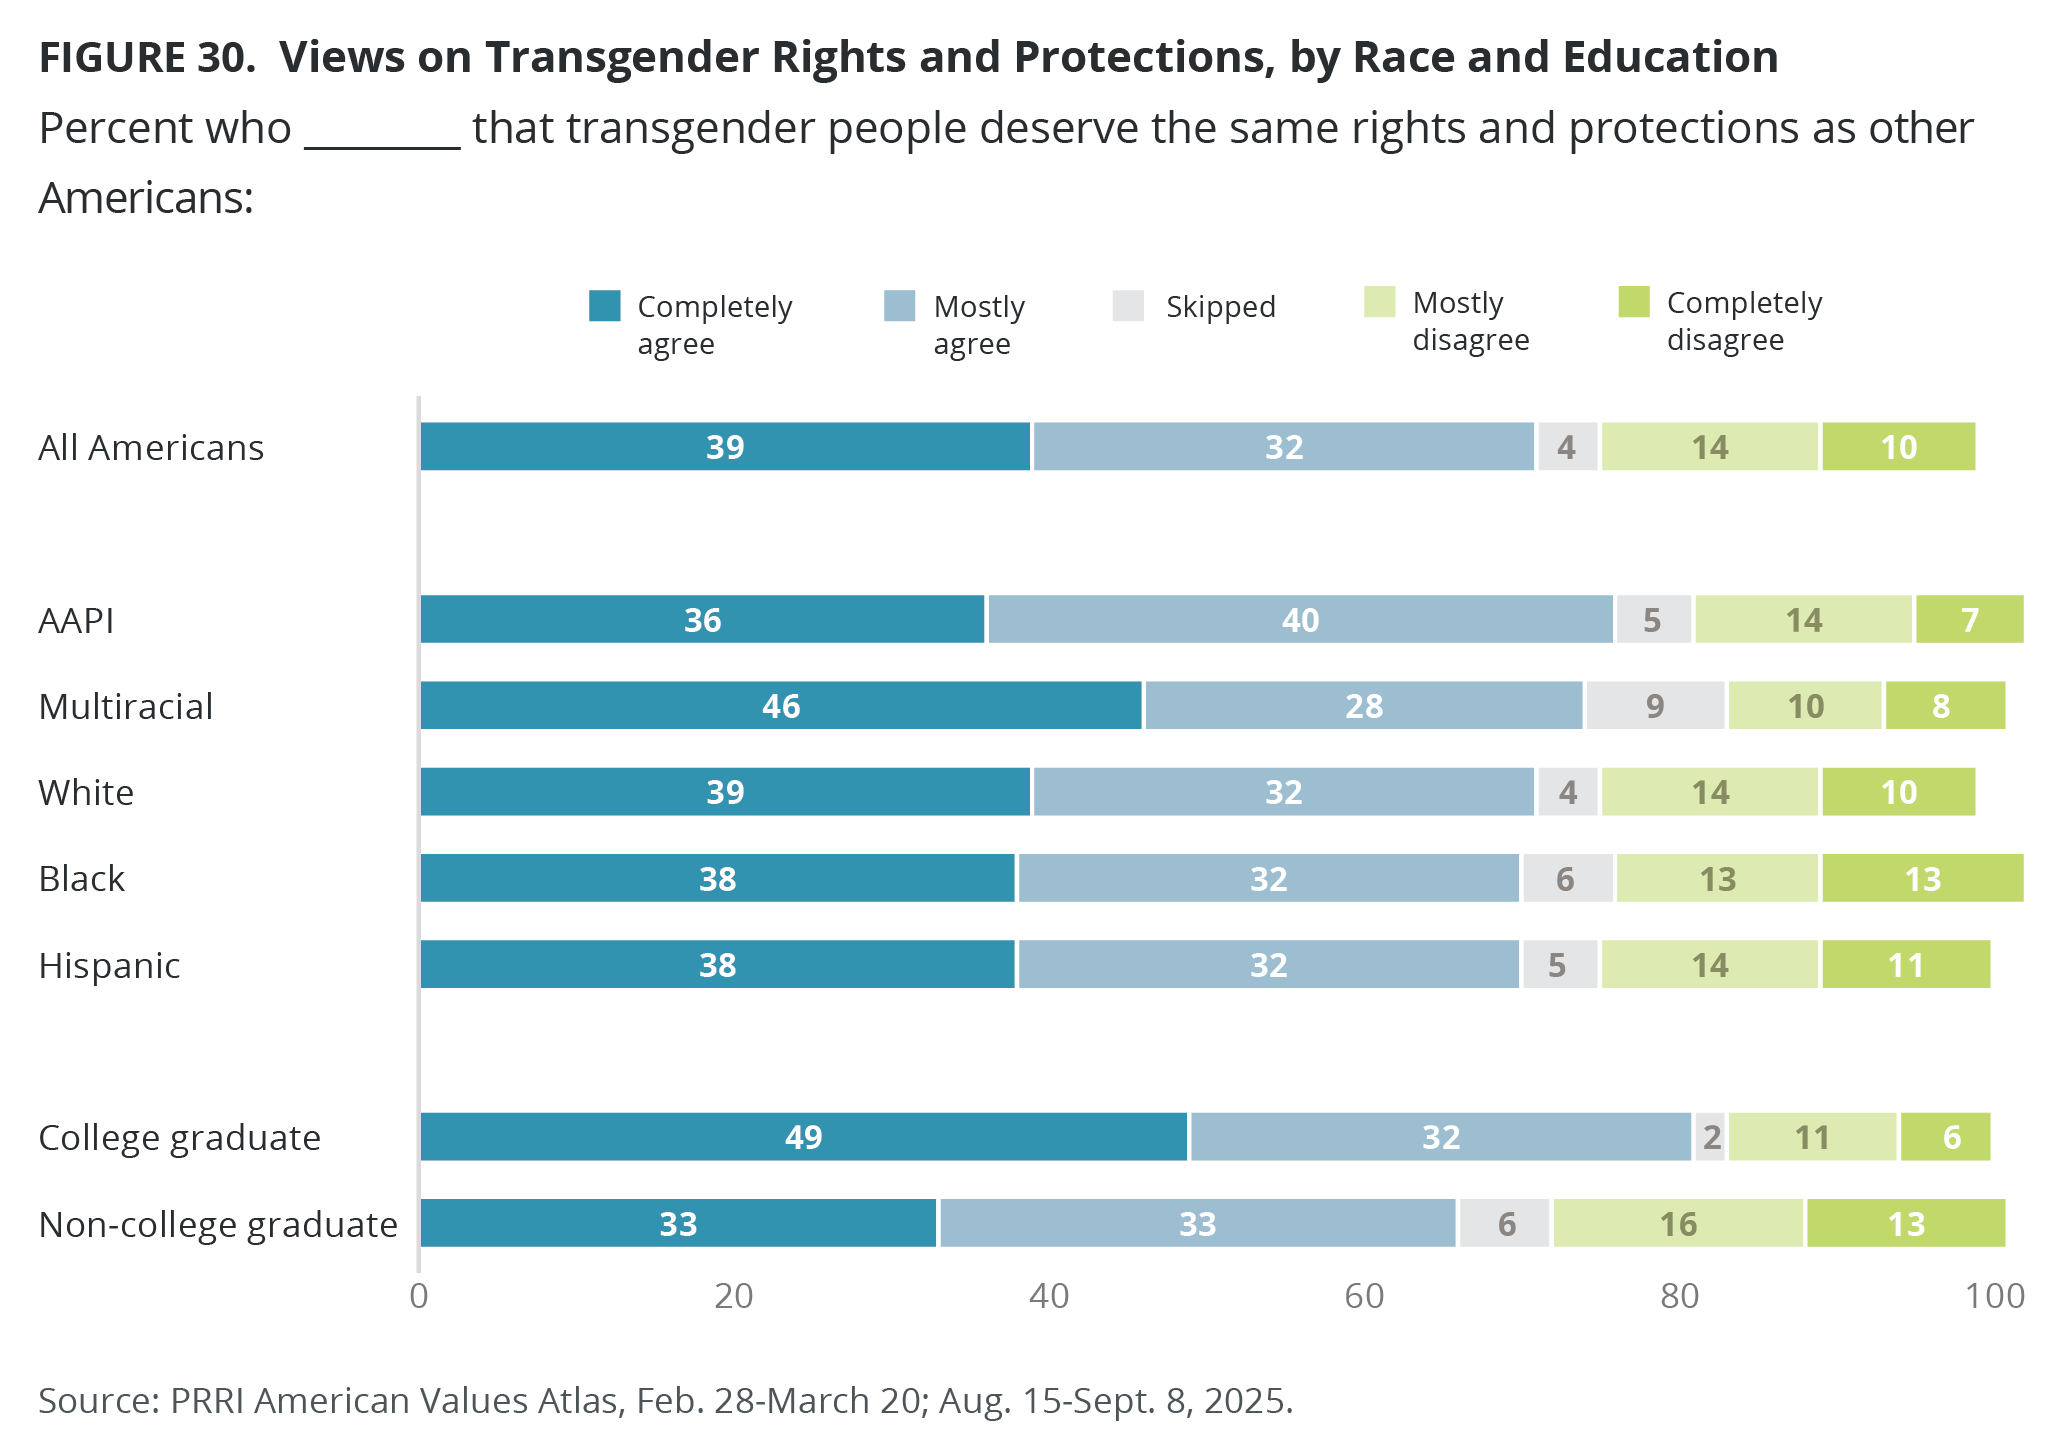
There are little differences across age and gender, but some differences across racial groups and education levels with respect to views on rights and protections for transgender Americans. Roughly seven in ten white (71%), Black (70%), and Hispanic (70%) Americans agree that transgender people deserve equal rights and protections, while support is slightly higher among AAPI (76%) and multiracial (74%) Americans. Similarly, two-thirds of Americans without a college degree (66%) support such rights and protections, compared with 81% of college graduates.
Requiring Transgender People to Use Bathrooms of Sex Assigned at Birth
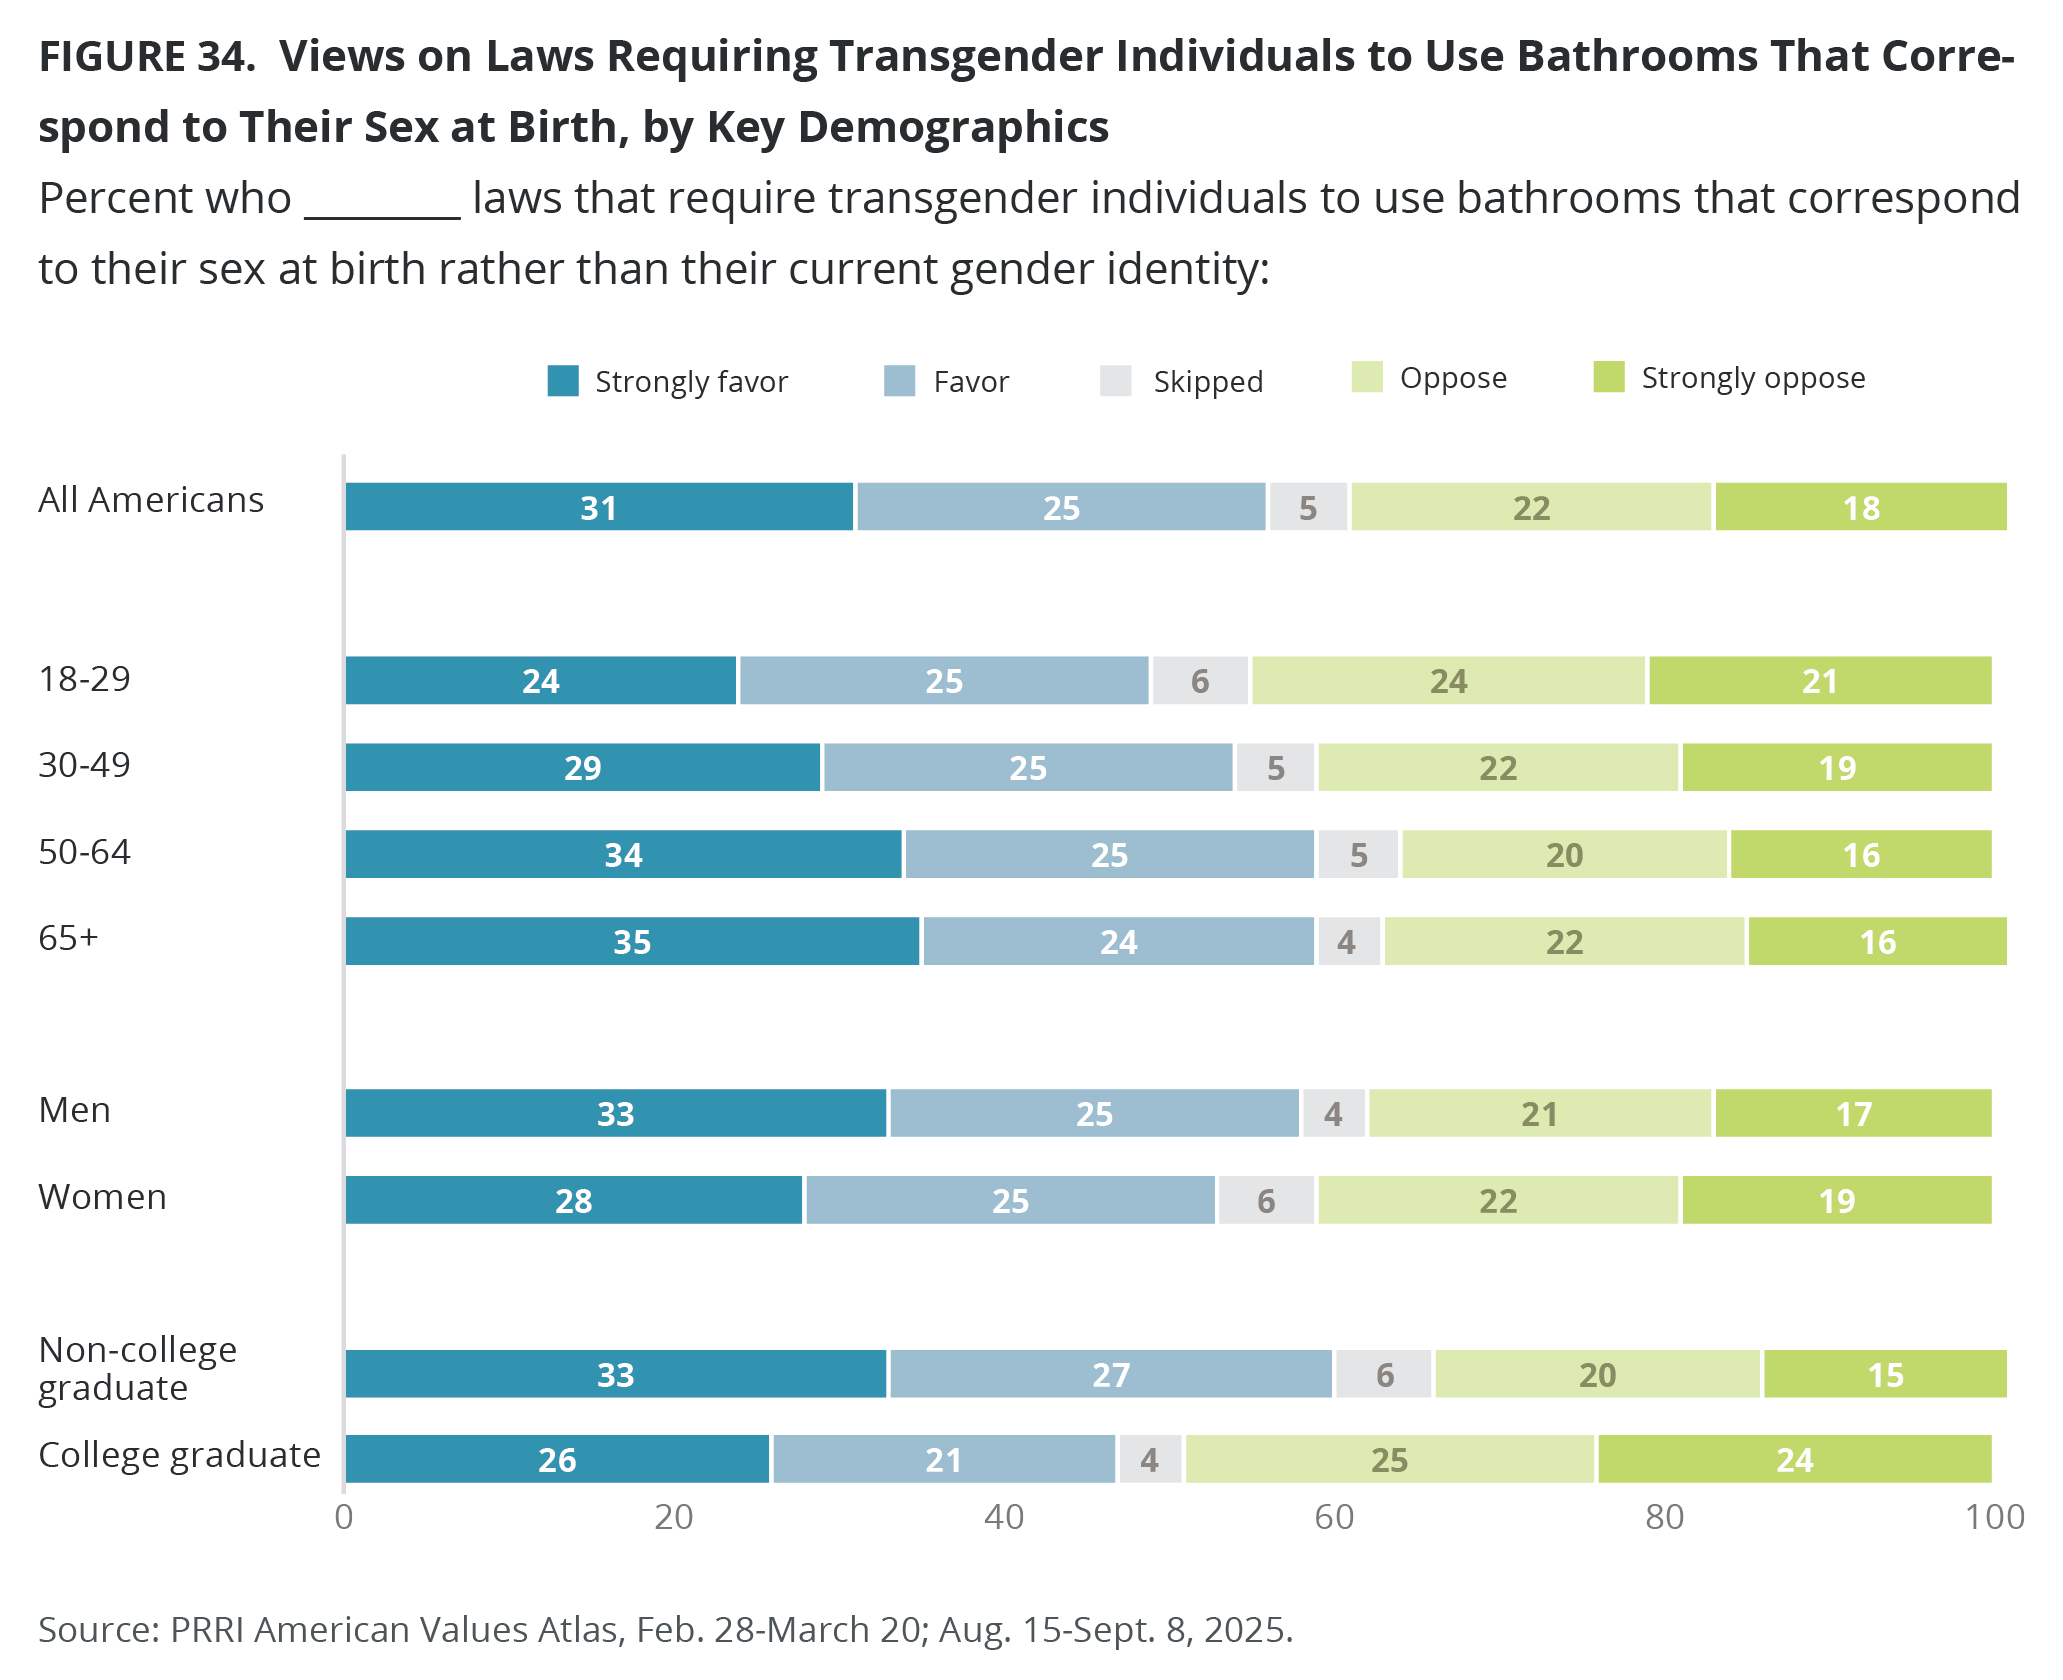
The majority of Americans (56%) favor laws that require transgender individuals to use bathrooms that correspond to their sex at birth rather than their current gender identity; four in ten Americans (40%) oppose such laws. By September 2025, support for these laws increased nearly 20 percentage points since the question was first asked in 2016 (35% to 54%).
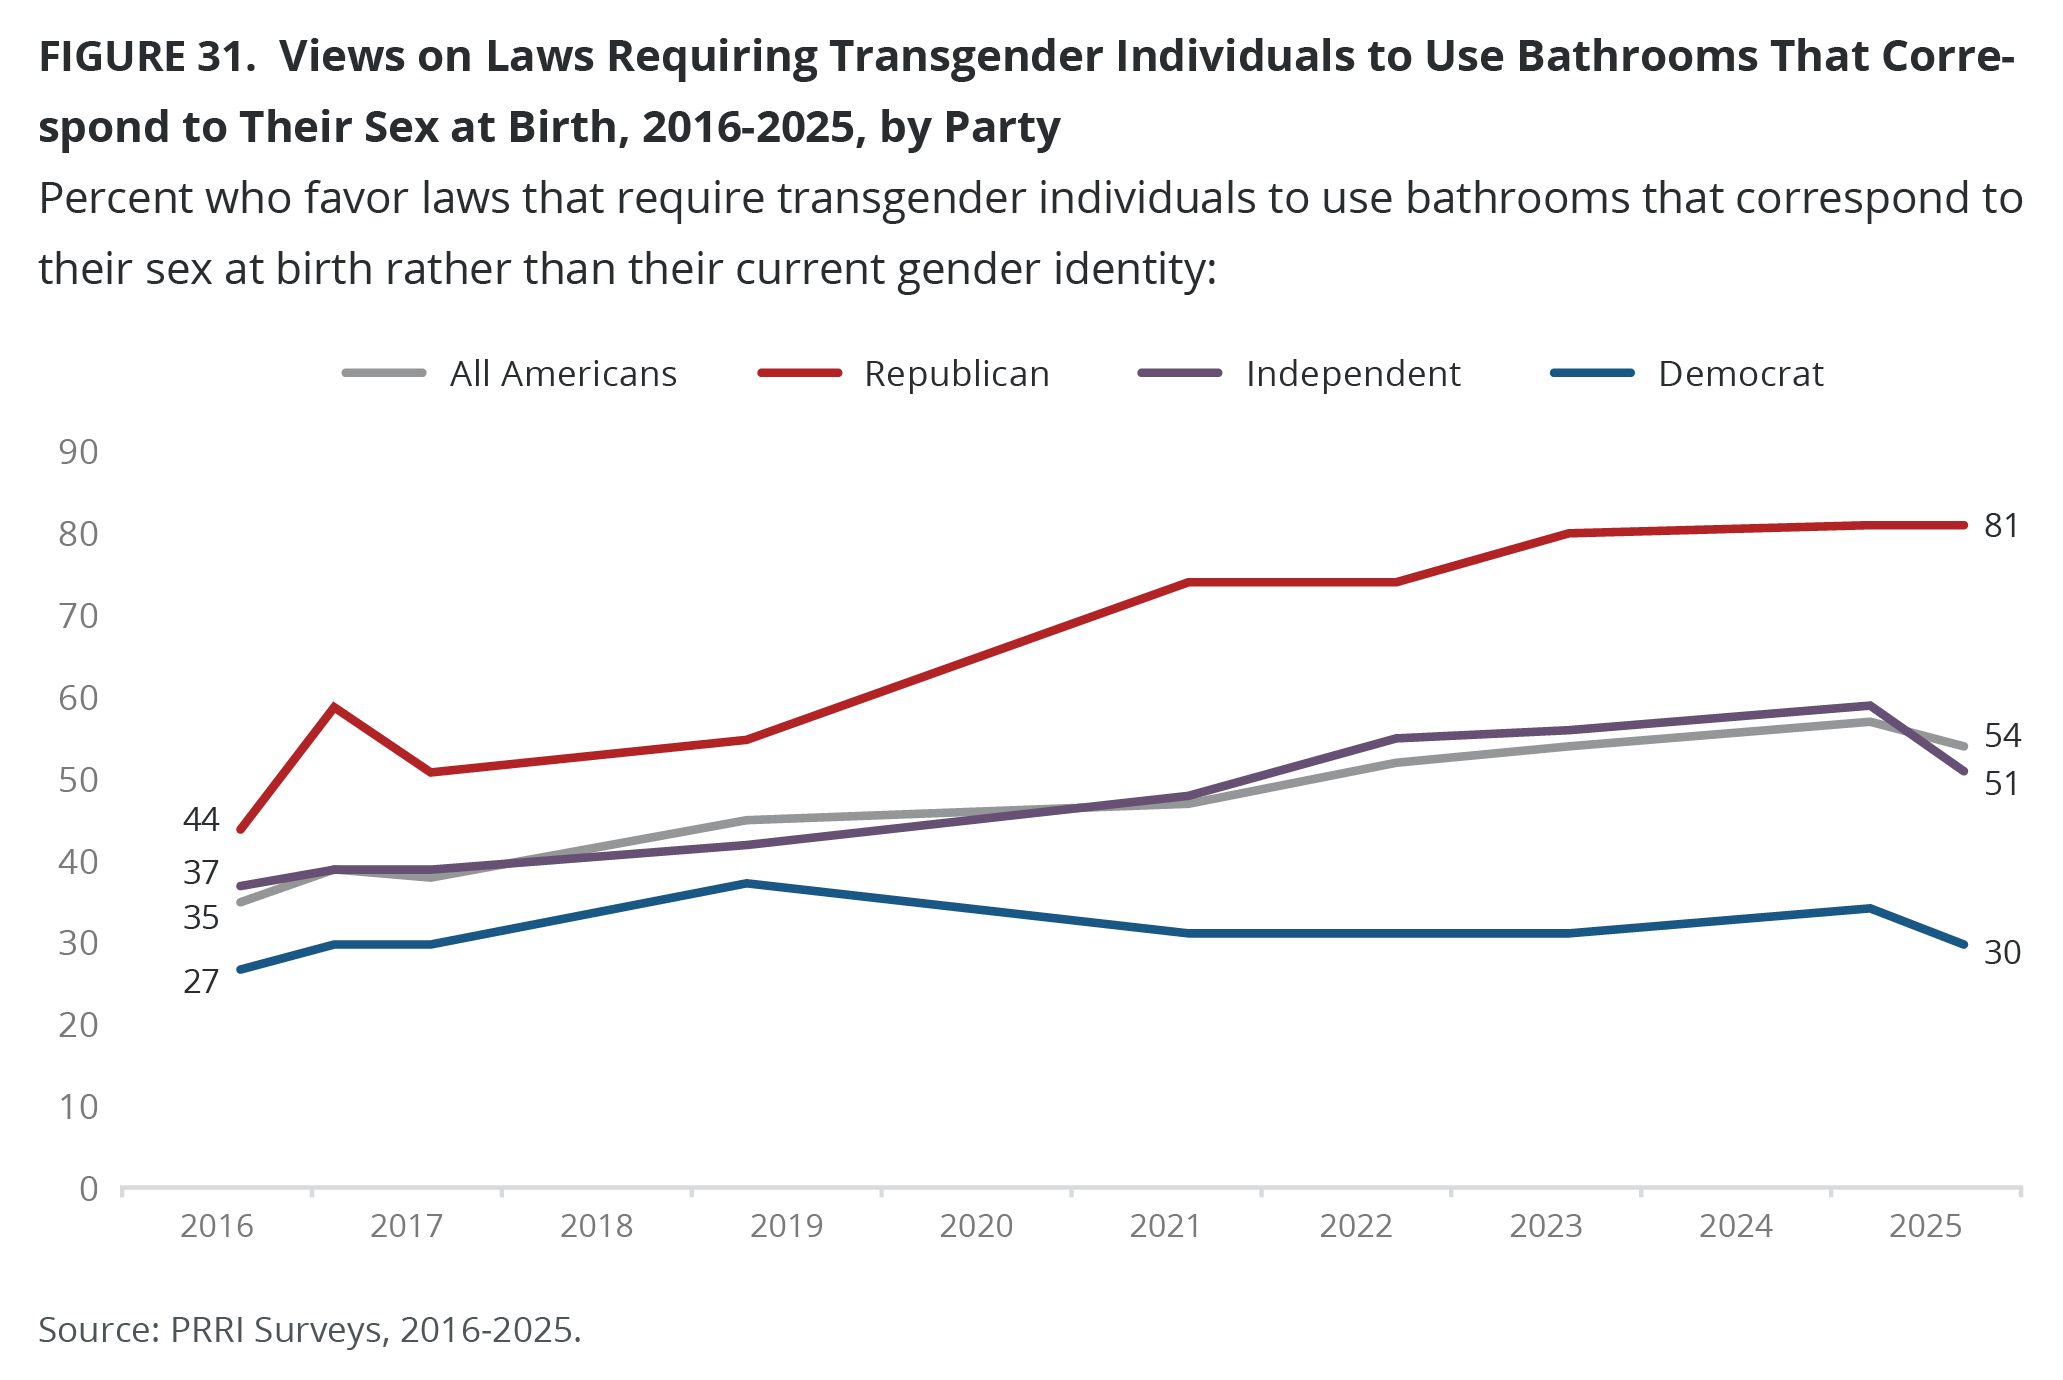
More than eight in ten Republicans (81%) favor requiring transgender people to use bathrooms that correspond to their sex at birth, compared with 51% of independents and 30% of Democrats. Support among Republicans has nearly doubled since 2016 (44%), while support among independents increased from 37% to 51%. By contrast, Democrats have only shown a slight increase in support over the past decade, from 27% to 30% in September 2025.
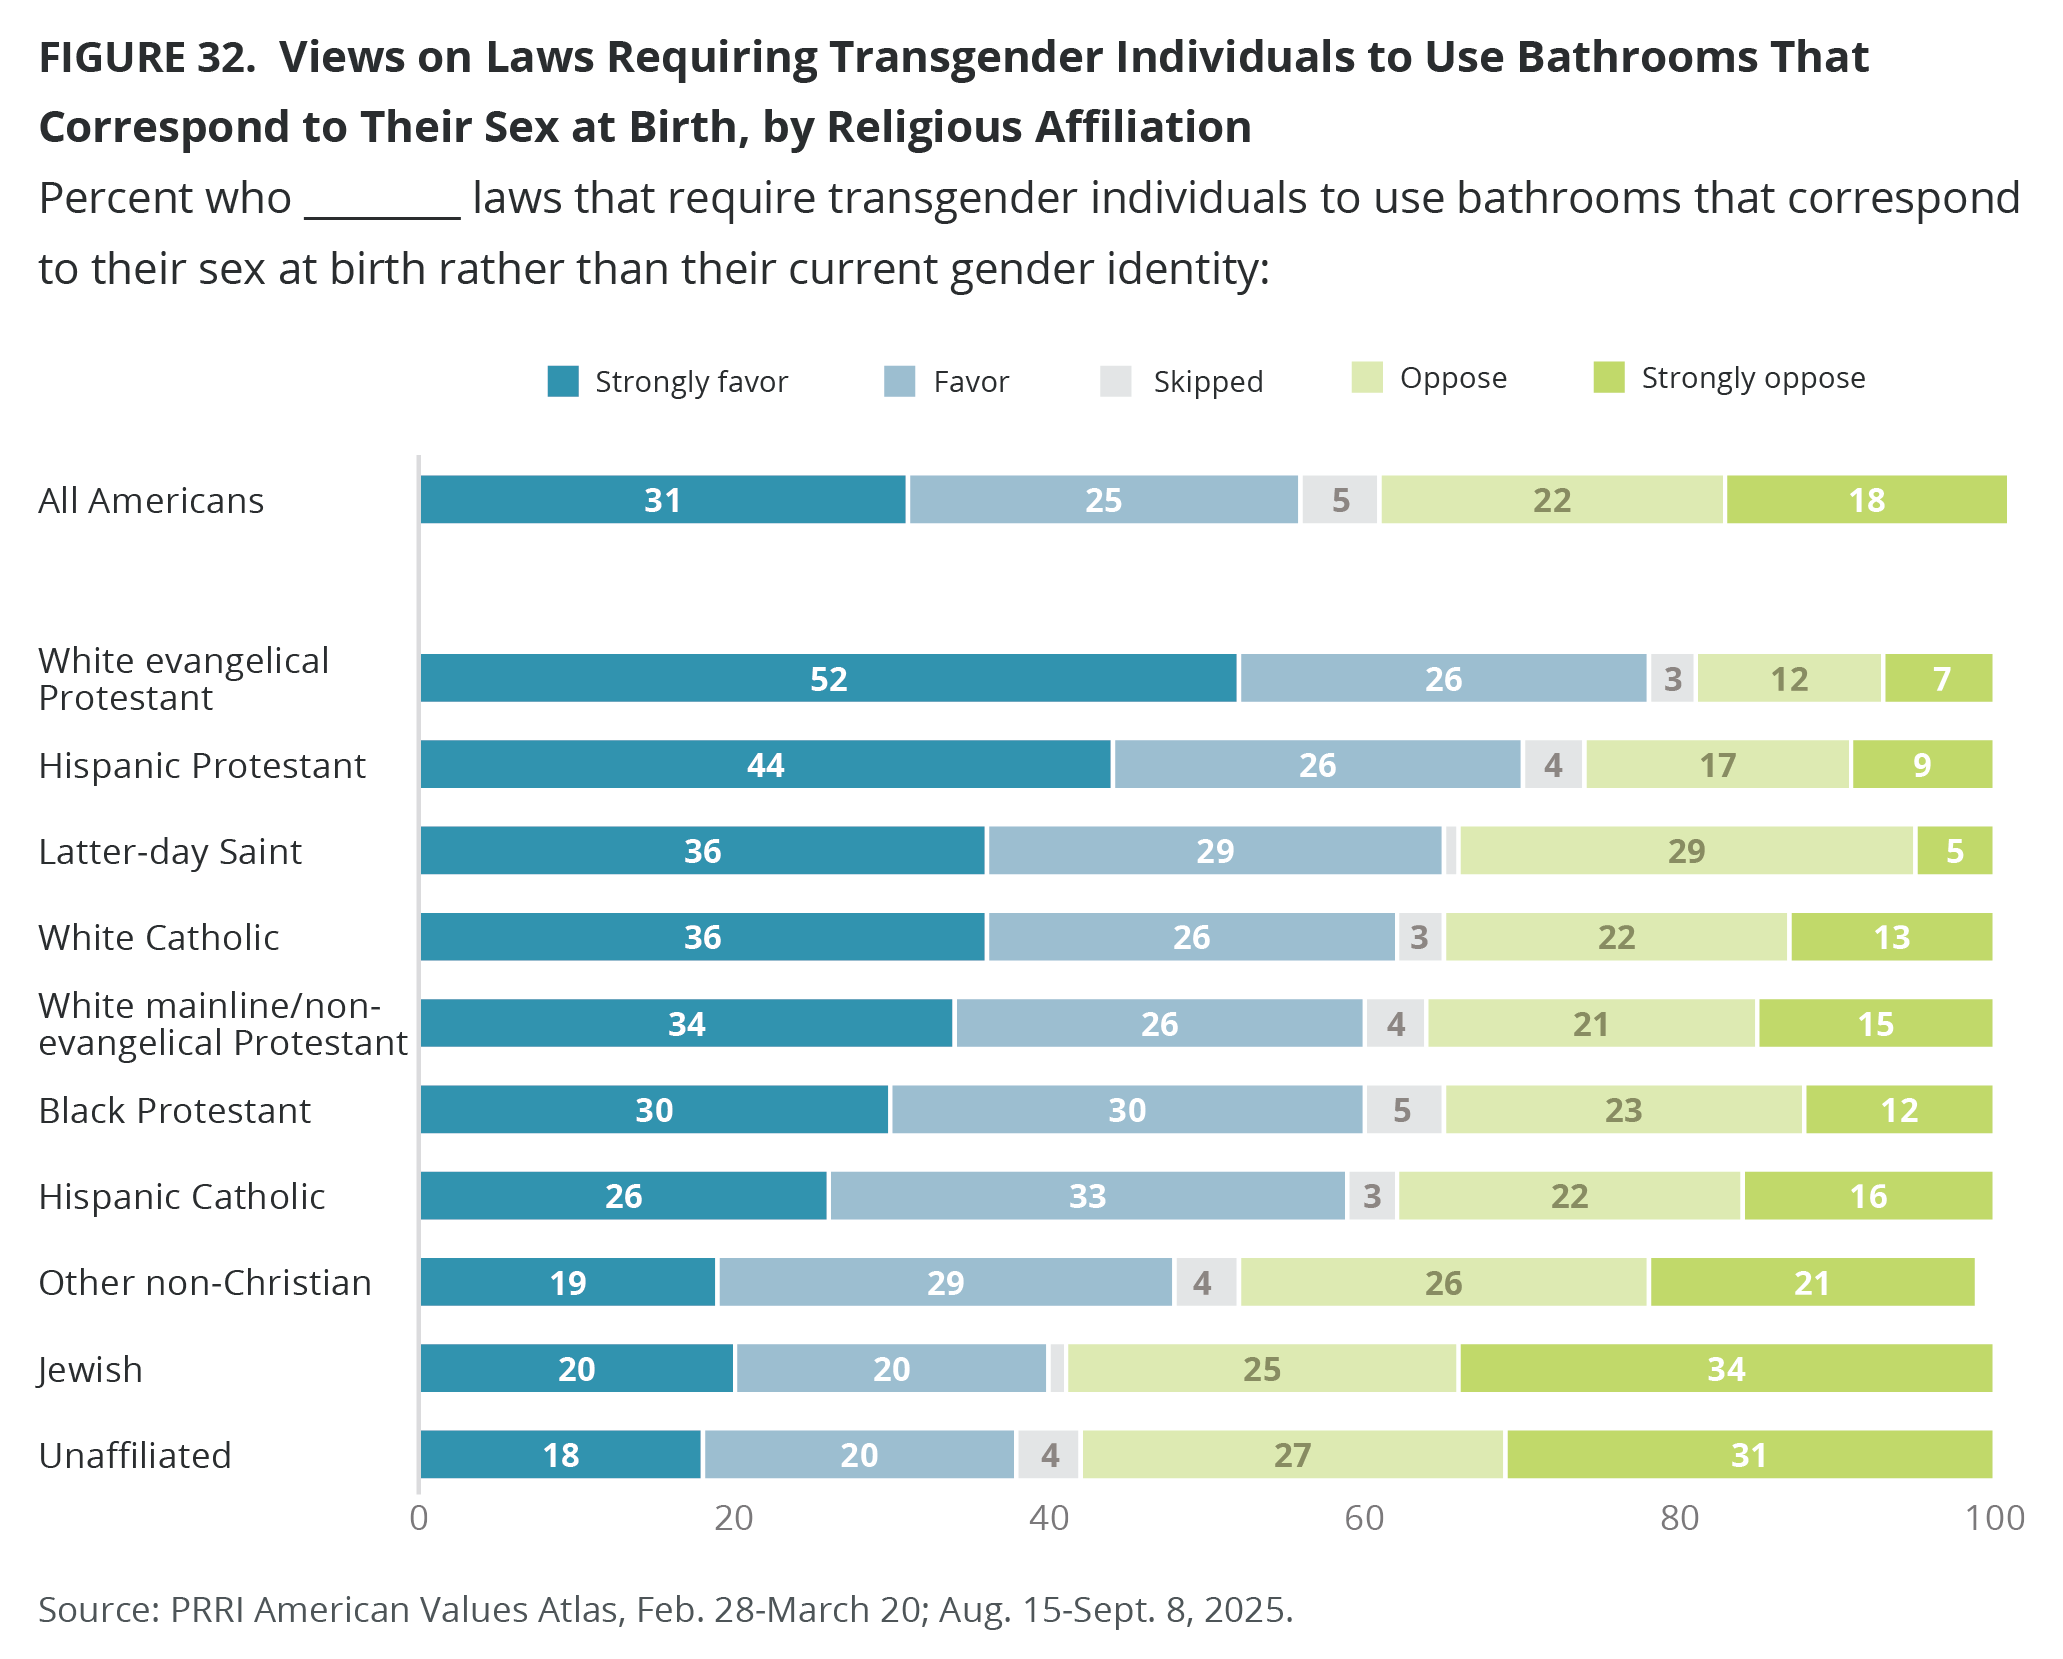
Overall, white Christians (67%) and Christians of color (61%) are more likely than non-Christians (45%) or unaffiliated Americans (38%) to favor laws that require transgender individuals to use bathrooms that correspond to their sex at birth rather than their current gender identity. Among white Christians, nearly eight in ten white evangelical Protestants (78%) support these laws, compared with 62% of white Catholics and 60% of white mainline/non-evangelical Protestants (60%). Among Christians of color, Hispanic Protestants (70%) are more likely than Black Protestants (60%) and Hispanic Catholics (59%) to support these laws. Jewish Americans (40%) and unaffiliated Americans (38%) are the least likely to favor these laws.
Most Christian nationalism Adherents (83%) support laws requiring transgender people to use the bathrooms that correspond with their sex at birth, followed by 78% of Sympathizers and 60% of Skeptics. Just 26% of Rejecters support these laws.
Older Americans (59% of both ages 50-64 and ages 65 and older) are more likely than younger Americans (49% of ages 18-29 and 54% of ages 30-49) to favor laws that require transgender people to use bathrooms that correspond with their sex at birth rather than their current gender identity. Men are also more likely than women to favor these laws (58% vs. 53%), as well as Americans without a four-year college education, compared with those with a four-year degree or higher (60% vs. 47%).
Americans who completely or mostly agree transgender people deserve the same rights and protections as other Americans are less likely to favor laws that require transgender individuals to use bathrooms that correspond to their sex assigned at birth than those who disagree that transgender people deserve the same rights (49% vs. 77%).
APPENDIX A. Methodology for Measuring LGBTQ Identity
Measuring Gender Identity
1. Male 2. Female |
1. Male 2. Female 3. Transgender 4. Non-binary 5. A different identity, please specify [O] |
How We Create Gender Identity Variable
We first count the number of responses to the current gender identity question. If there is only one response and it matches the sex at birth, they are considered cisgender. To be considered transgender, they must respond either with the gender that is opposite their sex at birth, the transgender response alone, or the transgender response in combination with the gender opposite their sex at birth. If they also pick non-binary, or a different identity, they are grouped into the transgender category. If someone picks non-binary alone or along with male or female, they are grouped into transgender/non-binary category. If they pick a different identity, they are also grouped in the transgender/non-binary category.
Measuring Sexual Orientation
1. Gay or lesbian 2. Straight, that is, not gay 3. Bisexual 4. Something else |
How We Create LGBTQ Identity Variable:
We code “gay or lesbian,” “bisexual,” and “something else” responses into 1 and “straight, that is, not gay” into 0. Then we combine this variable with our gender identity variable and code into 1 those who identify as “transgender/non-binary/something else” and “gay or lesbian/ bisexual/something else,” and code as 0 “cisgender males and females” who identify as “straight.” We also code those who identify as “transgender/non-binary/something else” and “straight” as 1, our LGBTQ identity category.
APPENDIX B. Survey Methodology
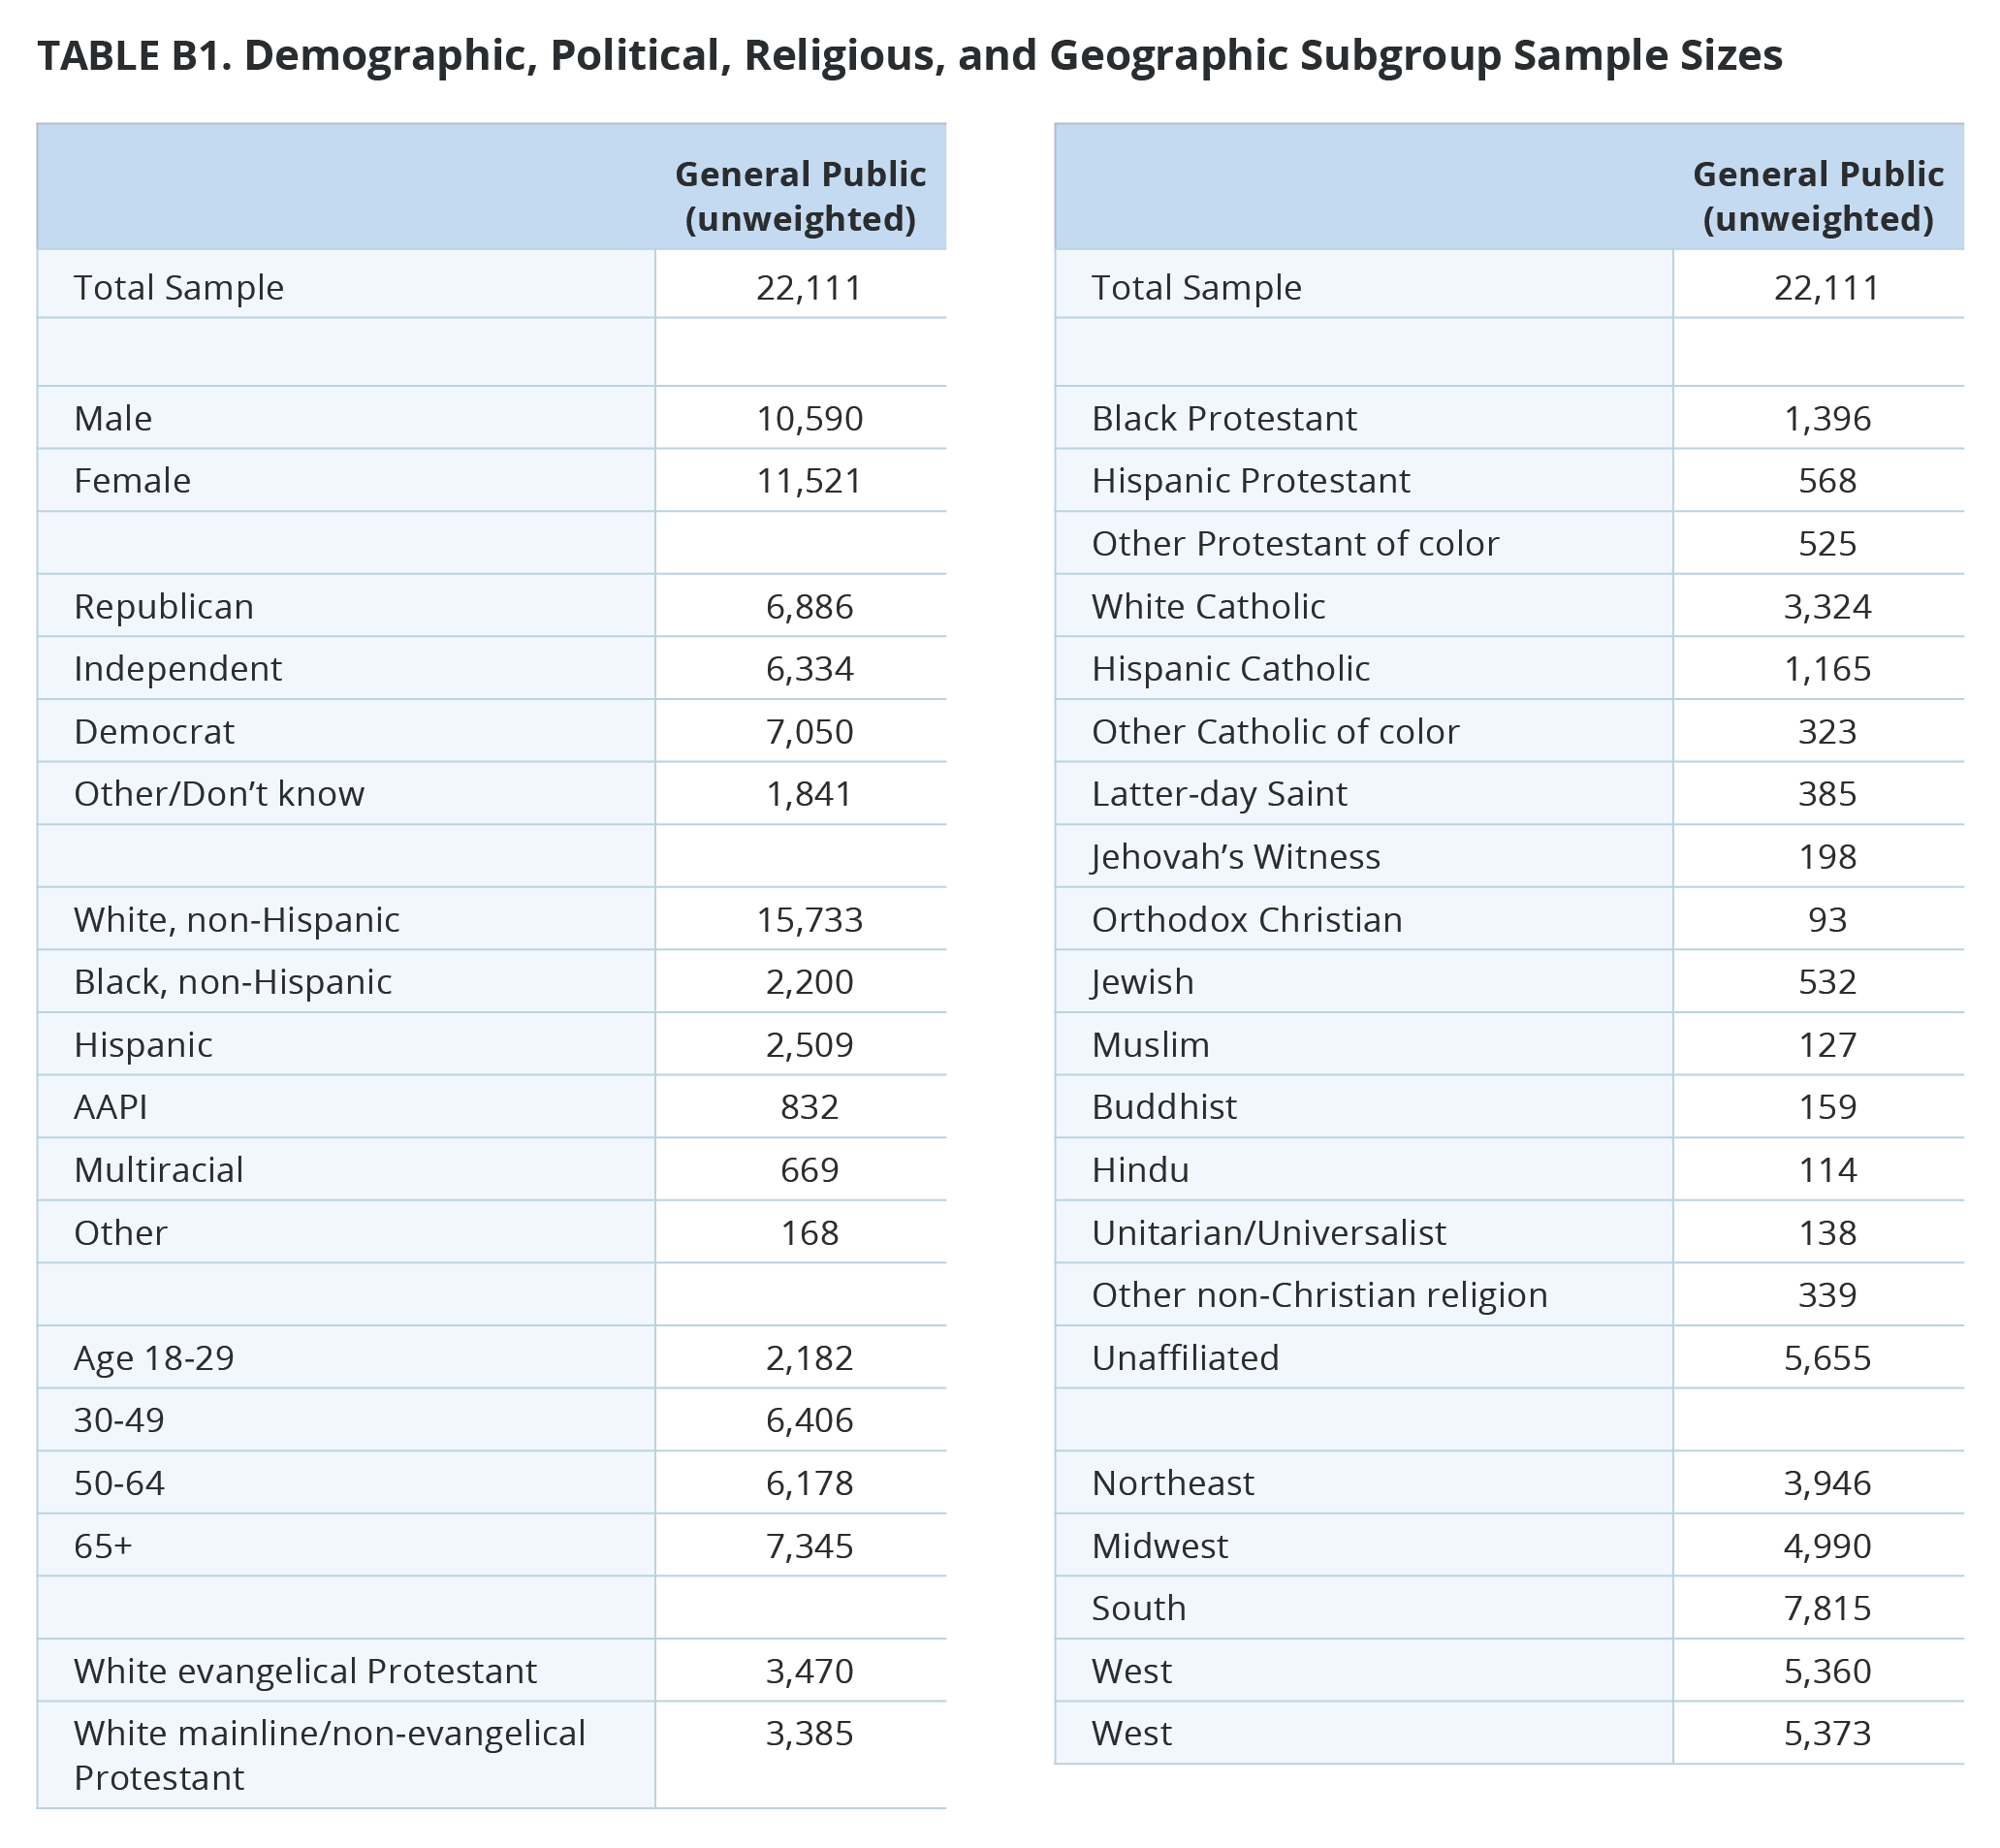
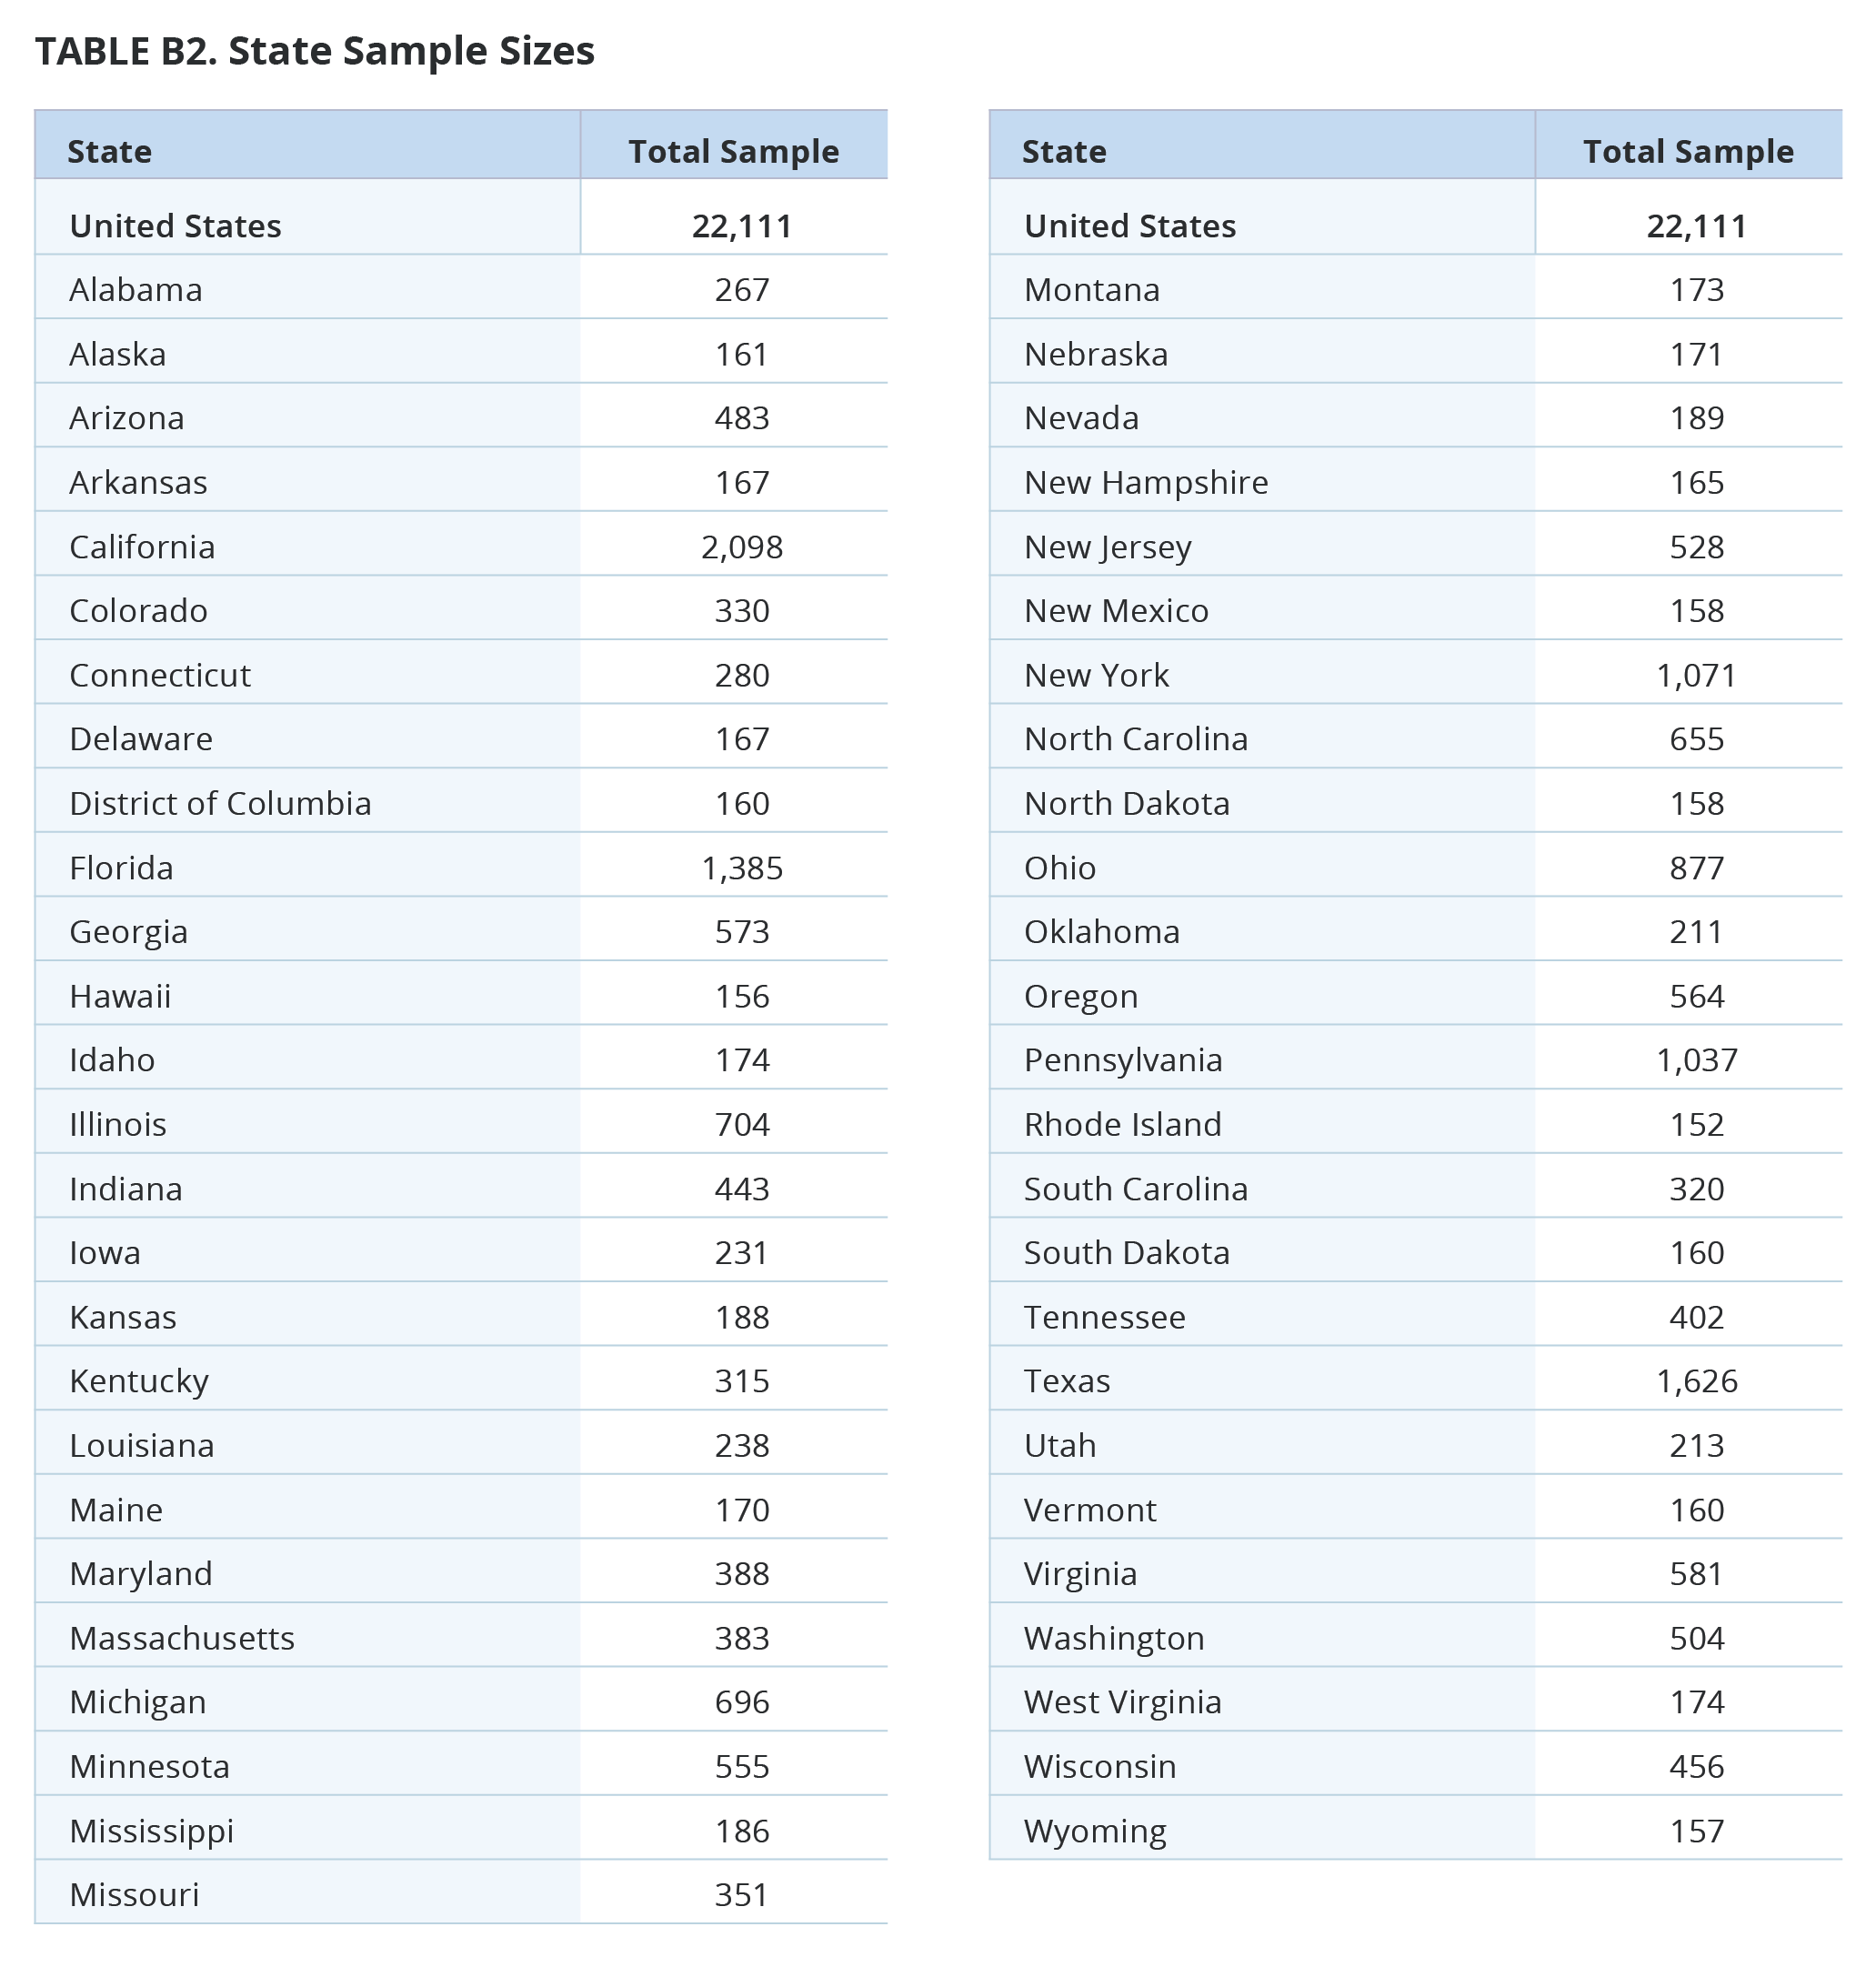
The survey was designed and conducted by PRRI. The survey was made possible through the generous support of the Arcus Foundation and the Unitarian Universalist Veatch Program at Shelter Rock. The survey was carried out among a random representative sample of 22,111 adults (age 18 and up) living in all 50 states in the United States. Among those, 20,771 are part of Ipsos’s KnowledgePanel and an additional 1,340 were recruited by Ipsos using opt-in survey panels to increase the sample sizes to a minimum of n=150 in smaller states. Interviews were conducted online between February 28 and December 8, 2025.
Respondents are recruited to the KnowledgePanel using an addressed-based sampling methodology from the Delivery Sequence File of the USPS – a database with full coverage of all delivery addresses in the U.S. As such, it covers all households regardless of their phone status, providing a representative online sample. Unlike opt-in panels, households are not permitted to “self-select” into the panel; and are generally limited to how many surveys they can take within a given time period.
The initial sample drawn from the KnowledgePanel was adjusted using pre-stratification weights so that it approximates the adult U.S. population defined by the 2024 March Supplement of the Current Population Survey (CPS), except language proficiency, which is not available from CPS, were obtained from the 2023 American Community Survey (ACS). Next, a probability proportional to size (PPS) sampling scheme was used to select a representative sample. Additionally, the 2024 vote choice benchmark was obtained from the Associated Press Tabulation of Certified Results and party affiliation benchmark was obtained from the 2025 Pew’s National Public Opinion Reference Survey (NPORS).
To reduce the effects of any non-response bias, a post-stratification adjustment was applied based on demographic distributions from the CPS, plus language proficiency from the ACS and party affiliation from Pew’s National Public Opinion Reference Survey (NPORS). The post-stratification weight rebalanced the sample based on the following benchmarks: gender, by age, by race/ethnicity, Census division, metro area by race/ethnicity, education by race/ethnicity, and income by race/ethnicity, language proficiency, party affiliation, and state population size. The sample weighting was accomplished using an iterative proportional fitting (IFP) process that simultaneously balances the distributions of all variables. Weights were trimmed to prevent individual interviews from having too much influence on the final results. In addition to an overall national weight, separate weights were computed for certain states (AZ, FL, GA, MI, MN, NC, NV, PA, TX, and WI) to ensure that the demographic characteristics of the sample closely approximate the demographic characteristics of the target populations.
These weights from the KnowledgePanel cases were then used as the benchmarks for the additional opt-in sample in a process called “calibration.” This calibration process is used to correct for inherent biases associated with nonprobability opt-in panels. The calibration methodology aims to realign respondents from nonprobability samples with respect to a multidimensional set of measures to improve their representation.
The margin of error for the national survey is +/- 0.87 percentage points at the 95% level of confidence, including the design effect for the survey of 1.7. In addition to sampling error, surveys may also be subject to error or bias due to question wording, context, and order effects. Additional details about the KnowledgePanel can be found on the Ipsos website: https://www.ipsos.com/en-us/solution/knowledgepanel
[1] For more detailed information, see Appendix.
[2] Non-Christians include Jewish Americans, Buddhists, Hindus, Muslims, Unitarian Universalists, and members of other non-Christian religions.
[3] For more detailed information on our Christian nationalism measures, the extent of its support, and the factors influencing these views, see: https://prri.org/research/mapping-christian-nationalism-across-the-50-states-insights-from-prris-2025-american-values-atlas/


