

America’s Culture War
To view, a PowerPoint version of the findings within this report click here.
Among 12 major political issues, Americans are most likely to rate health care (65%) as a critical issue. A majority (54%) of Americans also say terrorism is a critical issue. Just under half feel similarly about climate change (49%), immigration (49%), and the fairness of presidential elections (48%). More than four in ten Americans consider foreign interference in presidential elections (46%), crime (45%), jobs and employment (45%), and race relations (44%) to be critical issues as well. Americans are less likely to regard the federal deficit (40%), the gap between the rich and the poor (38%), and trade agreements with other countries (35%) as critical.
Even the majority agreement on health care and terrorism as critical issues, however, masks deep partisan divides. Strikingly, none of the top three critical issues for Democrats overlap with the top three critical issues for Republicans. Like Americans overall, Democrats are most likely to regard health care (77%) as critical. But Democrats rate climate change (72%) and foreign interference in presidential elections (63%) as the next most critical issues. By contrast, Republicans’ top three critical issues are terrorism (63%), immigration (60%), and crime (50%).
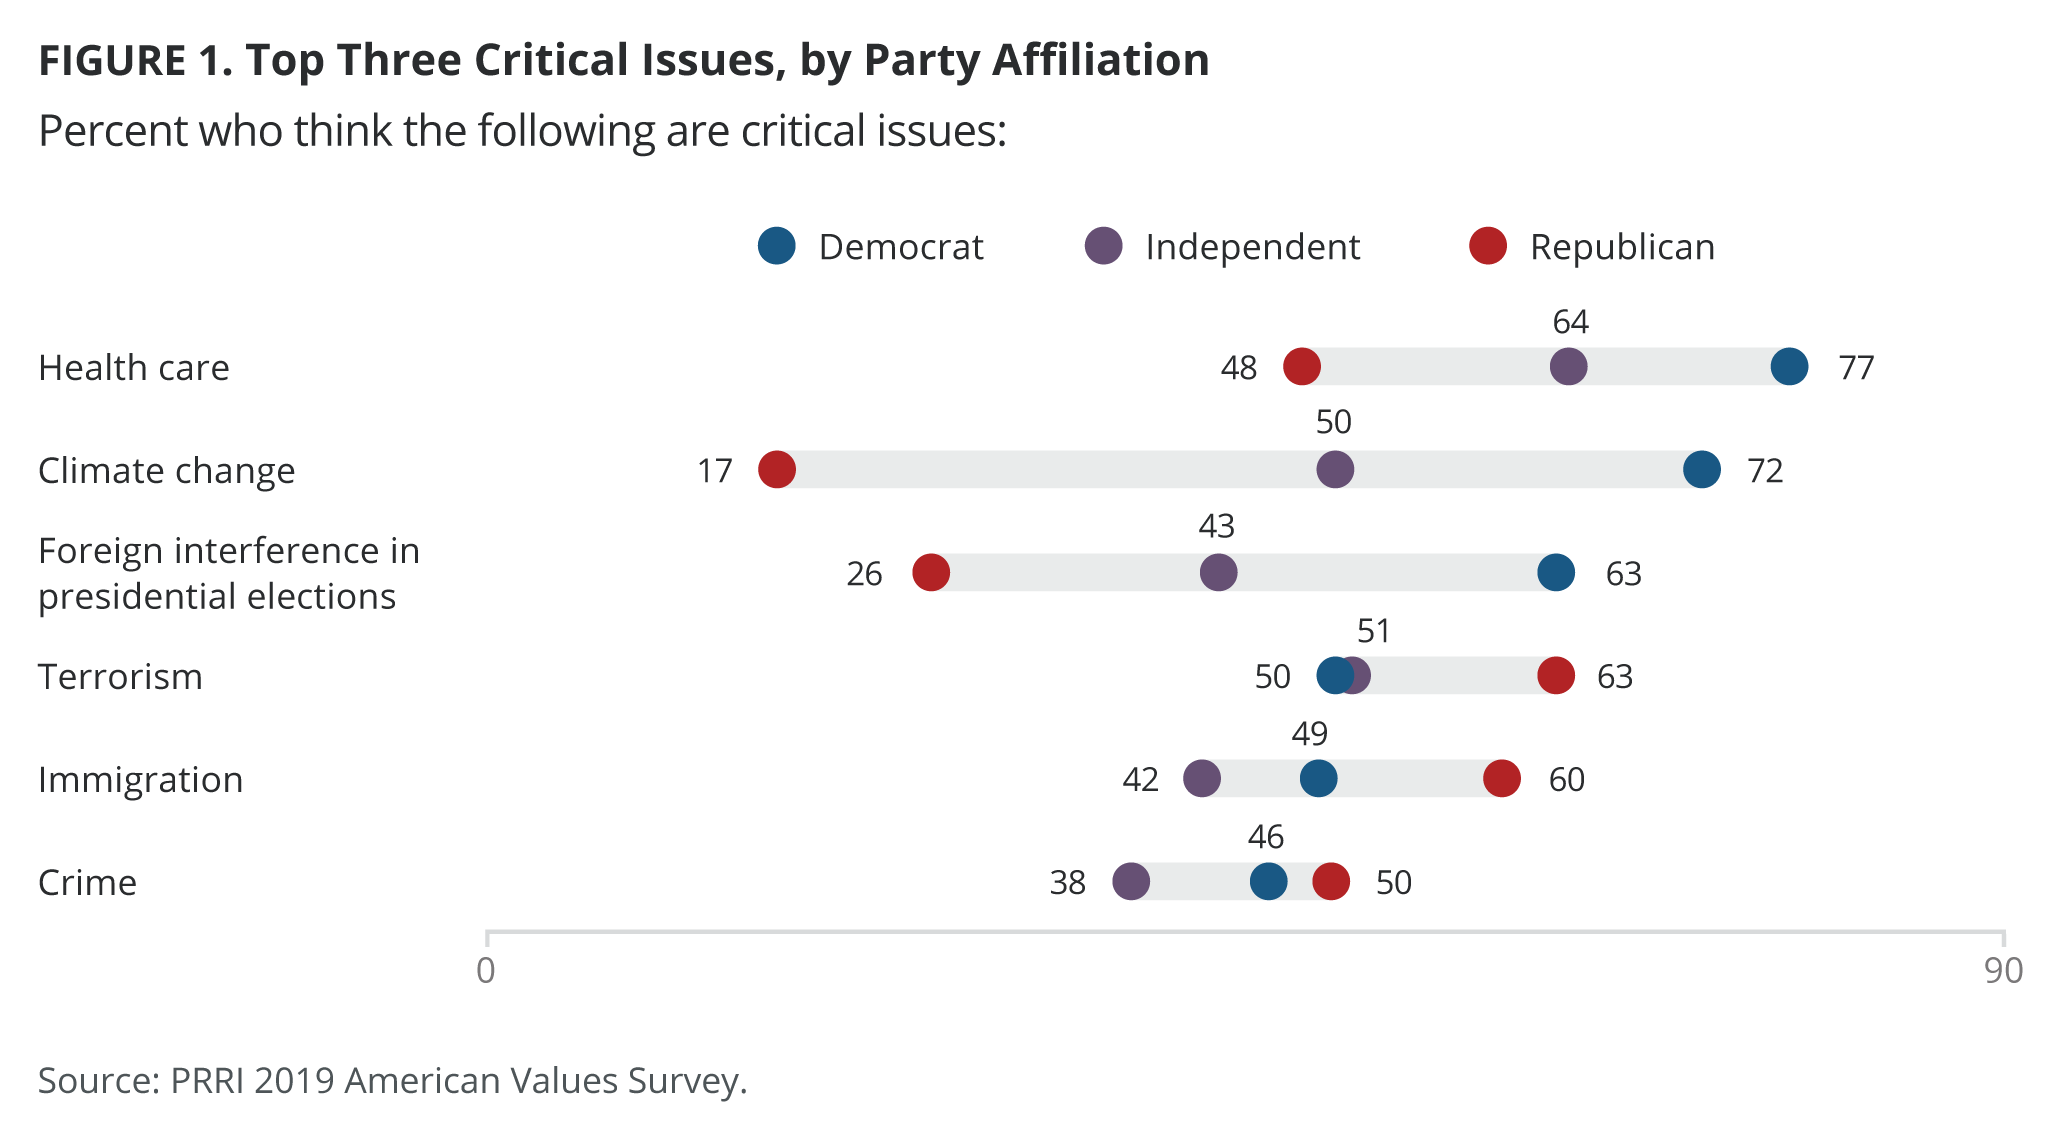
Two of the issues most rated as critical by independents, health care (64%) and climate change (50%), are also prioritized by Democrats, while the third issue, terrorism (51%), is at the top of the list for Republicans.
Across all racial groups, health care is the issue most frequently rated as critical, including more than seven in ten black (78%) and Hispanic (71%) Americans, and more than six in ten of other or mixed race Americans (63%) and whites (61%). Beyond that issue, priorities diverge. Among white Americans, the other most critical issues are terrorism (52%) and immigration (48%), aligning them closely with Republicans. Hispanic Americans blend Republican and Democratic issues with majorities saying climate change (64%) and terrorism (59%) are critical. Americans of other or mixed races similarly prioritize climate change (62%) and terrorism (54%). Black Americans most frequently say crime (71%) and fairness of presidential elections (69%) are critical issues.
Like Americans overall, non-college-educated whites are most likely to consider health care (62%) and terrorism (59%) critical issues. Just over half (51%) of this group say immigration is a critical issue as well. This group blends two top Republican issues (terrorism and immigration) with one of the top Democratic issues (health care). By contrast, the top three issues for whites with a college degree mirror the top Democratic issues: health care (58%), climate change (50%), and foreign interference in presidential elections (46%).
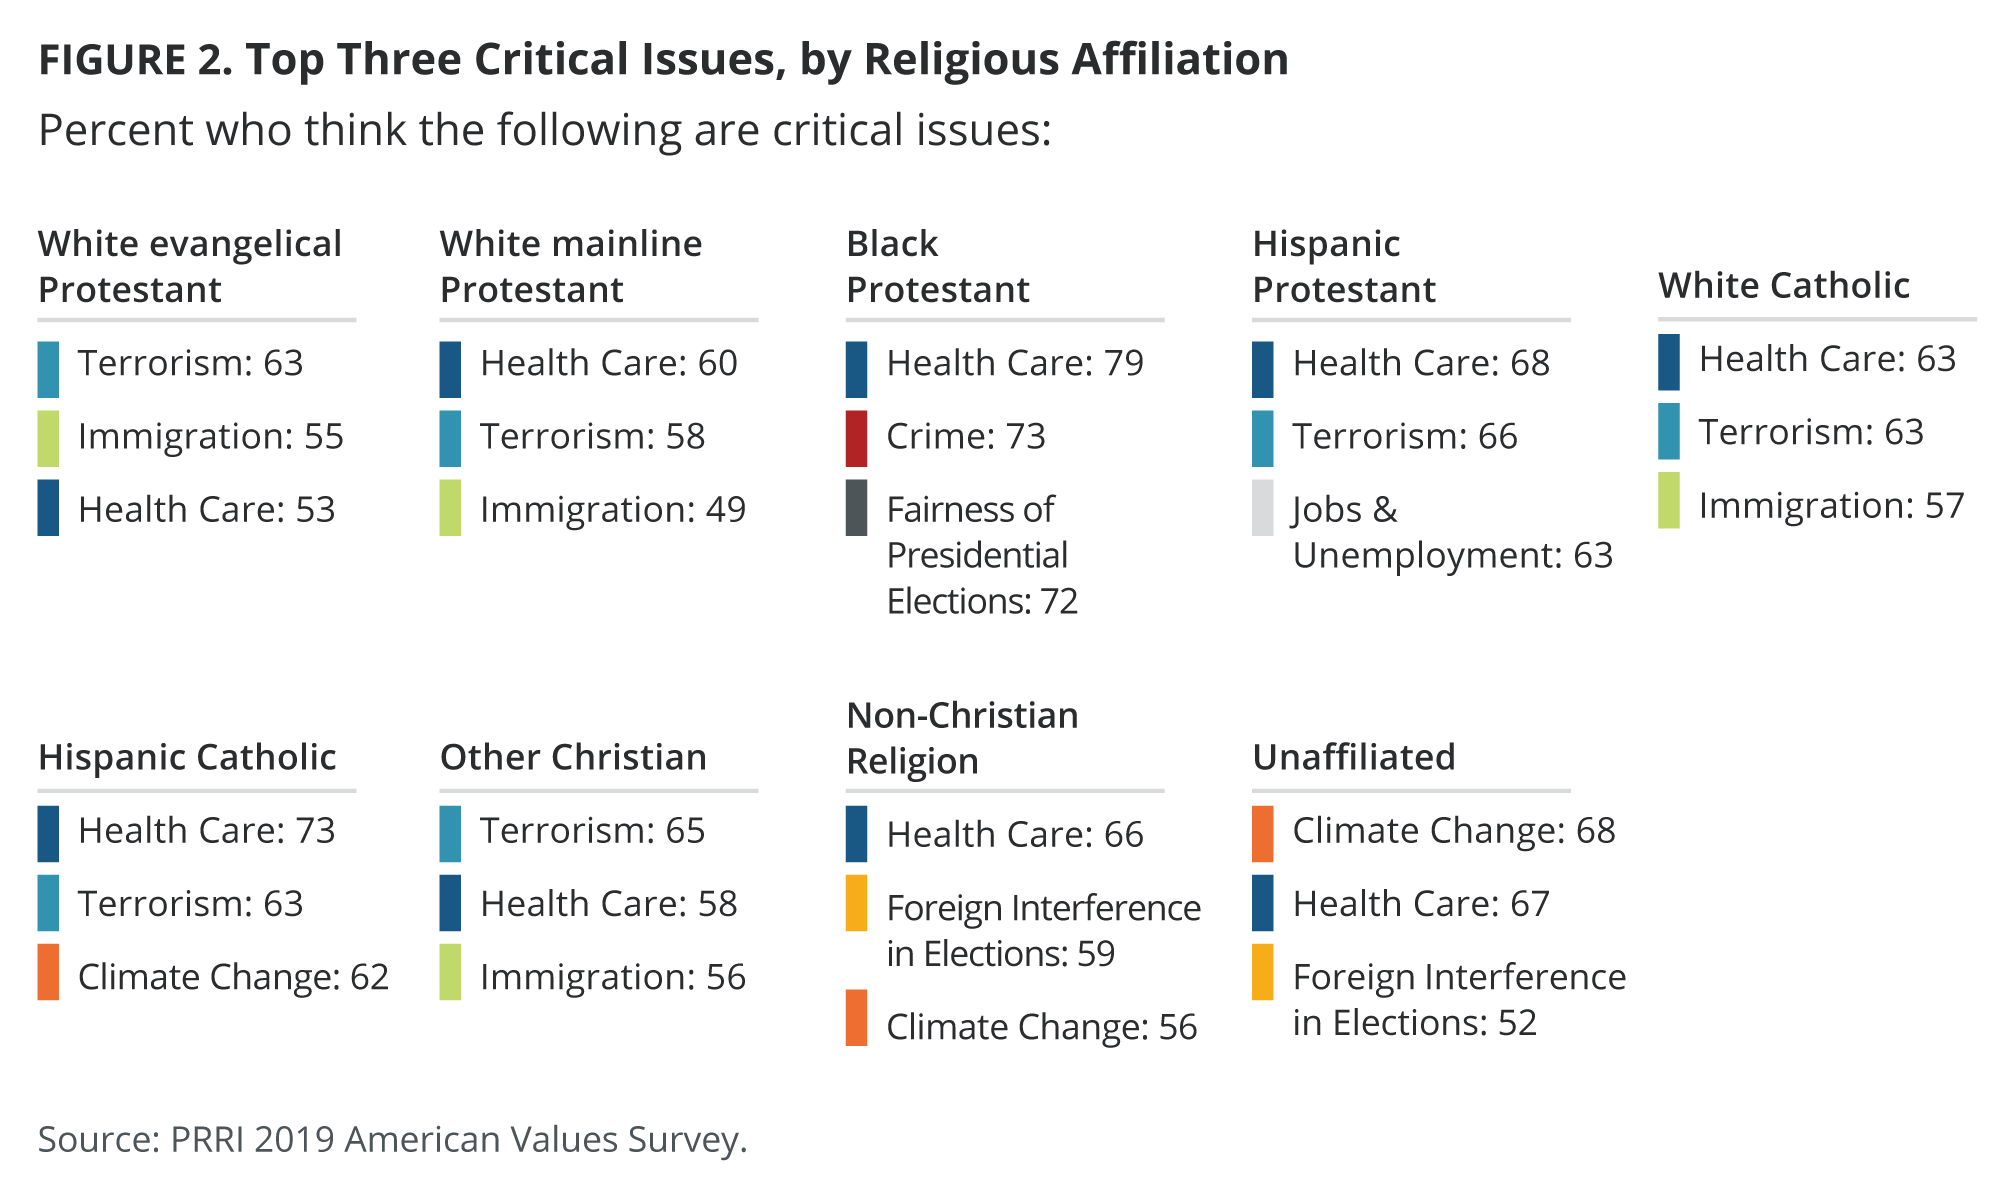
Majorities of every religious group prioritize health care as one of the three issues they are most likely to deem critical. Almost eight in ten (79%) black Protestants say health care is a critical issue, while about two-thirds of Hispanic Protestants (68%), Catholics (67%), religiously unaffiliated (67%), and the non-Christian religious (66%) agree. Majorities of white mainline Protestants (60%), other Christians (58%), and white evangelical Protestants (53%) consider health care to be a critical issue.
Terrorism is a major concern for Hispanic Protestants (66%), other Christians (65%), white evangelical Protestants (63%), Catholics (63%), and white mainline Protestants (58%). Immigration, which is the other most cited issue among Republicans, is also considered critical by majorities of Catholics (56%), other Christians (56%), white evangelical Protestants (55%), and about half of white mainline Protestants (49%).
The religiously unaffiliated and non-Christian religious closely resemble Democrats in that they are particularly likely to regard climate change (68% and 56%, respectively) and foreign interference in presidential elections (52% and 59%, respectively) as part of their top three critical issues. Black Protestants are the only religious group to prioritize crime (73%) and fairness of presidential elections (72%) as especially critical issues, while Hispanic Protestants are the only group to say the same about jobs and unemployment (63%).
Americans have changed their opinions on the level of import they place on a number of these issues over time. Since 2016, Americans have become less likely to regard terrorism (70% to 54%), jobs and unemployment (61% to 45%), crime (54% to 45%), and the federal deficit (49% to 40%) as critical issues.[1]
During that same time period, Americans have grown more concerned about the fairness of presidential elections (41% to 48%) and immigration (44% to 49%). Americans are also significantly more likely to consider climate change a critical issue than they were in 2015 (34% to 49%).[2]
In 2016, clear majorities of Democrats (65%) and especially Republicans (83%) prioritized terrorism as a critical issue. More than six in ten Republicans also identified the federal deficit (66%) and jobs and unemployment (61%) as critical. Democrats placed major import on the growing gap between the rich and the poor (70%) and race relations (61%).[3]
Perceptions of Political Parties
Two-thirds (66%) of Americans view the Republican Party as very conservative or conservative, as do seven in ten Republicans (71%) and Democrats (73%); independents are less likely to hold this view (59%). This divide is wider by ideology: More than eight in ten (85%) liberals, 57% of moderates, and 67% of conservatives view the Republican Party as very conservative or conservative.
Six in ten (61%) Americans view the Democratic Party as very liberal or liberal, including more than three in ten (32%) who say the party is very liberal. The vast majority of Republicans see the Democratic Party as having a liberal or very liberal ideology (84%), as do 56% of independents and 49% of Democrats. Americans who identify as liberal are more likely to see the Democratic Party as very liberal or liberal (64%) than moderates (47%).
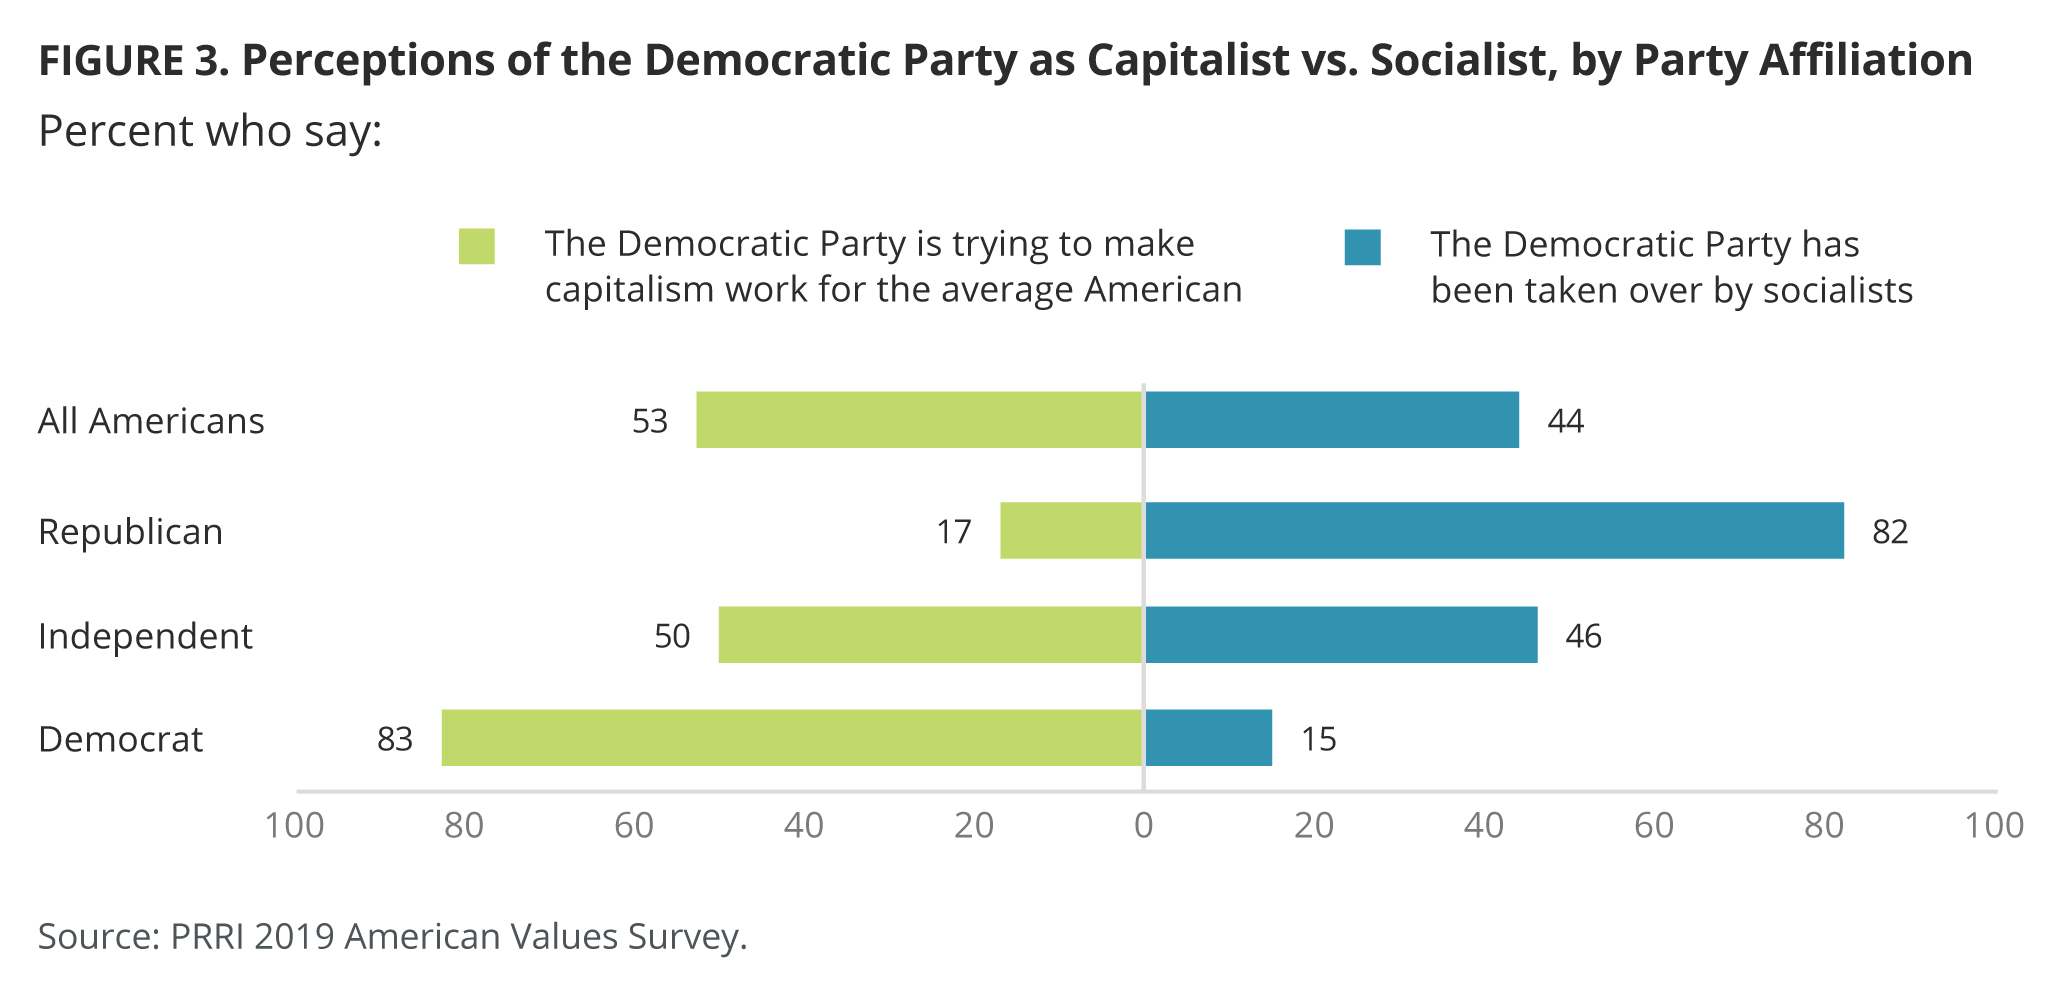
The survey also tested two opposite statements about each political party. A majority (53%) of Americans say the Democratic Party is trying to make capitalism work for average Americans, but 44% believe the party has been taken over by socialists. Eight in ten Democrats (83%) believe that their party is trying to make capitalism work, while eight in ten Republicans (82%) say the Democratic Party has been taken over by socialists. Independents are divided: Half (50%) say the Democratic Party is attempting to make capitalism work and 46% say the party is run by socialists.
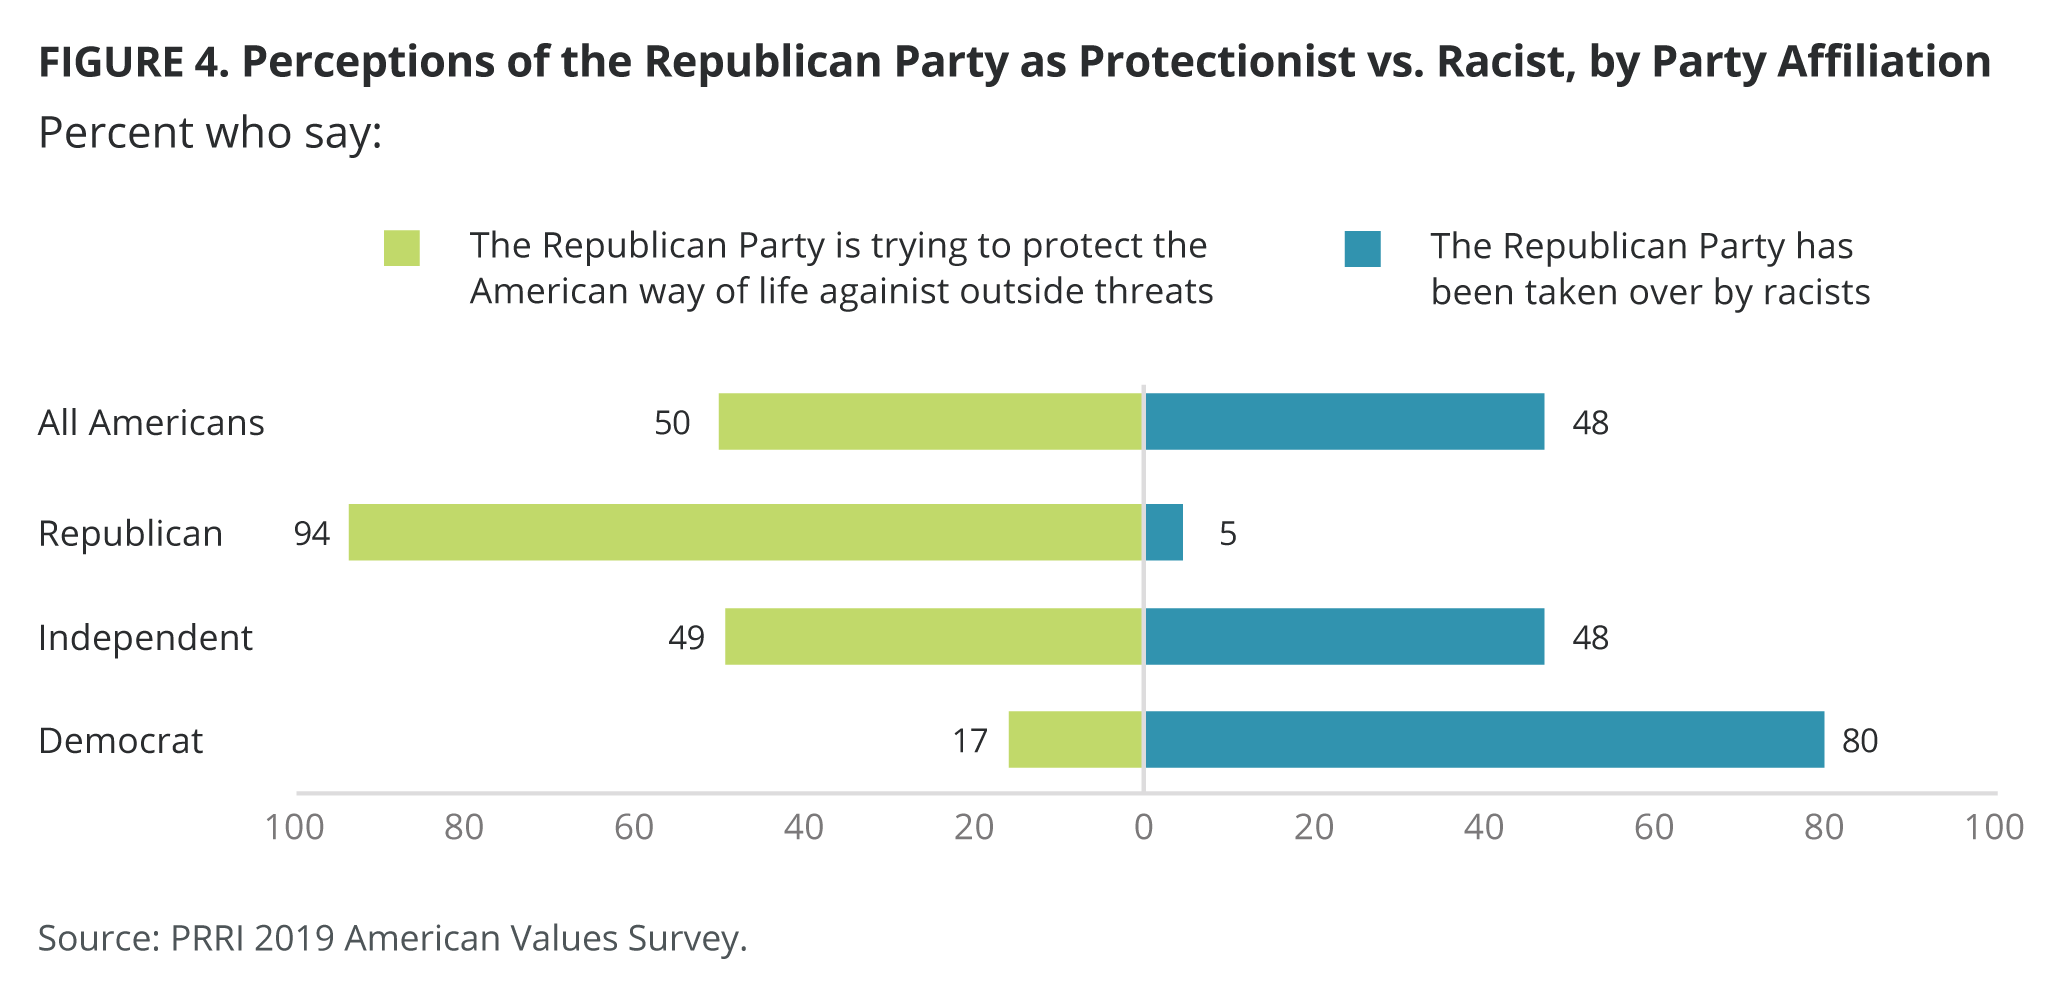
Half (50%) of Americans say the Republican Party is trying to protect the American way of life against outside threats, and almost half (48%) say the party has been taken over by racists. A strong majority (94%) of Republicans say the party wants to protect American traditions, compared to 49% of independents and only 17% of Democrats. Democrats overwhelmingly view the Republican Party as being controlled by racists (80%), a view shared by 48% of independents and only five percent of Republicans.
Beliefs about the Direction of the Country
Nearly two in three (64%) Americans think the country is on the wrong track, compared to 36% who think the country is going in the right direction. While most Republicans (74%) say the country is going in the right direction, nearly nine in ten Democrats (89%) believe that the country is on the wrong track; only 11% of Democrats think the country is moving in the right direction. Independents look very similar to Americans in general.
The partisan divides were reversed in 2016, when a remarkable 92% of Republicans indicated that the country was on the wrong track, while only 7% said the country is going in the right direction. By contrast, in 2016, nearly six in ten Democrats (57%) felt the country was off on the wrong track, compared to more than four in ten (42%) who said it was on the right track.
The 2020 Election and the Democratic Primary
Not All Americans are Committed for 2020
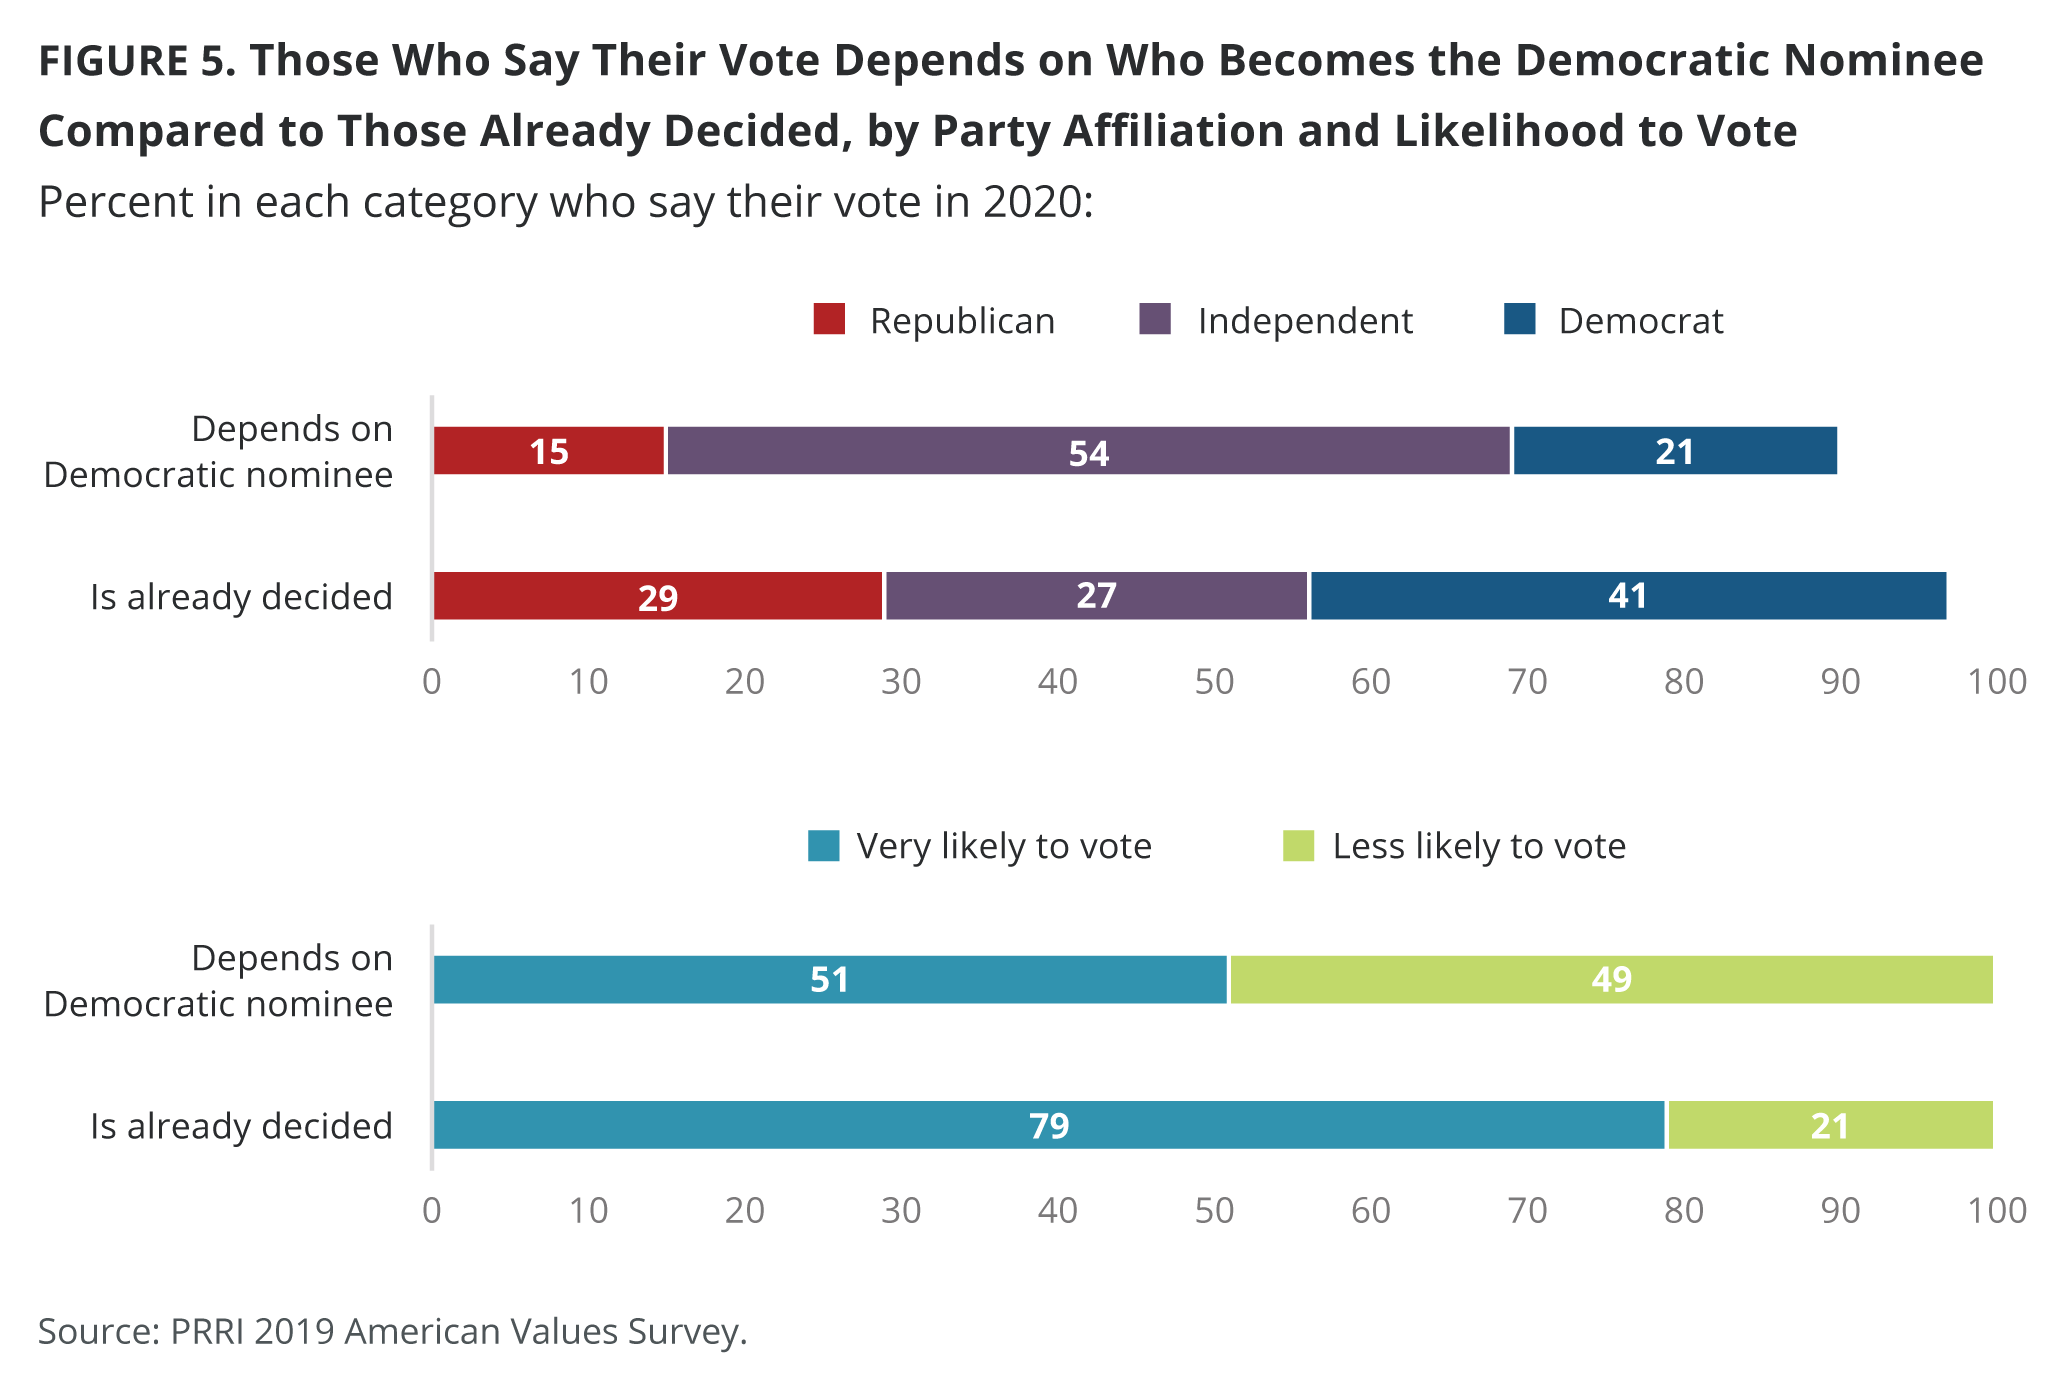
Almost two-thirds (65%) of Americans say they are certain about the candidate they will support in November 2020. Nearly four in ten (37%) say they will support the Democratic candidate over President Donald Trump no matter who the Democrat is, and nearly three in ten (28%) say they will support Donald Trump no matter who becomes the Democratic nominee.
Notably, one-third (33%) of Americans say their vote will depend on who wins the Democratic primary. However, only half (51%) of those Americans who say their vote depends on the identity of the Democratic candidate are very likely to vote in the 2020 general election,[4] compared to nearly four in five (79%) of those with a firm choice.
Among currently registered voters, 40% say they will support the Democratic candidate over President Donald Trump no matter who the Democrat is, and 29% say they will support Donald Trump no matter who becomes the Democratic nominee. The number of registered voters who say their vote will depend on who wins the Democratic primary shrinks to 29%.
Not surprisingly, most of these uncommitted Americans who say their preference depends on the Democratic candidate identify as moderate (61%) and independent (54%). Members of this group are more likely to identify as Democrat than Republican (21% vs. 15%) and were more likely to report having voted for Hillary Clinton (30%) than Donald Trump (18%) in the 2016 election; 13% say they voted for another candidate. However, they are also more likely to be conservative than liberal (24% vs. 14%). Notably, one in four say they did not vote in 2016 (25%) or were not eligible to vote (14%) in the 2016 presidential election.
Uncommitted Americans are more likely than Americans overall to include young people ages 18-29 (28% vs. 21%), those with a high school degree or less (47% vs. 39%), and Hispanics (23% vs. 16%).
Preference Depends on Policy
A plurality (43%) of uncommitted Americans say the most important factor in making a decision would be the Democratic candidate’s issue positions. About one in five (21%) say they would prefer the Democratic candidate if they have the right leadership style, while fewer say the candidate must have the right experience (16%) or inspire them (13%).
Among those who say having the right issue positions as the most important factor in reaching their decision, six in ten (59%) say health care is a critical issue to them while about half say the same about terrorism (51%) and jobs and unemployment (46%). Though health care is a top critical issue for Democrats, and terrorism is a top critical issue for Republicans, jobs and unemployment is notably not a top three critical issue to either.
Support for Progressive Policies
Americans are broadly supportive of several issues that are championed by leading Democratic candidates: making college tuition free at public institutions (68%), making recreational use of marijuana legal (67%), and a “Medicare for All” plan that would replace private health insurance with government-backed health insurance coverage for all Americans (63%). About one in three Americans strongly favor each of these proposals.
Almost nine in ten (87%) Democrats favor a generic “Medicare for All” proposal, with just under half (48%) strongly favoring it. The partisan gap on this issue is wide, with 63% of independents favoring this policy, compared to only about one in three (31%) Republicans. Importantly, groups most likely to vote in the 2020 election are less inclined to support a “Medicare for All” proposal. About six in ten (59%) Americans who are very likely to vote, compared to just less than three in four (73%) of those less likely to vote, favor a “Medicare for All” policy.
Large majorities of Democrats and independents favor making public college tuition free (84% and 69%) and legalizing recreational marijuana (79% and 71%). By contrast, less than half of Republicans support either the legalization of marijuana (46%) or making public college tuition free (42%).
While there are no significant differences by likelihood to vote on marijuana legalization, there are differences on making public college tuition free. Just over six in ten (63%) of those most likely to vote favor making public college tuition free, compared to 81% of Americans who are less likely to vote in 2020.
The Democratic Primary Candidates
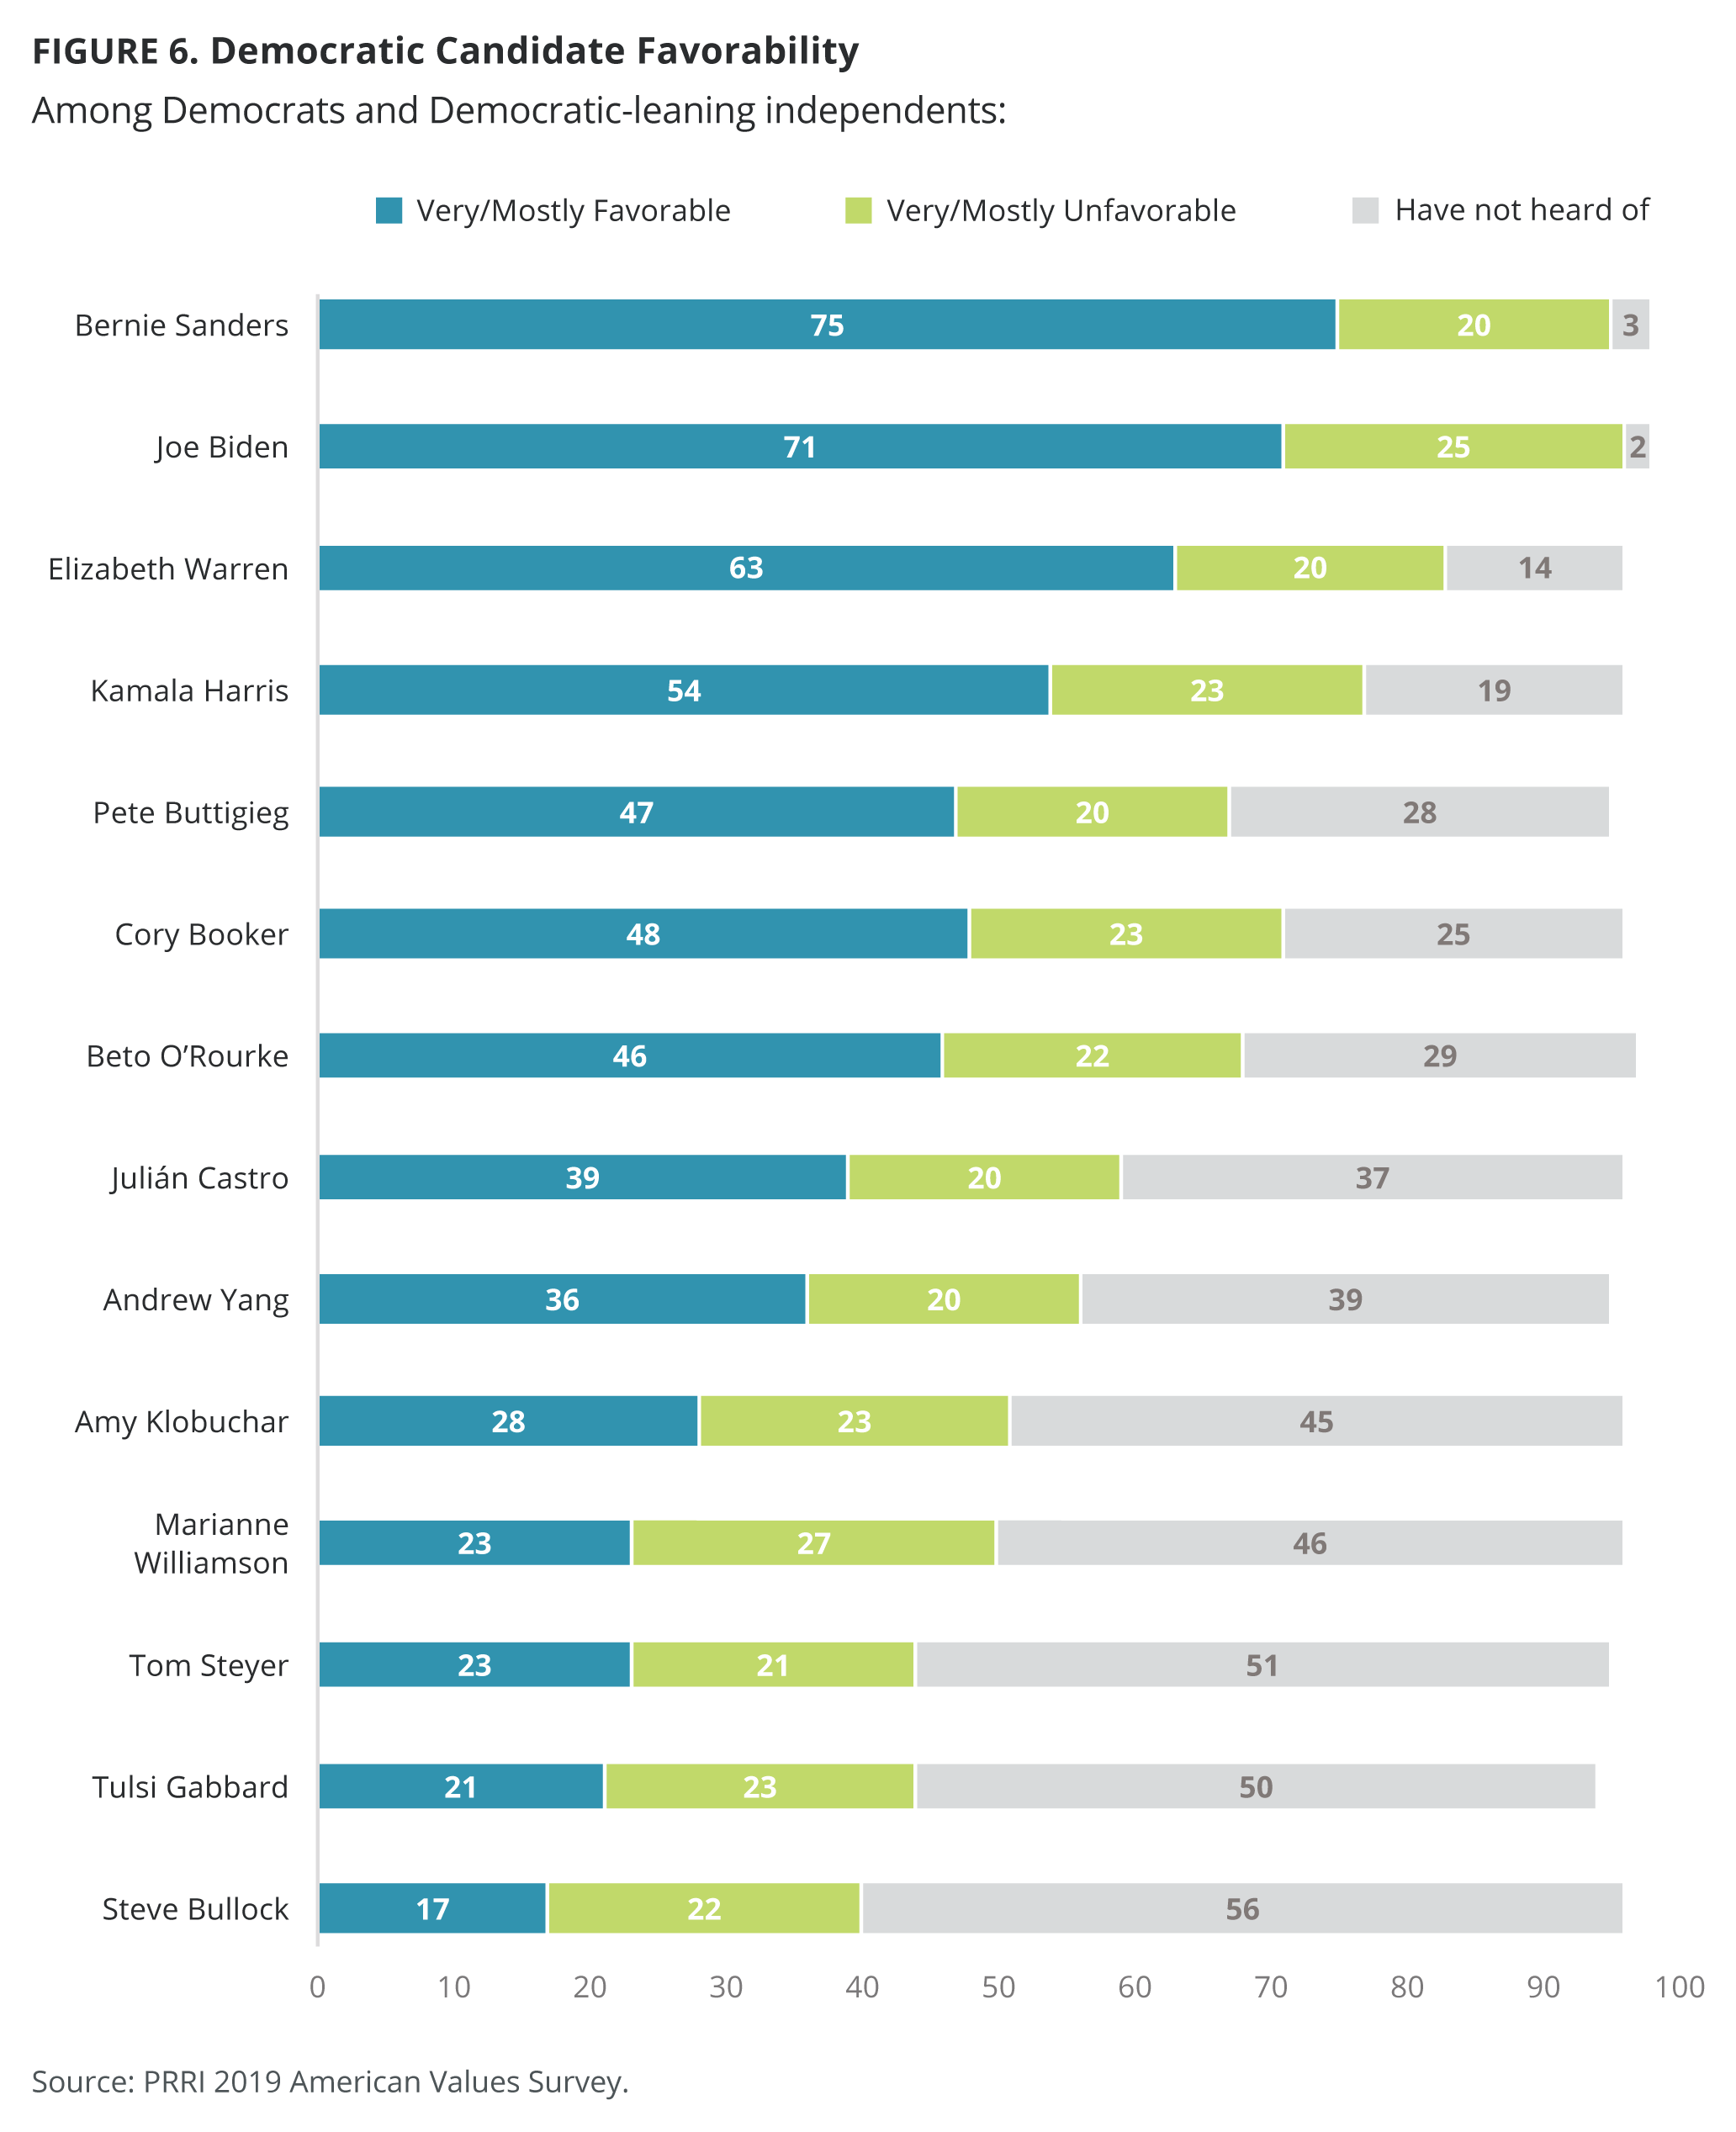
At the time of the survey field period in mid-September, Bernie Sanders is viewed more positively than any of his Democratic rivals. Three in four (75%) Democrats and Democratic leaners hold a favorable view of Sanders, compared to only 20% who have an unfavorable view of him, for a net favorability rating of 55%. As the other most recognizable figure in the race, Joe Biden also holds a high net favorability rating of 46%, though Democrats are slightly less favorable (71%) and more unfavorable (25%) to him than Sanders. Name recognition and favorability drops for Elizabeth Warren, who has a net favorability rating of 43%; she is viewed favorably by just over six in ten (63%) Democrats and leaners, though her unfavorable numbers (20%) are identical to Sanders’.
Name recognition and favorability numbers drop further for the remaining Democratic field. Among Democrats or Democratic leaners, Kamala Harris’s net favorability is 31%, Pete Buttigieg’s is 27%, Cory Booker’s is 25%, and Beto O’Rourke’s is 24%. Julián Castro (19%) and Andrew Yang (16%) both hold double-digit net favorable ratings, while Amy Klobuchar (5%) and Tom Steyer (3%) hover in the single digits. Each candidate has unfavorable ratings in the range of 20-25%, but substantial portions decline to rate them or have not heard of them. Democrats or Democratic leaners are more likely to have unfavorable than favorable views of Tulsi Gabbard (-2%), Marianne Williamson (-4%), and Steve Bullock (-5%).[5]
Gender Preference in the Democratic Primary
One in five (20%) Democrats and Democratic-leaning independents say they think it would be better to nominate a man as the Democratic nominee to run against Trump in 2020, while 12% say it would be better to nominate a woman. However, the vast majority (68%) say the gender of the nominee does not matter.
There are notable differences in preferred gender of the Democratic nominee by age. Young Democrats and leaners ages 18-29 (17%) are much more likely than seniors (7%) to say that it would be better to nominate a woman as the Democratic nominee. Interestingly, there are no notable differences in preference for the nominee’s gender by either gender or ideology.
Chances of Voting in 2020
More than seven in ten (72%) Americans say they are absolutely certain to vote, while 13% say they will probably vote. Less than one in ten say their chances of voting are 50-50 (8%) or less than 50-50 (7%). Americans are significantly more likely to say they are planning to vote in the 2020 election more than a year in advance than to have said they were planning to vote a month ahead of the 2016 election (66%).[6]
Almost four in ten (38%) Americans who say they are absolutely certain to vote in the 2020 election are Democrats, compared to about three in ten who are independents (31%) or Republican (27%). However, Americans who say they are absolutely certain to vote are also more likely to identify as conservative (35%) or moderate (37%) than liberal (28%).
Americans who are absolutely certain that they will vote in 2020 tend to be older. This group is more likely to include seniors ages 65 and over (26%) than young people ages 18-29 (15%). Americans who say they are absolutely certain to vote generally resemble the overall racial trends of the larger population, though they are slightly more likely to be white and less likely to be Hispanic. Two in three (67%) of those who are certain to vote are white, while about one in ten are Hispanic (13%), black (12%), and other/mixed race (8%). This group is more likely than Americans overall to include college educated whites (30% vs. 23%).
Americans report similar levels of enthusiasm toward voting among their close friends. More than one in five (22%) Americans say they think all of their close friends will vote in the 2020 presidential election, while about half (49%) say most of their close friends will. Fewer than one in five (18%) say only half of their friends will vote, while only small proportions say few of their friends (8%) or none of them (2%) will.
Close to half (45%) of Americans who say all of their close friends plan to vote in the election are Democrats, while about one-quarter are Republican (27%) or independent (25%). However, those who say most of their close friends are planning to vote closely resemble the general population in party breakdown, with about one-third of independents (37%) and Democrats (32%), and one in four Republicans (26%).
Older Americans ages 65 and over (31%) are more likely than younger people ages 18-29 (12%) to say all of their close friends will vote in the 2020 election. Black Americans (43%) are more likely than white (21%), Hispanic (15%), or other or mixed race (21%) Americans to say all of their close friends will vote. Women (25%) are also more likely than men (20%) to say all of their close friends will vote.
Trump and the 2020 Election
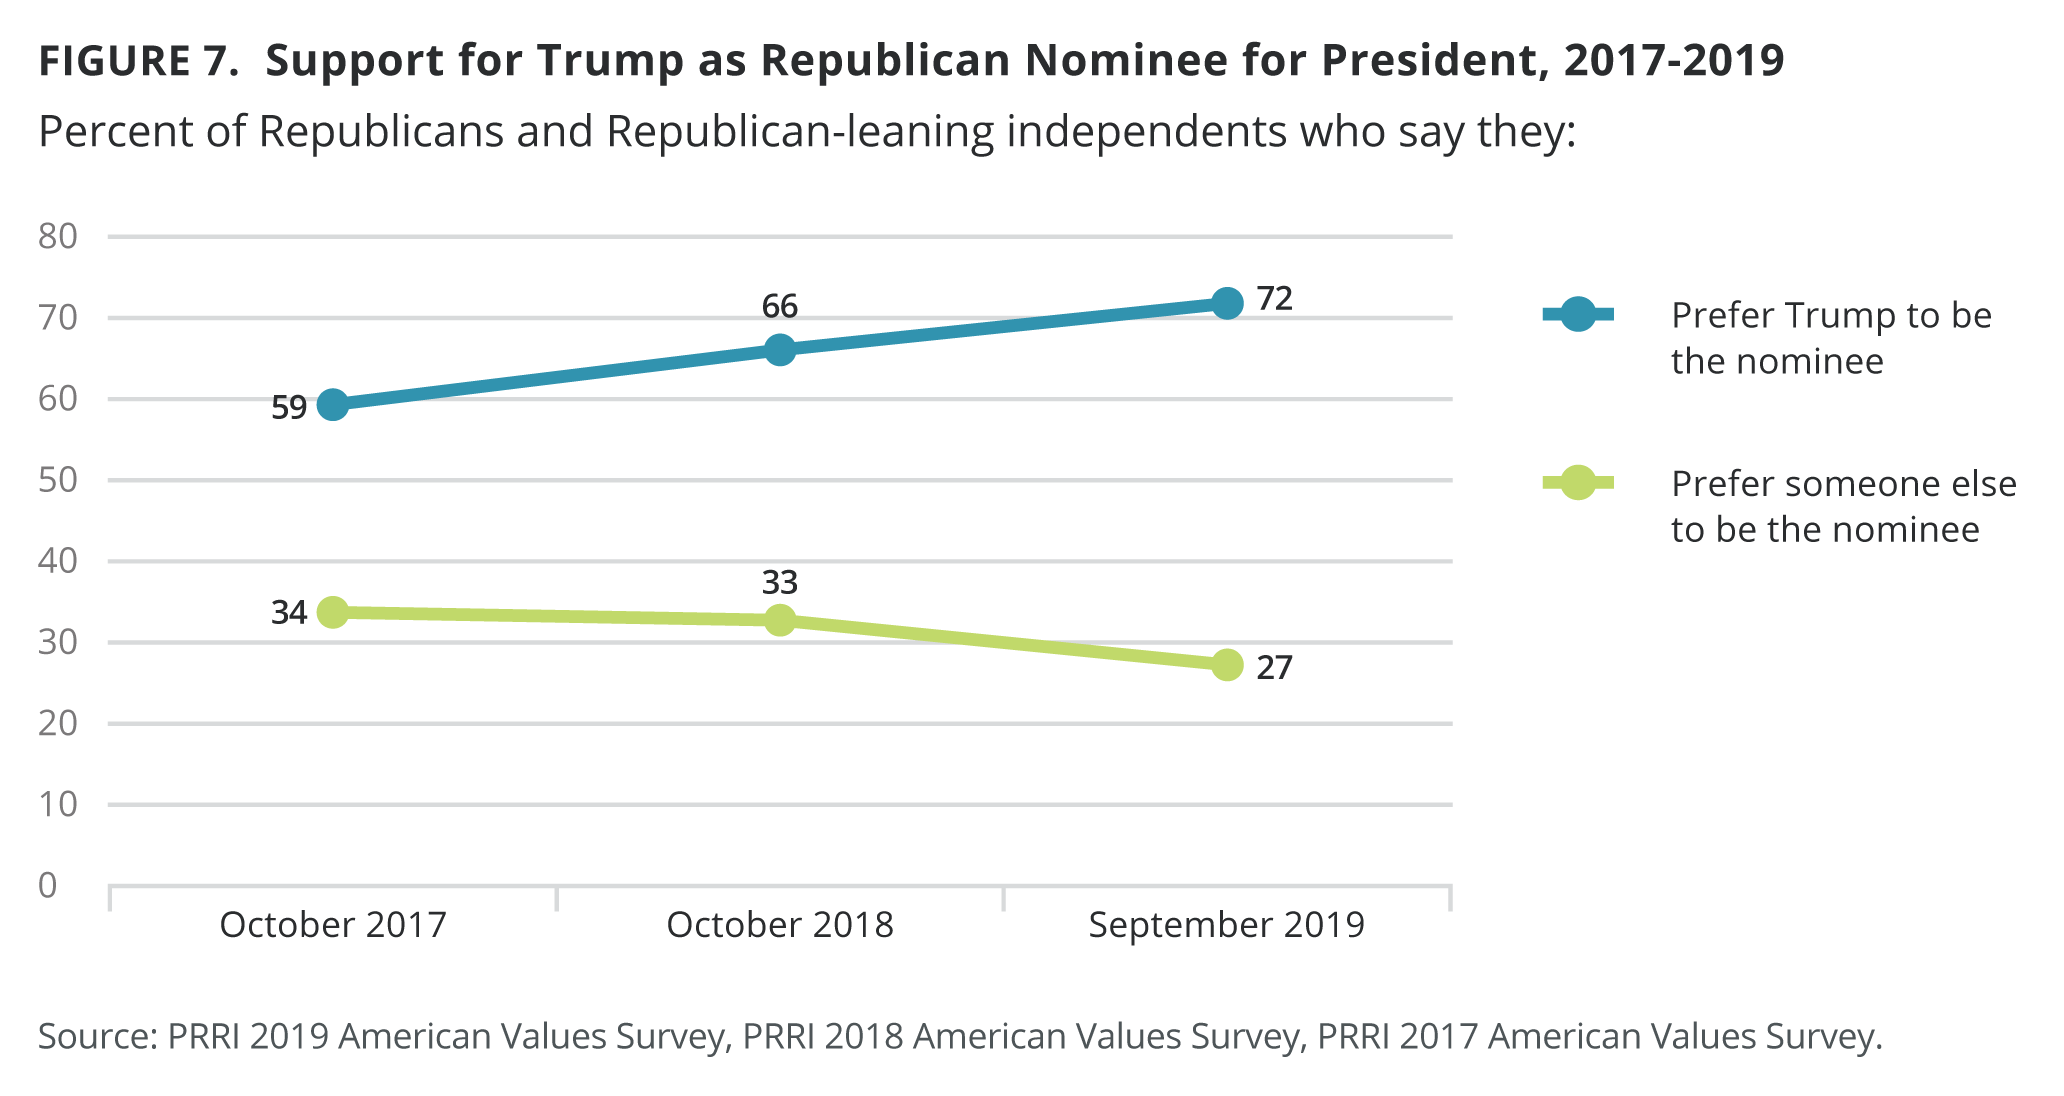
Over the course of his presidency, Donald Trump has locked in increasing proportions of Republicans and Republican-leaning independents behind his candidacy. The percentage of Republicans and Republican leaners who say they prefer Trump over any other Republican candidate as the party’s presidential nominee in 2020 increased from 59% in October 2017, [7] to 66% in October 2018, [8] and to 72% in mid-September 2019.[9]
More than one in four (27%) Republicans and leaners would prefer someone else as the nominee. This group is disproportionately younger, more educated, and less likely to vote than Republicans and Republican leaners who prefer Trump. Republicans and Republican leaners ages 30-49 are more likely to prefer someone else (33%) than those ages 50-64 (20%) or those over age 65 (18%). Around one in three (35%) Republicans and Republican leaners with a college degree say they prefer someone else, compared to 21% of those with some college experience, and 26% of those with a high school degree or less. Only 19% of very likely 2020 voters, compared to 48% of those less likely to vote, prefer someone else over Trump.
While moderate Republicans and Republican-leaning independents (60%) are less likely than Republican conservatives (81%) to say they prefer Trump over someone else, Trump still retains a solid majority of support among these Republican subgroups.
Among Republicans and Republican-leaning independents, white evangelical Protestants are some of the most unified in their support of Trump, with more than eight in ten (82%) saying they prefer him to be their party’s nominee. Three in four Republican and Republican-leaning white mainline Protestants (75%) and white Catholics (73%) say Trump should be the nominee. Religiously unaffiliated (65%) and all Catholic (60%) Republicans and leaners are somewhat less likely to prefer Trump, but majorities of these groups remain behind him.
About eight in ten seniors (81%) and people ages 50-64 (79%) who identify with or lean toward the Republican Party say they prefer Trump over another Republican candidate, but those ages 30-49 are less likely to agree (66%). Republicans and leaners with a college degree are less likely to prefer Trump (64%) than those with no college experience (73%) or some college experience (79%).
Naming Republican candidate Bill Weld as an alternative to Trump does not change people’s positions on Trump—74% prefer Trump, 10% prefer Weld, and 13% prefer someone else.[10] Republicans and leaners who initially said they would prefer someone else are divided between Weld (36%) and someone else (48%), with 10% choosing Trump.
Favorability and Approval
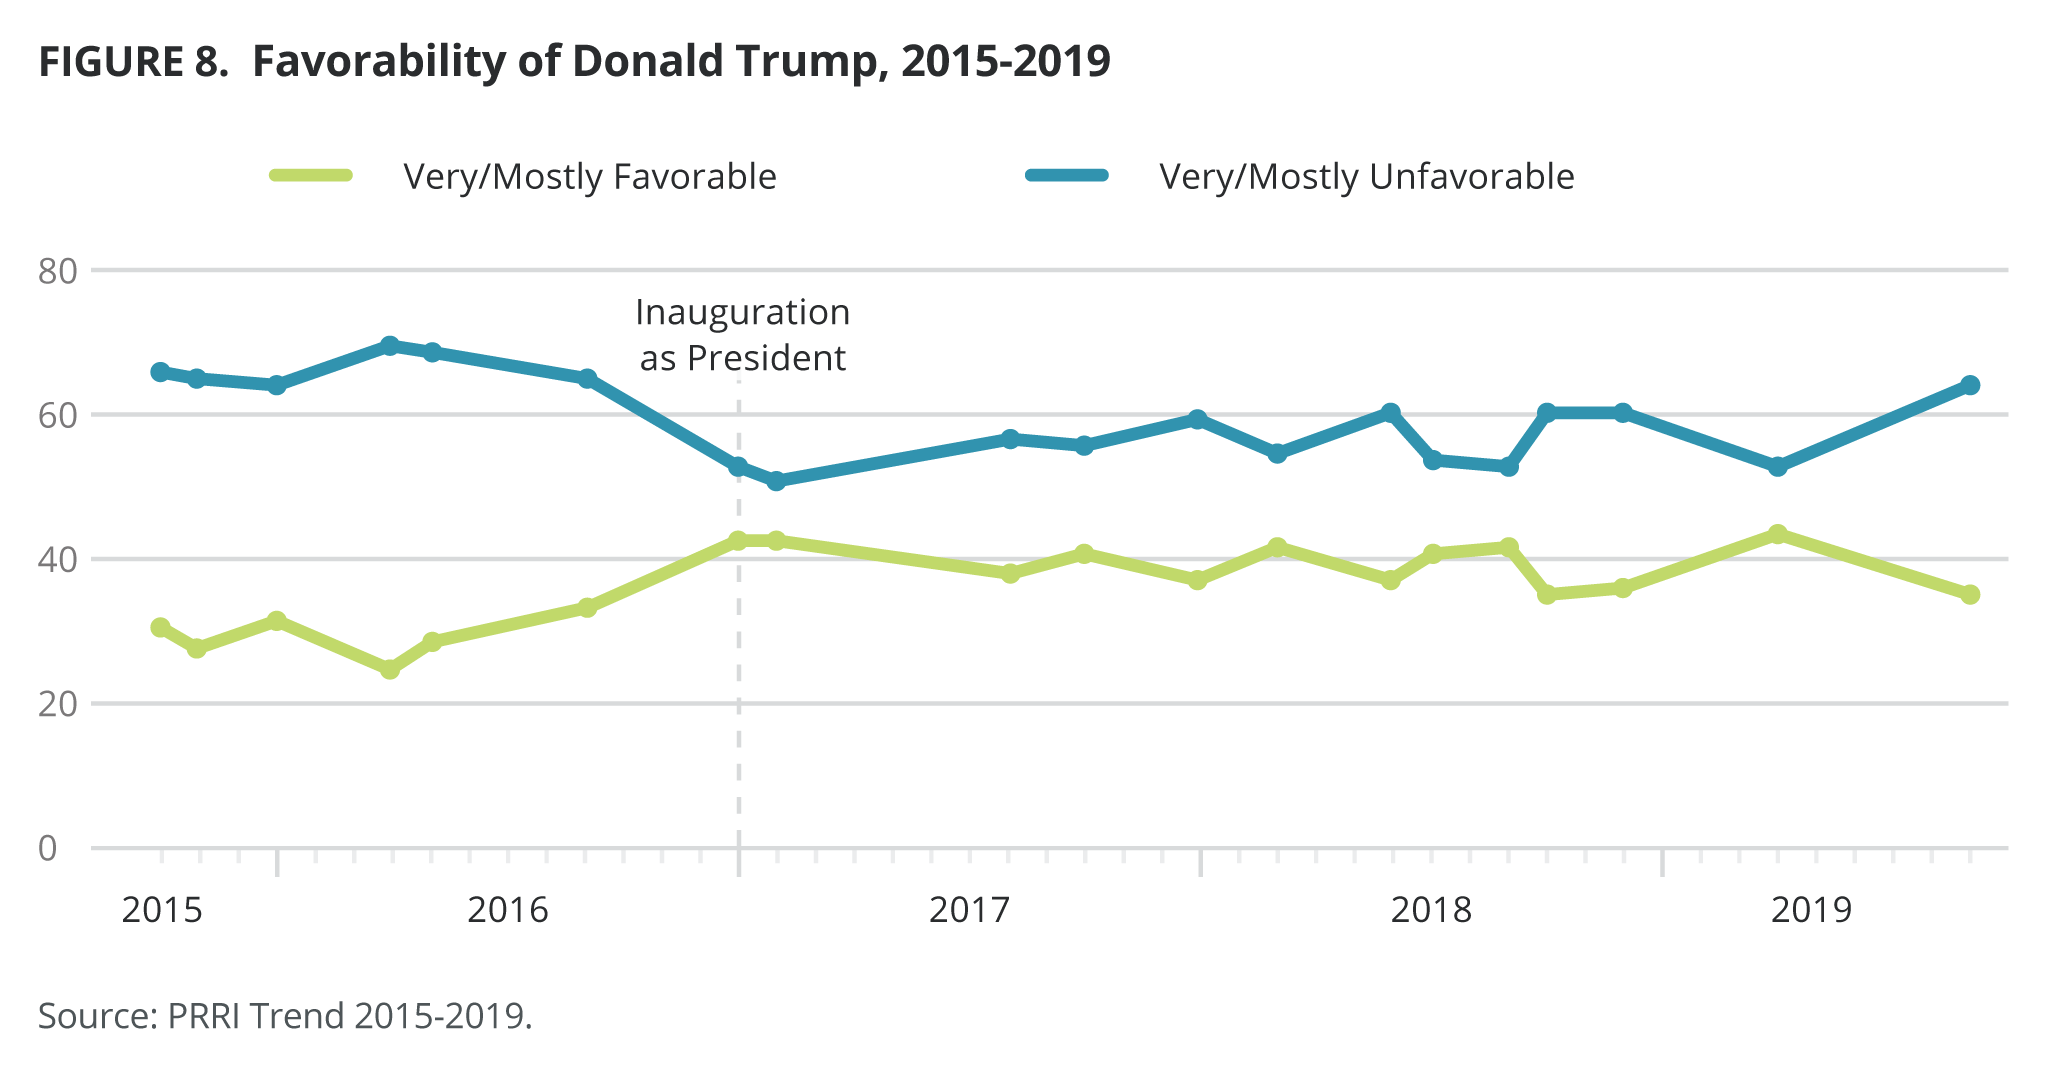
President Trump’s net favorability ratings are at the lowest point since he took office in 2017. Only about one in three (35%) Americans say they have a favorable opinion of the President, and 64% say they have an unfavorable opinion, for a net rating of -29%. A plurality (48%) of Americans say they have a very unfavorable opinion of Trump, the highest since he took office. While Trump’s favorability among Republicans remains extraordinarily high (82%), it is in single digits among Democrats (6%). Among independents, only about one-third (32%) hold a favorable view of Trump, compared to 68% who hold an unfavorable view, including nearly half (46%) who hold a very unfavorable view of the president.
Trump’s job approval rating is not much better. Fewer than four in ten (39%) Americans approve of the job he is doing in office, and 60% disapprove. Nearly nine in ten (88%) Republicans approve of his performance, including a 53% majority who strongly approve. Democrats express the opposite opinion, with more than nine in ten (92%) disapproving of Trump’s job performance; notably, Democrats are more likely to strongly disapprove (77%) than Republicans are to strongly approve. More than six in ten (63%) independents disapprove of Trump’s job performance, while just over one-third (36%) approve.
More than three in four (77%) white evangelical Protestants approve of the job Trump is doing in office, including half (50%) who strongly approve. A majority (54%) of white mainline Protestants approve of Trump’s job performance, including 27% who strongly approve. White Catholics divide relatively evenly between approval (48%) and disapproval (50%), while Hispanic Catholics overwhelmingly disapprove (28% approve, 72% disapprove), including a 52% majority of Hispanic Catholics who strongly disapprove Other religious groups are more likely to disapprove than they are to approve, with black Protestants (86% disapprove) and religiously unaffiliated Americans (81% disapprove) registering as Trump’s strongest critics among religious groups.
White Americans (48%) are more likely than all Americans to approve of Trump’s job performance. However, there are divisions by education: A majority (54%) of white Americans with no college degree approve of Trump’s performance, while just 36% of white college graduates say the same. Only 15% of black Americans and 27% of Hispanic Americans approve of Trump’s performance. Majorities of black (85%) and Hispanic (74%) Americans disapprove of Trump’s job performance. Americans of other or mixed races are slightly more positive in their assessments of Trump’s performance, with 37% saying they approve, and 62% saying they disapprove.
Republican and Republican-leaning Americans who prefer Trump to be the party’s nominee almost universally approve of his performance: 98% approve, including 62% who strongly approve and 36% who somewhat approve. Americans who have made up their minds in the election for president are similarly unified in their opinions, with 96% of Trump supporters saying they approve of his job performance, and 96% of Americans who will support the Democratic candidate saying they disapprove of Trump’s performance. Americans who say their 2020 vote depends on who becomes the Democratic nominee are half as likely to approve than disapprove of Trump’s job performance (33% vs. 66%).
Trump Could Lose More Support Than He Might Gain
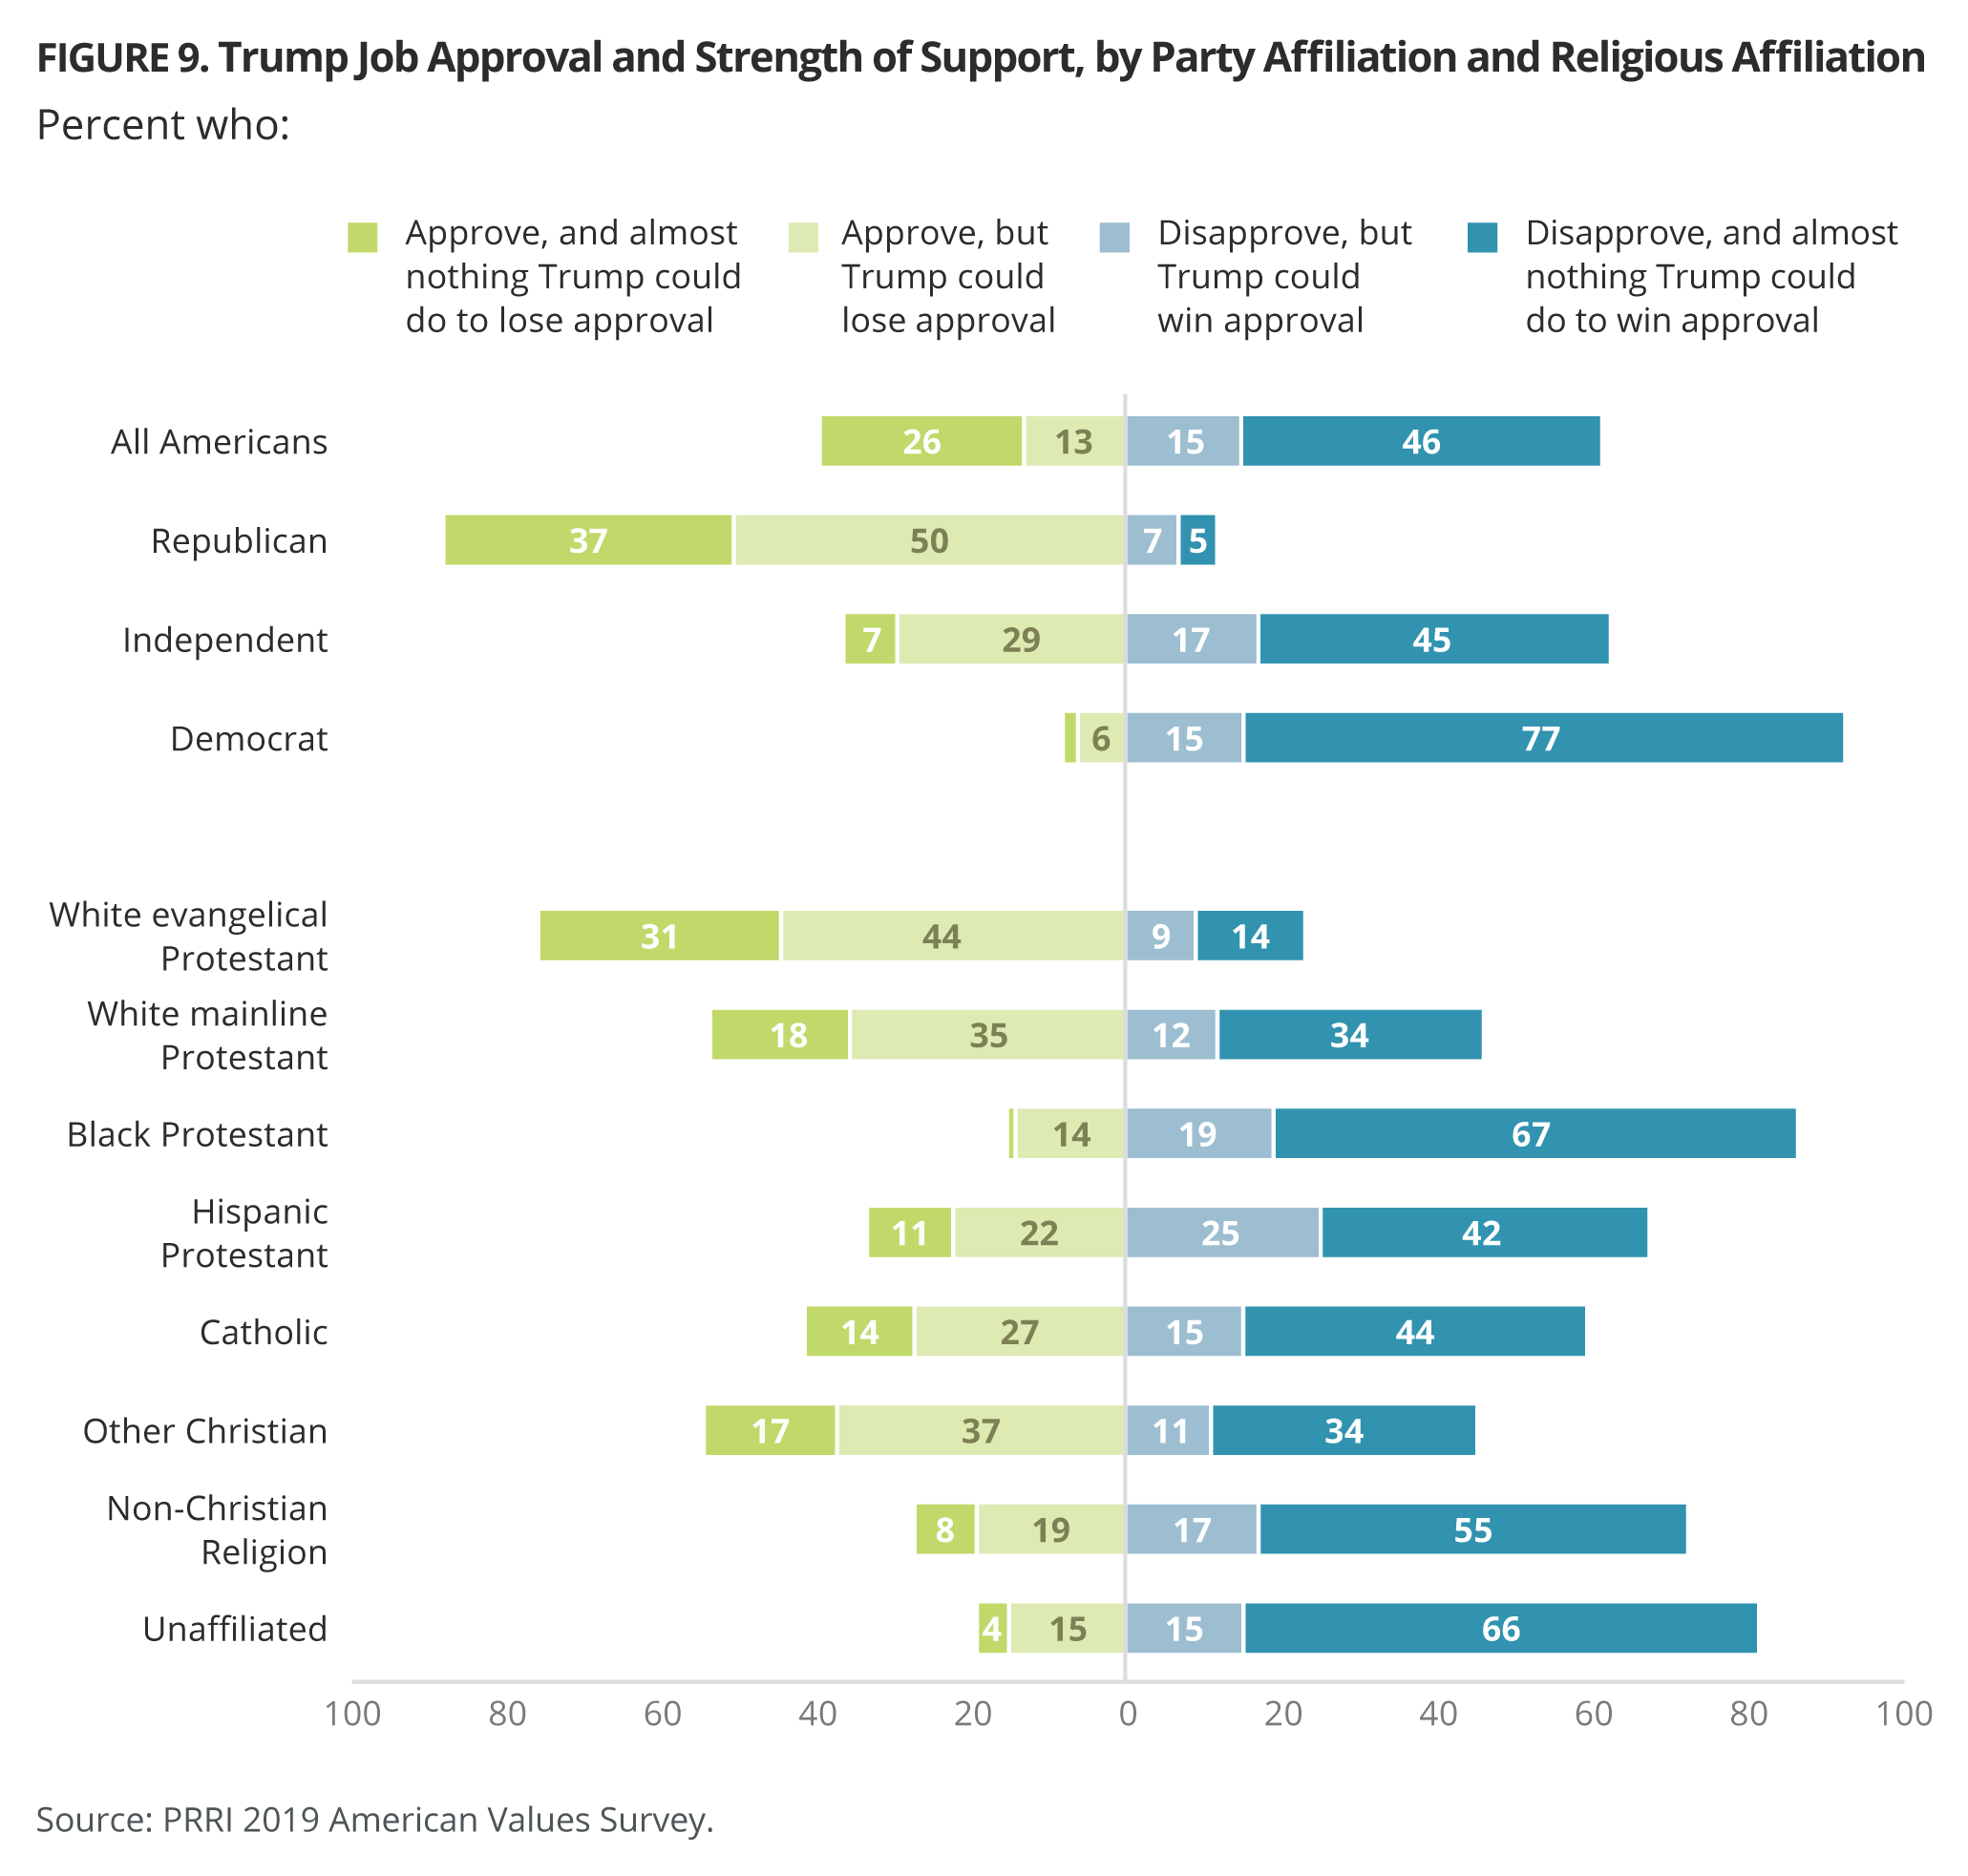
Americans who disapprove of Trump’s job performance are mostly set in their convictions, with three in four (75%) saying there is almost nothing Trump could do to win their approval. This is consistent with October 2018 (78%), though an increase from the 61% who said the same in 2017.
More than eight in ten (83%) Democrats who disapprove of Trump say there’s almost nothing Trump could do to win their support. Independents are less likely to say the same (72%), although fewer than three in ten (28%) say Trump could win their approval.
While most who disapprove of Trump are set in their ways, Americans who approve of Trump’s job performance are more open to the idea of changing their mind: Two-thirds (66%) say he could do something to lose their approval, while 33% say there is nothing he could do to lose their approval. Republicans (42%) are about twice as likely as independents (20%) to say there is virtually nothing Trump could do to lose their approval.
Trump has extraordinary support among several Republican subgroups who hold favorable views of his job performance. A majority (55%) of Republicans for whom Fox News is their primary news source say there is nothing Trump could do to lose their approval, compared to only 29% of Republicans who do not cite Fox News as their primary news source. Similarly, 45% of Republicans who do not have a college degree say there is virtually nothing Trump could do to lose their support, compared to 35% of college-educated Republicans who say the same.
Donald Trump’s Behavior and the Presidency
Nearly three in four (73%) Americans say they wish Trump’s speech and behavior were more consistent with past presidents, but opinion is polarized. Less than half (46%) of Republicans say they wish Trump’s behavior was more consistent with past presidents, compared to 74% of independents and 88% of Democrats who say the same.
A majority (52%) of white evangelical Protestants say they wish Trump’s speech and behavior were like past presidents, the lowest of any religious group. About seven in ten other Christians (68%) and Catholics (70%) say they wish Trump behaved more like past presidents, as do 72% of white mainline Protestants, 74% of Hispanic Protestants, and 81% of black Protestants. Around seven in ten (69%) non-Christian religious Americans say they wish he were more like past presidents, and religiously unaffiliated Americans (85%) are even more likely to say so.
Republicans and Republican-leaning independents who prefer someone else to be the Republican nominee overwhelmingly (83%) say they wish Trump’s speech and behavior were more in line with past presidents, while only 37% of those who prefer Trump to be the nominee want his speech and behavior to resemble past presidents.
Almost two-thirds (65%) of Americans say that Trump has damaged the dignity of the presidency, while 35% say he has not. Democrats are in near-universal agreement (92%), and more than seven in ten (72%) of independents agree that the dignity of the office of the presidency has suffered under Trump. By contrast, more than three-quarters (76%) of Republicans say Trump has not damaged the dignity of the presidency.
Again, white evangelical Protestants express strikingly different opinions about the president, compared to all other religious groups. Nearly two-thirds (63%) of white evangelical Protestants say Trump has not damaged the dignity of the office. Majorities of all other major religious groups agree that Trump has damaged the dignity of the presidency.
Trump’s Impact on White Supremacist Groups and Violence
A majority (57%) of Americans say Trump’s decisions and behavior have encouraged white supremacist groups. Fewer than one in ten (6%) say he has discouraged white supremacist groups, and around one in three (36%) say his behavior has not had an impact either way. These views have remained largely unchanged since 2018 when 54% said he encouraged white supremacists, 5% said he discouraged white supremacists, and 39% said his decisions and behavior did not have an impact.
Again, Republicans and white evangelical Protestants stand contrary to nearly every other demographic group, with around seven in ten (74% and 70%, respectively) saying that Trump’s behavior has not had an impact on white supremacist groups. A slim majority (51%) of white mainline Protestants agree. White Catholics divide more evenly, with 48% saying he has encouraged white supremacists and 46% saying he has not had an impact.
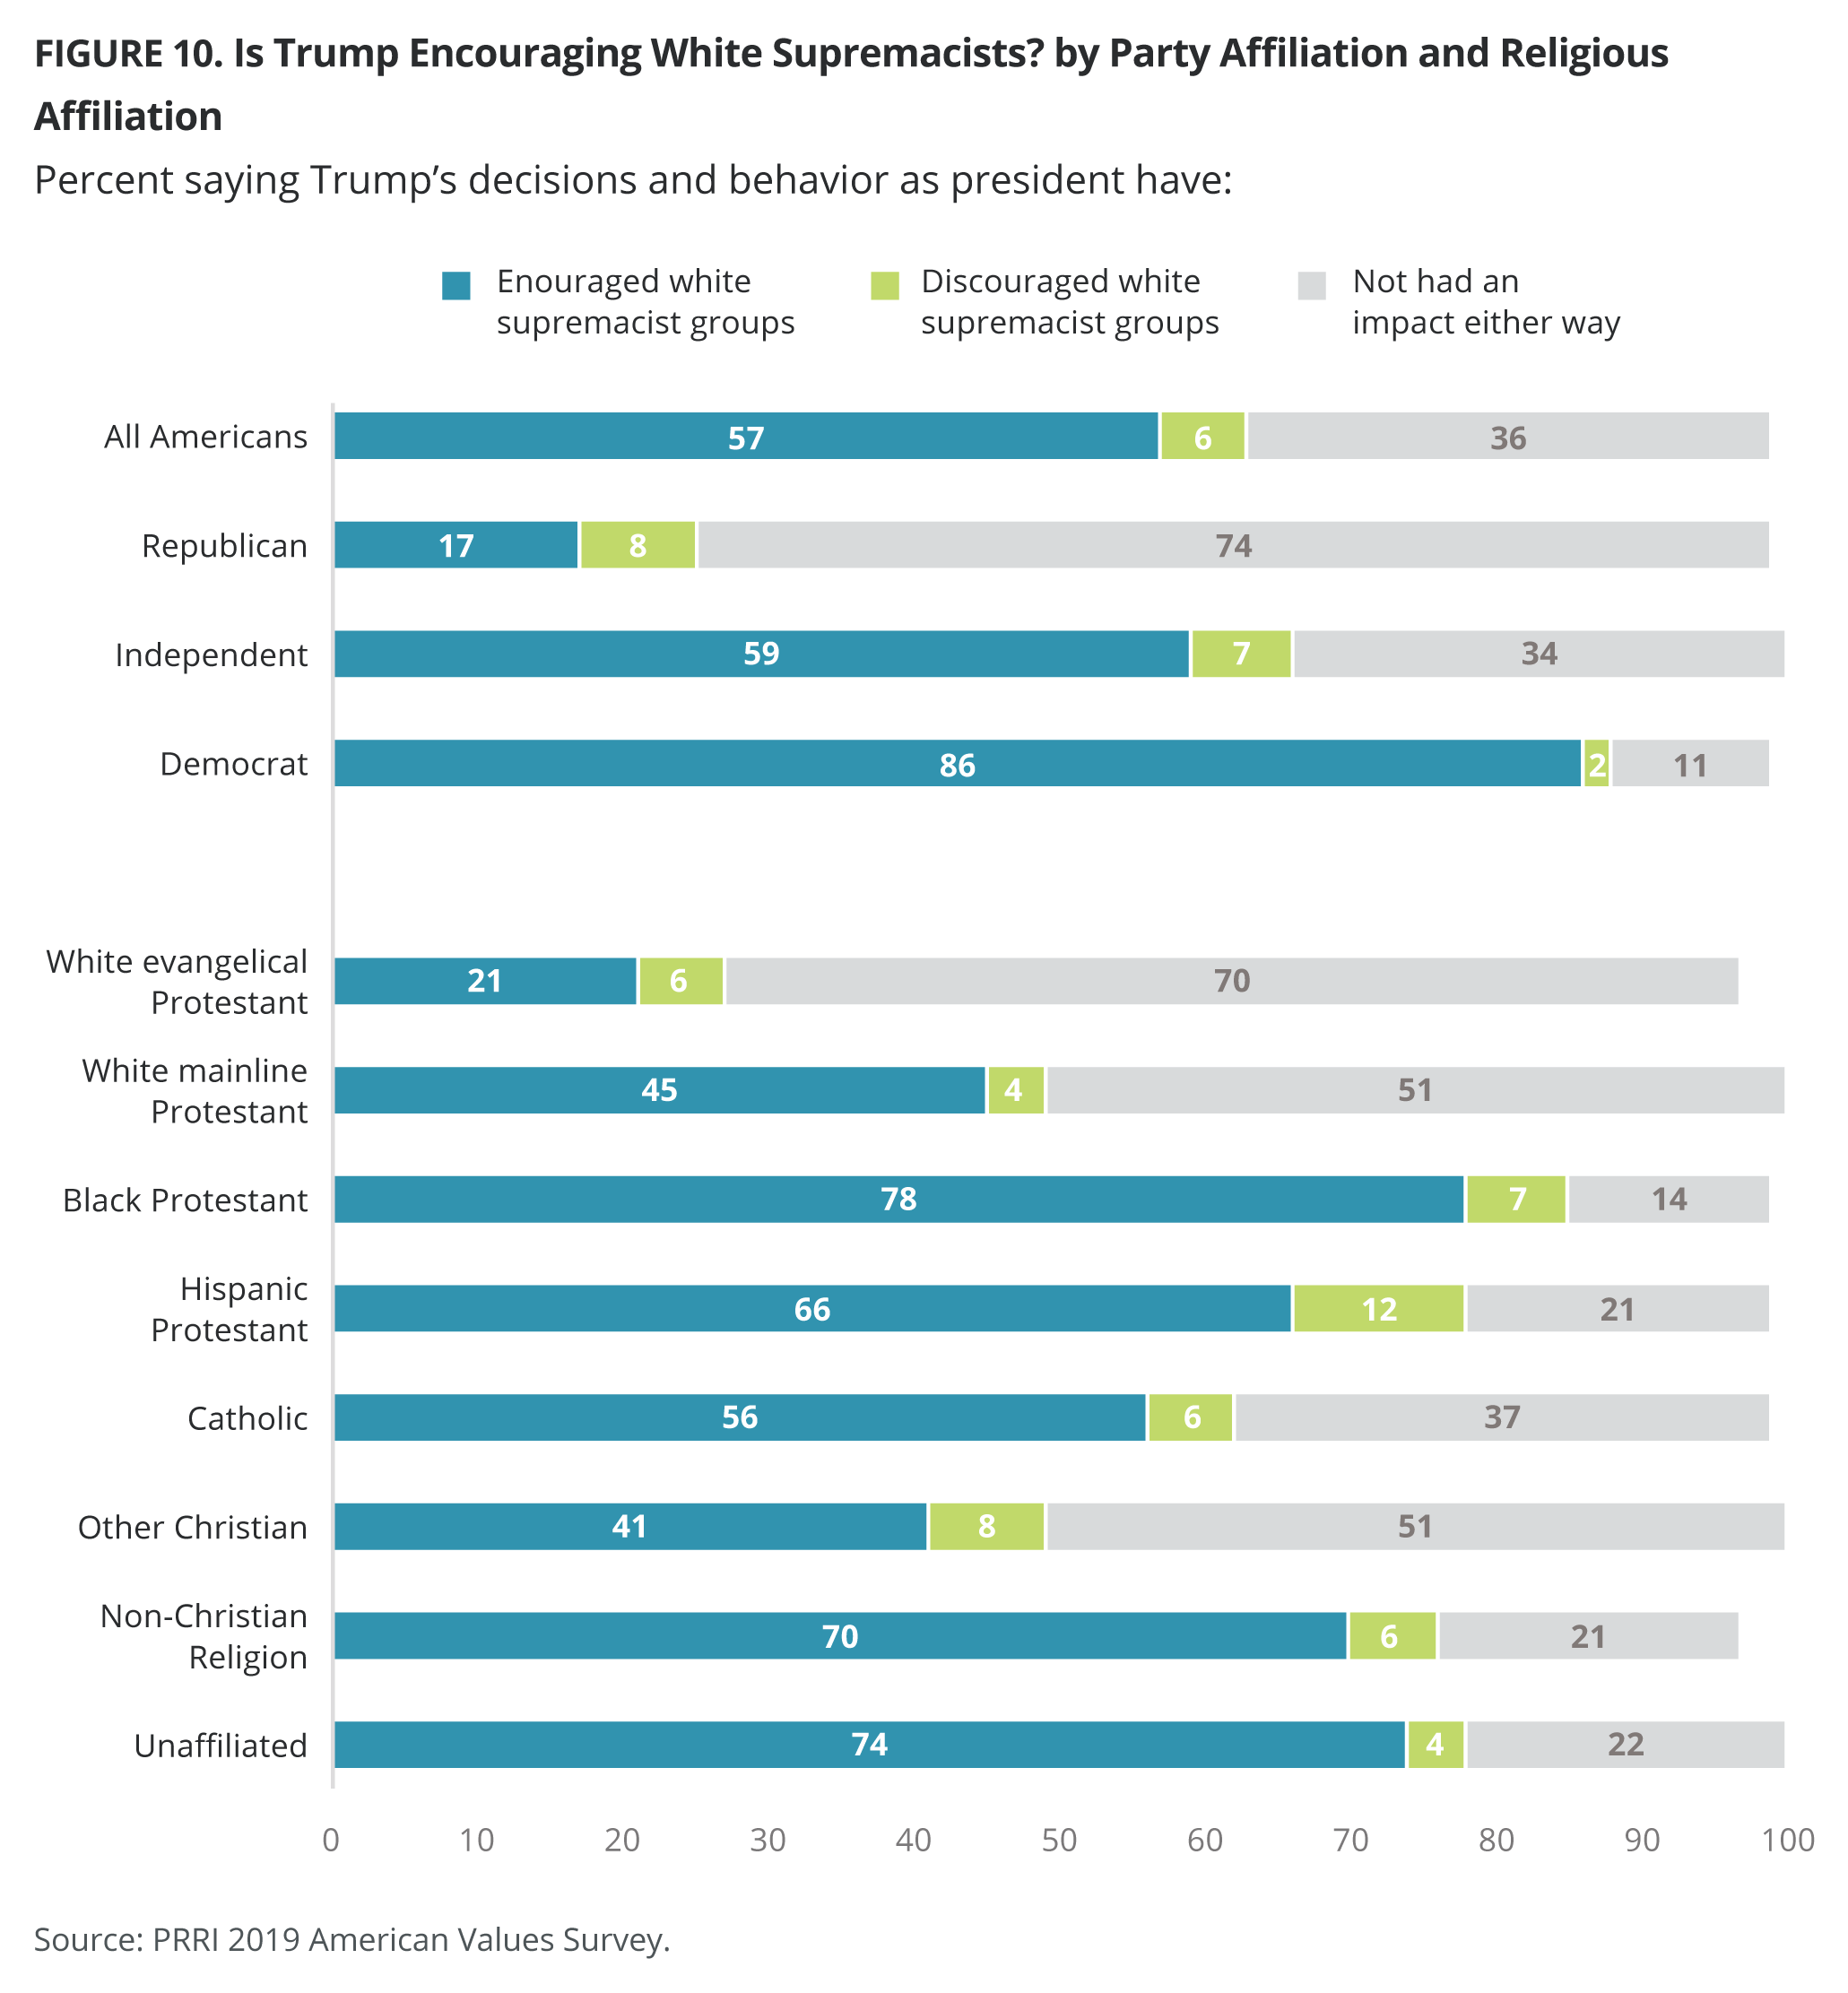
White Americans are divided on whether Trump is encouraging white supremacists, with 49% saying he has encouraged those groups and 44% saying he has not had an impact. This relatively even split masks deeper divisions by education, with 42% of white Americans with no college degree saying Trump has encouraged white supremacists, compared to 62% of white Americans with a college degree saying the same. Strikingly, more than three in four (77%) black Americans say Trump is encouraging white supremacists, along with 69% of Hispanic Americans and 59% of Americans of mixed or other races.
There are also stark partisan divides on the more general question about whether there is a connection between harsh or violent language in politics and actual violence. Half (50%) of Americans say harsh and violent language in politics contributes a lot to violence in society. Around one-third (35%) say it contributes a little, and 14% say it does not contribute at all. Only one in four (26%) Republicans say language contributes to problems in society, while a 47% plurality say it only contributes a little bit. In contrast, half (50%) of independents and seven in ten (70%) Democrats say harsh language is contributing a lot to violence in society.
Impact of Trump’s Personal Conduct on His Support
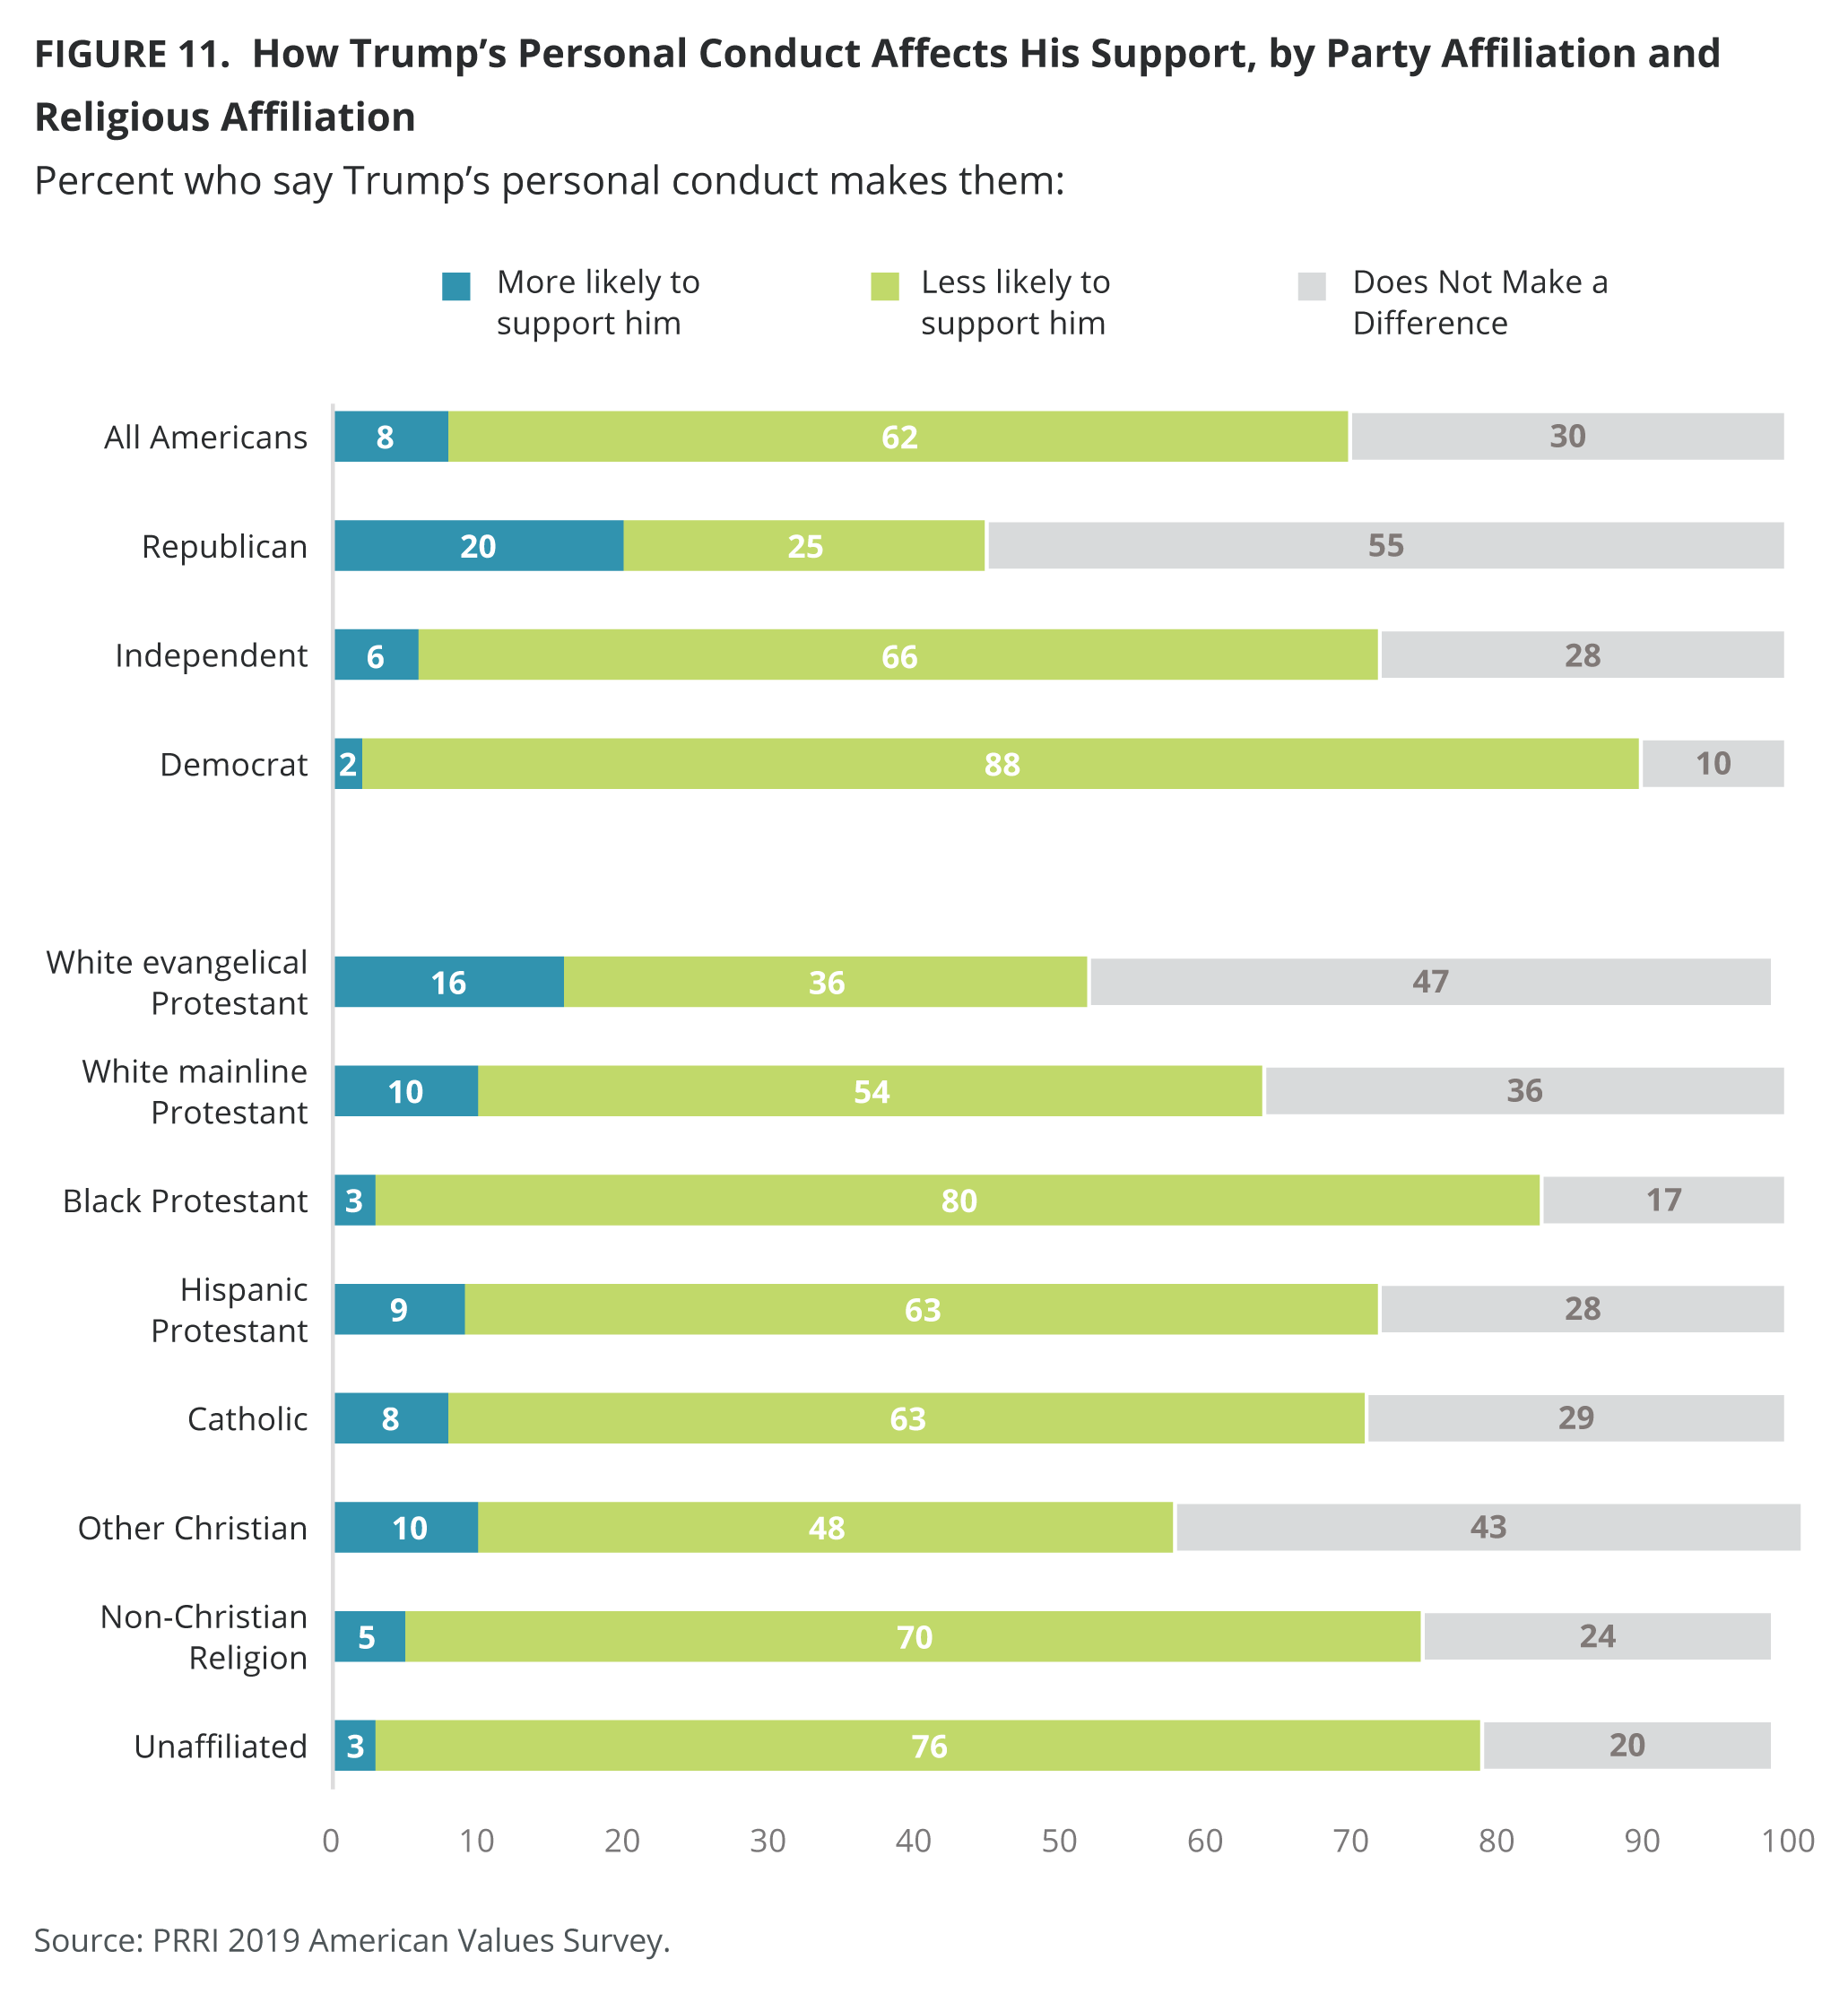
A majority (62%) of Americans say that Trump’s personal conduct and behavior makes them less likely to support him, while 30% say his conduct makes no difference to them, and 8% say it makes them more likely to support him.
Majorities of nearly every demographic group, with the exception of white evangelical Protestants and Republicans, say Trump’s conduct makes them less likely to support him. While more than one-third (36%) of white evangelical Protestants say Trump’s conduct makes them less likely to support him, a plurality (47%) of white evangelical Protestants say Trump’s conduct makes no difference to them, and 16% say it actually makes them more likely to support him. A majority (55%) of Republicans say Trump’s conduct makes no difference to them, while one in four (25%) say it makes them less likely to support him, and 20% say Trump’s conduct makes them more likely to support him.
Trump’s conduct may prove challenging for him electorally: Two-thirds (66%) of independents say they are less likely to support him because of his personal conduct, as do two-thirds (66%) of Americans who say their vote will depend on who wins the Democratic nomination.
Impeachment
Prior to the launch 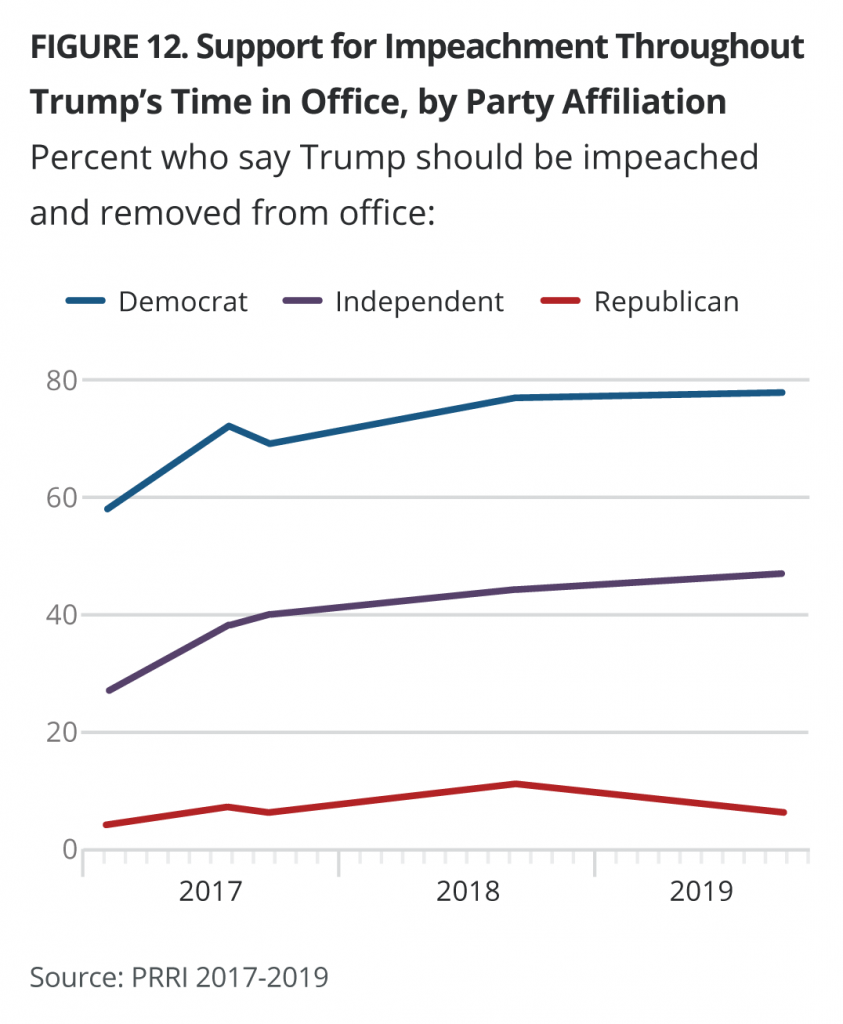 of the House impeachment inquiry, 47% of Americans said that Trump should be impeached and removed from office, compared to a majority (53%) of Americans who disagreed.[11] Support for impeaching Trump has grown throughout his presidency—from 30% in February 2017, to 40% in October 2017, and to 47% in October 2018, but it has remained steady over the last year.[12] Nearly eight in ten Democrats agree that Trump should be impeached and removed from office (78%), but around one in five (21%) disagree. Independents resemble the general population.
Prior to the announcement of impeachment proceedings, however, Republicans were united behind Trump, with 94% saying he should not be impeached and removed from office. Feelings are essentially unanimous among two subsets of Republicans: Virtually all Republican white evangelical Protestants (99%) and Republicans who say Fox News is their primary source of news (98%) oppose Trump being impeached and removed from office. Republicans remain unified across education levels, with 96% of Republicans with a college degree opposing impeachment, alongside 92% of Republicans without a four-year degree.
Americans’ Identification with Cultural, Political, and Religious Labels
The survey asked Americans to say how well the following 17 different terms described them.[13] The following list gives the percentage of Americans who said the following terms describe them somewhat or very well:
- Environmentalist: 71%
- Spiritual: 70%
- Traditional: 68%
- Progressive: 67%
- America first: 65%
- Humanist:65%
- Feminist: 47%
- Christian right or religious right: 46%
- Capitalist: 43%
- Nationalist: 37%
- Socialist: 32%
- Religious progressive: 31%
- Secular: 28%
- The resistance: 27%
- Tea Party: 19%
- Anti-religious: 18%
- Deplorable: 14%
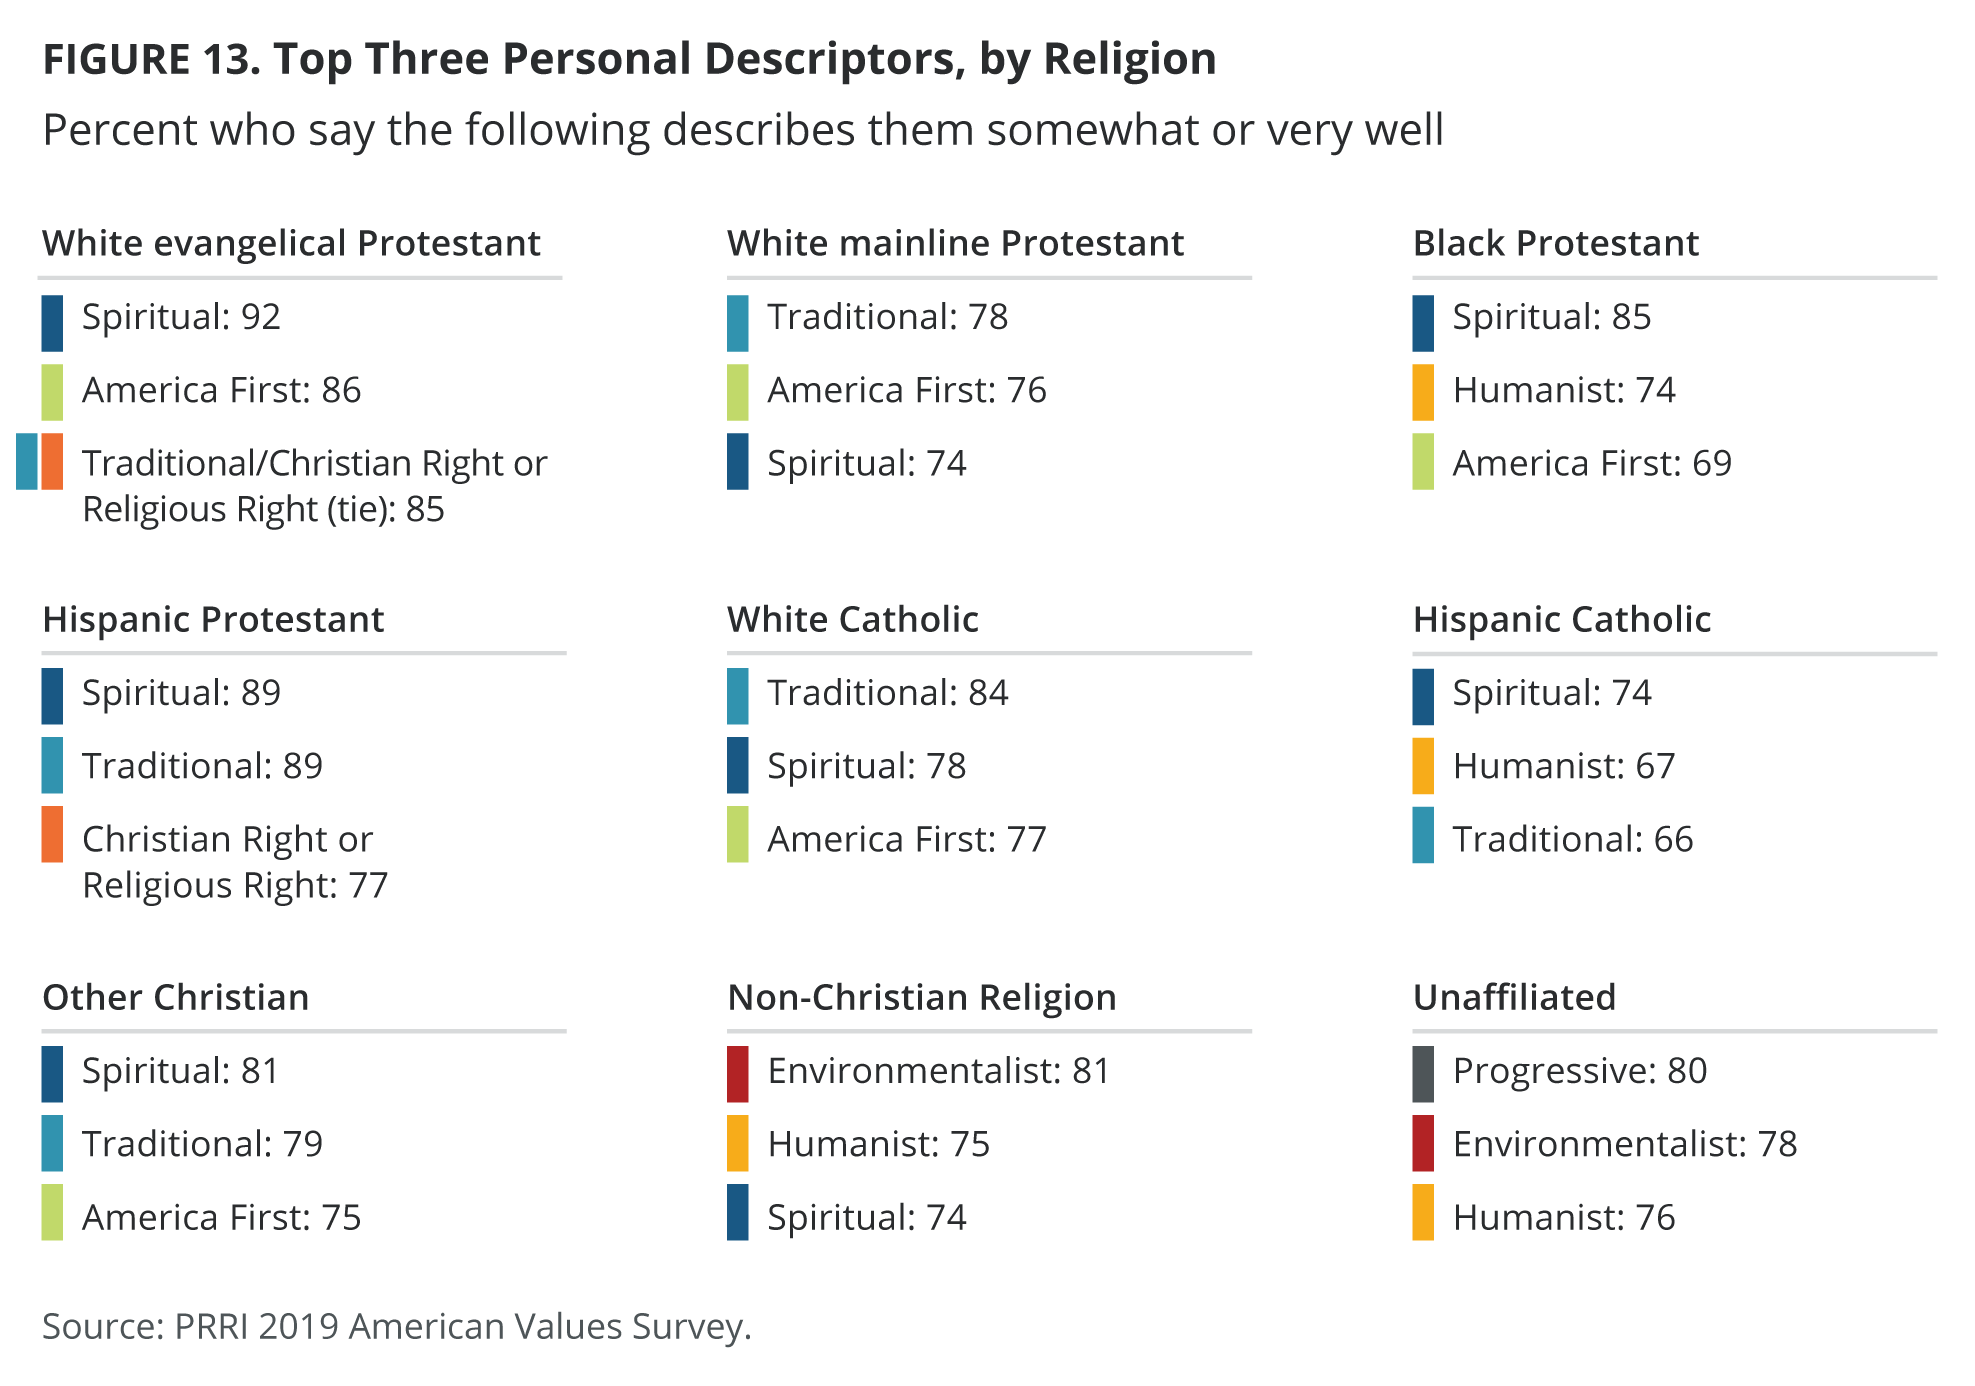
The top three choices vary significantly by political affiliation. Nine in ten (90%) Republicans say that America first describes them somewhat or very well, followed by traditional (86%), and spiritual (77%). Democrats’ top three choices are progressive (82%), environmentalist (80%), and humanist (79%). There is less consensus among the more diverse group of independents, but their top three choices are environmentalist (70%), progressive (66%) and spiritual (66%) top their list.
Spiritual is within the top three identifiers of all religious groups, except the religiously unaffiliated, whose top descriptors are progressive (80%), environmentalist (78%), and humanist (76%). “Christian or religious right” is only within the top three descriptors of white evangelical Protestants (85%) and Hispanic Protestants (78%). “Religious progressive” does not fall into the top three descriptors for any religious group.
Shifts in Partisan and Religious Identities
Nearly six in ten Americans (57%) report a change to how strongly they think about themselves in partisan terms since Trump was elected in 2016, but more than four in ten (43%) say their partisan self-image has not changed. More than one in four (27%) say they have become more likely to think of themselves as Democrats, fewer than one in five (17%) say they have become more likely to think of themselves as independents, and only 13% report they have become more likely to think of themselves as Republicans.
Republicans (48%) and independents (53%) are less likely than Democrats (72%) to say they have changed their partisan self-conception. These changes are mostly partisan entrenchment: Of those who report a change, 86% of Republicans said they think of themselves as more Republican, 89% of Democrats say they think of themselves as more Democratic, and 69% of independents say they think of themselves as more independent. One in five (21%) independents who have changed their self-conception say they now think of themselves as more Democrat, compared to 9% who say they think of themselves as more Republican. Only 3% each have shifted their partisan self-image from Republican to Democrat, or Democrat to Republican.
The vast majority of Americans (86%) say their religiosity has not changed since 2016. Only 9% report becoming more religious, and 5% report becoming less religious. Within most religious groups, respondents are similarly likely to say that since 2016 they have become either more or less religious since 2016. However, white evangelical Protestants are more likely to say they have become more religious than less (9% vs. less than 1%); and the religiously unaffiliated are more likely to say they have become less religious than more (6% vs. less than 1%).
Changing Social Norms and Demographics
Gender Roles
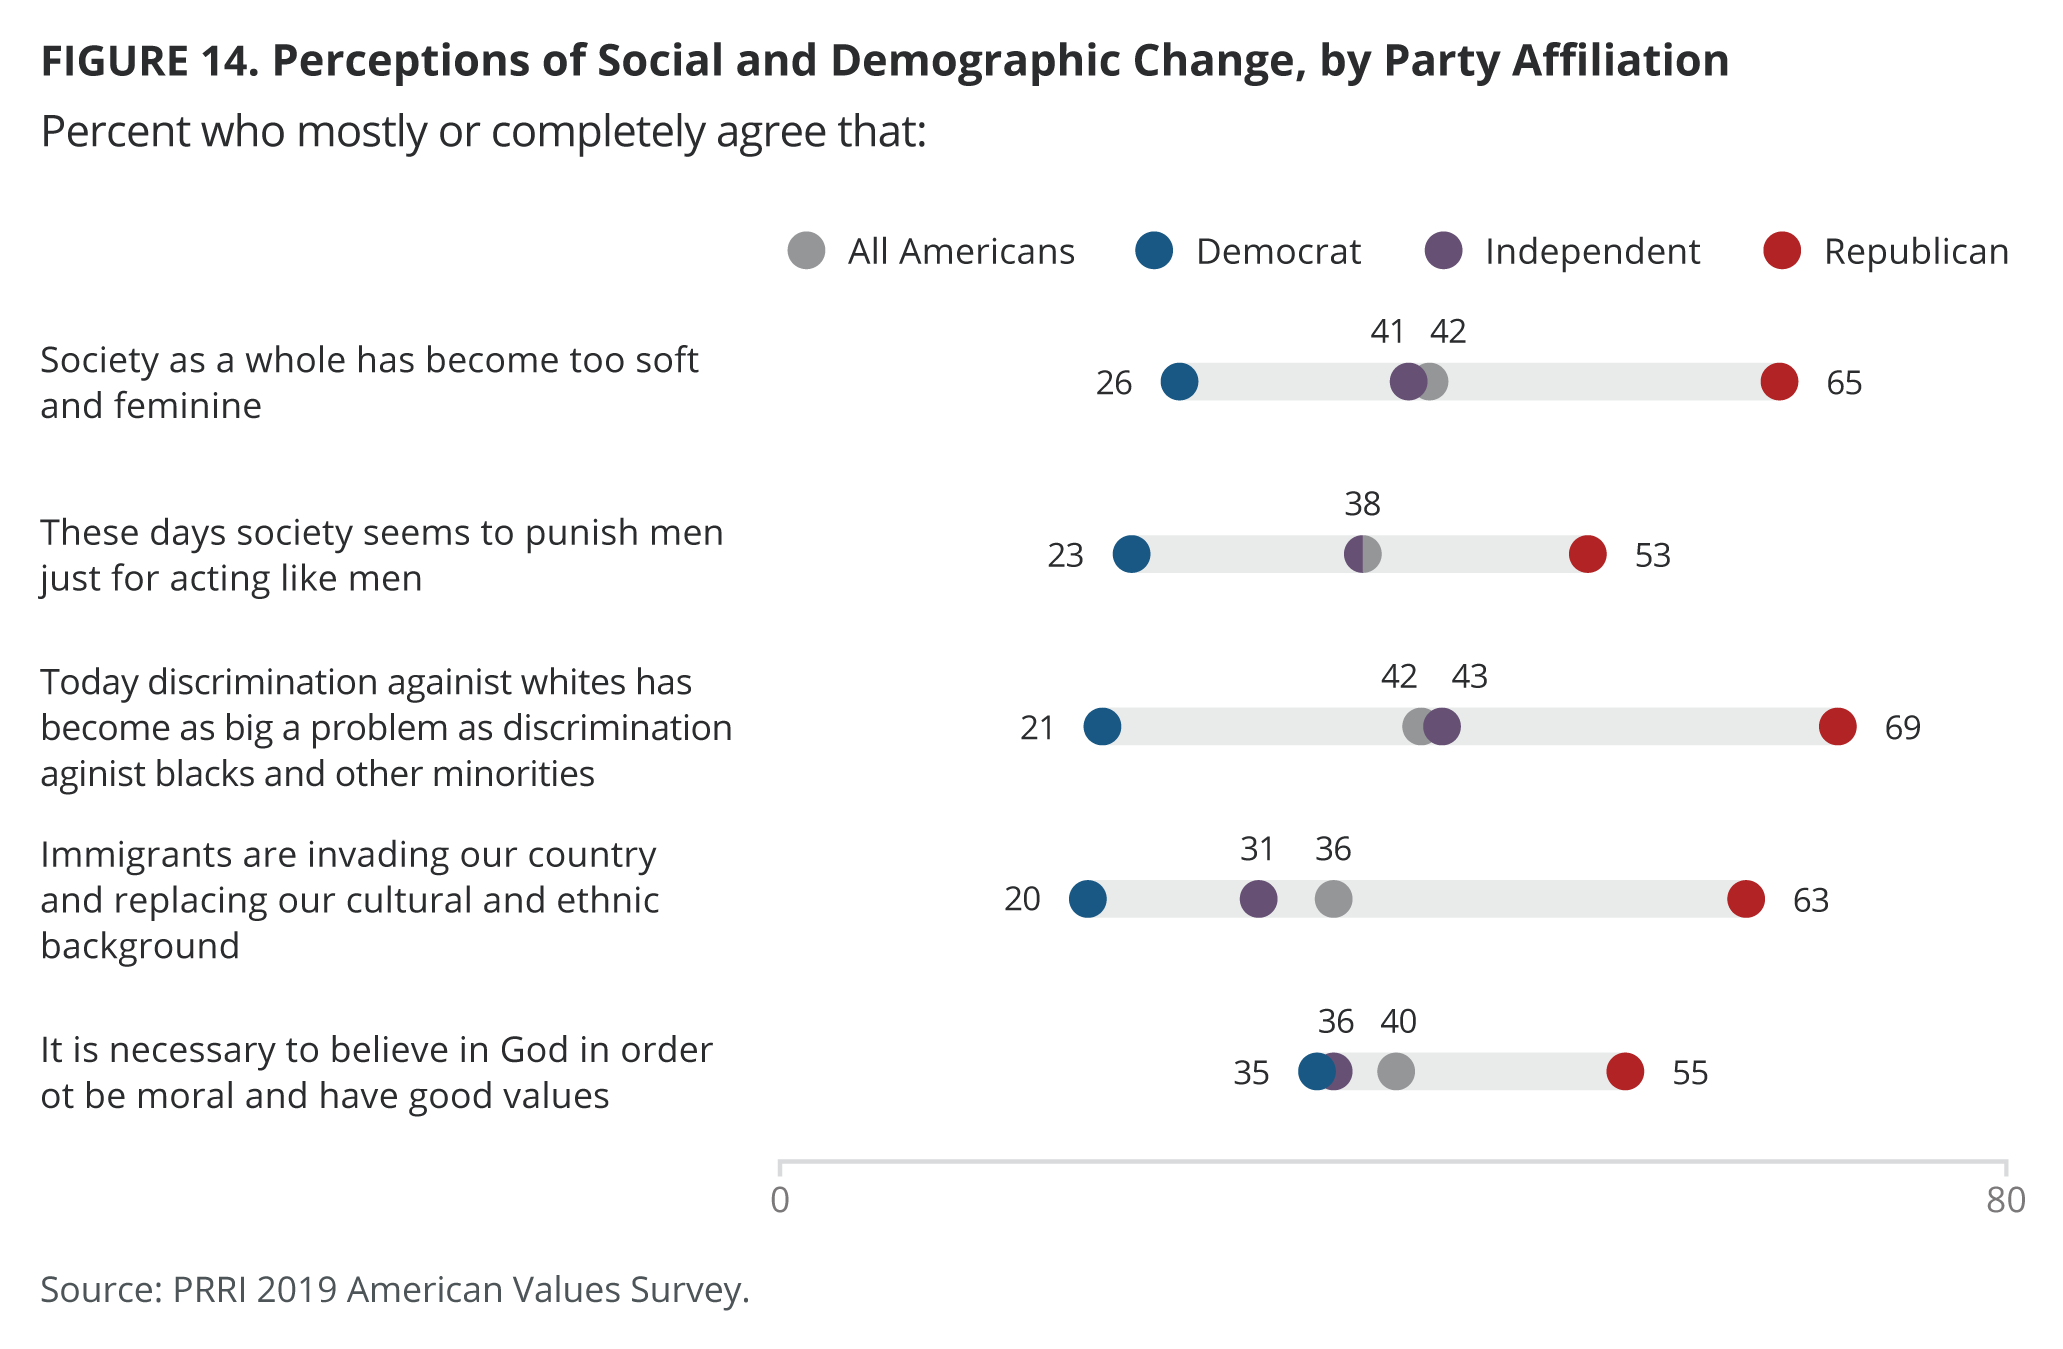
About four in ten Americans agree both that today “men are being punished just for being men” (38%) and that “society has become too soft and feminine” (42%).
A majority of Republicans think men are punished just for being men (53%) and that society as a whole has become too soft and feminine (65%), compared to only around one in four Democrats (23% and 26%, respectively). More Republicans who cite Fox News as their primary source of news agree that society punishes men just of being men (68%) and that society has become too feminine (73%).
Among religious groups, 57% of white evangelical Protestants, 49% of other Christians, 46% of Catholics, 43% of white mainline Protestants, and 43% of black Protestants agree that society is becoming too soft and feminine. Seven in ten (70%) religiously unaffiliated disagree that society is becoming too feminine, as do two-thirds (65%) of non-Christian religions, and over half (54%) of Hispanic Protestants. Response patterns among religious groups on the question of men being punished just for being men are similar.
Racial Discrimination and Immigration
More than four in ten (42%) Americans believe that “discrimination against whites is as big a problem as discrimination against blacks and other minorities,” and more than one-third (36%) believe that “immigrants are invading our country and replacing our cultural and ethnic background.”
Approximately two-thirds of Republicans agree both that discrimination against whites has become as much of a problem as discrimination against blacks (69%) and that immigrants are invading the country and changing American culture (63%). Independents (43% and 31%) and Democrats (21% and 20%) are much less likely to agree with either of these statements.
More than three-quarters of Republicans who rely on Fox News as their primary news source agree that whites face discrimination similar to black racism (77%) and that immigrants are invading the country (78%), compared to smaller majorities of Republicans who do not say Fox News is their primary news source (63% and 52%). Republicans who are white evangelical Protestants (75%) are more likely than all Republicans to say that immigrants are invading American society.
Nearly half of whites (49%), compared to only 23% of black Americans and 30% of Hispanic Americans, think so-called reverse discrimination is a big problem. Similarly, four in ten (40%) whites and 37% of black Americans, compared to only 22% of Hispanics, think immigrants are taking over. A majority of whites without college degrees (57%), compared to just over one-third (36%) of whites with college degrees, agree that discrimination against whites is as big a problem as discrimination against blacks.
Americans ages 65 and older are more likely than younger Americans ages 18-29 to agree that discrimination against whites is as big a problem as discrimination against black Americans and other minorities (46% vs. 34%) and to agree that immigrants our invading the country (45% vs. 26%).
The Relationship Between Religious Belief and Morality
Four in ten (40%) Americans think it is necessary to believe in God in order to be a moral person. Republicans (55%) are also more likely than independents (36%) or Democrats (35%) to say that belief in God is necessary for morality. Among religious groups, Hispanic Protestants (72%), black Protestants (71%), and white evangelical Protestants (64%) are most likely to agree with this statement. A slim majority (51%) of other Christians and just under half of Catholics (47%) agree as well. One in three (33%) white mainline Protestants and one in four (26%) of non-Christian religious Americans think belief in God is necessary for morality. Not surprisingly, the religiously unaffiliated (11%) show the lowest support for this concept. Almost half of (45%) seniors ages 65 and over think belief in God is necessary for morality, compared to just under four in ten (38%) younger Americans ages 18-29.
Socialism, Capitalism, and Corporate America
Contrasting Understandings of Socialism and Capitalism
Americans are divided along partisan lines in their understandings of socialism and capitalism.
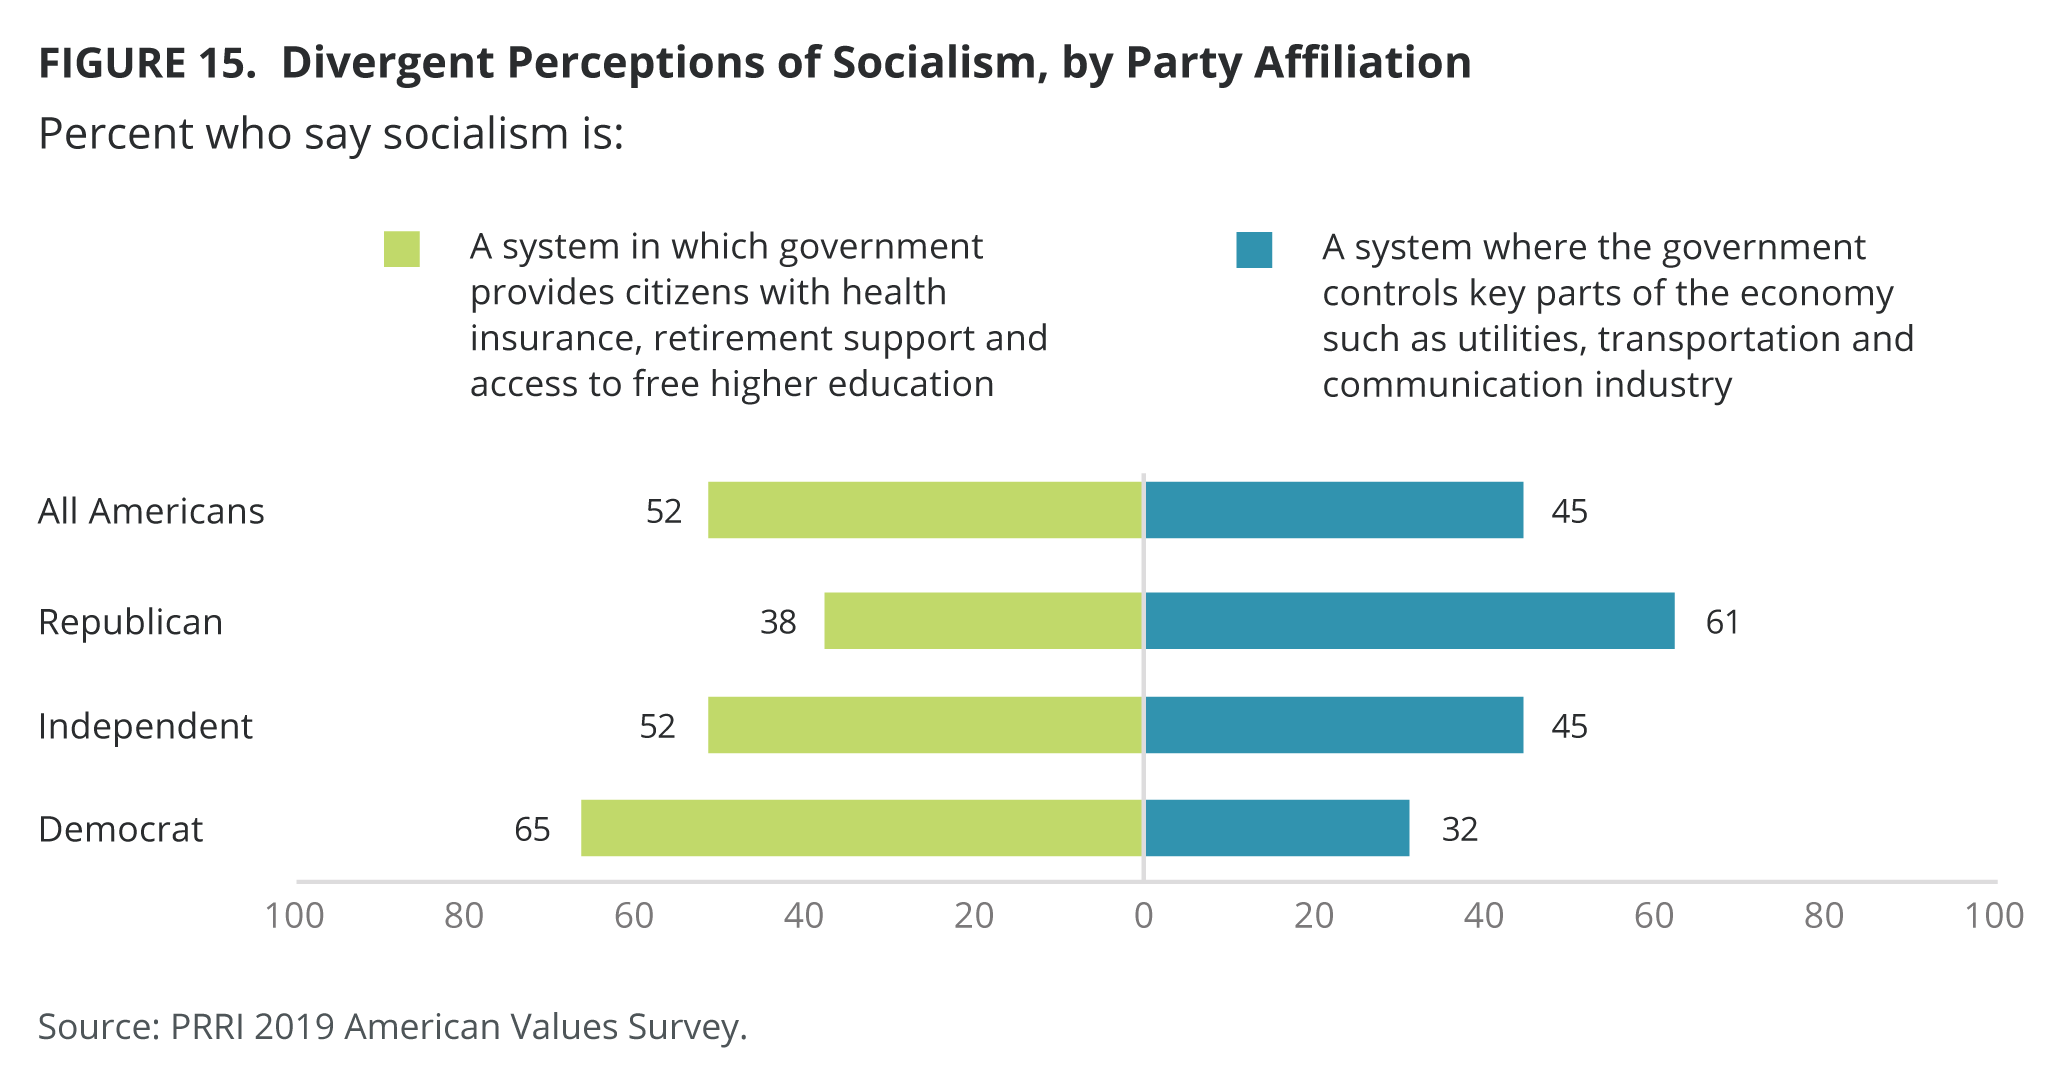
When asked to choose between two statements describing socialism, a slim majority (52%) believe socialism is “a system in which a government provides citizens with health insurance, retirement support, and access to free higher education,” and 45% see socialism as “a system where a government controls key parts of the economy, such as utilities, transportation, and communication.” Democrats are more likely to view socialism as providing a stronger social safety net for everyday Americans (65%) than to see it as a form of government control (32%). Republicans, on the other hand, are more likely to understand socialism as a form of government control (61%) than as a social safety net for Americans (38%). Independents, like the general public, are divided between these two statements.
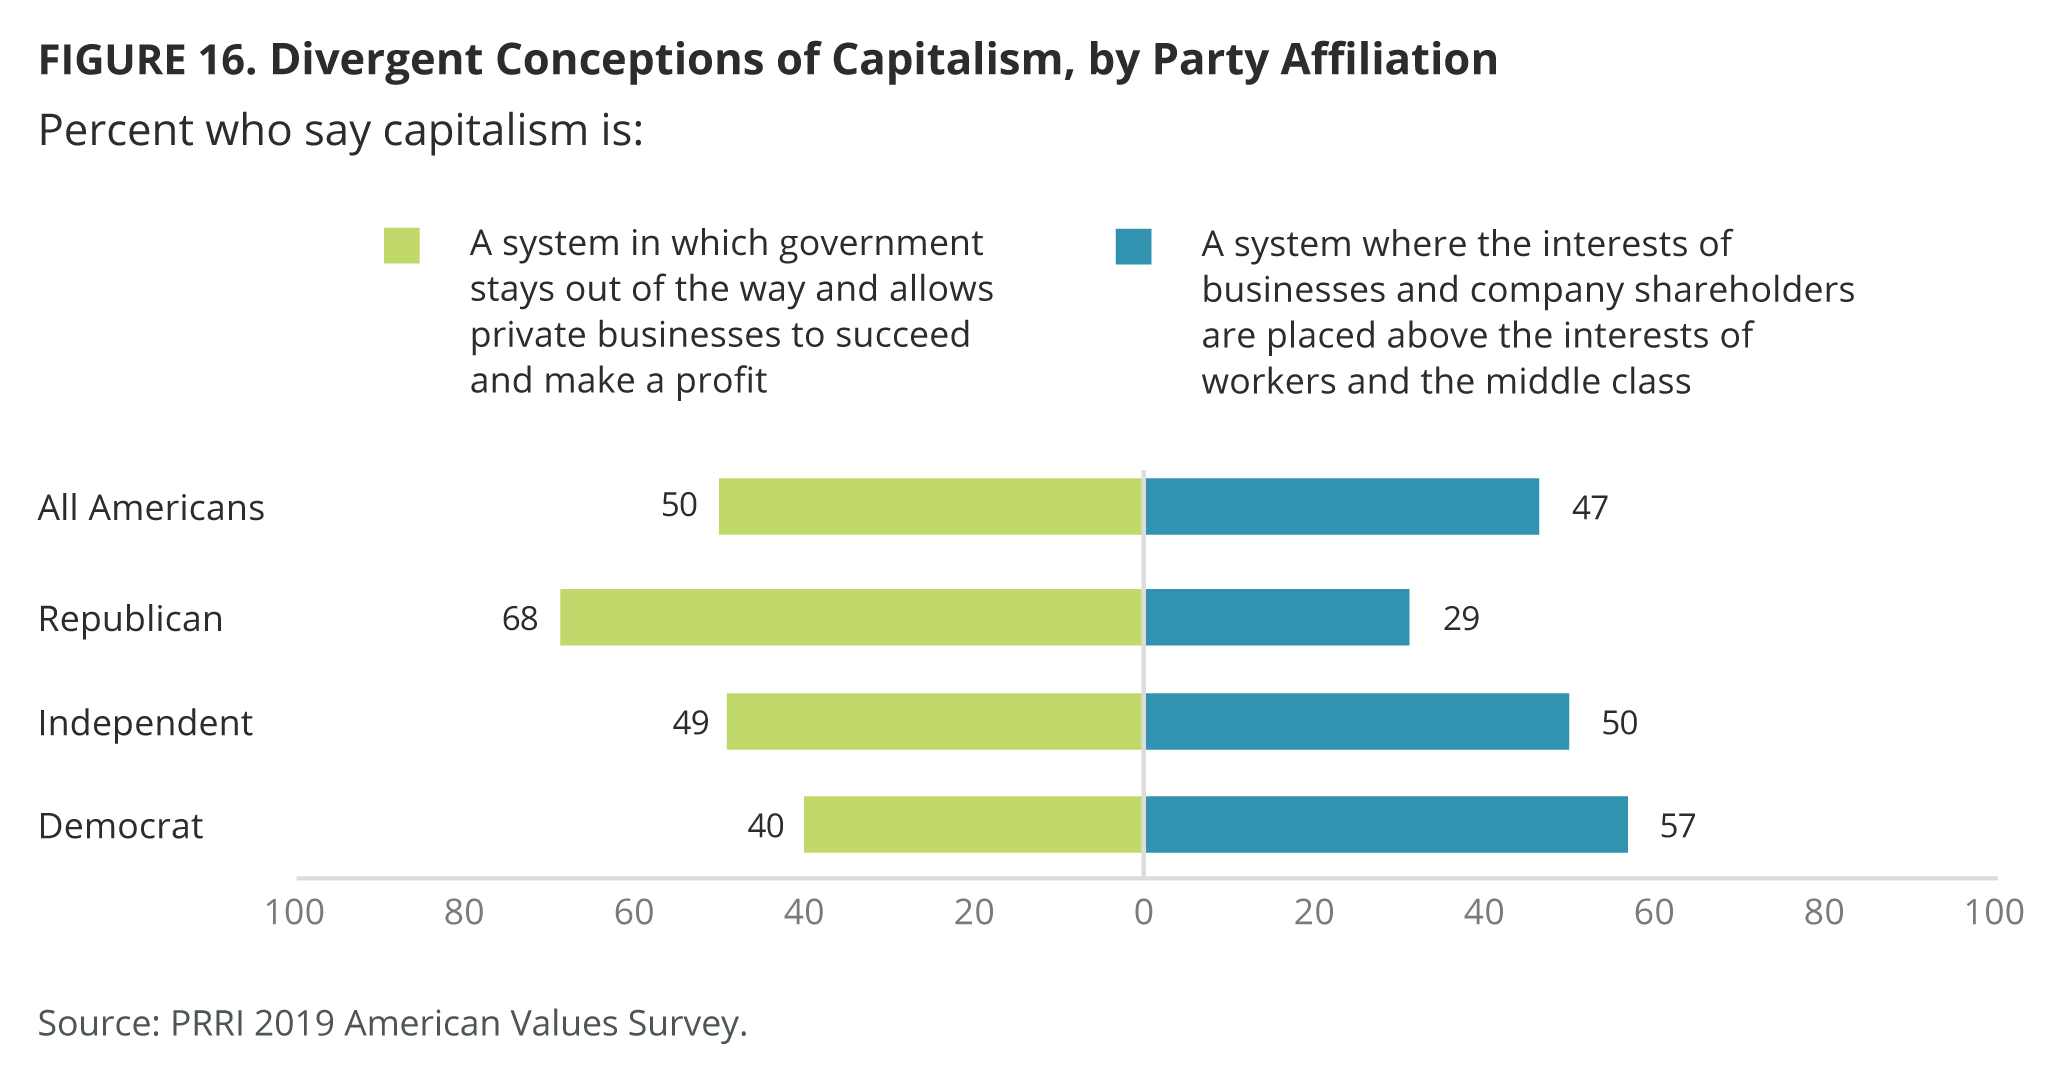
When asked to choose between two statements describing capitalism, half (50%) of Americans say capitalism is “a system in which a government stays out of the way and allows private businesses to succeed and make a profit,” while nearly as many (47%) view capitalism as “a system where the interests of businesses and company shareholders are placed above the interests of workers and the middle class.” Almost seven in ten (68%) Republicans and just four in ten (40%) Democrats agree that capitalism is a system in which the government stays out of the way of businesses. Democrats (57%) are more likely than Republicans (29%) to view capitalism as a system that prioritizes businesses over workers and the middle class. Independents are evenly divided between the two definitions.
While there are few differences in understandings of socialism by age, understandings of capitalism vary widely by age group. Younger Americans ages 18-29 (60%) are significantly more likely than older Americans ages 65 and over (37%) to say that capitalism is a system that places the interests of businesses over the middle class.
Majorities of black (56%) and Hispanic (61%) Americans agree that capitalism offers more benefits to businesses than to workers and the middle class, compared to only 42% of whites. A majority (55%) of whites say capitalism is a system where the government allows private business to grow and make profits. Whites with college degrees (62%) are more likely than those without college degrees (51%) to hold that view.
The Role of Corporations in Politics
Americans hold somewhat paradoxical views about the role of corporations in politics. Generally speaking, more than eight in ten (84%) Americans prefer large business corporations to stay out of politics, compared to just 14% who say businesses should take political stances. At the same time, however, a slim majority (52%) of Americans say that it is extremely or somewhat important that their own company reflects their political views, compared to 47% who say it is not very or not at all important. Older Americans ages 65 and over (9%) are less likely than those ages 18-29 (26%) to say large businesses should take political stances. The younger group (58%) is slightly more likely than seniors (51%) to say it is extremely or somewhat important for companies to reflect their own political views.
A plurality (46%) of Americans say corporations do a mixture of both supporting and opposing their personal views. Less than one in five (19%) say corporations mostly oppose their political views and values, and only 8% say corporations mostly support the political stances they hold as individuals. One in four (25%) Americans say that they do not think corporations have clear political views.
Republicans (52%) and independents (49%) are more likely than Democrats (41%) to say that large business corporations both support and oppose their personal views. One in four (26%) Democrats believe that the political stances of corporations mostly oppose their own, compared to 17% of independents and just 13% of Republicans.
Key Issues for 2020: Immigration, Climate Change and the Environment, and Tariffs
Support for Restrictive Immigration Policies
Americans are also strongly divided by party on immigration policy. Since attitudes on specific immigration policies are strongly correlated, a four-point composite index was developed to capture overall attitudes on immigration policy, using the following questions:
- Passing a law that places stricter limits on the number of legal immigrants coming to the U.S.,
- Temporarily preventing people from some majority-Muslim countries from entering the U.S.,
- Building a wall along the U.S. border with Mexico, and
- Passing a law to prevent refugees from entering the U.S.
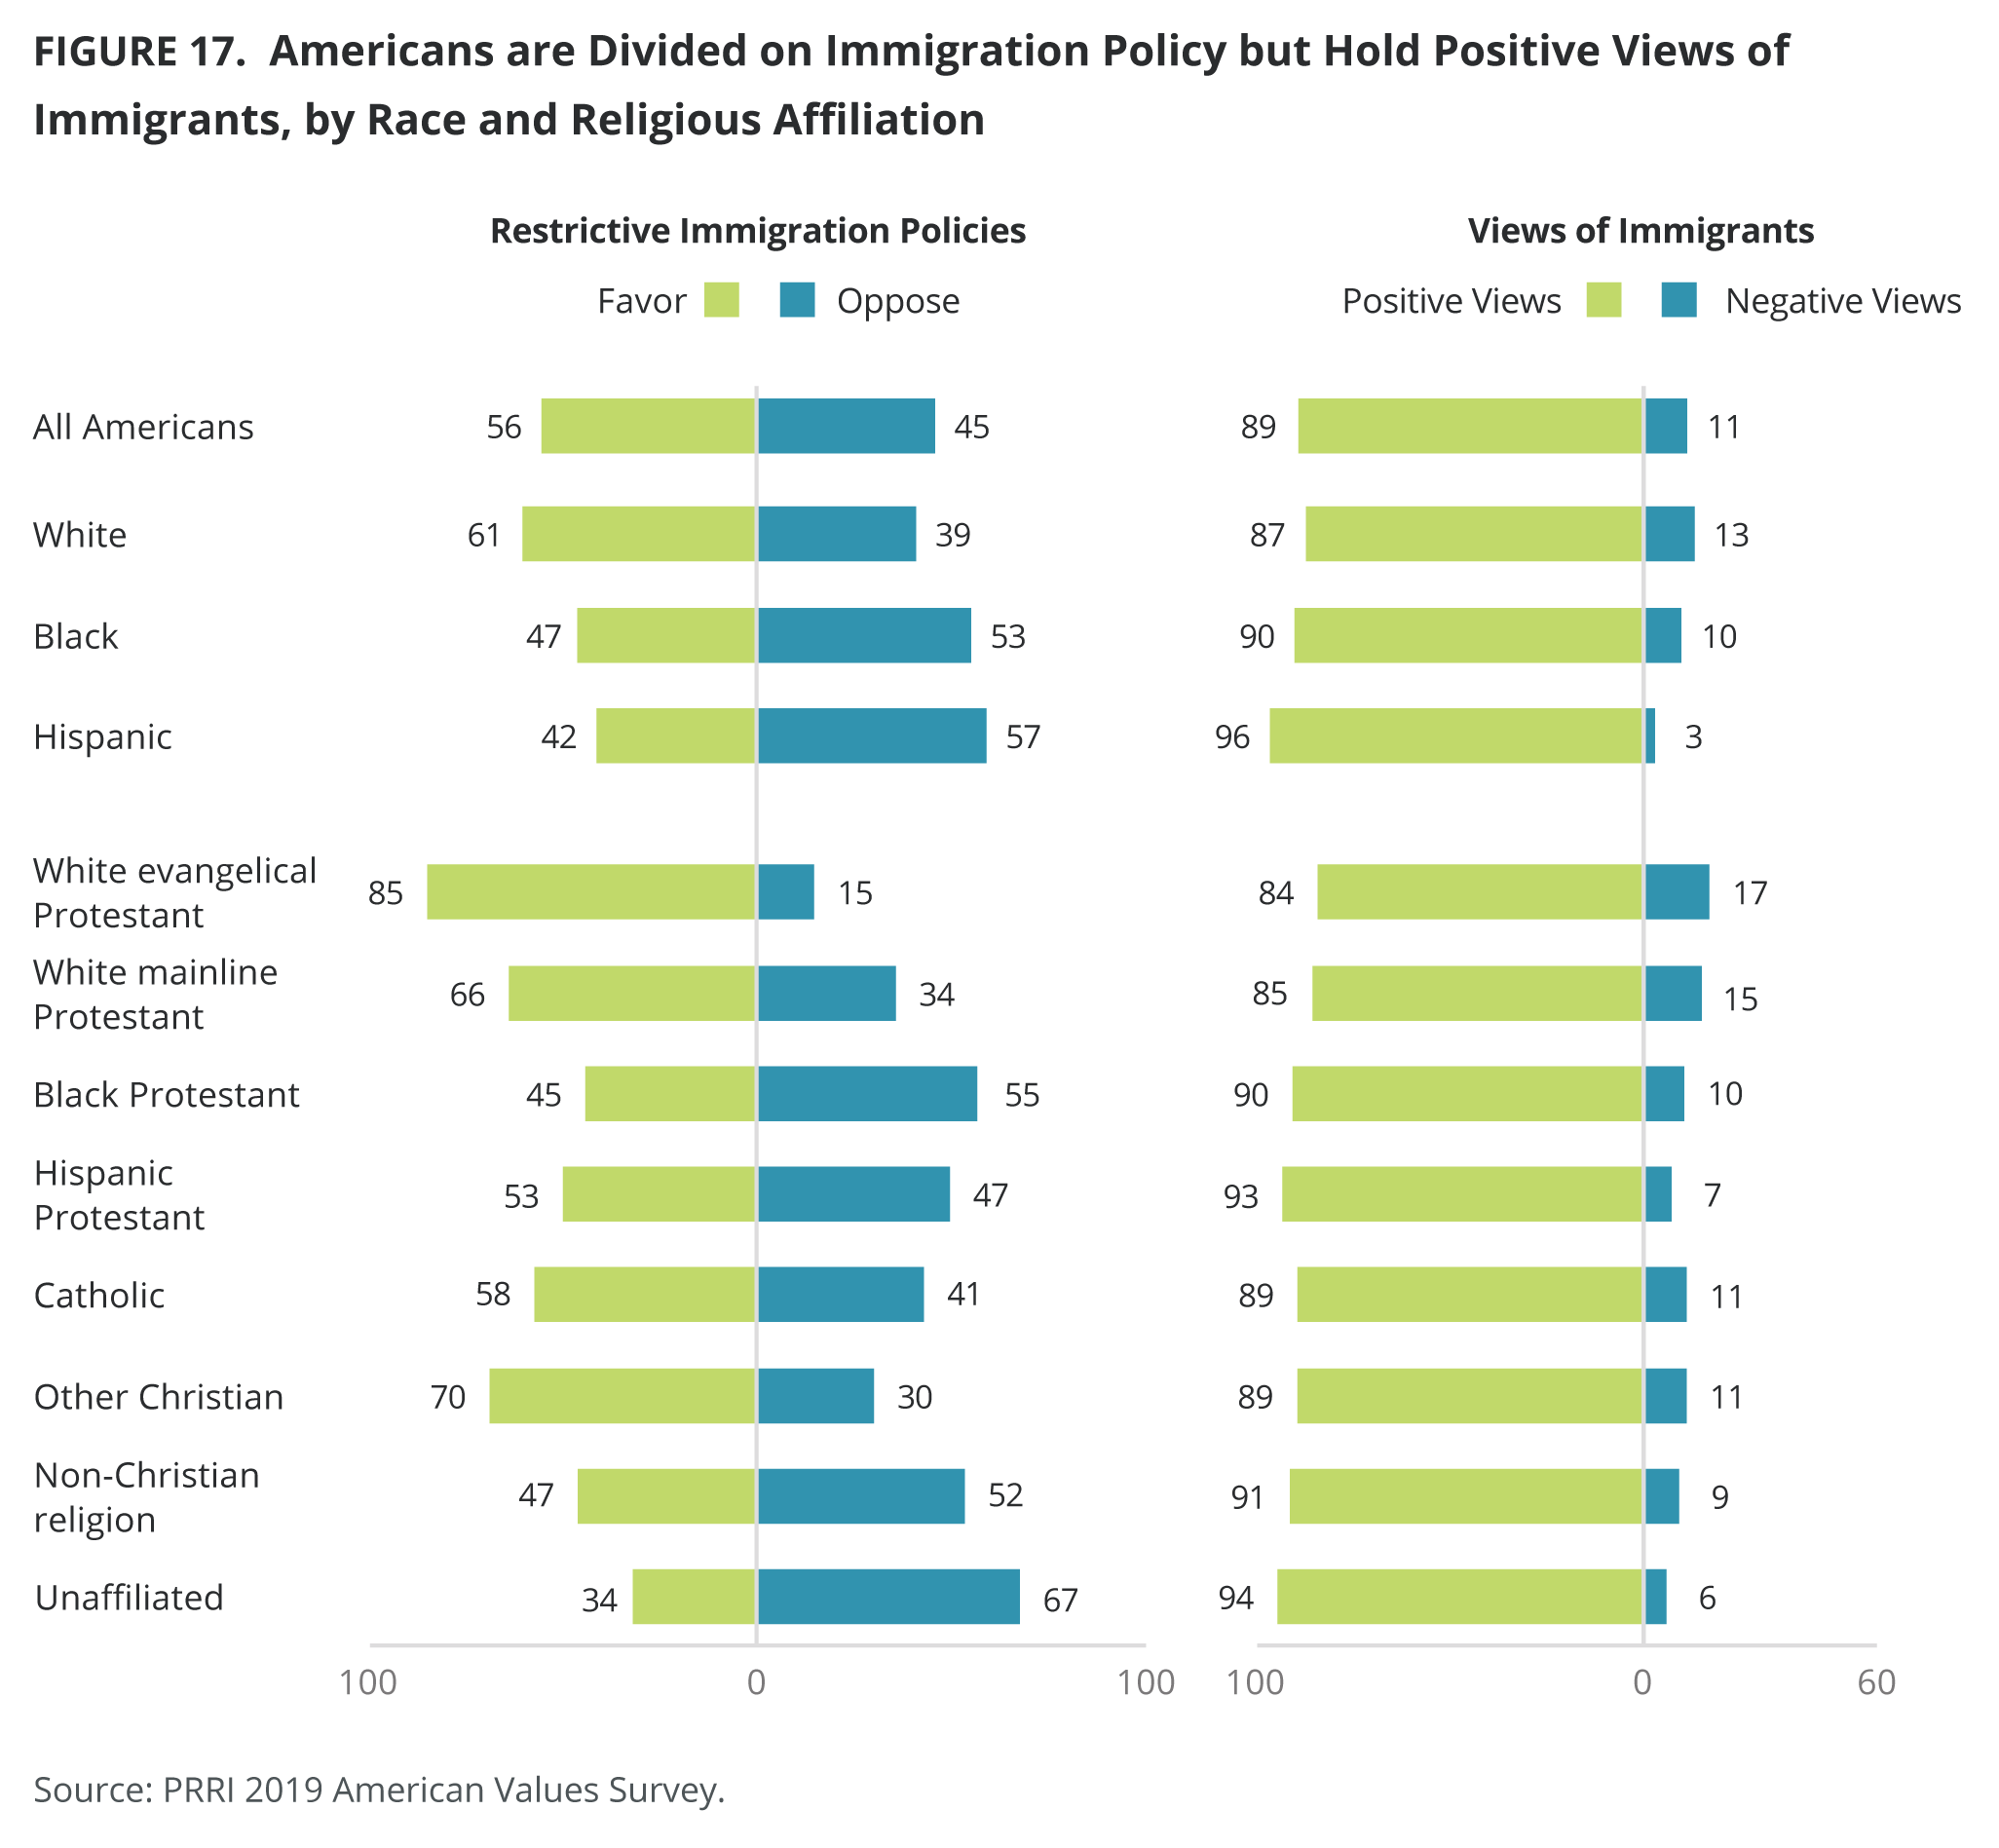
Each question was combined using an additive scale that was then recalibrated on a four-point scale where a score of one indicates strongly favor, two indicates favor, three indicates oppose, and four indicates strongly oppose. Using this scale, a majority (56%) of Americans generally favor or strongly favor these restrictive immigration policies, while nearly half (45%) oppose or strongly oppose these restrictive immigration policies. Moreover, Americans are twice as likely to strongly favor (23%) these policies as to strongly oppose them (11%).
Nearly nine in ten Republicans (89%) strongly favor or favor restrictive immigration policies, and only 11% oppose or strongly oppose them. The opposite is true among Democrats: More than three in ten (32%) favor these restrictive immigration policies, while the vast majority (68%) oppose them. Independents closely resemble Americans in general (55% favor vs. 45% oppose).
As with most of those who will support Trump as a candidate in the 2020 election (95%), most Fox News Republicans (96%) and white evangelical Republicans (93%) also strongly favor or favor restrictive immigration policies. Republicans who do not rely on Fox News as their primary news source (84%) and Republicans who are not white evangelical Protestants (86%) are slightly less extreme in their views.
A majority (61%) of white Americans, compared to roughly four in ten black (47%) and Hispanic (42%) Americans, favor more restrictive immigration policies. White college graduates (47%) are significantly less likely than white Americans with some college (65%) or whites with High School or less education (73%) to favor restrictive immigration policies.
Among religious groups, white evangelical Protestants (85%) are more likely than white mainline Protestants (66%) to be in favor of placing restrictions on immigration, and both groups are remarkably more supportive of restrictive policies than are Hispanic Protestants (53%) and black Protestants (45%). Those who identify as other Christians (70%) are more likely to be in favor of placing limits on immigration than non-Christians (47%). Among Catholics, most white Catholics (68%) favor these policies, compared to one in four Hispanic Catholics (39%). Religiously unaffiliated (34%) Americans are the religious group least likely to favor limits on immigration.
Young Americans (ages 18-29) and Americans over 50 years old have notably different opinions on immigration restrictions. While majorities of Americans ages 50-64 (63%) and seniors 65 and older (62%) favor policies imposing limits on immigration, only about four in ten young Americans (43%) hold the same views.
Views of Immigrants
Unlike Americans’ conflicted views on immigration policies, Americans tend to be more favorable toward immigrants overall. When asked about what Americans think of immigrants coming to the U.S. today, the vast majority indicate immigrants are hardworking (85%), have strong family values (81%), mostly keep to themselves (72%), and make an effort to learn English (56%). These opinions are largely unchanged since 2018.
Since these questions correlate very strongly, a four-point composite index was developed to measure where each respondent stands from very favorable to very unfavorable in their overall attitudes toward immigrants. On the index, most (89%) Americans perceive immigrants favorably, while only one in ten (11%) view immigrants negatively. These favorable views are remarkably consistent across partisanship, ideology, religious affiliation, gender, age, education, race, and even among those who indicated they will support Donald Trump in the 2020 election.
It is worth noting, however, that Americans are more conflicted when they think specifically about immigrants’ willingness to learn English. Republicans (33%) are less likely than Democrats (71%) and independents (60%) to think that immigrants make an effort to learn English.
There are also differences by religious affiliation on this question. Majorities of Hispanic Protestants (76%), religiously unaffiliated Americans (71%), black Protestants (63%), and those who identify with non-Christian religions (60%) describe immigrants as making an effort to learn English. Around half of white mainline Protestants (49%) and Catholics (51%) think the same, and fewer than four in ten (37%) white evangelical Protestants say immigrants make this effort.
Family Separation
Notably, one immigration policy where there are different opinion patterns is on the policy of separating children from their families at the border. Fewer than one in four (23%) Americans favor an immigration border policy that separates children from their parents and charges parents as criminals when they enter the country without permission, compared to 75% who oppose such a policy. More than four in ten Republicans support family separation (44%), compared to 24% of Independents and only 7% of Democrats. Notably, a majority (54%) of Republicans oppose this family separation policy.
White evangelical protestants emerge again as the religious group most likely to support the separation of children from their families at the border. Nearly four in ten (39%) white evangelicals support this policy, compared to 57% who oppose this policy. By contrast, only 28% of white mainline Protestants, 22% of Hispanic Protestants and 18% of black Protestants. About one in four of those who identify with other Christians (27%), Catholics (24%), and 21% of non-Christians also support this policy. Religiously unaffiliated Americans (12%) are the least likely group to favor support for immigrant family separations at the border.
Undocumented Immigrants’ Use of Government Benefits
Most Americans oppose (68%) allowing immigrants who are in the country illegally to be eligible for government-provided health care benefits, including 91% opposition among Republicans, 76% among independents, and 53% among Democrats.
Young Americans ages 18-29 (50%) are less likely than older groups—including those ages 30-49 (69%), 50-64 (74%), and 65 and over (78%)—to oppose allowing undocumented immigrants access to government health care benefits. Hispanic Americans (45%) and black Americans (54%) are less likely than whites (78%) to oppose government health care benefits for undocumented immigrants.
By contrast, Americans are more evenly divided on whether potential benefit use should disqualify undocumented immigrants from applying for citizenship. Only 46% of Americans favor prohibiting immigrants living in the country illegally from applying for citizenship if they are judged to be likely to use government benefits like health care, food, and housing programs, compared to a slim majority (52%) who oppose such a policy.
Nearly two in three (66%) Republicans—compared to less than half (46%) of independents and only 28% of Democrats—favor a policy that would prohibit applications for citizenship from undocumented immigrants deemed likely to need government benefits.
About four in ten young Americans (37%) express support for prohibiting undocumented immigrants from applying for citizenship if they are likely to use government benefits, compared to nearly half (46%) of older Americans ages 65 and older. By race, black Americans (33%) are less likely than Hispanics (40%) and whites (48%) to support this policy.
Dreamers
Most Americans (63%) favor allowing immigrants brought illegally to the U.S. as children, better known as Dreamers, to gain legal resident status, while 36% are opposed. Support for this policy has remained stable since 2018. Republicans (42%) are notably less likely than independents (67%) and Democrats (74%) to favor this policy. Hispanic Americans (73%) are more likely than white (61%) and black (61%) Americans to favor this policy.
Sanctuary Cities
Americans are slightly more likely to oppose (51%) than to favor (46%) allowing cities to limit their cooperation with the federal government’s efforts to enforce immigration laws. Democrats (60%) are more likely to support this policy, while Republicans (25%) are less likely to do so. Independents resemble Americans’ views on this topic.
Hispanic Americans (56%) are more likely than white Americans (44%) and black Americans (42%) to favor this policy. Young Americans (56%) are also more supportive than older Americans of this policy.
There are notable differences by religion. Hispanic Protestants (62%) are the most likely to favor allowing cities to limit their cooperation with the federal government’s efforts to enforce immigration laws, followed by religiously unaffiliated Americans (58%), and those who identify with non-Christian religions (57%). At the other end of the spectrum, white evangelical Protestants (27%) are the least likely to support this policy, followed by black Protestants (37%), white mainline Protestants (41%), and Catholics (46%).
Immigrants’ Impact on Local Communities
Americans are evenly divided on whether immigrants are burdening local communities by using more than their share of social services (49%) or not (49%). Republicans (75%) are more than twice as likely as Democrats (32%) to describe immigrants as a burden to local communities, with independents (46%) in between.
Only about four in ten (38%) Americans think immigrants increase crime in their local communities, while 60% disagree. A majority of Republicans (60%) say immigrants increase crime in their local communities, while fewer than one in four (38%) independents and one in five (22%) Democrats agree.
Compared to other religious groups, white evangelical Protestants emerge as most likely to believe that immigrants have a negative impact on their local communities. Seven in ten (71%) say they create a burden by using social services, and six in ten (62%) think immigrants increase crime.
Climate Change
The vast majority of Americans (80%) believe there is solid evidence that the average temperature on earth has been getting warmer over the past few decades, while only one in five Americans (19%) believe there is no solid evidence for climate change. Most Americans (59%) believe that climate change is happening and caused mostly by human activity such as burning fossil fuels, compared to one in five Americans (20%) who believe climate change is mostly caused by natural patterns in the earth’s environment.
In addition, most Americans (59%) believe that climate change will cause them a great deal or a moderate amount of harm, compared to four in ten Americans (41%) who think climate change will cause them little or no harm.
Republicans are equally divided among those who believe climate change is caused by humans (30%), those who believe climate change is caused by natural patterns (32%), and those who believe that climate change is not happening (35%). Moreover, two in three (66%) Republicans believe that climate change will cause little or no harm to them personally.
The opposite is true among Democrats. While nearly eight in ten Democrats (79%) believe that climate change is taking place and is human caused, 14% believe climate change is happening but not human caused. Only a very small proportion of Democrats (5%) believe climate change is not taking place.
Six in ten (61%) independents believe climate change is human caused, and another 19% believe it is happening, but not caused by humans. Not surprisingly, majorities of Democrats (74%) and independents (60%) are notably more likely than Republicans (34%) to think that climate change will cause them harm.
White Americans (22%) are more likely than Hispanic (14%) and black Americans (12%) to think climate change is not happening. More Hispanic Americans (74%) and black Americans (70%) than whites (51%) think climate change will harm them personally.
White evangelical Protestants stand out in their skepticism about climate change. Only one-third (33%) believe that climate change is caused mostly by human activity, compared to 28% who believe it is happening but not caused by human activity, and 37% who do not believe it is happening. Majorities in every other major religious group believe climate change is happening and caused by humans. The strongest belief in human-caused climate change is among religiously unaffiliated Americans (81%). Only one in ten religiously unaffiliated Americans think climate change is not human caused (10%) or that it is not happening (8%).
Young Americans are more likely than older Americans to believe that there is solid evidence for climate change (86%) and that this change is caused by human activity (73%). Only 13% of young Americans think that climate change is not happening. Not surprisingly, this is the group that is most likely (72%) to say that climate change will harm them personally, compared to fewer than six in ten (58%) Americans 30-49 years old, 55% of those 50 to 64 years old, and half (50%) of seniors.
Prohibiting the Use of Disposable Plastic Straws
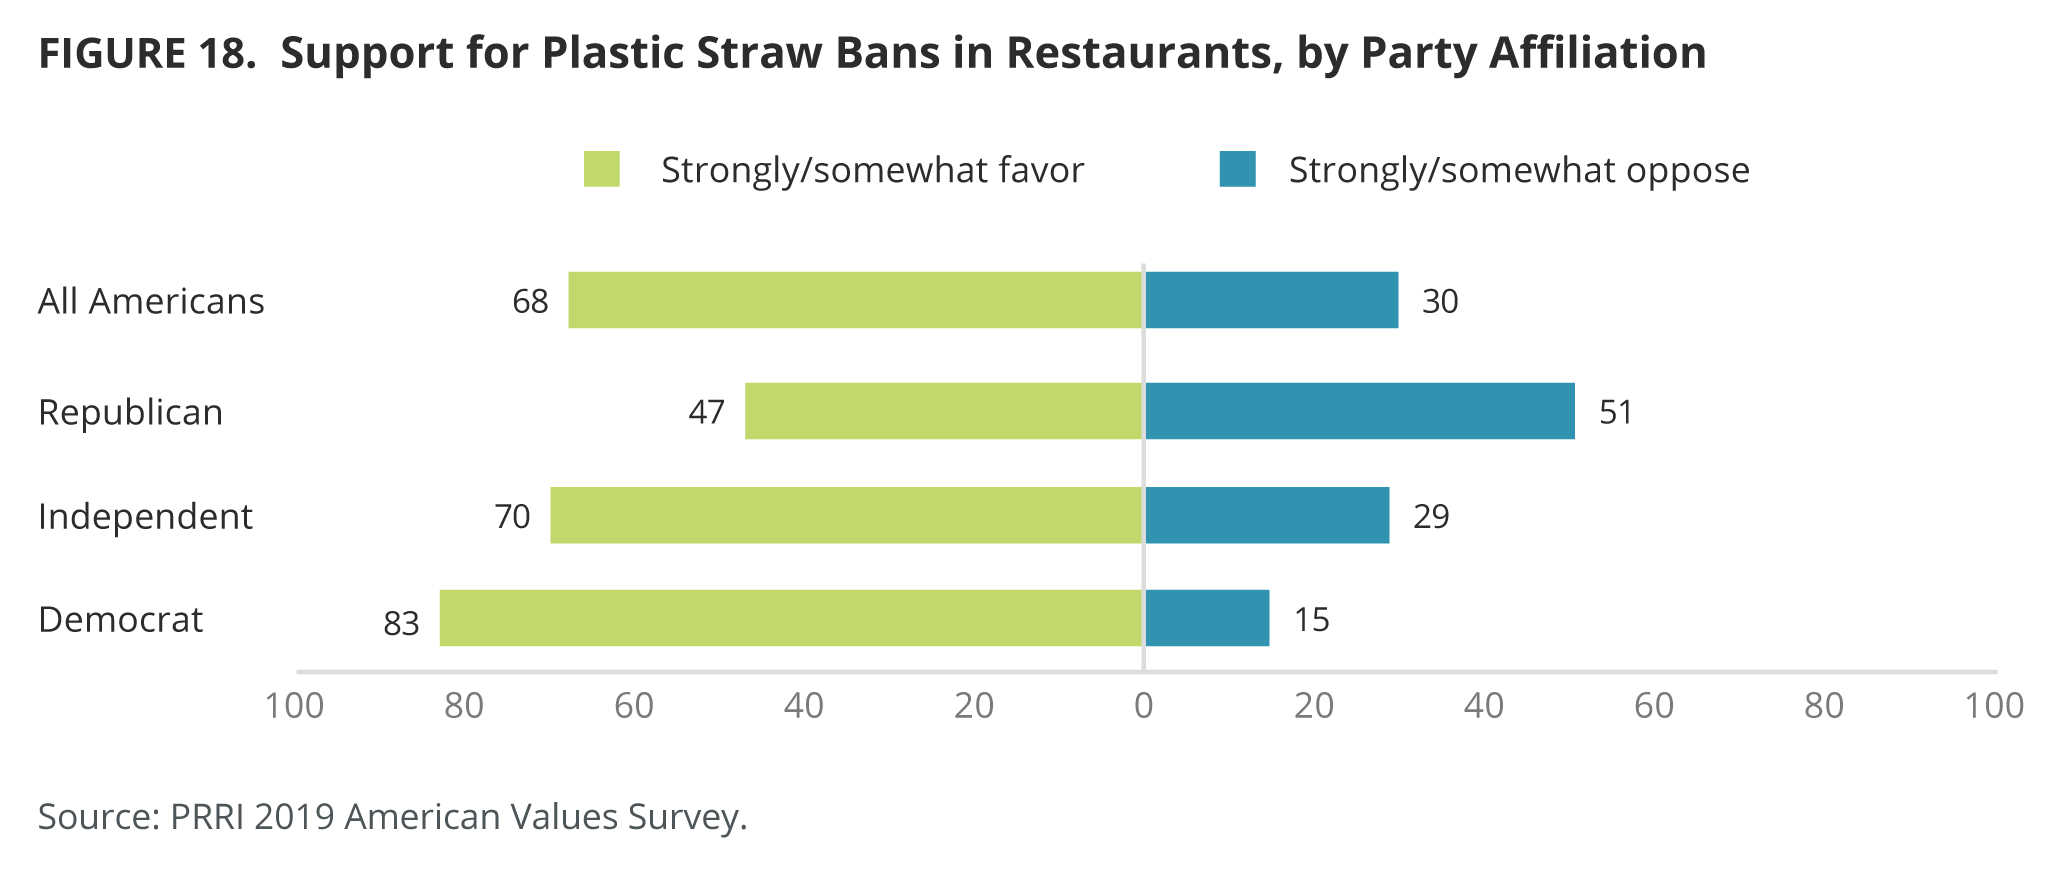
Most Americans (68%) favor or strongly favor prohibiting the use of disposable plastic straws in restaurants to protect aquatic animals and the ocean from pollution, while only one-third (30%) are opposed.
Republicans are roughly evenly divided on the issue, with 47% supporting plastic straw bans and 51% opposing such measures. Strong majorities of independents (70%) and Democrats (83%) support plastic straw bans. Among religious groups, white evangelical Protestants (46%) are the only religious group with less than majority support for the measure.
Republicans and Republican-leaning independents who prefer Trump to be the presidential nominee in 2020 are evenly split on this question (47% support vs. 52% oppose), while Americans who prefer someone else to be the presidential nominee are notably more likely to favor prohibiting the use of disposable plastic straws in restaurants (64%) than oppose it (34%). White evangelical Protestants (46% favor vs. 52% oppose) are also roughly evenly divided on this question.
Young Americans (76%) are more likely than other age groups, including those 30-49 (62%) and 50-64 (68%) to be supportive of this policy, although support ticks up again among seniors (71%). Hispanic Americans (78%) are notably more in favor of prohibiting the use of disposable plastic straws in restaurants than black (68%) and white (66%) Americans.
Tariffs on Imported Goods
A majority (57%) of Americans believe that recent U.S.-imposed tariffs on imported goods have hurt the economy. One in five (21%) say the tariffs have benefited the economy, and another 19% say there has been no impact. The percentage of Americans who say tariffs have hurt the economy has increased thirteen percentage points since 2018 (44%).
Democrats (76%) are more likely than independents (57%) and Republicans (31%) to say that tariffs on imported goods have hurt the economy. In contrast, four in ten (40%) Republicans think tariffs have benefited the economy, compared to 20% of Independents and only 9% of Democrats. Moreover, among Americans who support Trump but indicated that President Trump could do something to lose their approval, 37% say that tariffs on imported goods have hurt the economy, another 34% say they benefited the economy, and one-fourth (25%) think that tariffs on imported goods had no impact.
White evangelical Protestants (38%) are the least likely religious group to say U.S. tariffs on imported goods hurt the economy, compared to majorities of white mainline Protestants (54%), Catholics (59%), those who identify with non-Christians religions (61%), and black Protestants (63%). Religiously unaffiliated Americans are the least likely to believe that tariffs have benefited the economy (10%), and the vast majority (71%) say tariffs hurt the economy.
Most Hispanics (61%), blacks (60%), and whites (55%) think that tariffs hurt the economy. Among whites, college graduates (68%) are notably more likely to believe that tariffs on imported goods hurt the economy, compared to whites with some college (52%) or white with a high school degree or less education (46%).
Cutting Taxes for Corporations
A majority (69%) of Americans oppose or strongly oppose cutting taxes for corporations, compared to one-third (29%) who favor or strongly favor it. Again, there is a clear divide among partisans. Republicans (46%) are more likely than independents (26%) and Democrats (20%) to favor cutting taxes for corporations. Nearly eight in ten Democrats (78%) and seven in ten Independents (71%) oppose this policy, compared to 53% of Republicans.
Among religious groups, white evangelical Protestants (40%) emerge as the most supportive of cutting taxes for corporations, compared to 27% of white mainline Protestants and 24% of those who identify with a non-Christian religion. Religiously unaffiliated Americans, in contrast, are the least likely to favor cutting taxes for corporations (19%).
Most whites (70%), blacks (68%), and Hispanics (67%) strongly oppose or oppose cutting taxes for corporations. This is also true among whites across education levels. Most white college graduates (72%) oppose cutting taxes for corporations as do whites with some college (70%) and with a high school degree or less education (69%)
Methodology
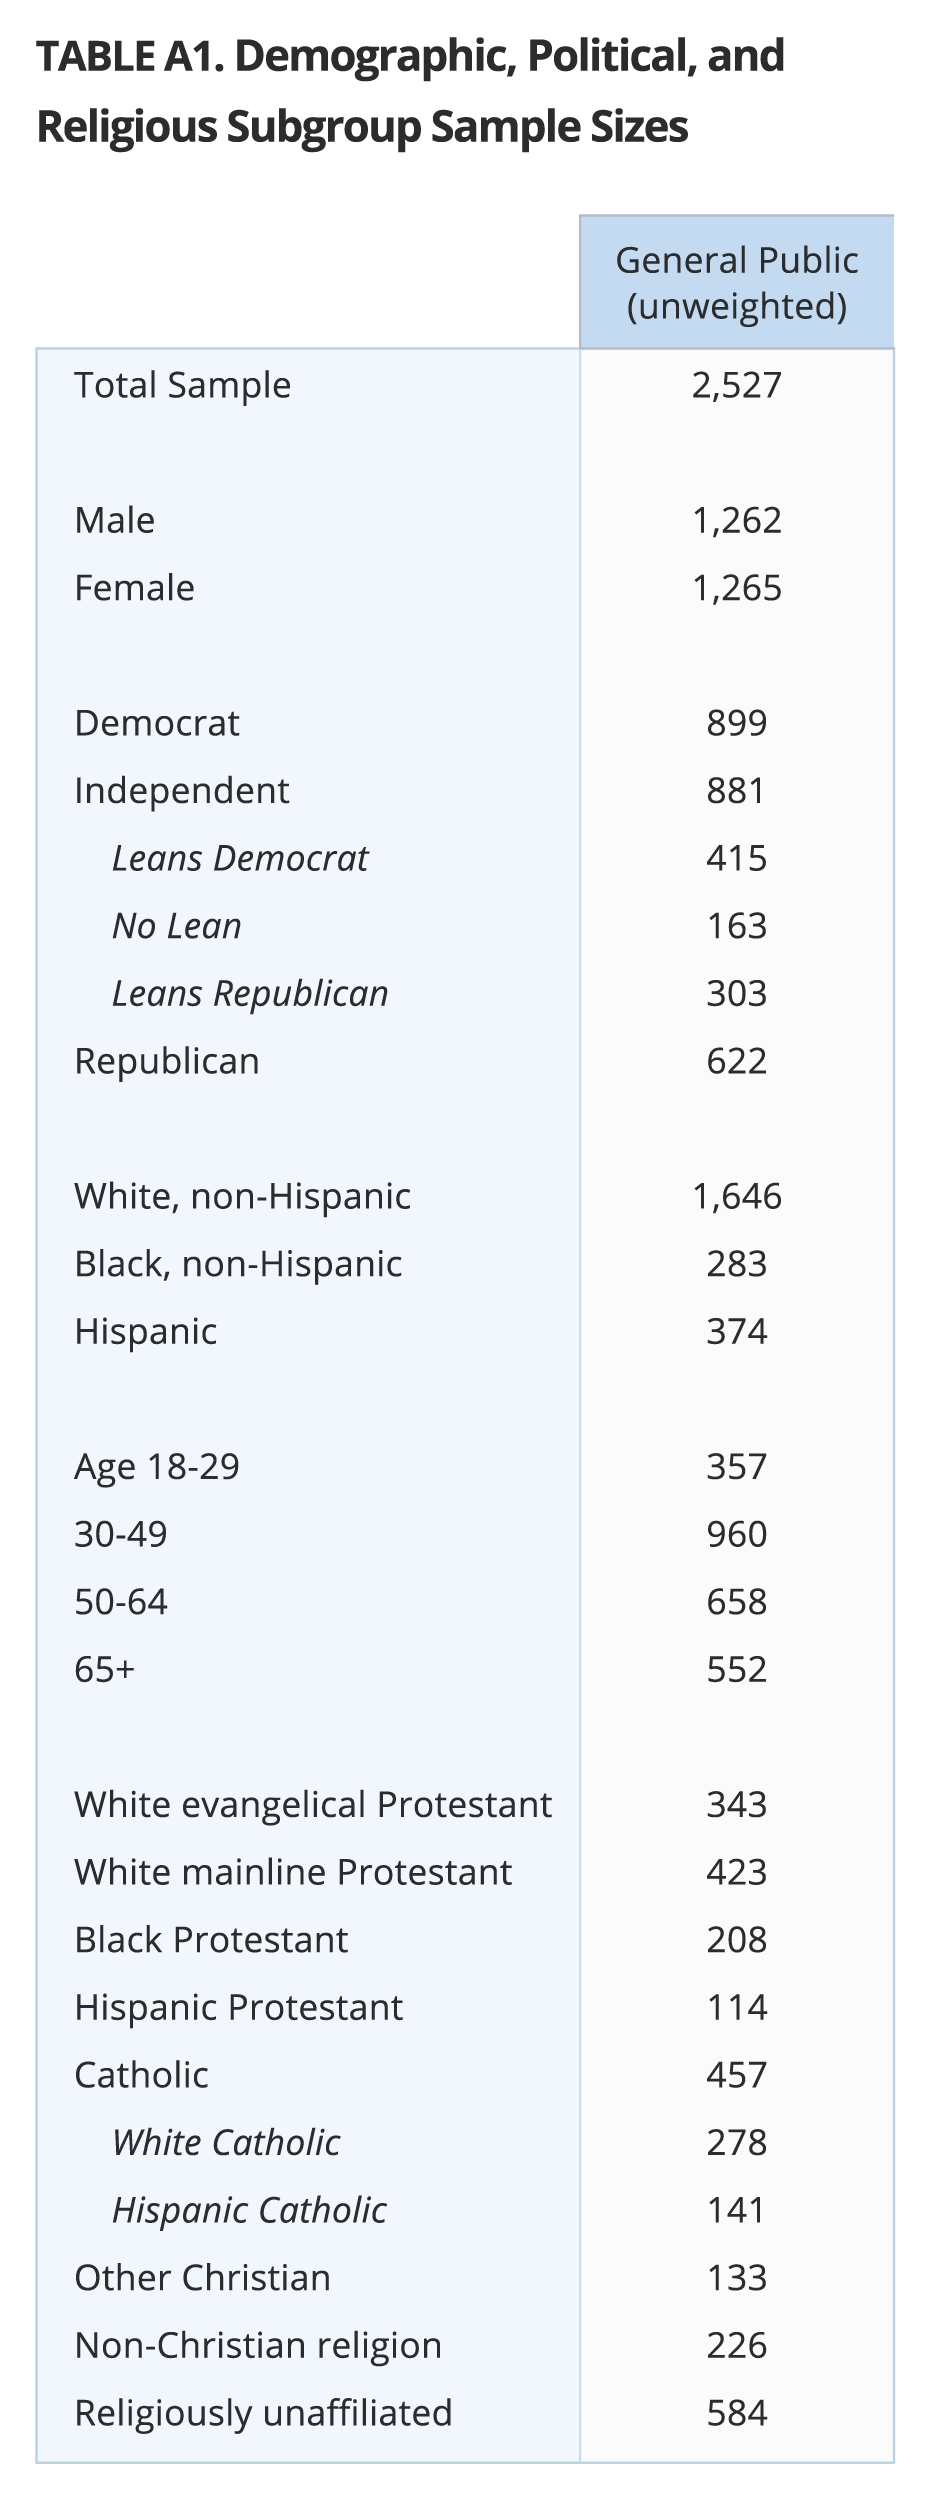 The survey was designed and conducted by PRRI. The survey was made possible by generous grants from The Carnegie Corporation of New York, Unitarian Universalist Veatch Program at Shelter Rock, and The New World Foundation. Interviews were conducted among a random sample of 2,527 adults (age 18 and up) living in the United States including all 50 states and the District of Columbia. Interviews were conducted both online using a self-administered design and by telephone using live interviewers. All interviews were conducted among participants in AmeriSpeak, a probability-based panel designed to be representative of the national U.S. adult population run by NORC at the University of Chicago. Panel participants without Internet access, which included 213 respondents, were interviewed via telephone by professional interviewers under the direction of NORC. Interviewing was conducted in both Spanish and English between August 22 and September 15, 2019.
NORC’s AmeriSpeak Panel provides a representative panel of civilian, non-institutional adults (age 18 and over) living in the United States. The sample frame was developed using a two-stage probability sample design to create a representative sample of households in the United States. The first stage uses National Frame Areas (NFAs), geographic areas that have a population of at least 10,000 people. The National Sample Frame contains almost 3 million households and includes 80,000 rural households. Additionally, NORC oversampled housing units in segments (Census tracts or block groups) that include hard-to-reach populations, including young adults, Hispanics and African Americans. Panel recruitment proceeded in two stages. First, a mail solicitation is sent to a randomly selected household along with follow-up telephone calls and email solicitations if necessary. In the second stage, households that have not responded to the initial inquiry or follow-ups receive an enhanced incentive offer and a personal visit from NORC field interviewers. Members typically participate in panel surveys two or three times a month. For more information about AmeriSpeak, please visit: http://amerispeak.norc.org
The weighting is accomplished in two separate stages. First, panel base weights are calculated for every household based on the probability of selection from the NORC National Frame, the sampling frame that is used to sample housing units for AmeriSpeak. Household level weights are then assigned to each eligible adult in every recruited household. In the second stage, sample demographics are balanced to match target population parameters for gender, age, education, race and Hispanic ethnicity, and division (U.S. Census definitions), housing type, and telephone usage. The telephone usage parameter came from an analysis of the National Health Interview Survey. All other weighting parameters are derived from an analysis of the U.S. Census Bureau’s Current Population Survey.
The sample weighting is accomplished using an iterative proportional fitting (IFP) process that simultaneously balances the distributions of all variables. Weights were trimmed to prevent individual interviews from having too much influence on the final results. The use of these weights in statistical analysis ensures that the demographic characteristics of the sample closely approximate the demographic characteristics of the target populations.
The margin of error for the survey is +/- 2.8 percentage points at the 95% level of confidence. The design effect for the survey is 1.83. In addition to sampling error, surveys may also be subject to error or bias due to question wording, context and order effects.
Endnotes
[1] PRRI 2016 American Values Survey.
[2] PRRI 2015 American Values Survey.
[3] Respondents were not asked to rate the issues of health care or climate change in 2016.
[4] Very likely to vote is identified as respondents who say they are currently registered to vote and say they are certain to vote in the 2020 election; 69% of respondents fall into this category.
[5] The survey did not ask favorability for Michael Bennett, John Delaney, Wayne Messam, Tim Ryan, or Joe Sestak. It did include Kirsten Gillibrand and Bill de Blasio, who have since dropped out of the race.
[6] PRRI 2016 American Values Survey.
[7] PRRI 2017 American Values Survey.
[8] PRRI 2018 American Values Survey.
[9] This survey was conducted before the announcement of an impeachment inquiry.
[10] Republicans Mark Sanford and Joe Walsh declared they would seek the Republican nomination while this survey was fielding, so they were not listed as answer options.
[11] This survey was conducted before the announcement of an impeachment inquiry
[12] PRRI February 2017 Survey.
[13] These terms were not defined in the survey, so respondents brought their own self-understandings to the terms. The results should be interpreted with this in mind. Given the high proportion of respondents who said “humanist” describes them somewhat or very well, for example, it is likely that most viewed the word as an expression of affinity for humans’ wellbeing overall, rather than the more narrow definition of one who adheres to the philosophy of humanism.
Recommended citation:
“Fractured Nation: Widening Partisan Polarization and Key Issues in 2020 Presidential Elections” PRRI (October 21, 2019). prri.org/research/fractured-nation-widening-partisan-polarization-and-key-issues-in-2020-presidential-elections.


