

Executive Summary
Trump’s favorability continues to decline since 2024, driven by independents and less committed Republicans.
- More than a year into the second Trump administration, Trump’s favorability rating has declined from 41% before the 2024 election to 34%, while 62% of Americans now view him unfavorably.
- While 79% of Republicans continue to hold favorable views of Trump, compared with 25% of independents and 5% of Democrats, favorability has declined among Republicans and independents since September 2024 (from 84% and 37%, respectively).
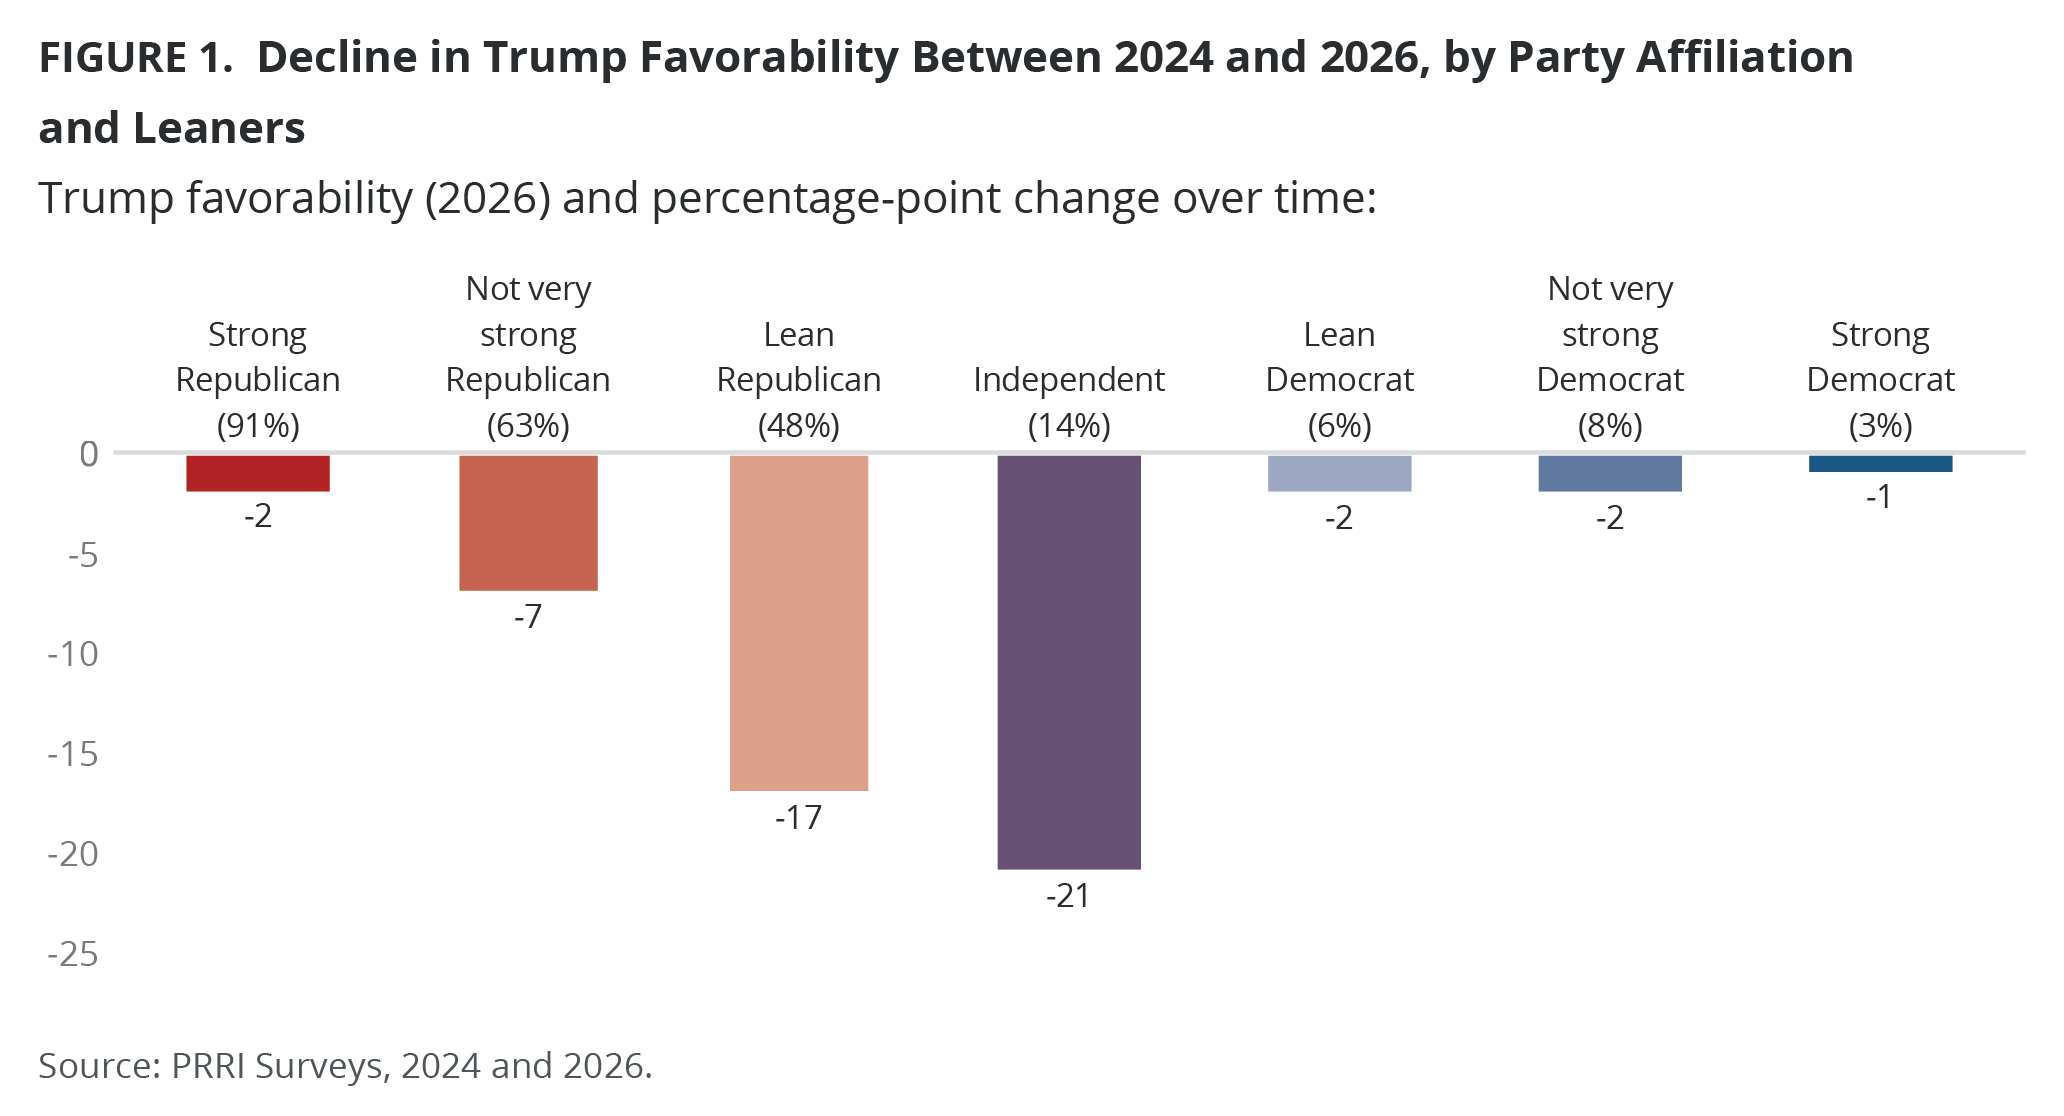
- Favorability remains high and stable among strong Republicans (91%), but has declined among less committed Republicans, falling from 70% to 63% among “not very strong Republicans” and from 65% to 48% among “Republican leaners.”
Pope Leo XIV is viewed more favorably than Trump by most Americans, except for Republicans and conservative white Christians.
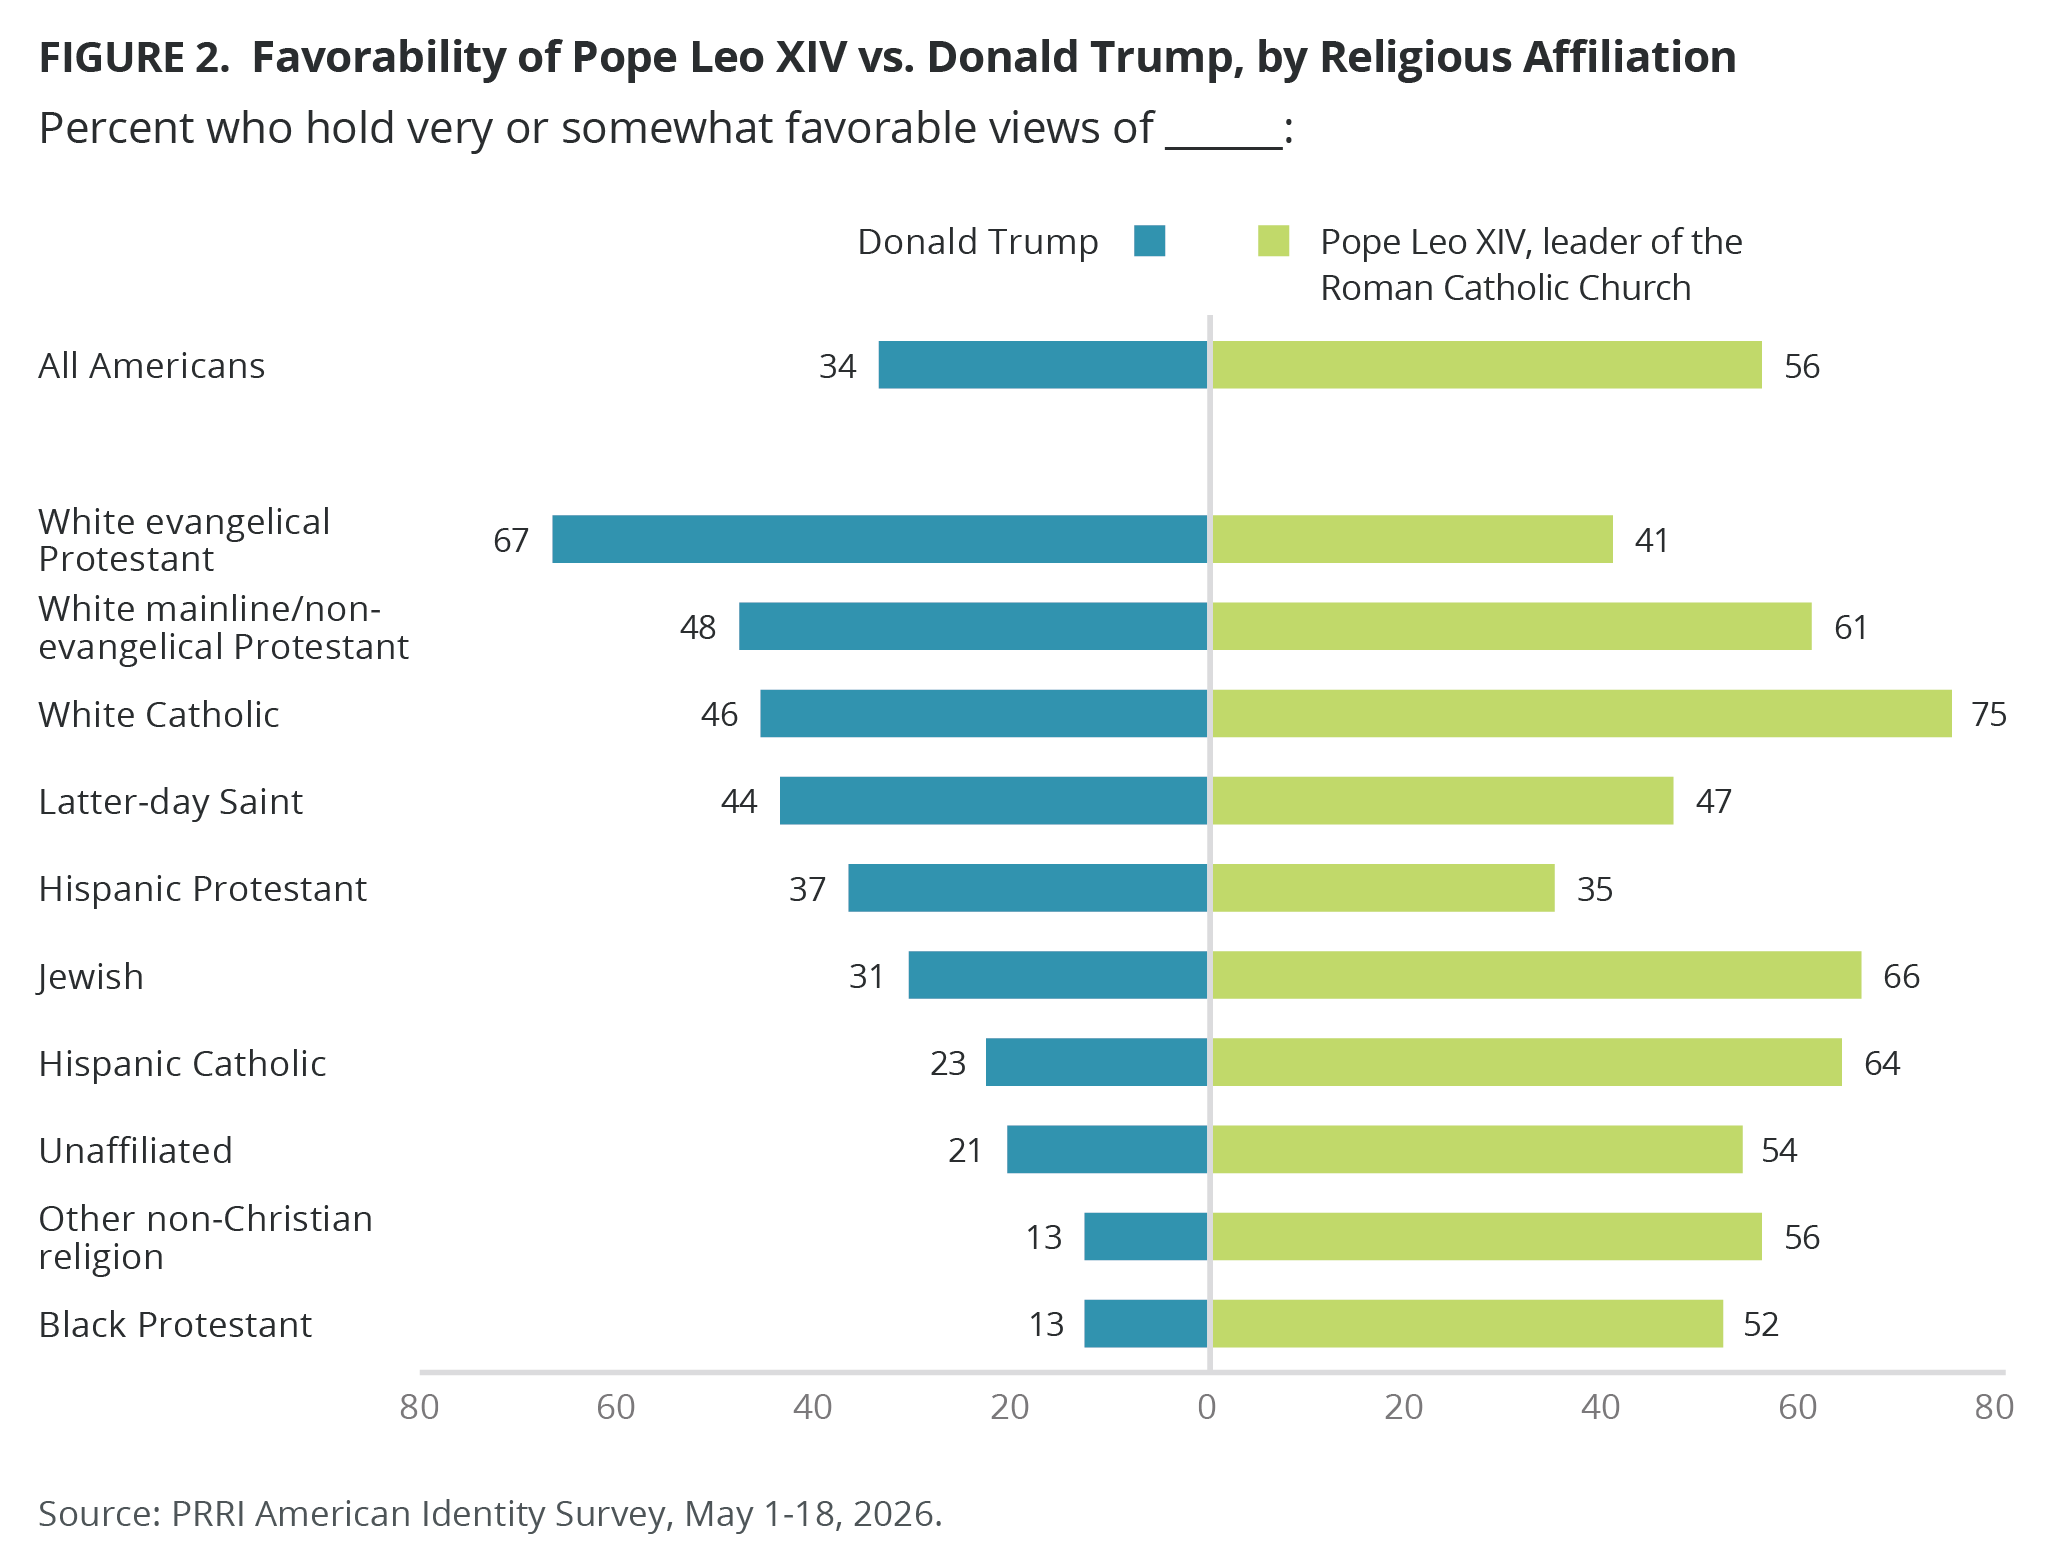
- Americans hold more favorable views of Pope Leo XIV than of President Trump (56% vs. 34%). Democrats (73% vs. 5%) and independents (55% vs. 25%) are more likely to view Pope Leo XIV favorably than Trump, while more Republicans view Trump favorably than the new Pope (79% vs. 47%).
- White evangelical Protestants and Christian nationalism Adherents and Sympathizers are more likely to view Trump favorably than Pope Leo XIV, while members of all other religious groups, as well as Christian nationalism Skeptics and Rejecters, hold more favorable views of the new Pope than of Trump.
Americans largely hold unfavorable views on how Trump is handling the war in Iran and immigration.
- Two-thirds of Americans hold unfavorable views of Trump’s handling of the War in Iran (66%), compared with 29% of Americans who hold favorable views. Republicans are the most supportive (67%), compared with 21% of independents and just 4% of Democrats.
- White evangelical Protestants (59%) and Christian nationalism Adherents (60%) are the only groups where majorities hold favorable views of Trump’s handling of the war in Iran.
- More than one-third of Americans (37%) rate President Donald Trump’s handling of immigration favorably, compared with 58% who rate his actions unfavorably.
More Americans increasingly view Trump as a “dangerous dictator” rather than a “strong leader.”
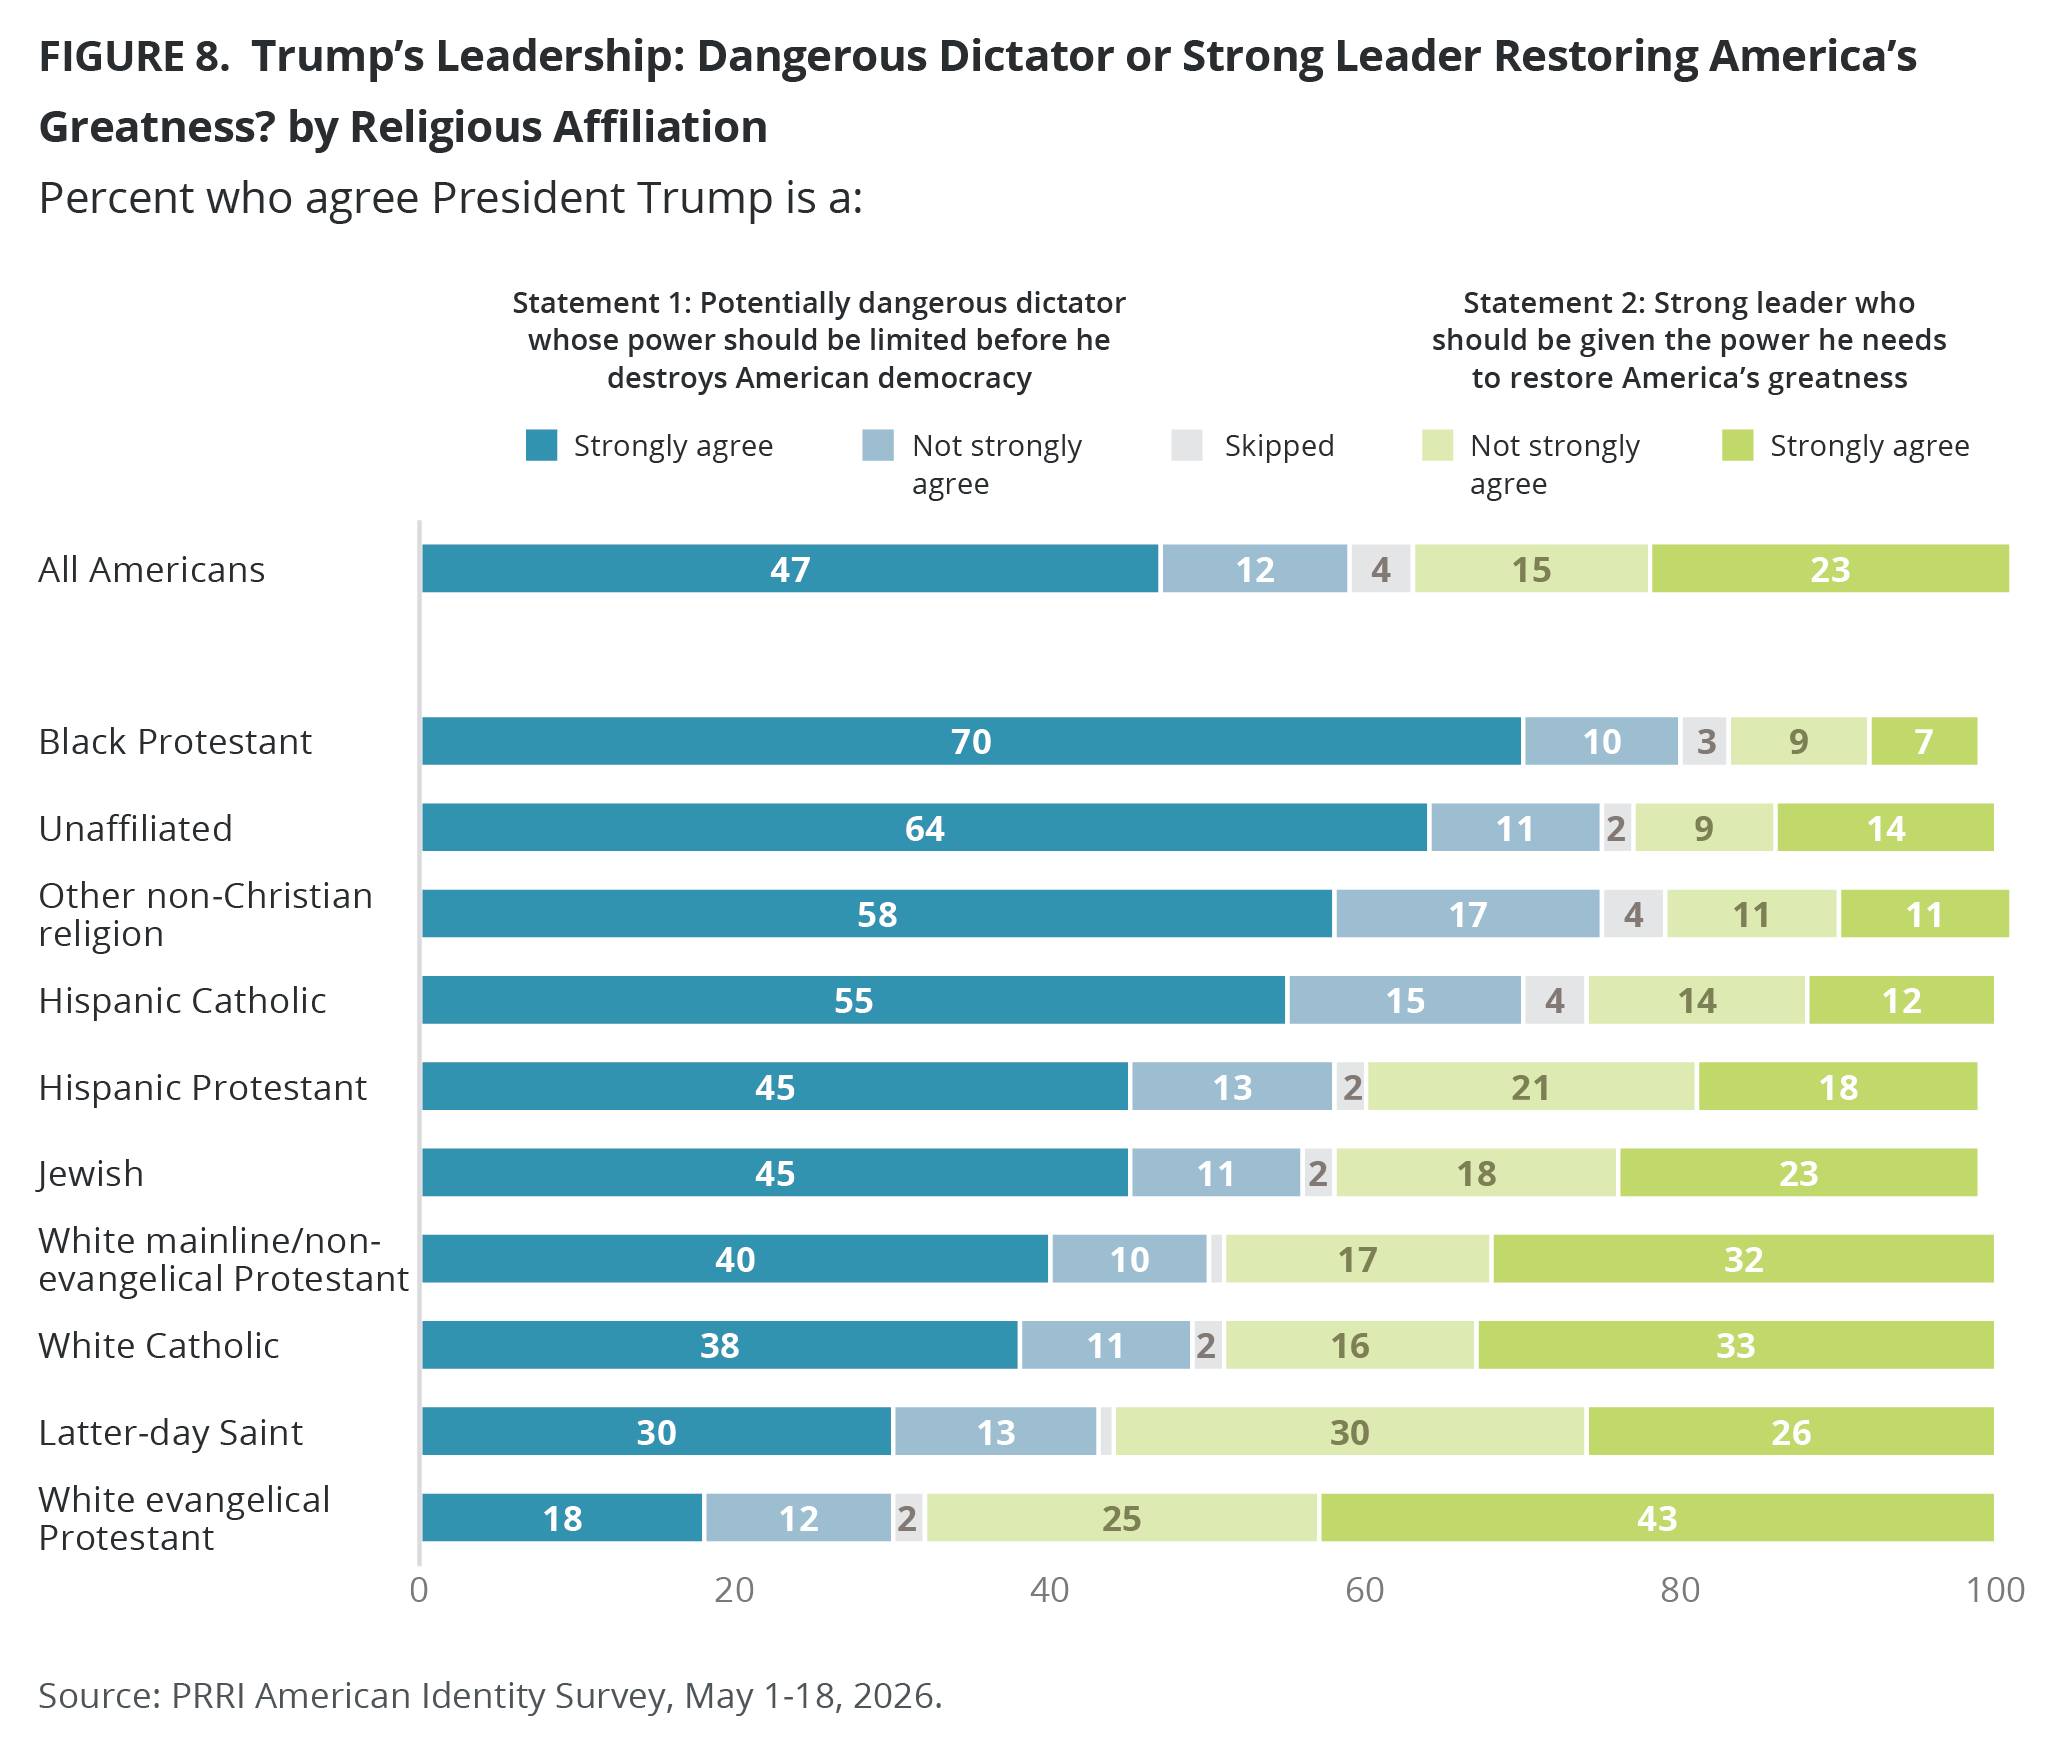
- A majority of Americans agree “President Trump is a dangerous dictator whose power should be limited before he destroys American democracy” (59%), up from 52% in March 2025, compared with 38% who agree “President Trump is a strong leader who should be given the power he needs to restore America’s greatness.”
- Most Democrats (91%, up from 87% in March 2025) and independents (65%, up from 56% in March 2025) agree with the first statement, while most Republicans agree with the second statement (78%, down from 81% in March 2025).
National pride and the belief that God has granted America a special role in human history are strongest among Republicans, but pride in America’s economy and democracy is low.
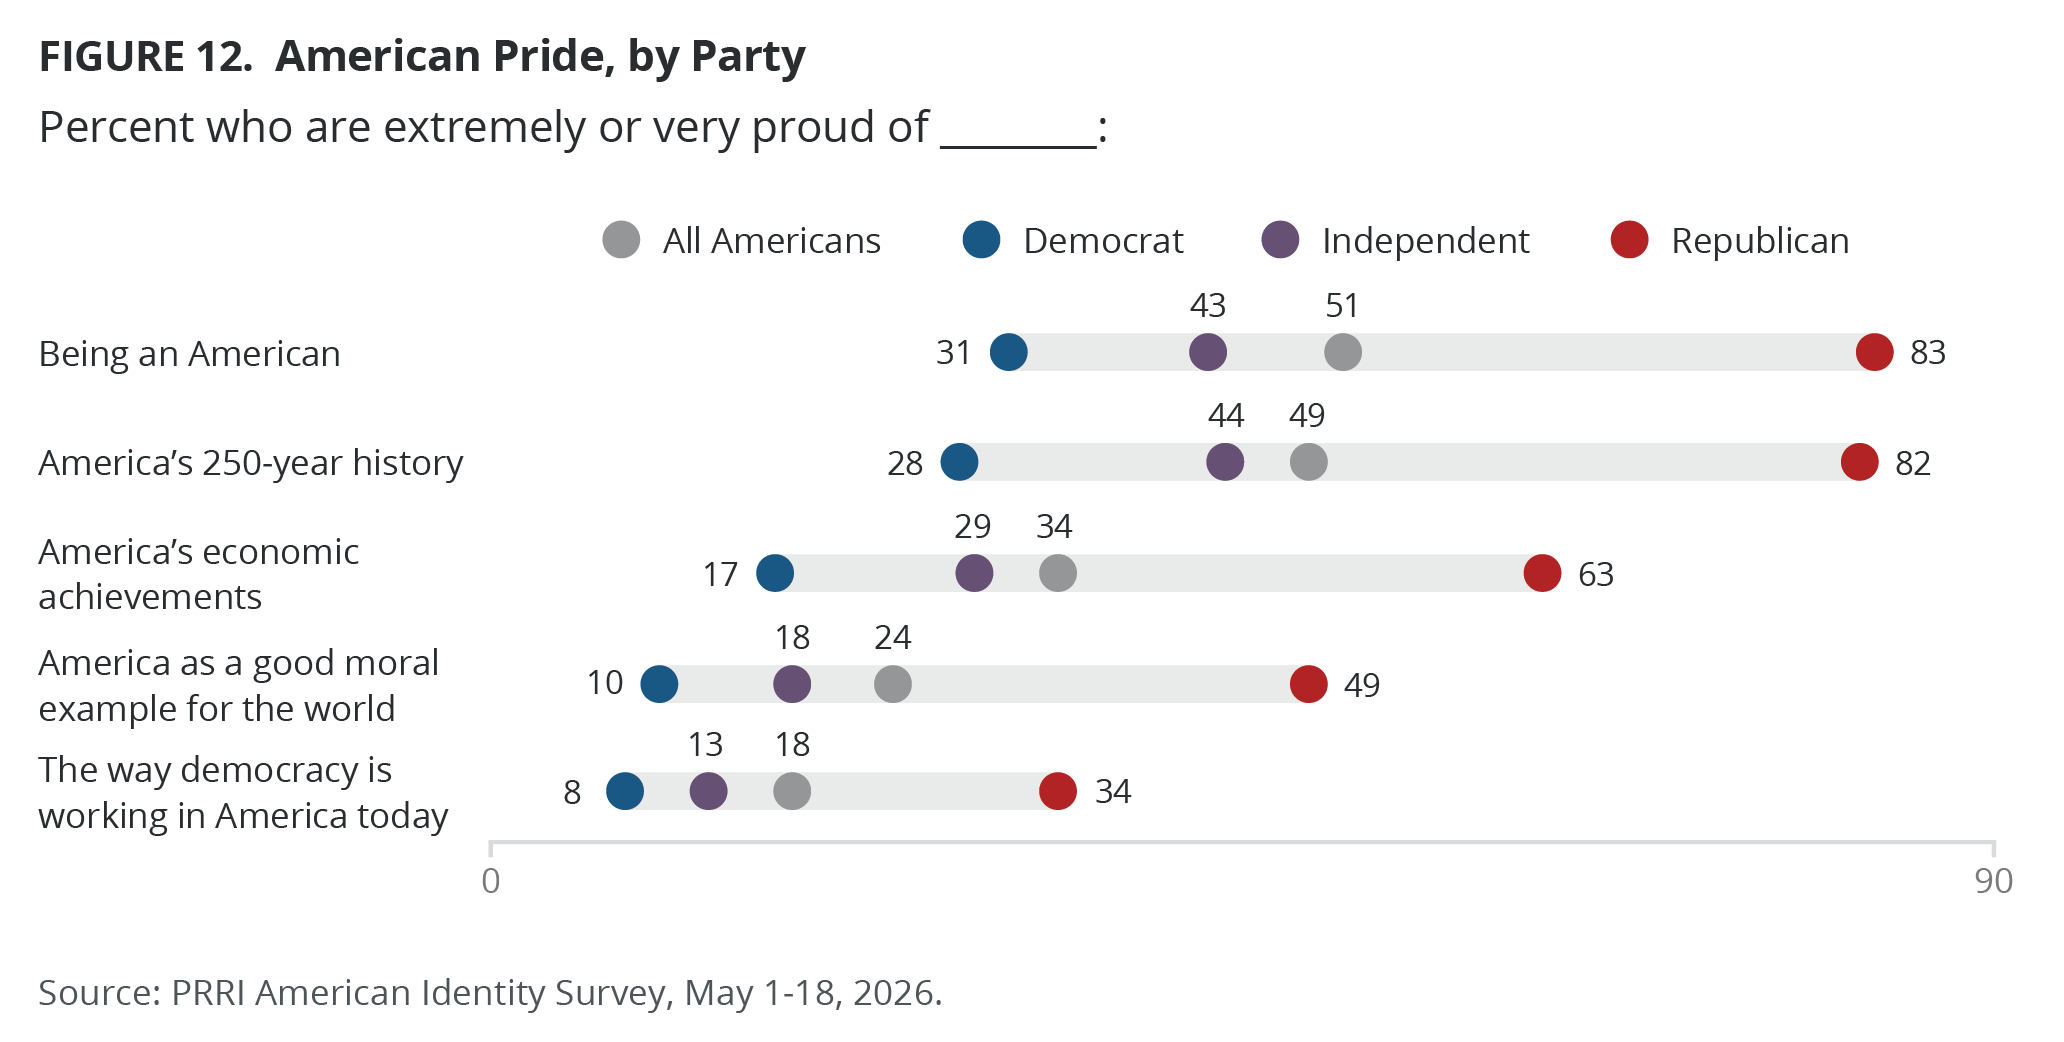
- Just half of Americans are extremely or very proud of being an American (51%) or of America’s 250-year history (49%): Most Republicans (83% and 82%, respectively) are extremely or very proud, compared with over four in ten independents (43% and 44%), and three in ten Democrats (31% and 28%).
- Fewer Americans are extremely or very proud of America’s economic achievements (34%), America’s good moral example for the world (24%), and the way democracy is working in America today (18%).
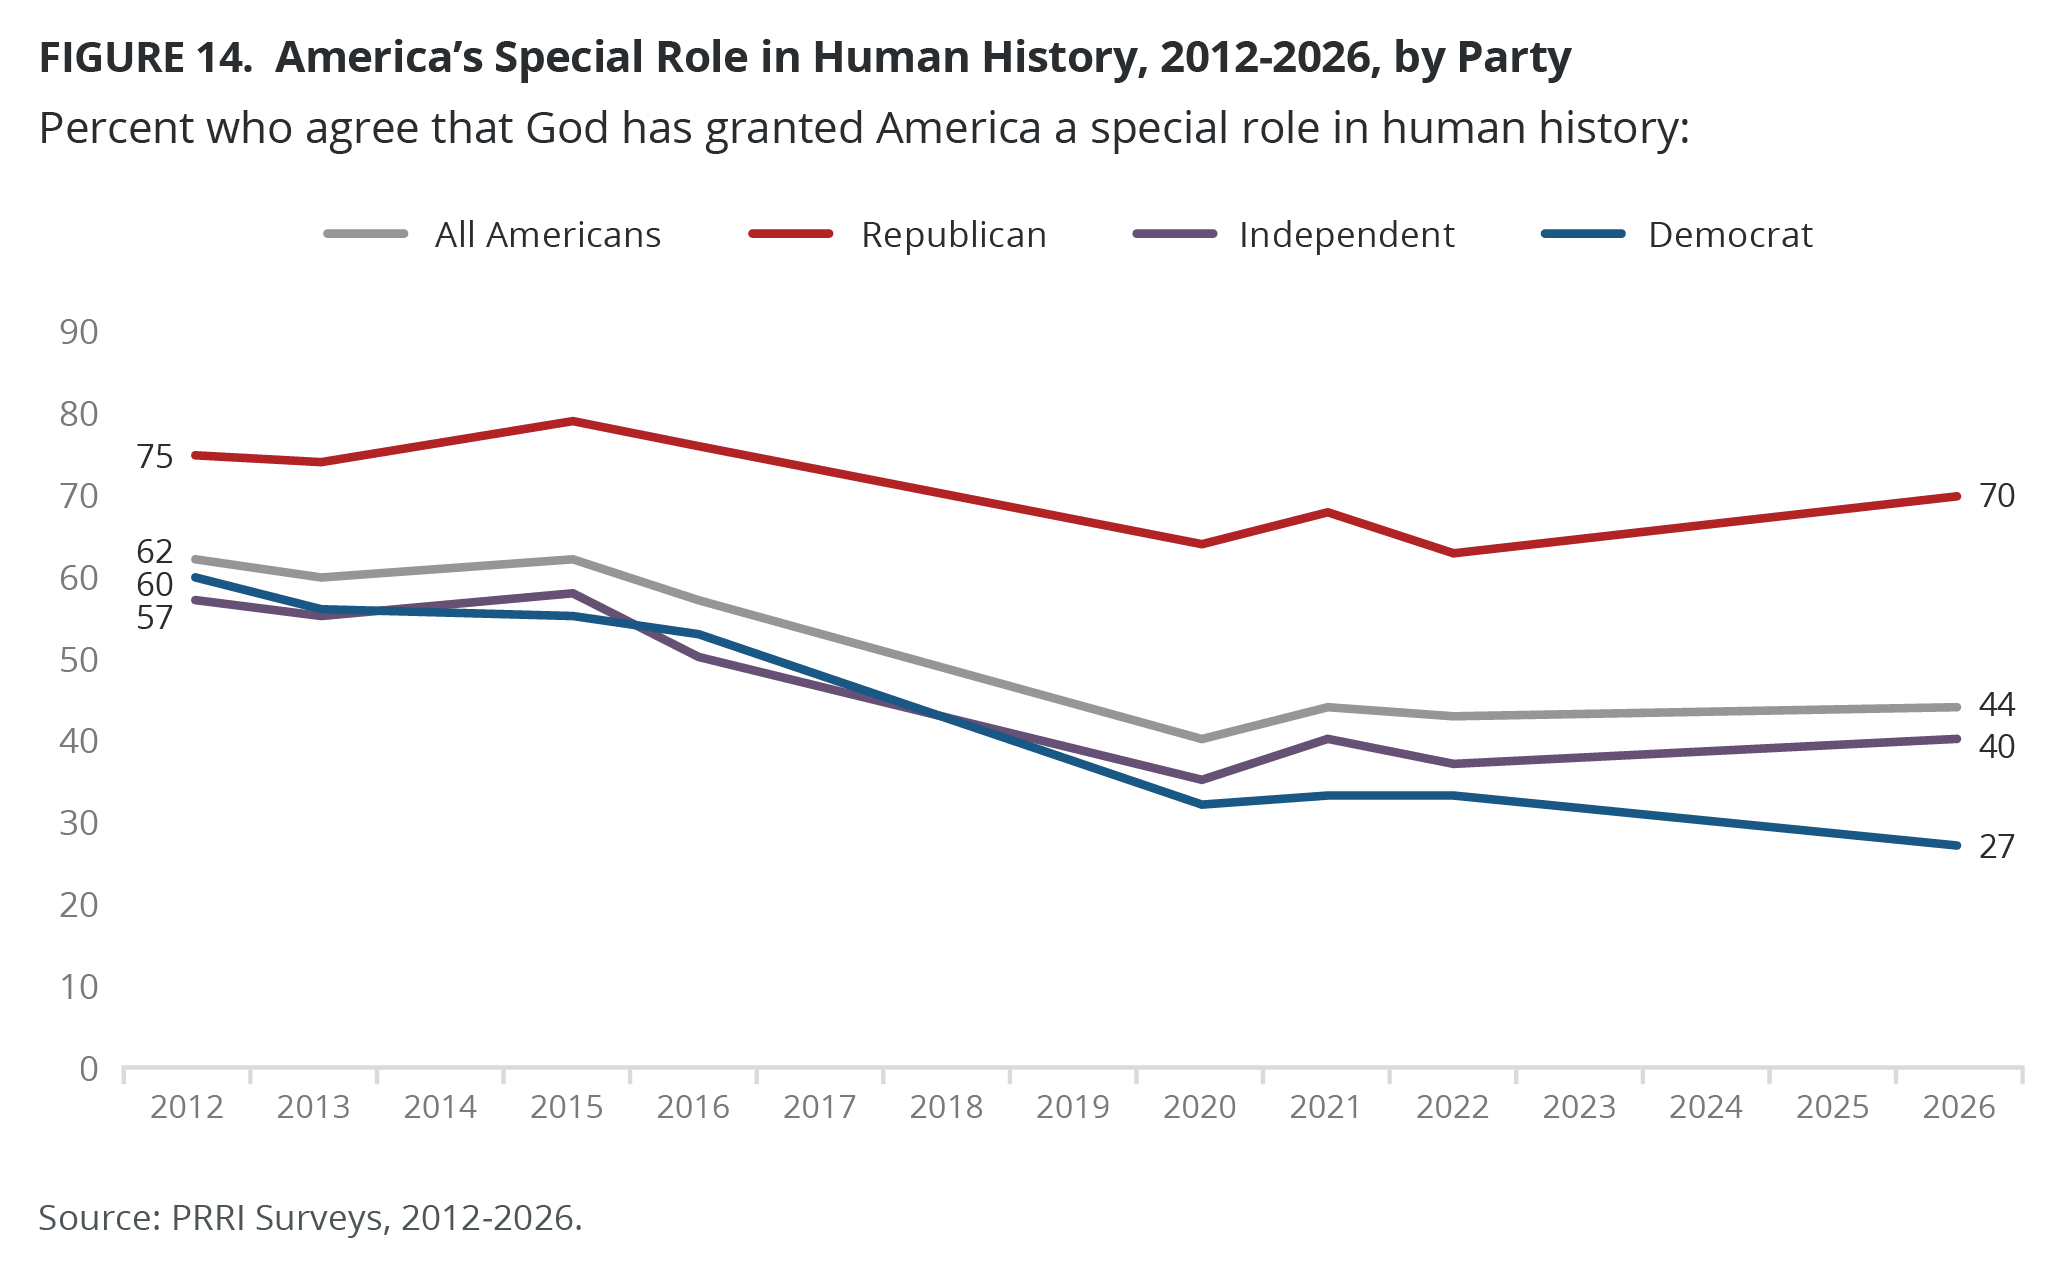
- Just 44% of Americans agree with the idea that God has granted America a special role in human history, compared with a slim majority who disagree (52%).
- In 2012, majorities of nearly all religious groups agreed that God has granted America a special role in human history. Today, only four religious subgroups hold this view: Latter-day Saints, white evangelical Protestants, Hispanic Protestants, and Black Protestants.
Belief in the American Dream remains strongest among Republicans, but has declined over time, particularly among Hispanic and AAPI Americans, women, and young Americans.
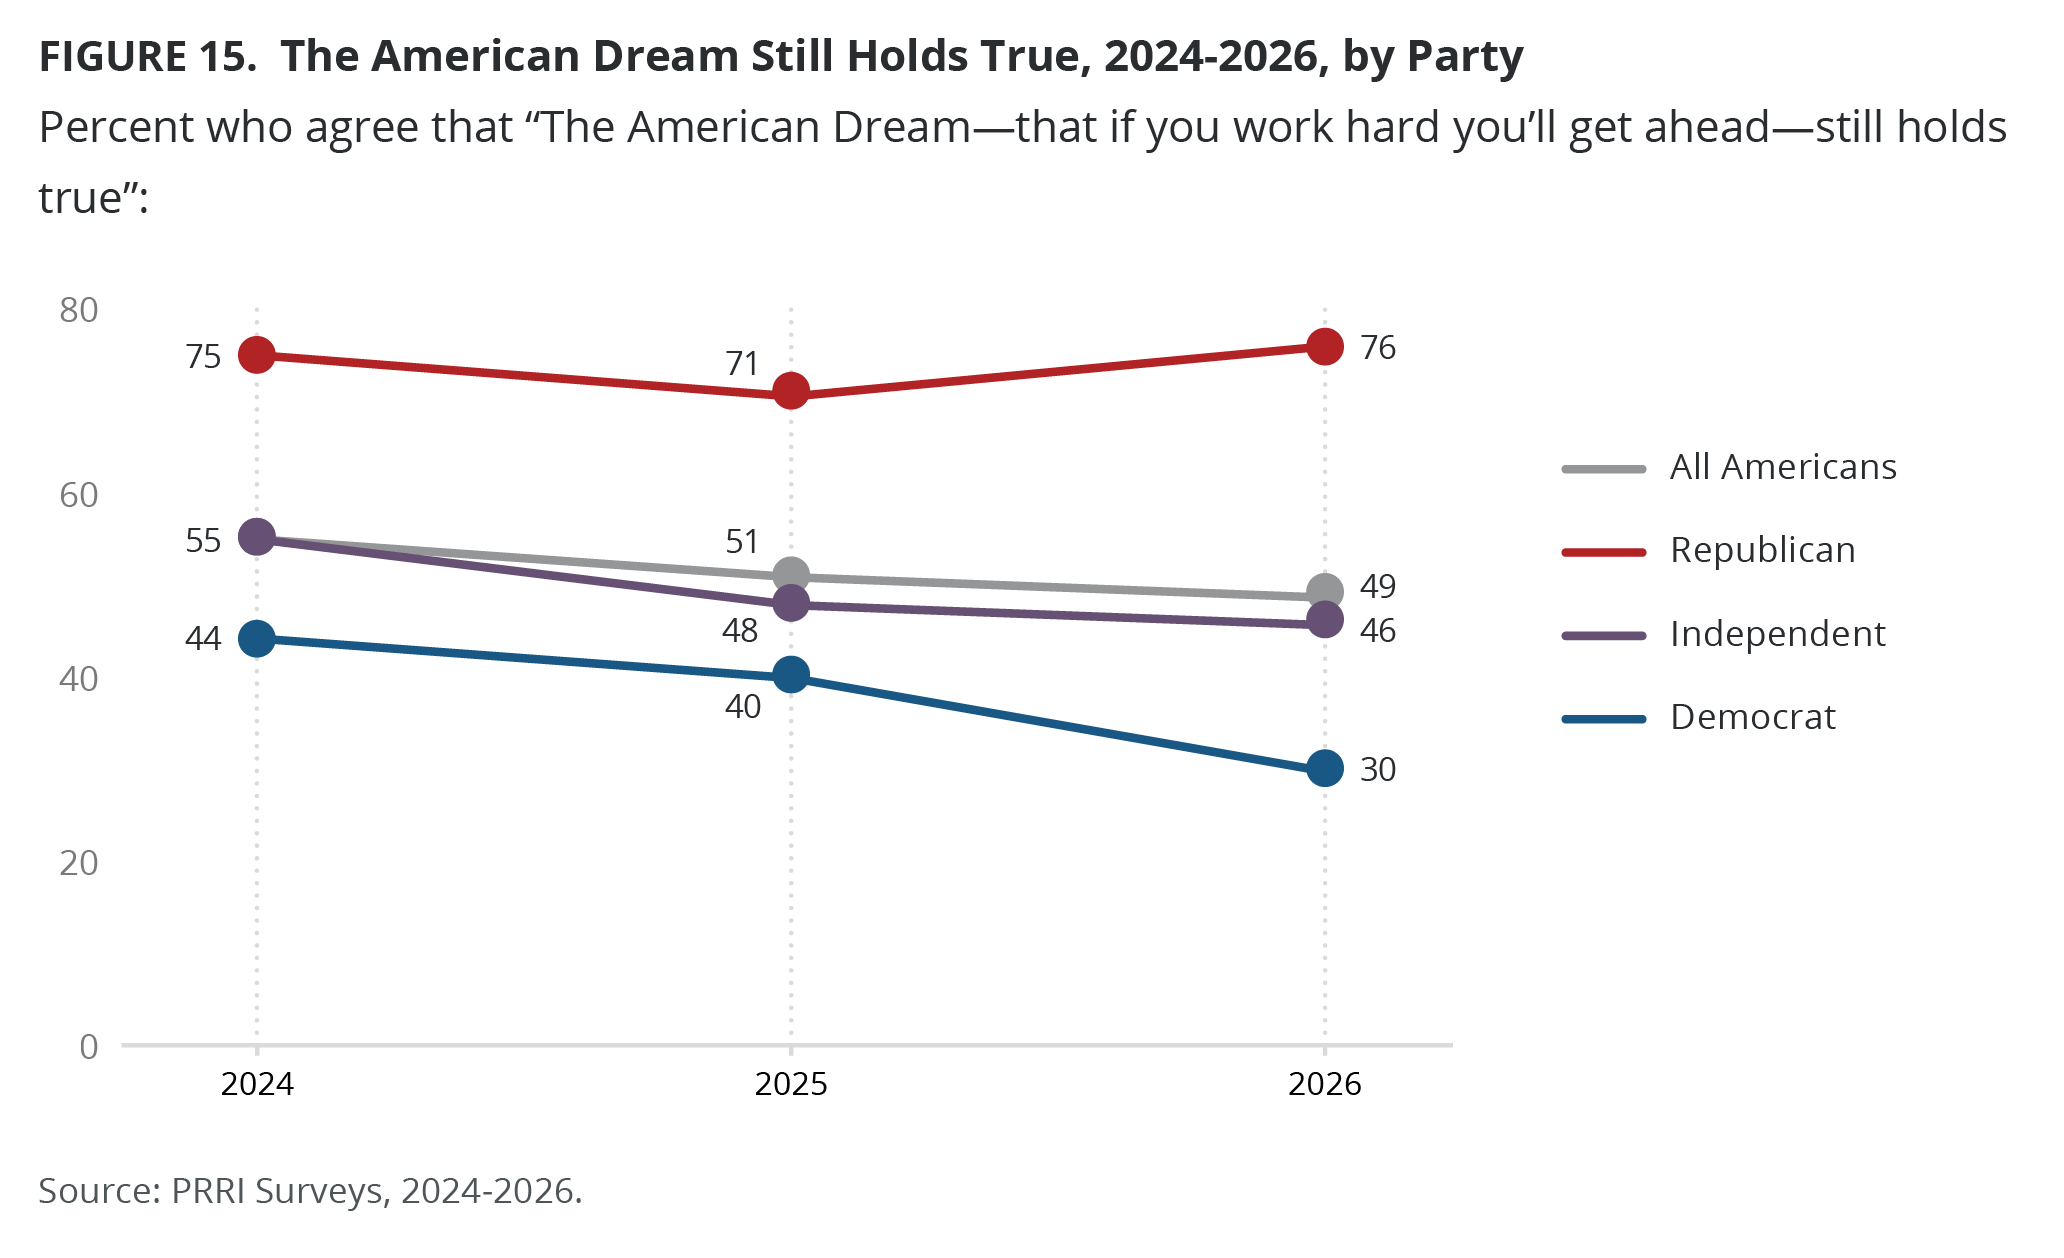
- Americans are divided on whether the American Dream — that if you work hard, you’ll get ahead — still holds true today (49% agree vs. 50% disagree). Republicans are notably more likely to believe in the American Dream (76%) than independents (46%) and Democrats (30%).
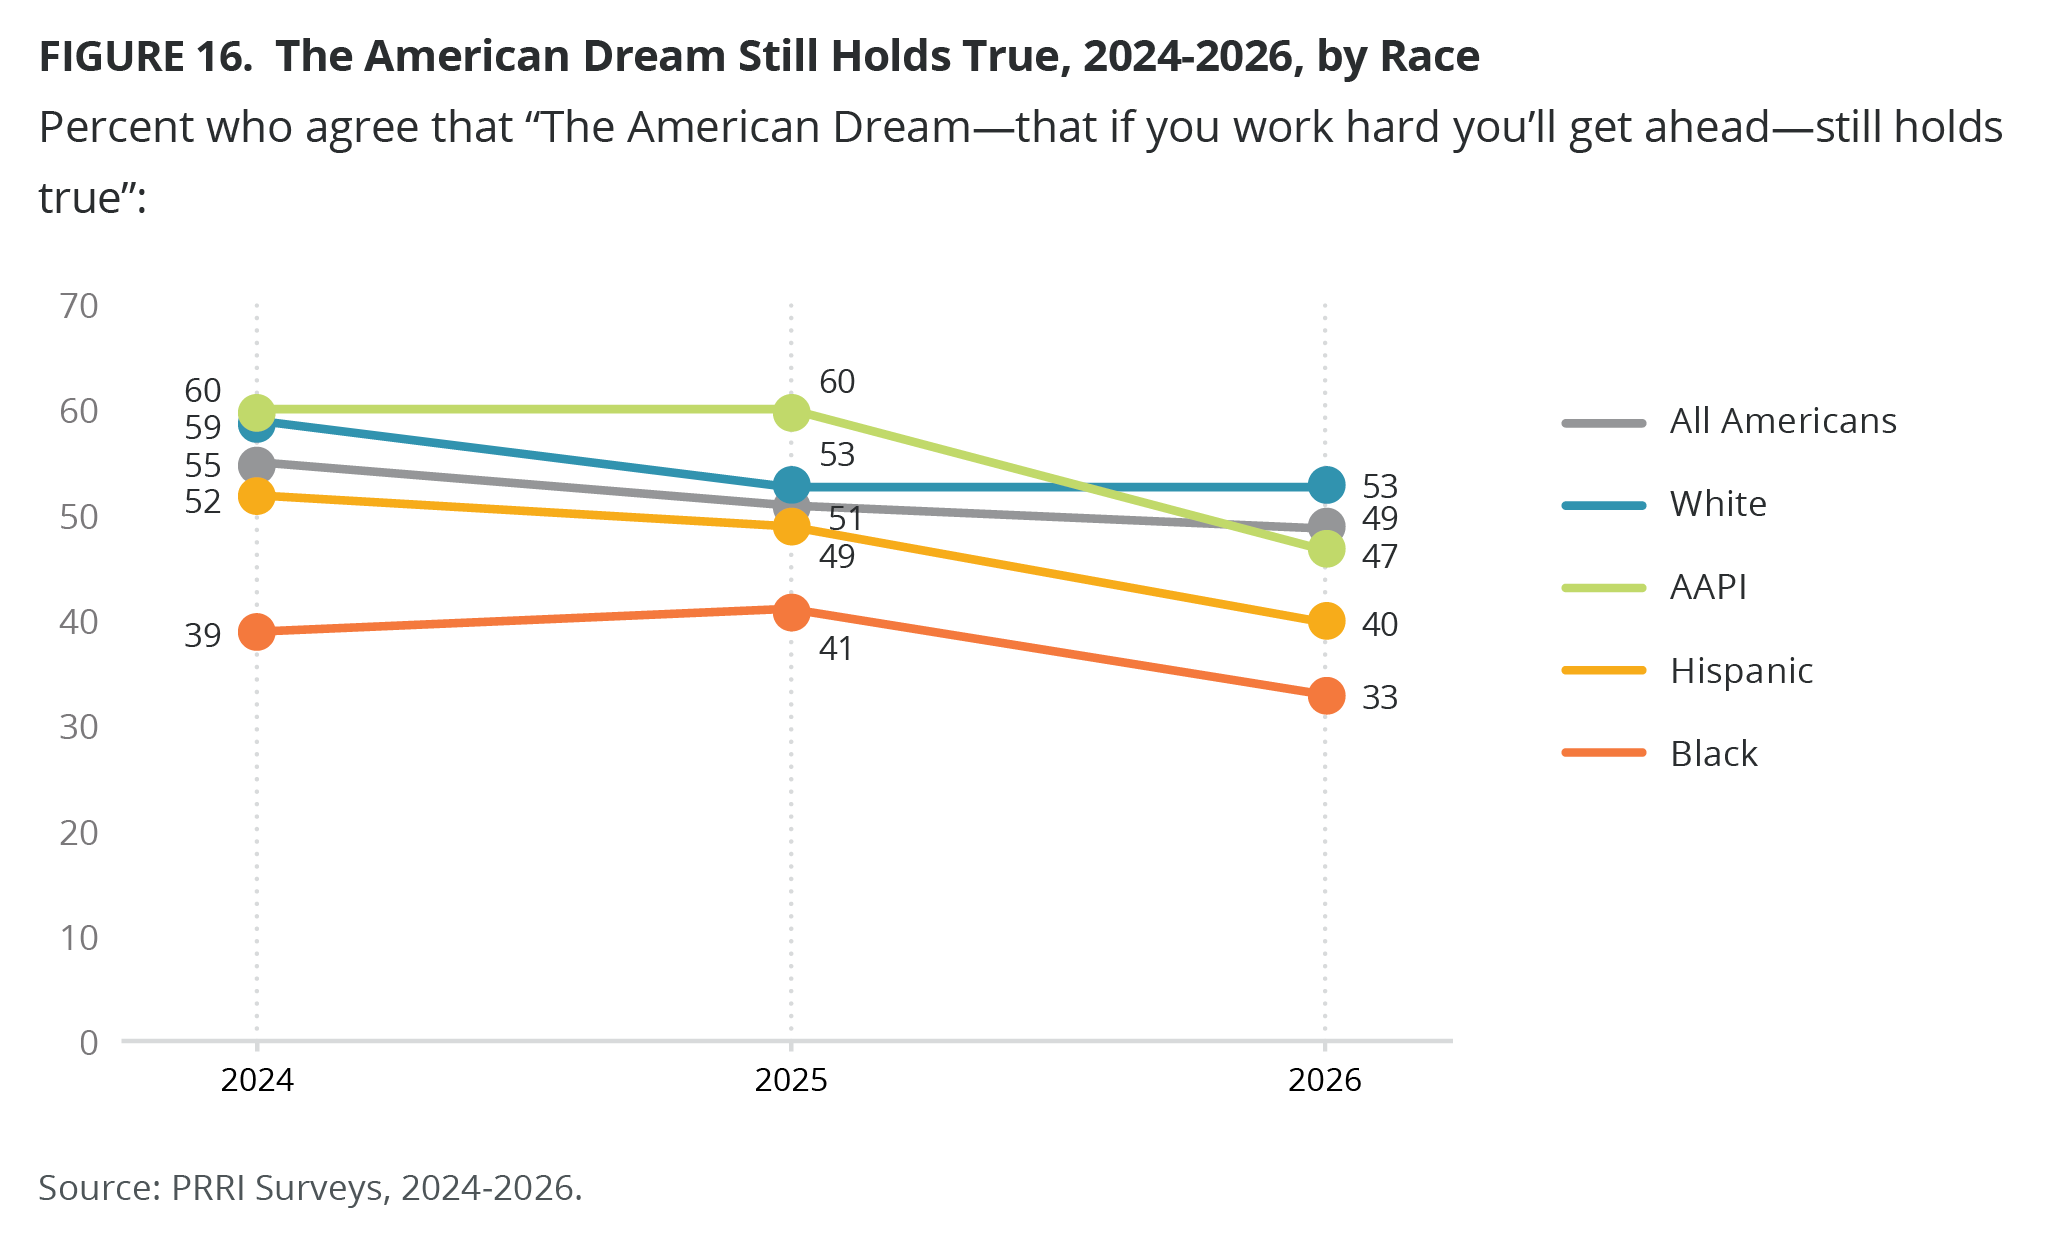
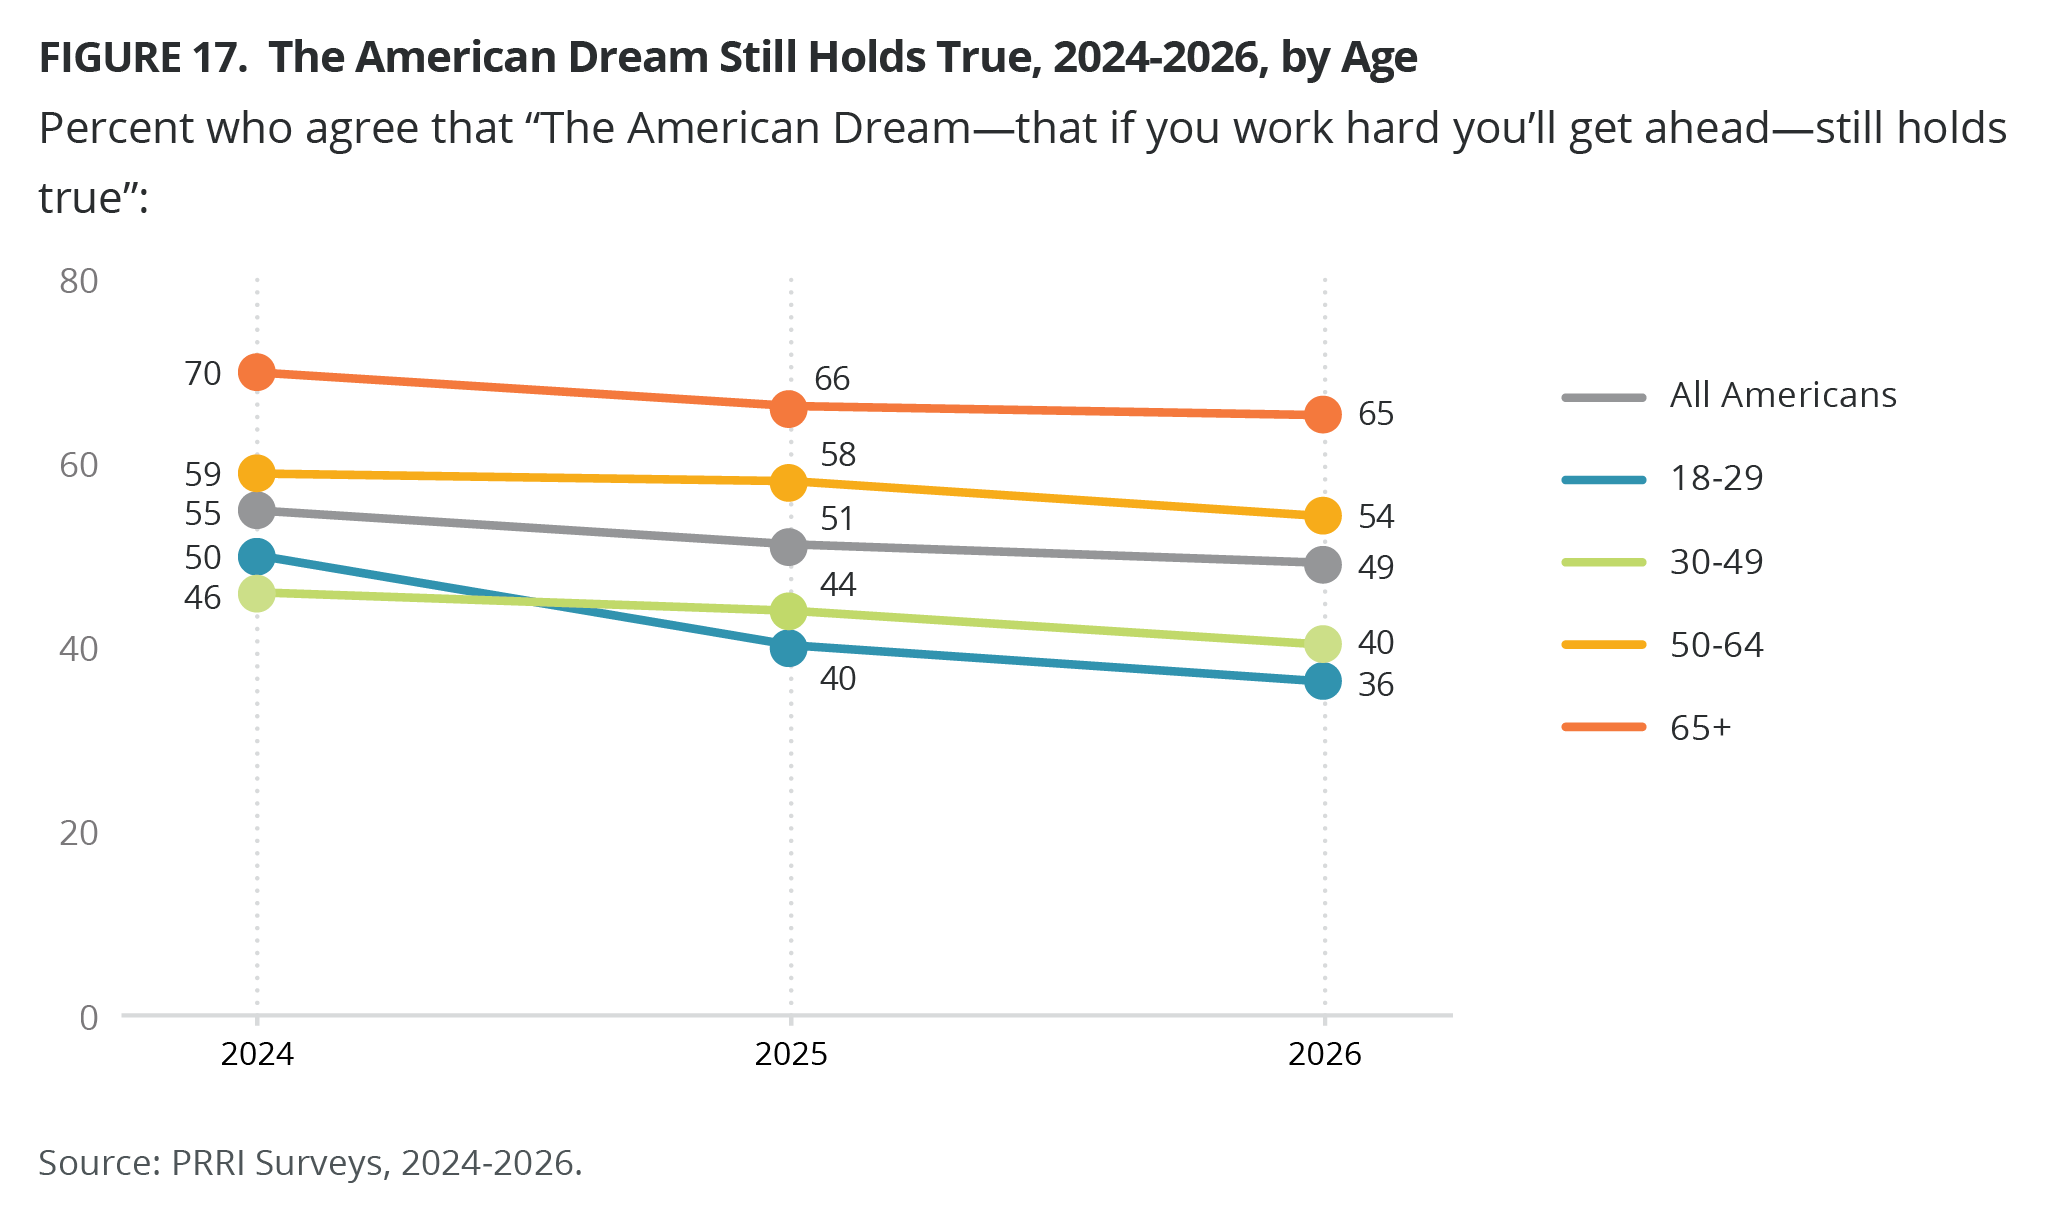
- Across all racial, gender, and age groups, the belief in the American Dream declined from 2024 to 2026, with the sharpest declines among Hispanic and AAPI Americans, women, and young Americans ages 18-29.
Most Americans believe the country is in danger of losing important democratic rights and freedoms; Republicans remain evenly divided on the issue.
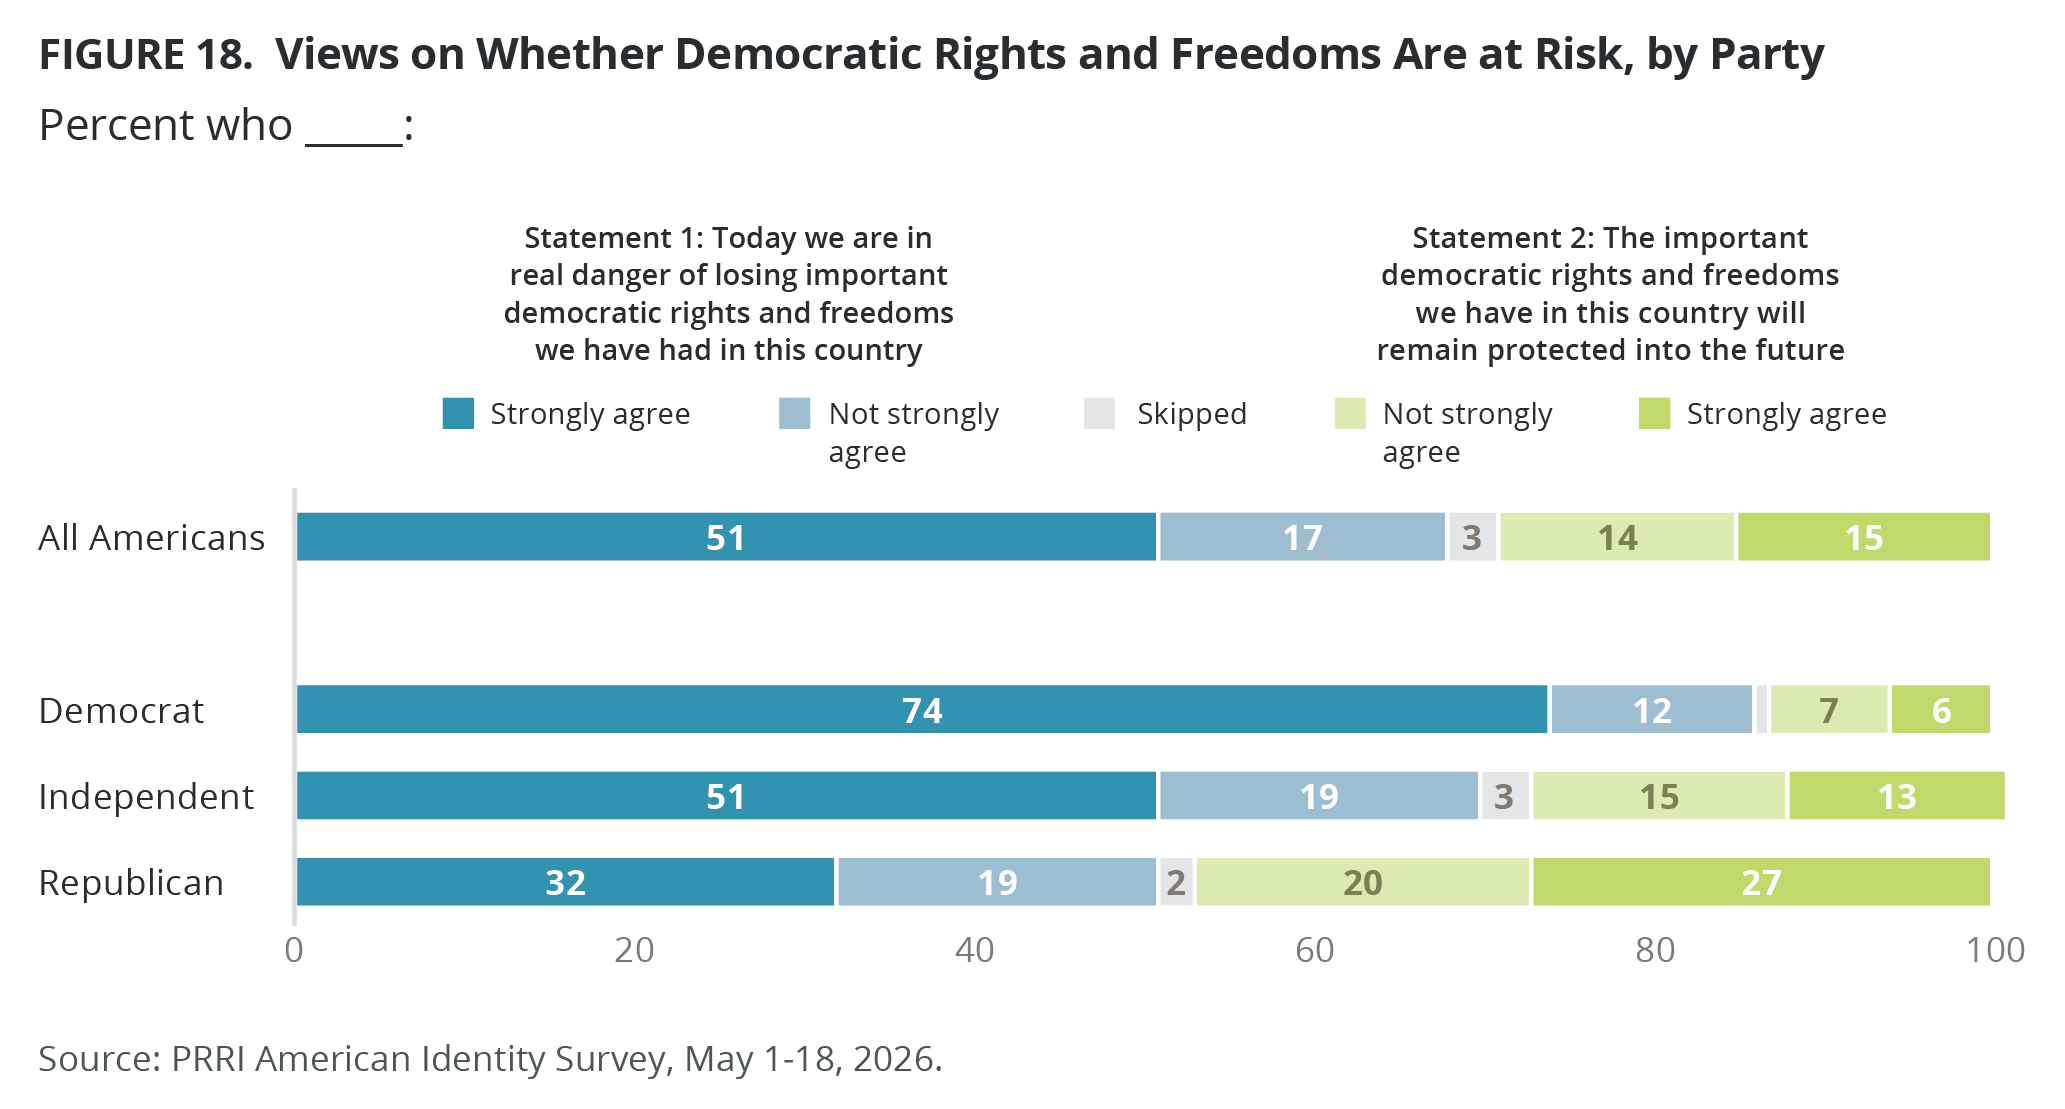
- More Americans agree that “we are in real danger of losing important democratic rights and freedoms we have had in this country” (68%) than “important democratic rights and freedoms we have in this country will remain protected into the future” (29%). Most Democrats (86%) and independents (70%) agree with the first statement, while Republicans are divided (51% vs. 47%).
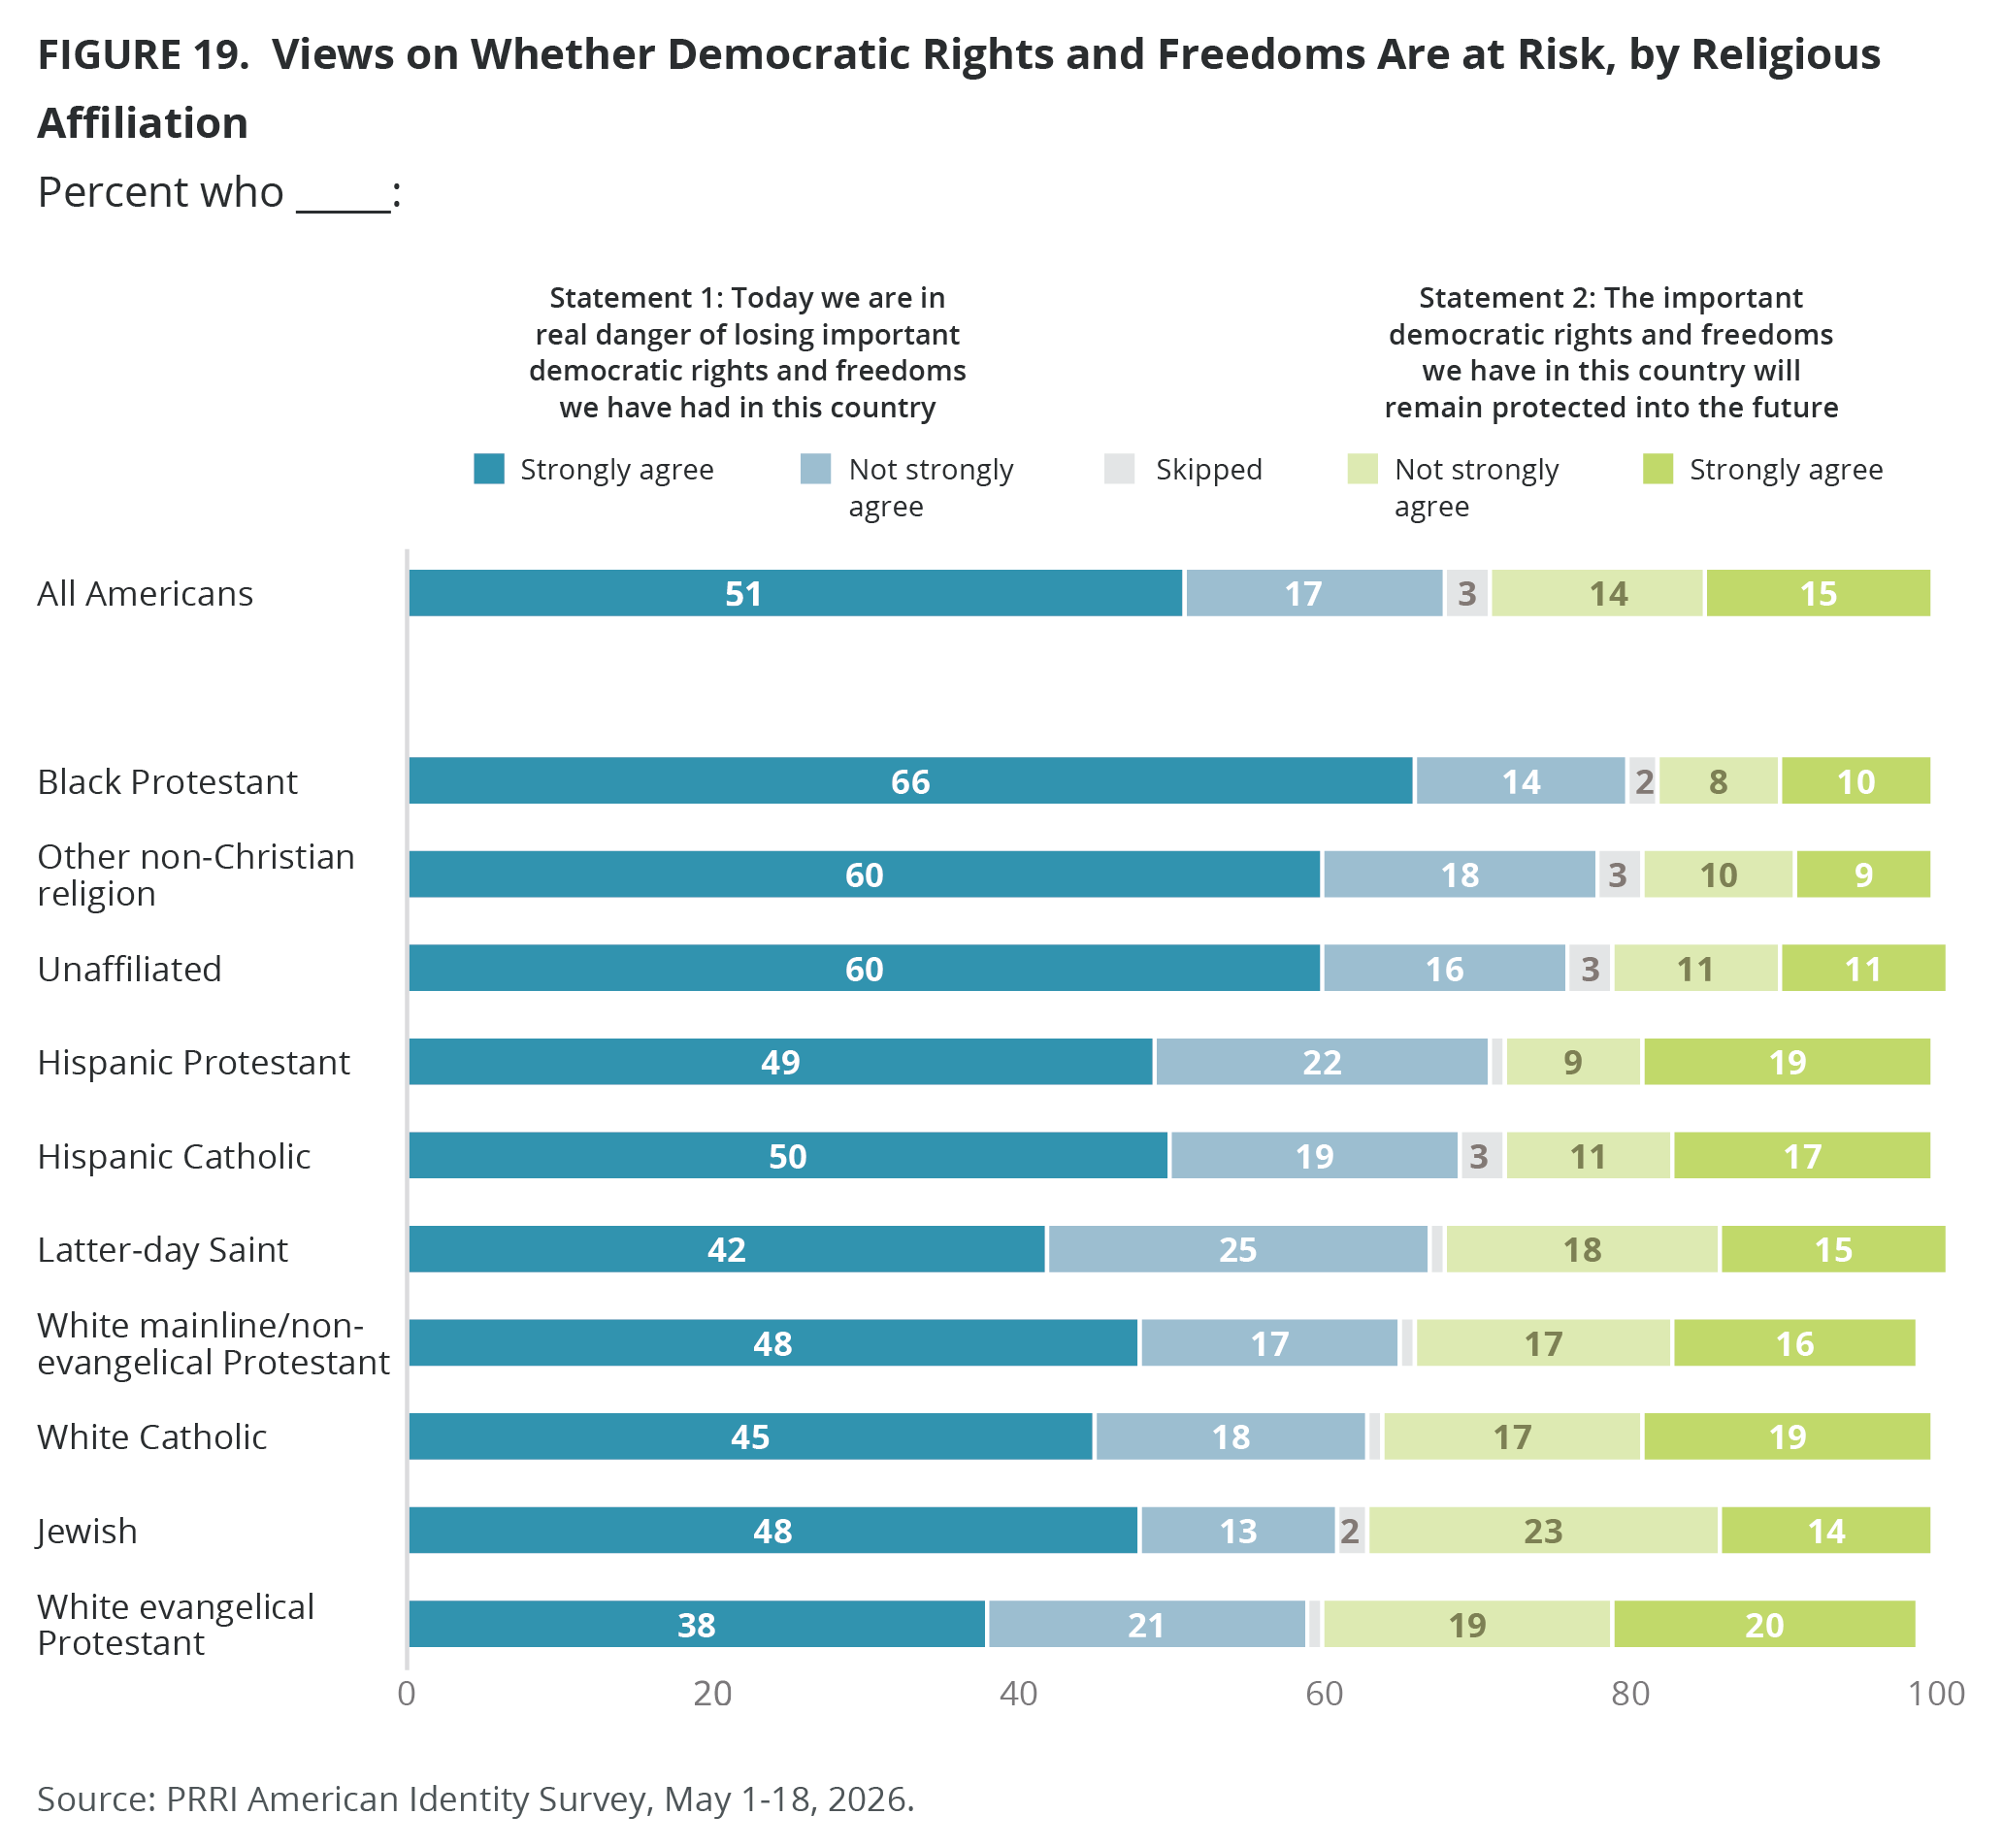
- Majorities across all religious traditions, Christian nationalism groups, and demographics agree that we are in real danger of losing our democratic rights and freedoms.
Most Americans believe America is in danger of losing its culture and identity, and remain divided over whether the values of Islam are at odds with American values.
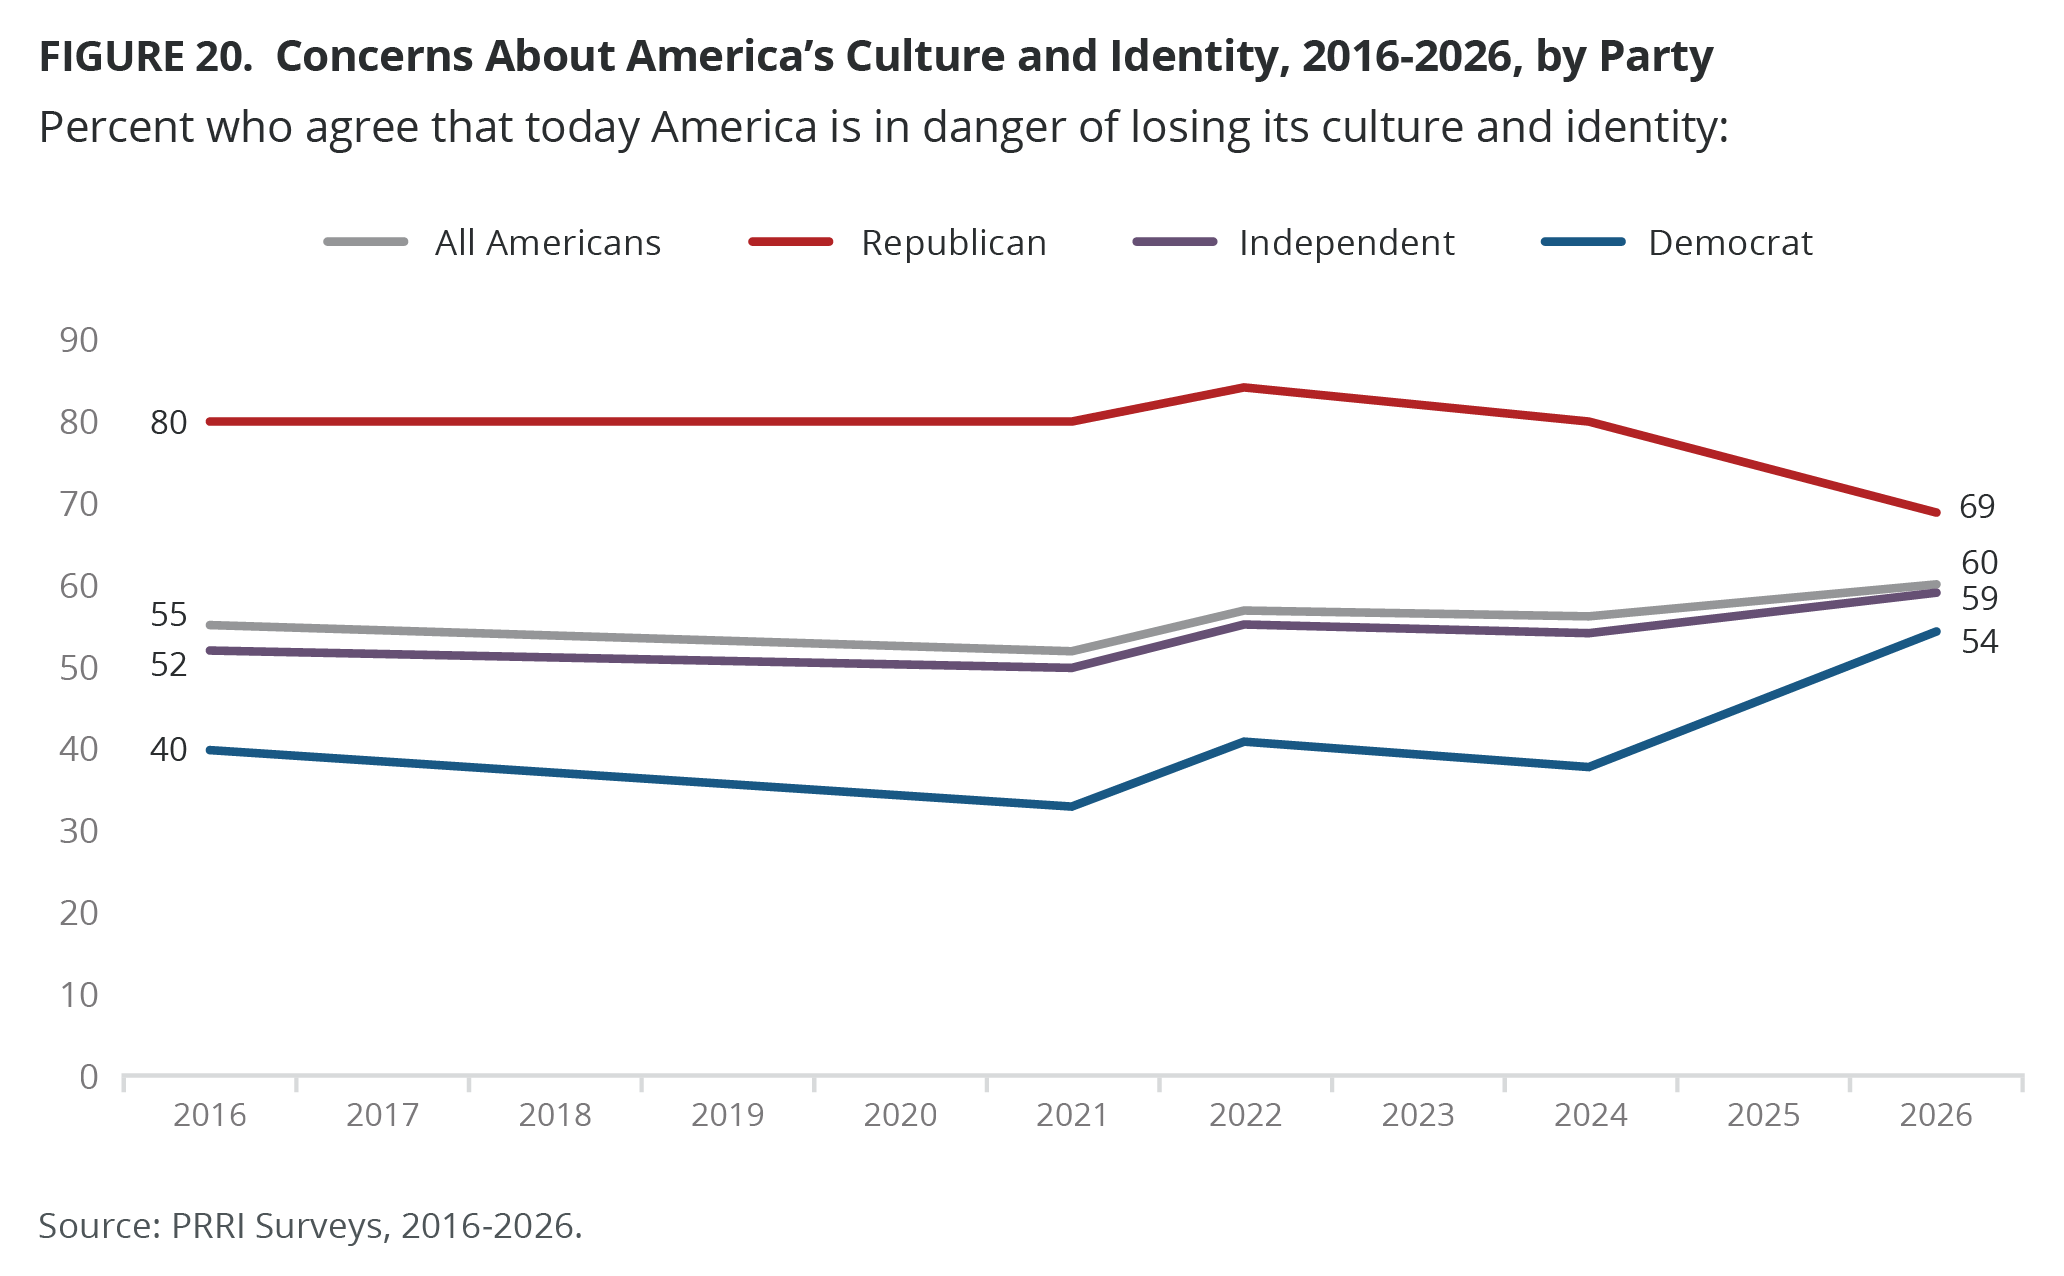
- Most Americans (60%) agree that America is in danger of losing its culture and identity (up from 55% in 2016). Since 2016, Republicans (from 80% to 69%) have become less likely to agree, while independents (from 52% to 59%) and Democrats (from 40% to 54%) have become more likely to do so.
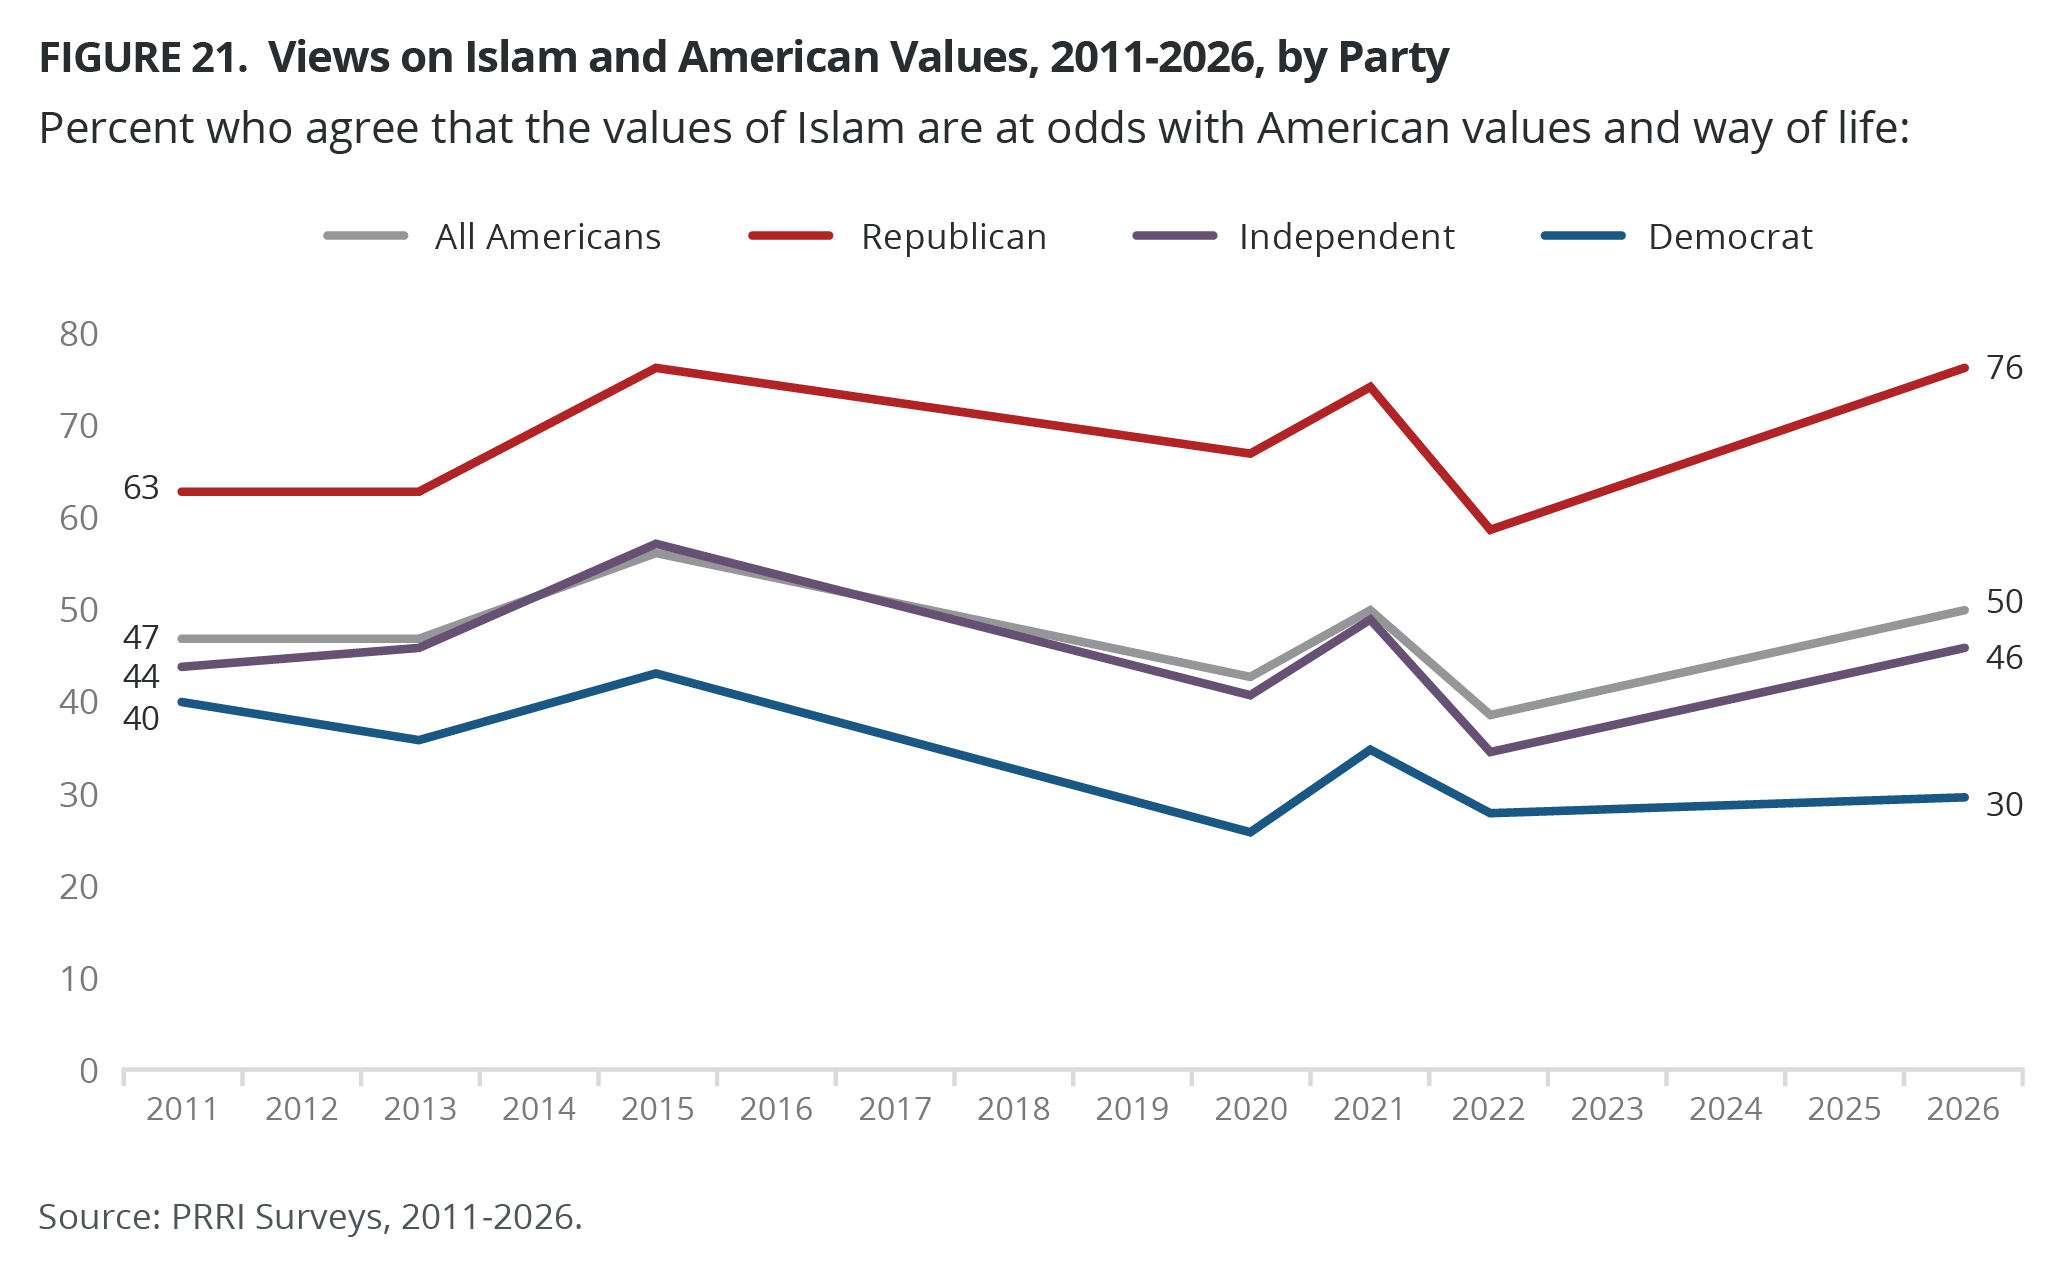
- Americans are divided on whether the values of Islam are at odds with American values and the American way of life (50% agree; 46% disagree). These views have remained relatively stable since 2011, despite a notable decline in 2022.
- Since 2011, views on whether Islam is at odds with American values have become more polarized, with Republicans growing more likely to agree (from 63% to 76%), and Democrats less likely to do so (from 40% to 30%).
Most Americans prefer the United States to cooperate with other nations than to use military force, except for Republicans and conservative white Christians.
- Most Americans agree more with the statement “I would prefer the U.S. to be a reliable neighbor that cooperates with other nations and only uses military force as a last resort” (70%) than with the statement “I would prefer the U.S. to be known as a mighty nation that does not hesitate to use military force to defend our interests” (27%). Most Democrats (90%) and independents (75%) agree with the first statement, while a slim majority of Republicans agree with the second statement (52%).
- Except for white evangelical Protestants and Christian nationalism Adherents, solid majorities across all groups favor the cooperation statement over the use of force statement.
Most Americans remain committed to a vision of America that is religiously and racially diverse.
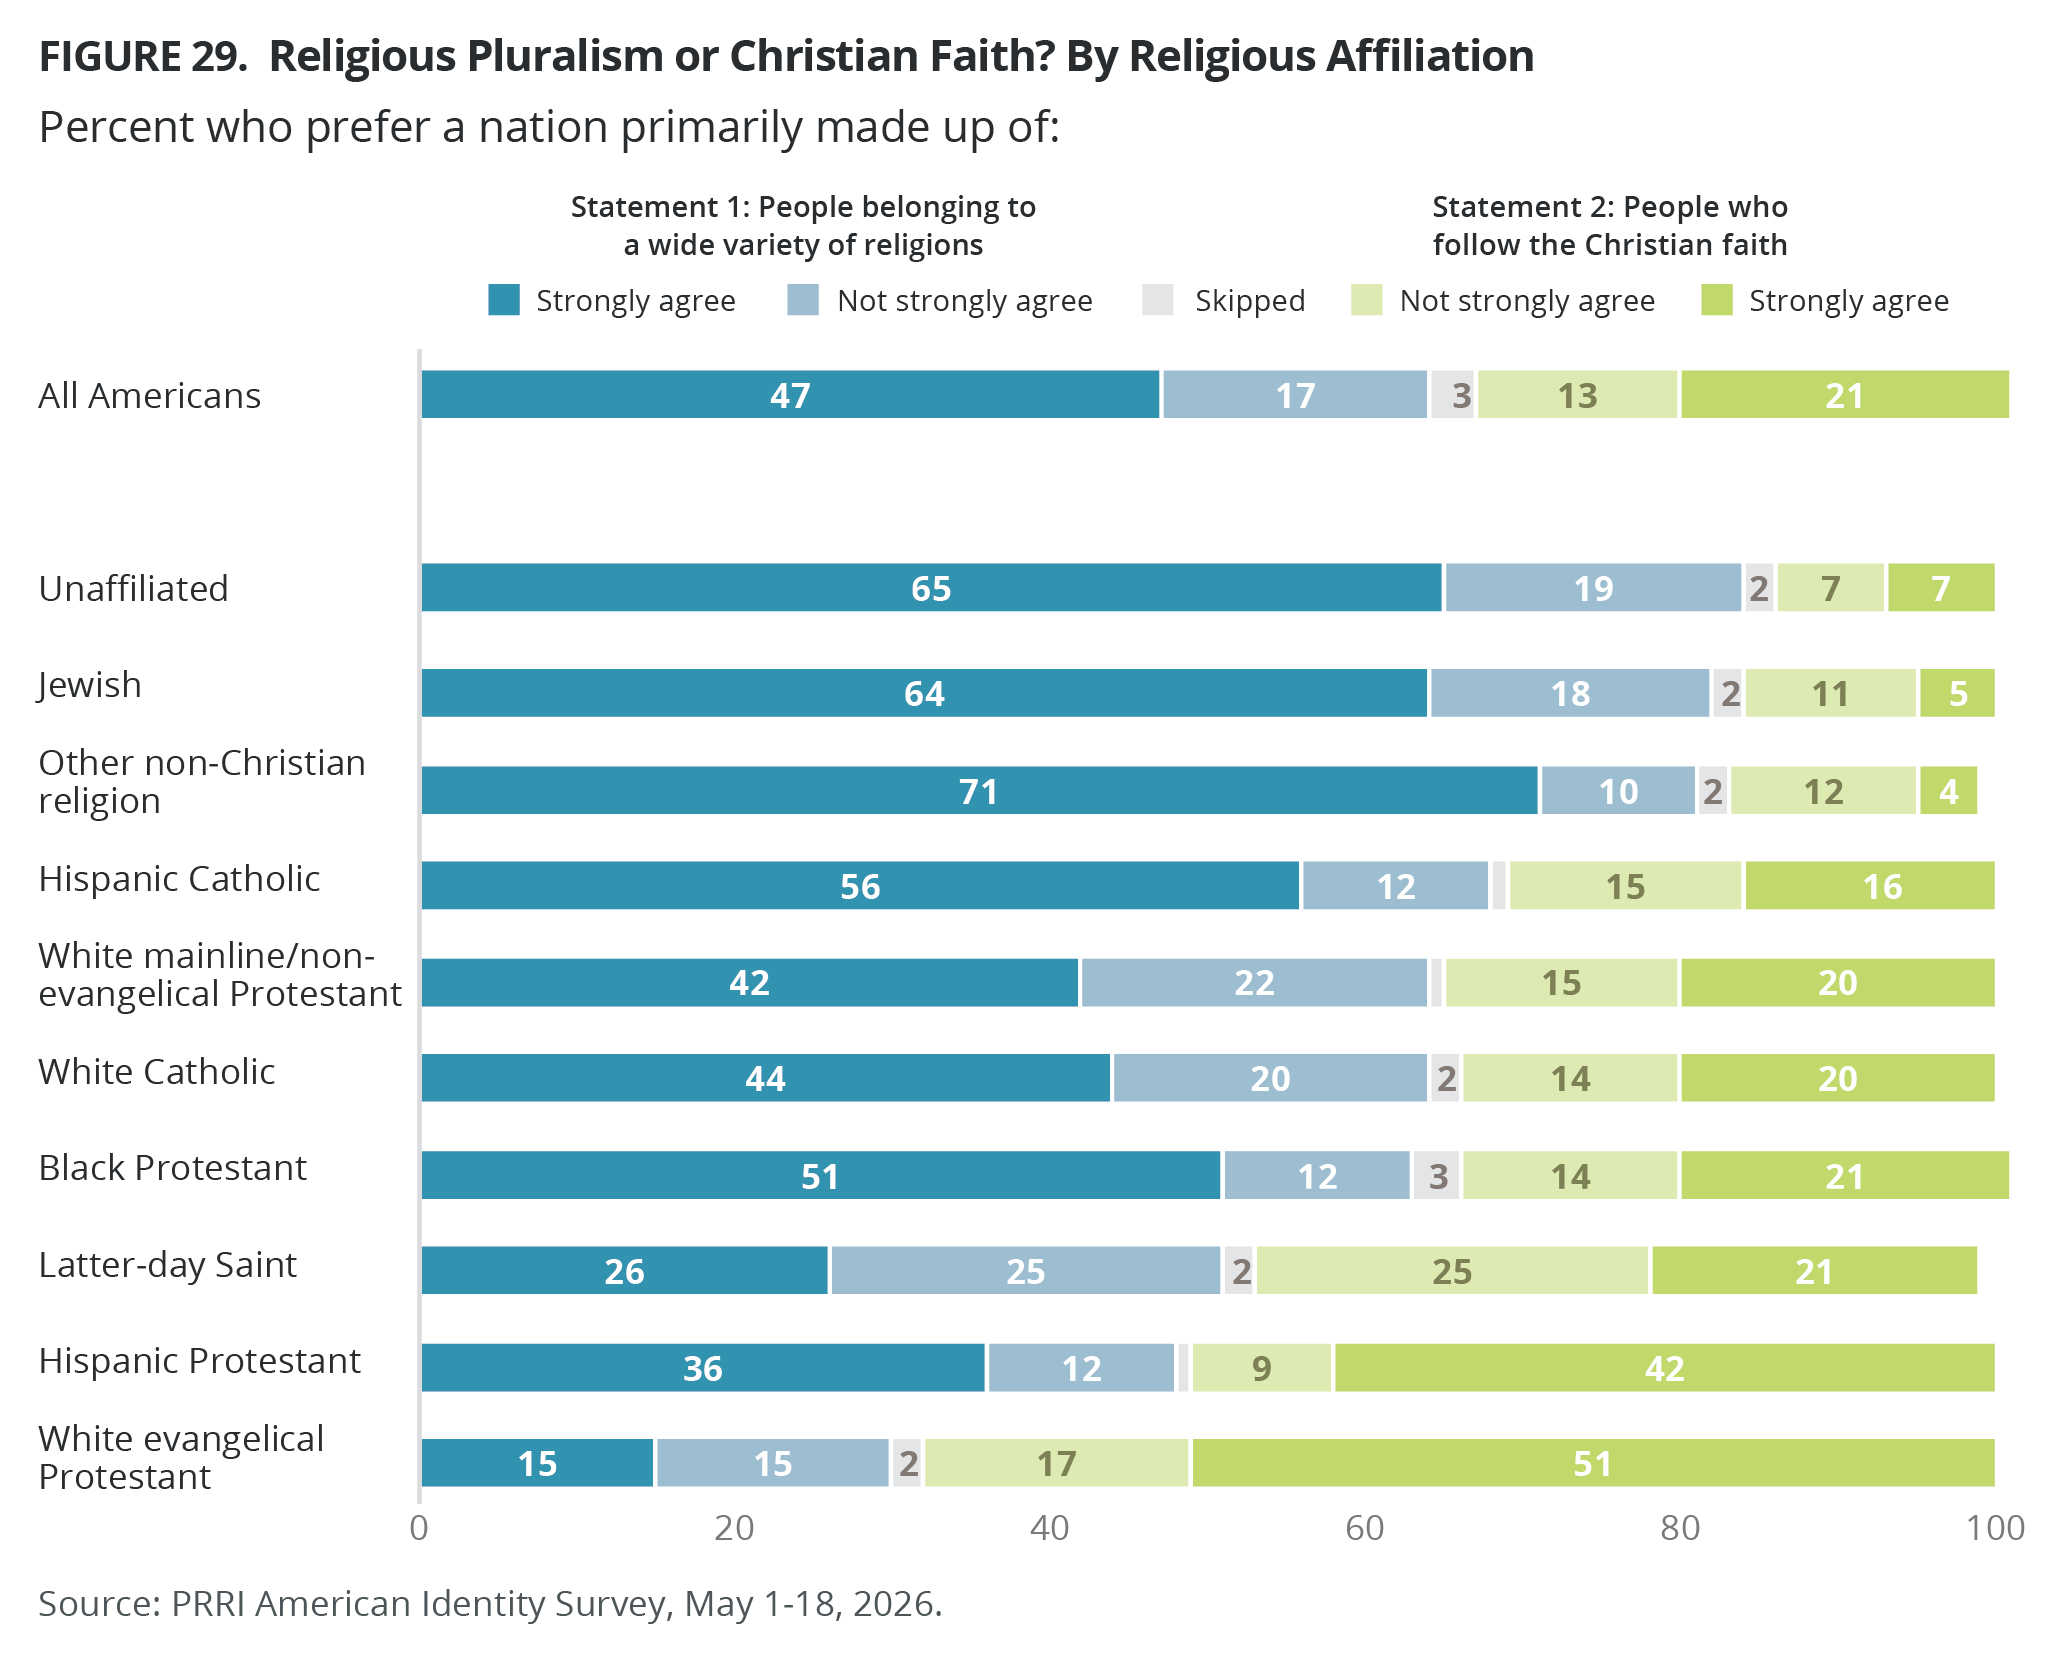
- Most Americans (64%) prefer the U.S. to be a nation made up of people belonging to a wide variety of religions rather than one primarily made up of people who follow the Christian faith (34%).
- Most Americans (77%) prefer the U.S. to be a nation made up of people from all over the world rather than one primarily made up of people of Western European heritage (20%).
- Most Americans across all groups prefer a religiously and a racially diverse nation, while white evangelical Protestants, Christian nationalism Adherents and Sympathizers are more likely to prefer a nation primarily made up of Christians.
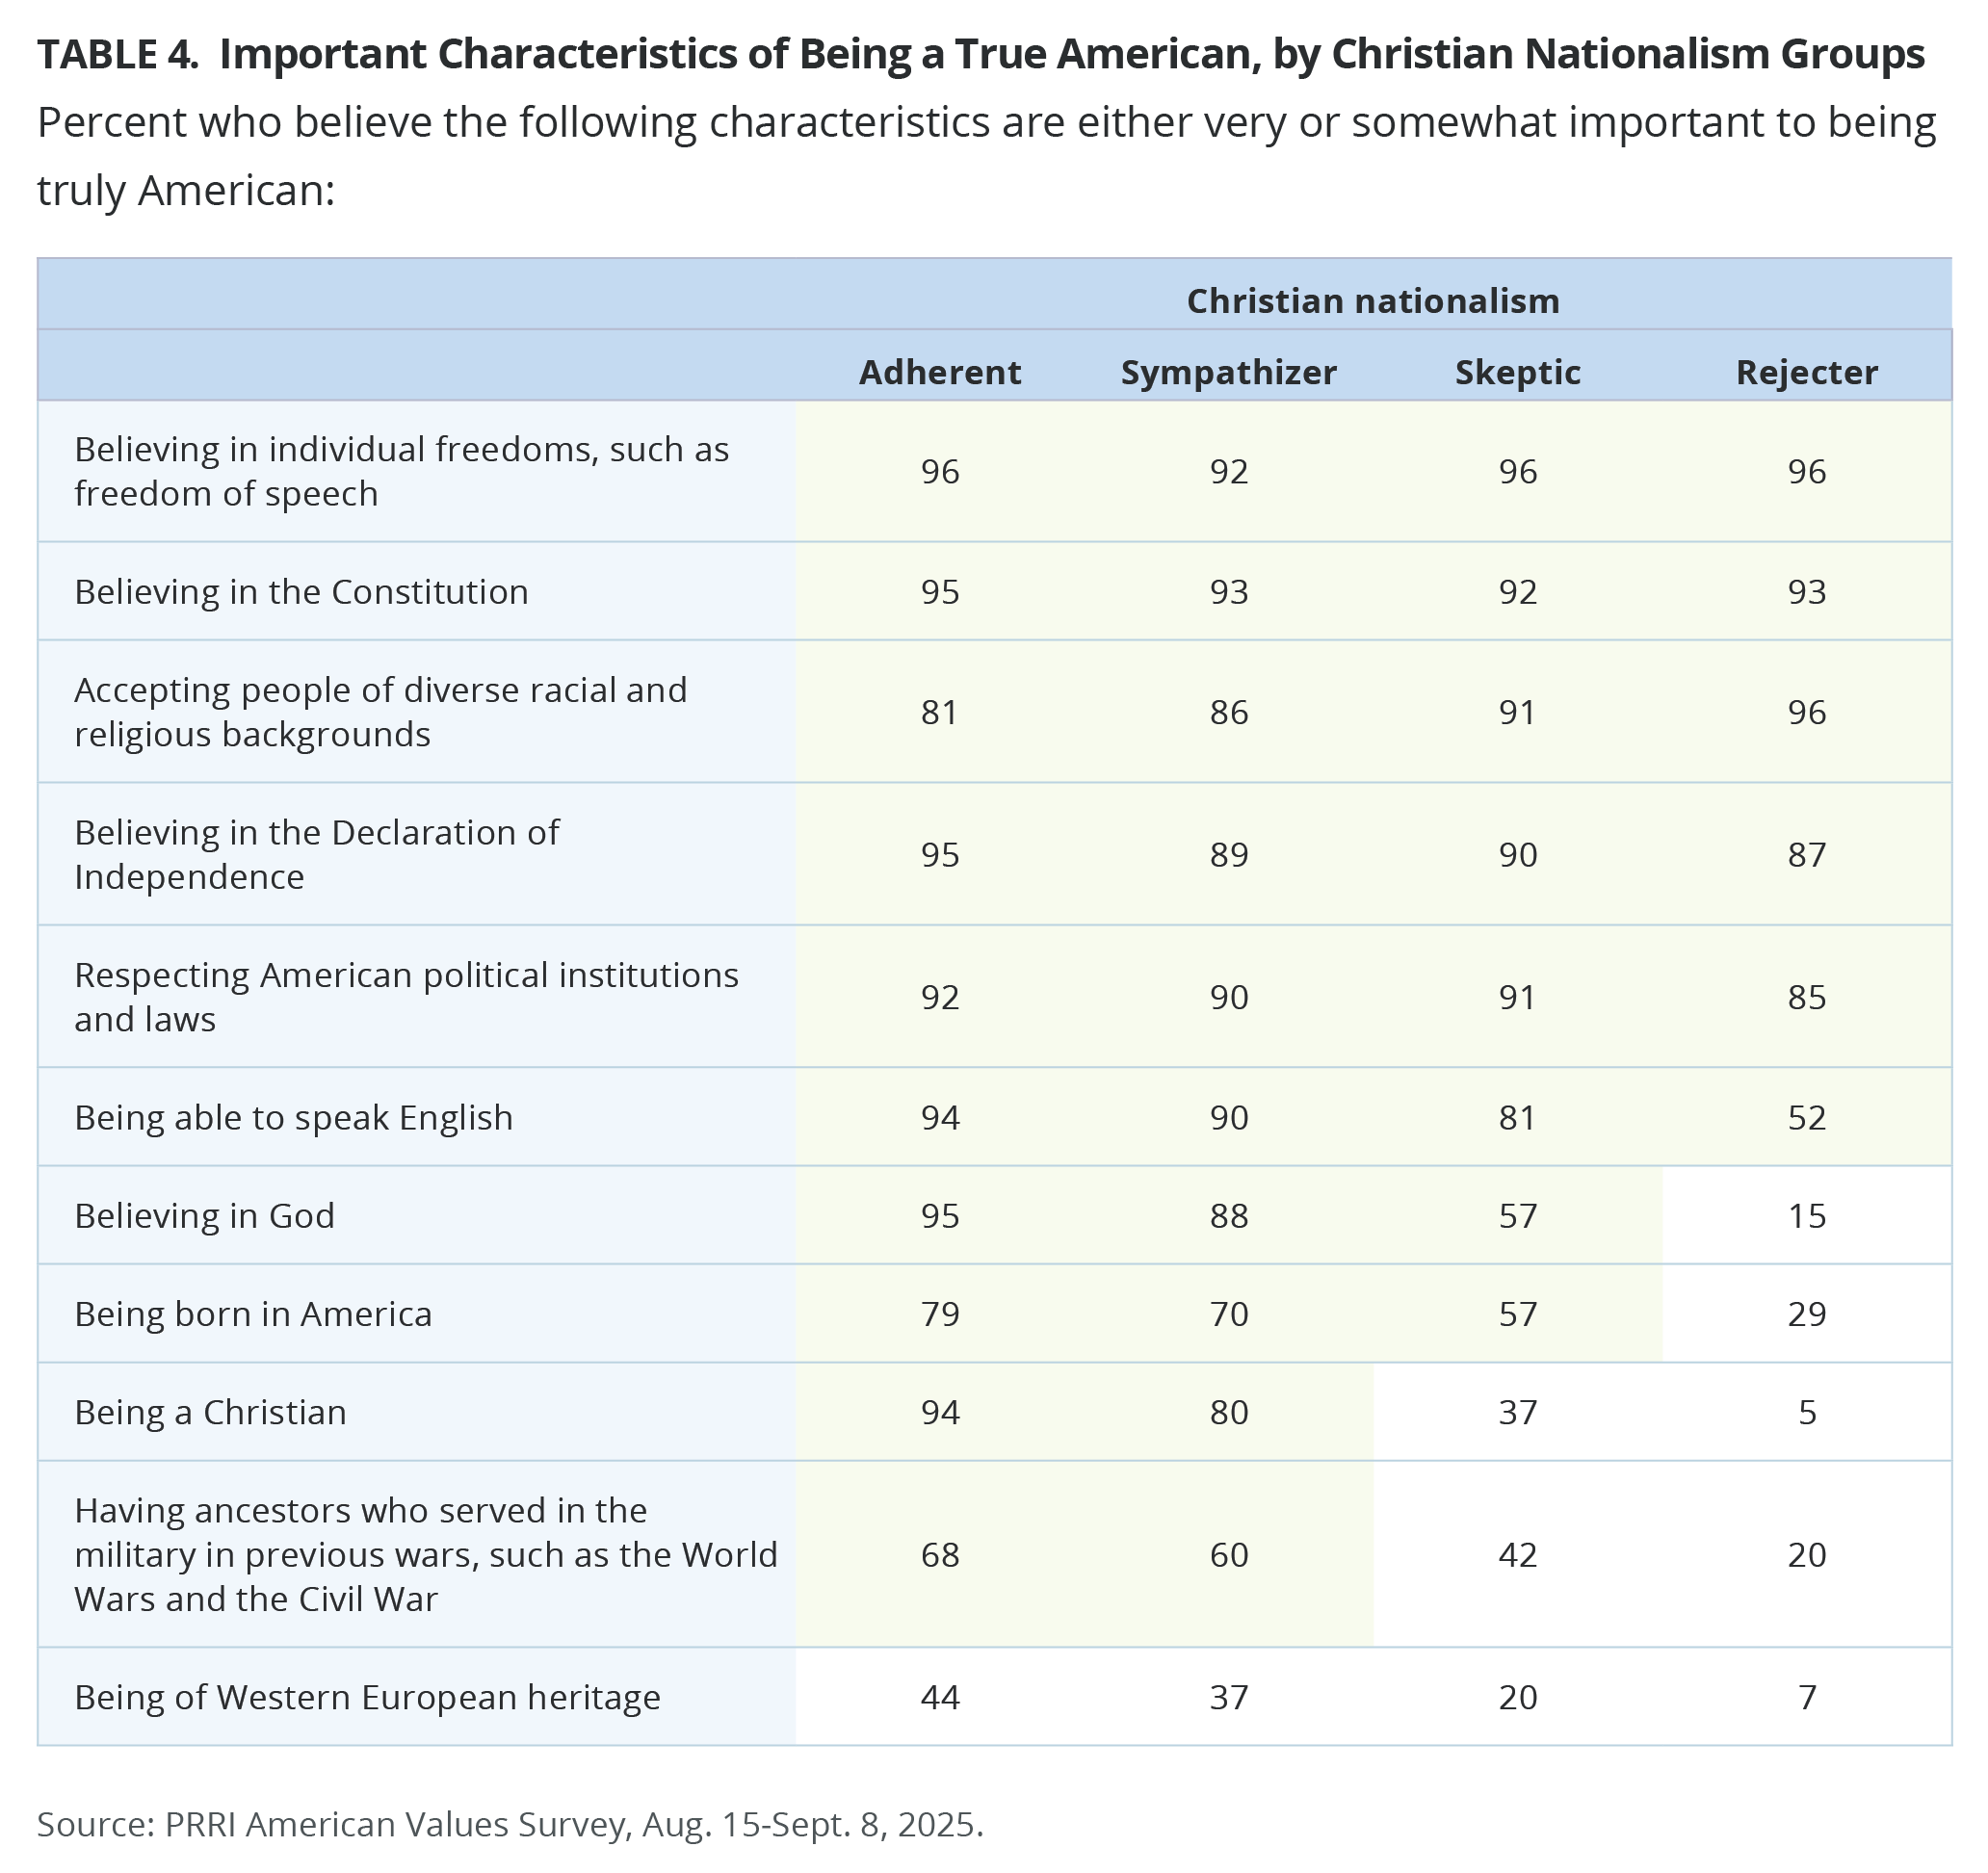
There is a broad consensus on civic ideals as important traits to being truly American, but more disagreement as to whether being Christian or being of Western European heritage is necessary to being truly American.
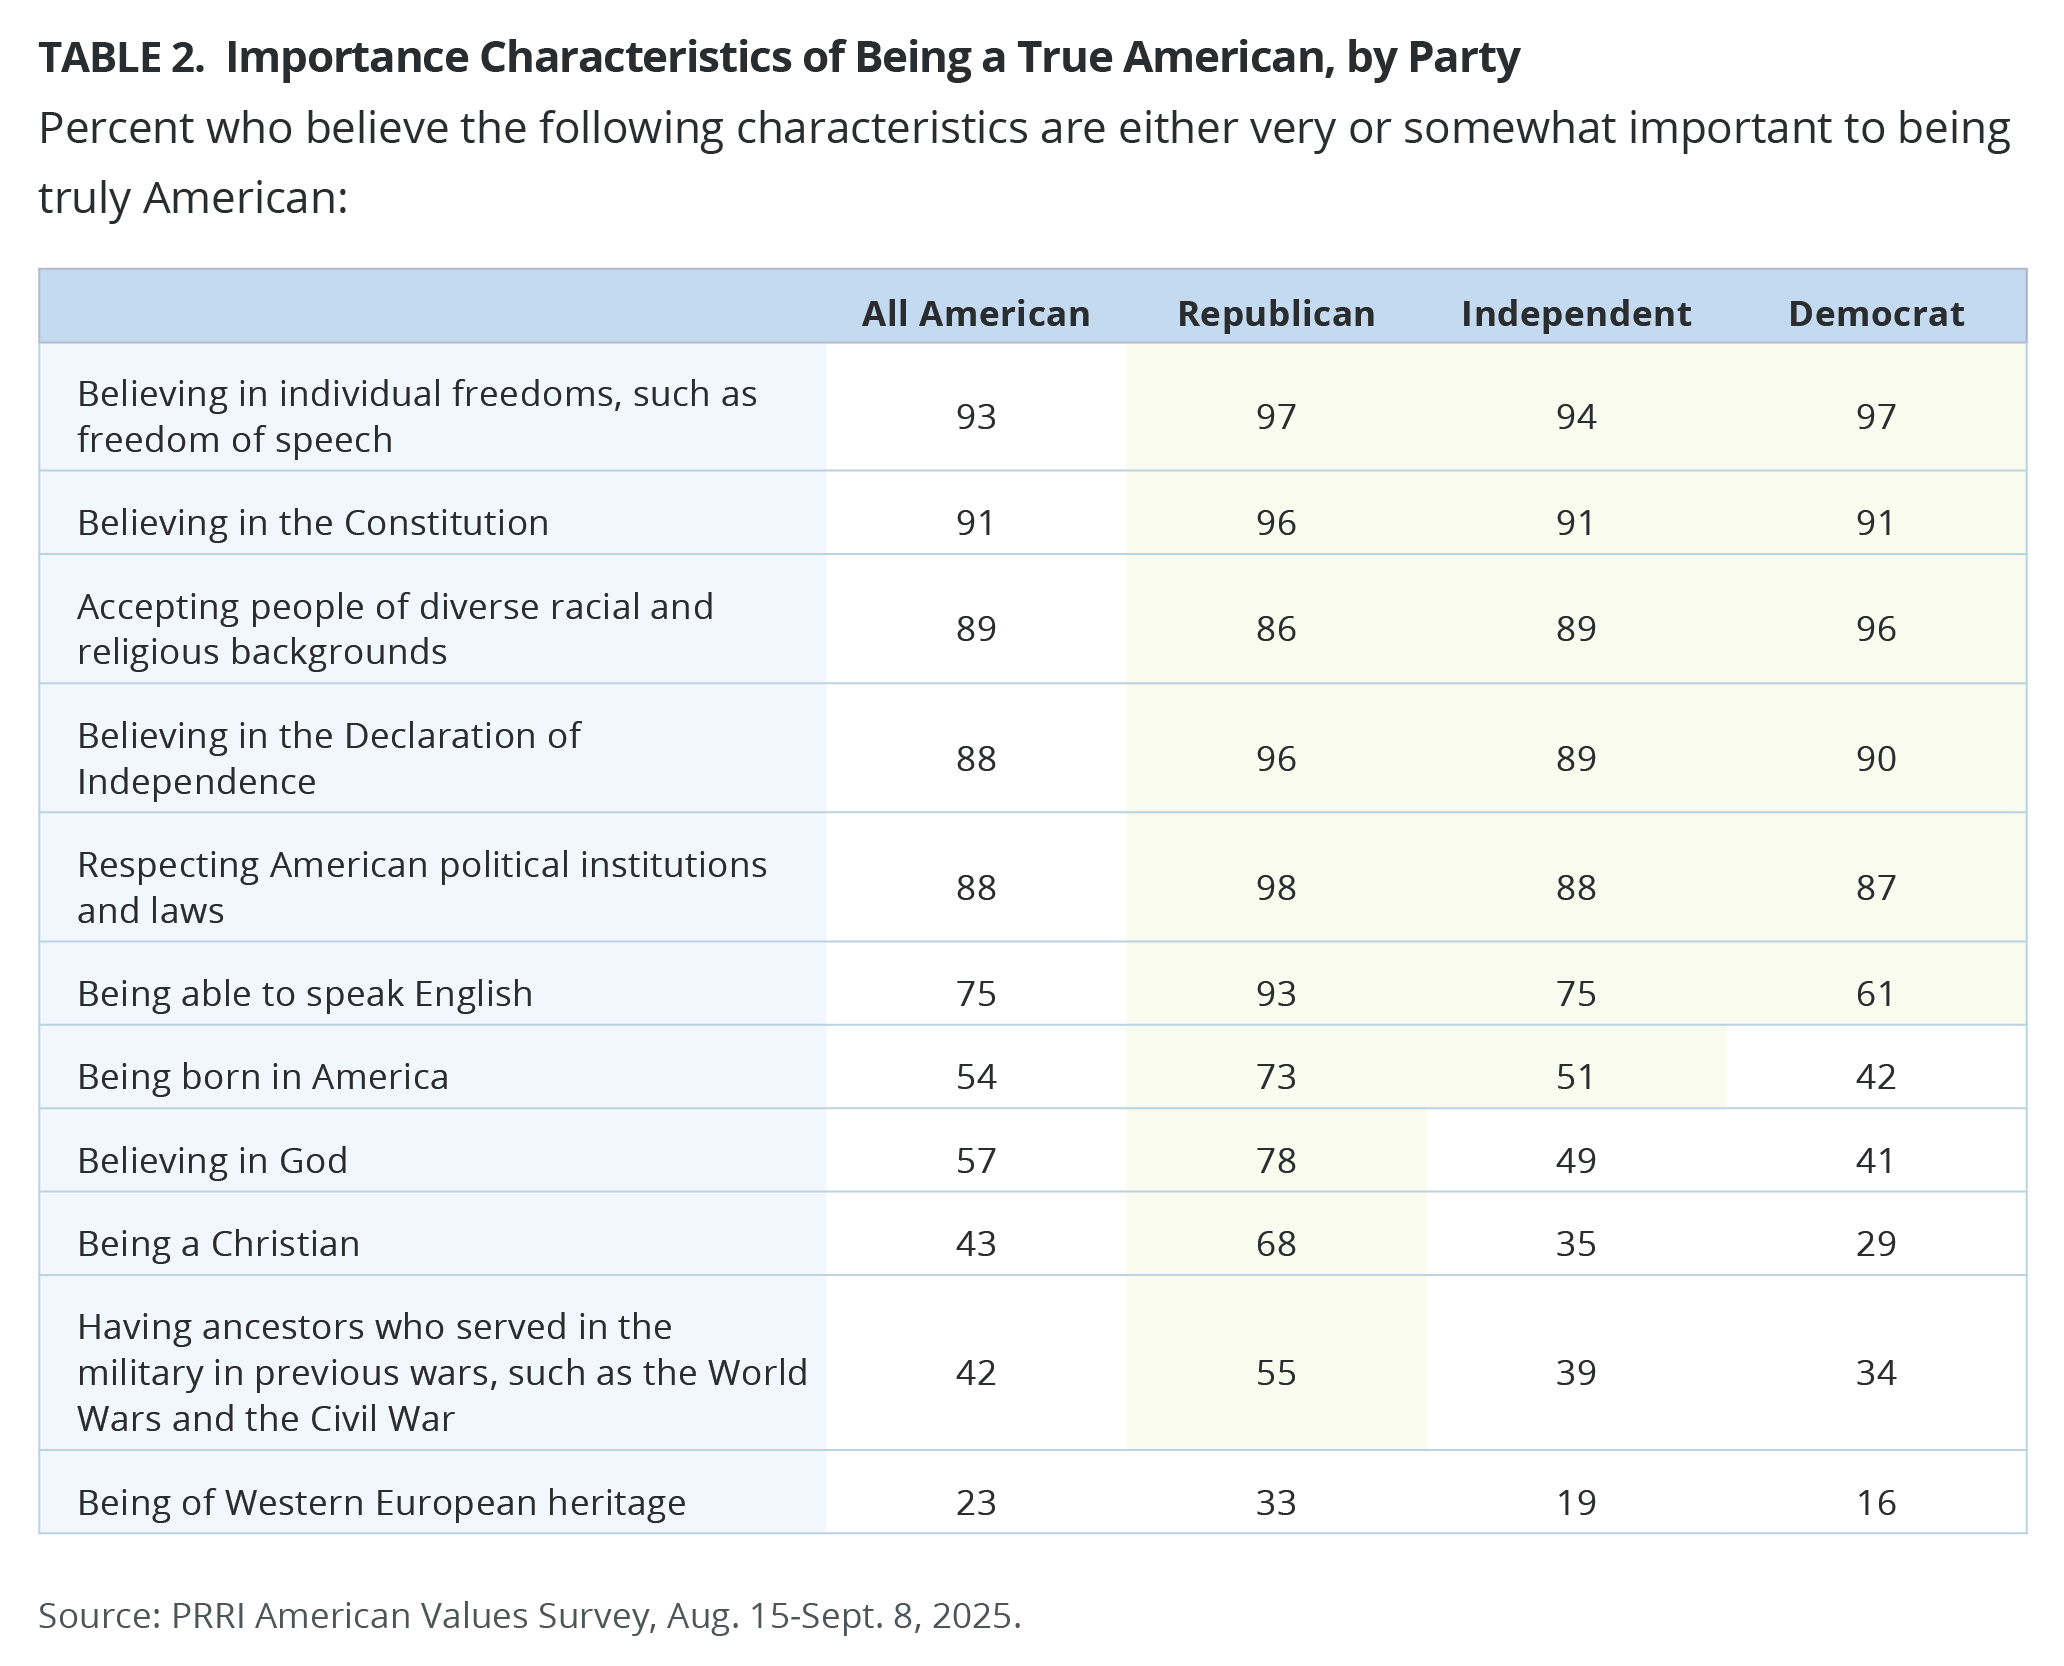
- Most Americans say believing in individual freedoms (93%), the Constitution (91%), and the Declaration of Independence (88%), accepting diverse backgrounds (89%), respecting American political institutions and laws (88%), and speaking English (75%) are important to “being truly American.”
- Smaller majorities say believing in God (57%) and being born in the U.S. (54%) are true American traits. Fewer Americans say being Christian (43%), having military-ancestor ties (42%), or Western European heritage (23%) are important to being truly American.
Introduction
PRRI interviewed more than 5,000 adults to assess Americans’ views on national identity, politics, religion, democracy, and cultural change. Specifically, this report explores favorability toward political and religious leaders and movements, including President Donald Trump and Pope Leo XIV, as well as Trump’s handling of immigration and the war in Iran. The report also highlights Americans’ levels of pride in the country, democracy, the economy, and America’s historical and moral standing. Finally, the report explores competing visions of American identity and democracy.
Favorability Ratings
Donald Trump
More than a year into the second Trump administration, 34% of Americans hold favorable views of Trump, down slightly from 36% in February and 7 percentage points lower than in September 2024 (41%) ahead of the last presidential election. Six in ten Americans view Trump unfavorably (62%).
Nearly eight in ten Republicans (79%) continue to hold favorable views of Trump, compared with one-quarter of independents (25%), and just 5% of Democrats. However, favorability among Republicans and independents has continued a downward trend since September 2024, when 84% of Republicans and 37% of independents viewed Trump favorably.[1]
When examining Trump’s favorability ratings by a 7-point party identification scale between 2024 and 2026, the sharpest decreases occur among independents and Republican-leaning voters. Among “strong Republicans,” favorability remains high and stable, standing at around 91%. However, support among less committed Republicans has weakened significantly, with favorability among “not very strong Republicans” dropping 7 points, from 70% to 63%.
“Republican leaners” show the largest decline, falling 17 points from 65% to 48%. Significant declines were also evident among true independents (those who don’t lead toward either party), who experienced a 21-percentage point decrease, from 35% to 14%. Democrats of all leanings remained virtually unchanged in their view of Trump over the last two years.
President Trump vs. Pope Leo XIV
Americans hold more favorable views of Pope Leo XIV than of Trump. Overall, 56% of Americans view the new pope favorably, compared with 34% who view Trump favorably. Democrats (73%) are notably more likely than independents (55%) and Republicans (47%) to hold favorable views of the new pope. By contrast, favorable views of Trump are much higher among Republicans (79%), compared with 25% of independents and just 5% of Democrats.
Favorable views of the new pope also differ across religious groups. White Catholics remain the most favorable toward Pope Leo (75%), though their favorability is notably lower than it was toward Pope Francis (90%) in 2015. Majorities of Jewish Americans (66%), Hispanic Catholics (64%), white mainline/non-evangelical Protestants (61%), other non-Christians (56%), and religiously unaffiliated Americans (54%) also view Leo favorably, while Black Protestants (52%) and Latter-day Saints (47%) are divided. White evangelical Protestants (41%) and Hispanic Protestants (35%) are the least likely to hold favorable views of Leo.
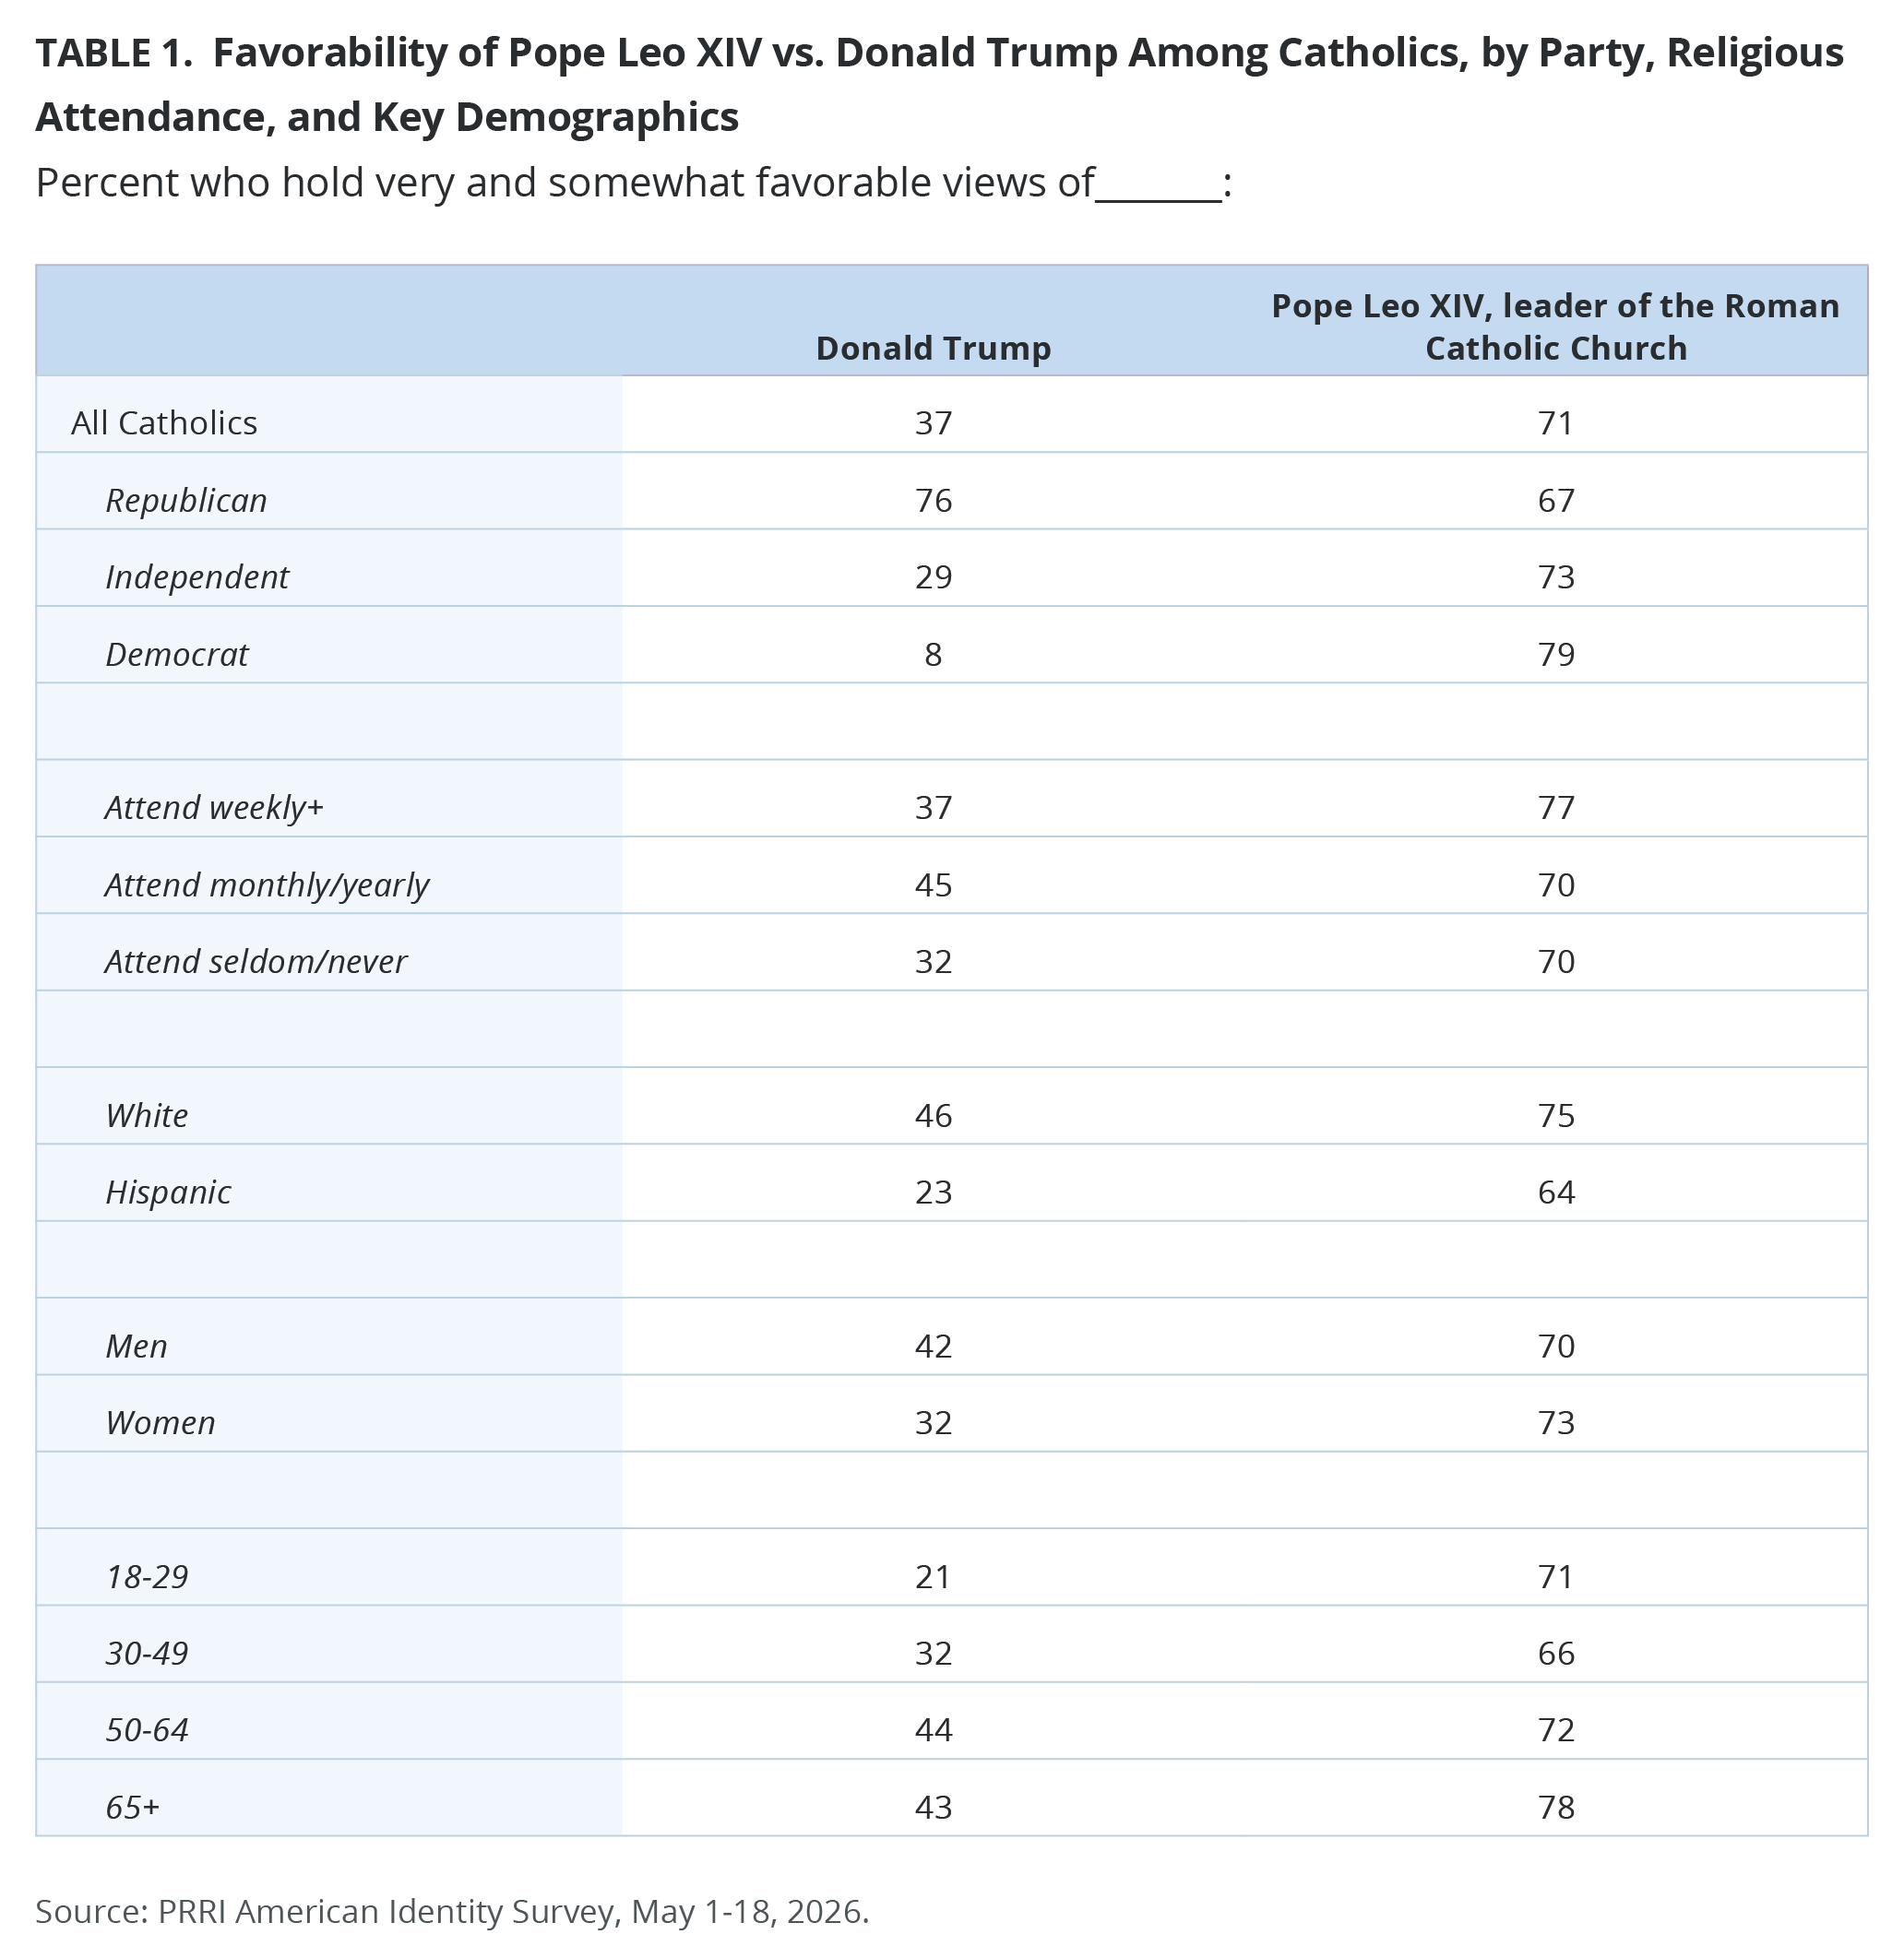
When examining all Catholics by party, Republican Catholics are more likely to hold favorable views of Trump (76%) than Leo (67%), while Catholic independents (73% vs. 29%) and Democrats (79% vs. 8%) are more likely to view the new pope favorably than Trump. Across all other Catholic demographic groups, including by levels of religious attendance, Catholics are substantially more likely to hold favorable views of Leo than Trump.
While Christian nationalism Adherents (73% vs. 37%) and Sympathizers (59% vs. 47%) are significantly more likely to hold favorable views of Trump than of the new pope, the opposite is true among Christian nationalism Skeptics (58% vs. 31%) and Rejecters (70% vs. 7%), who hold more favorable views of Leo than of Trump.
Trump’s Handling of Immigration
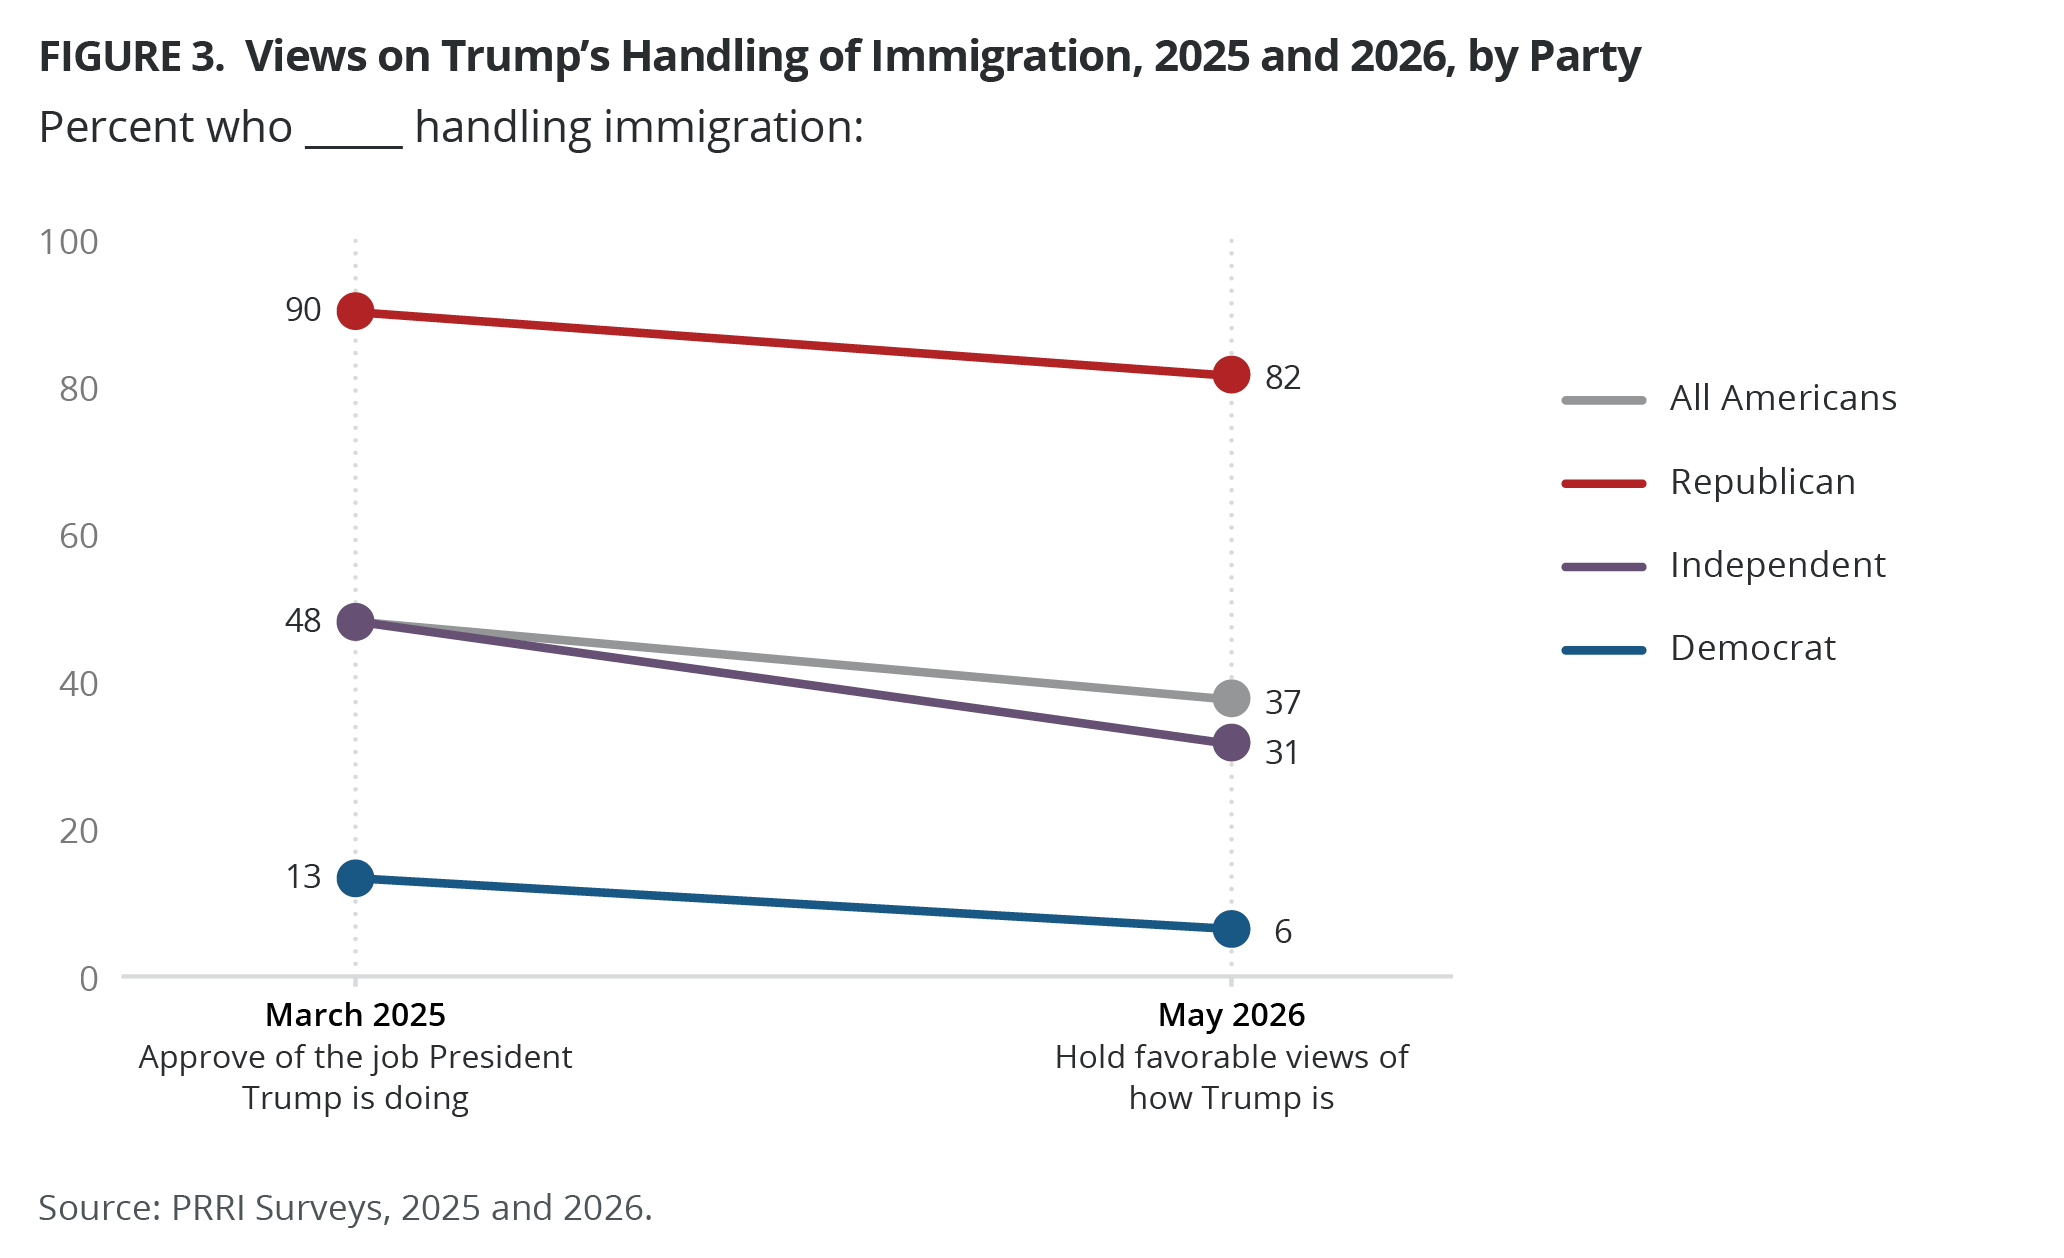
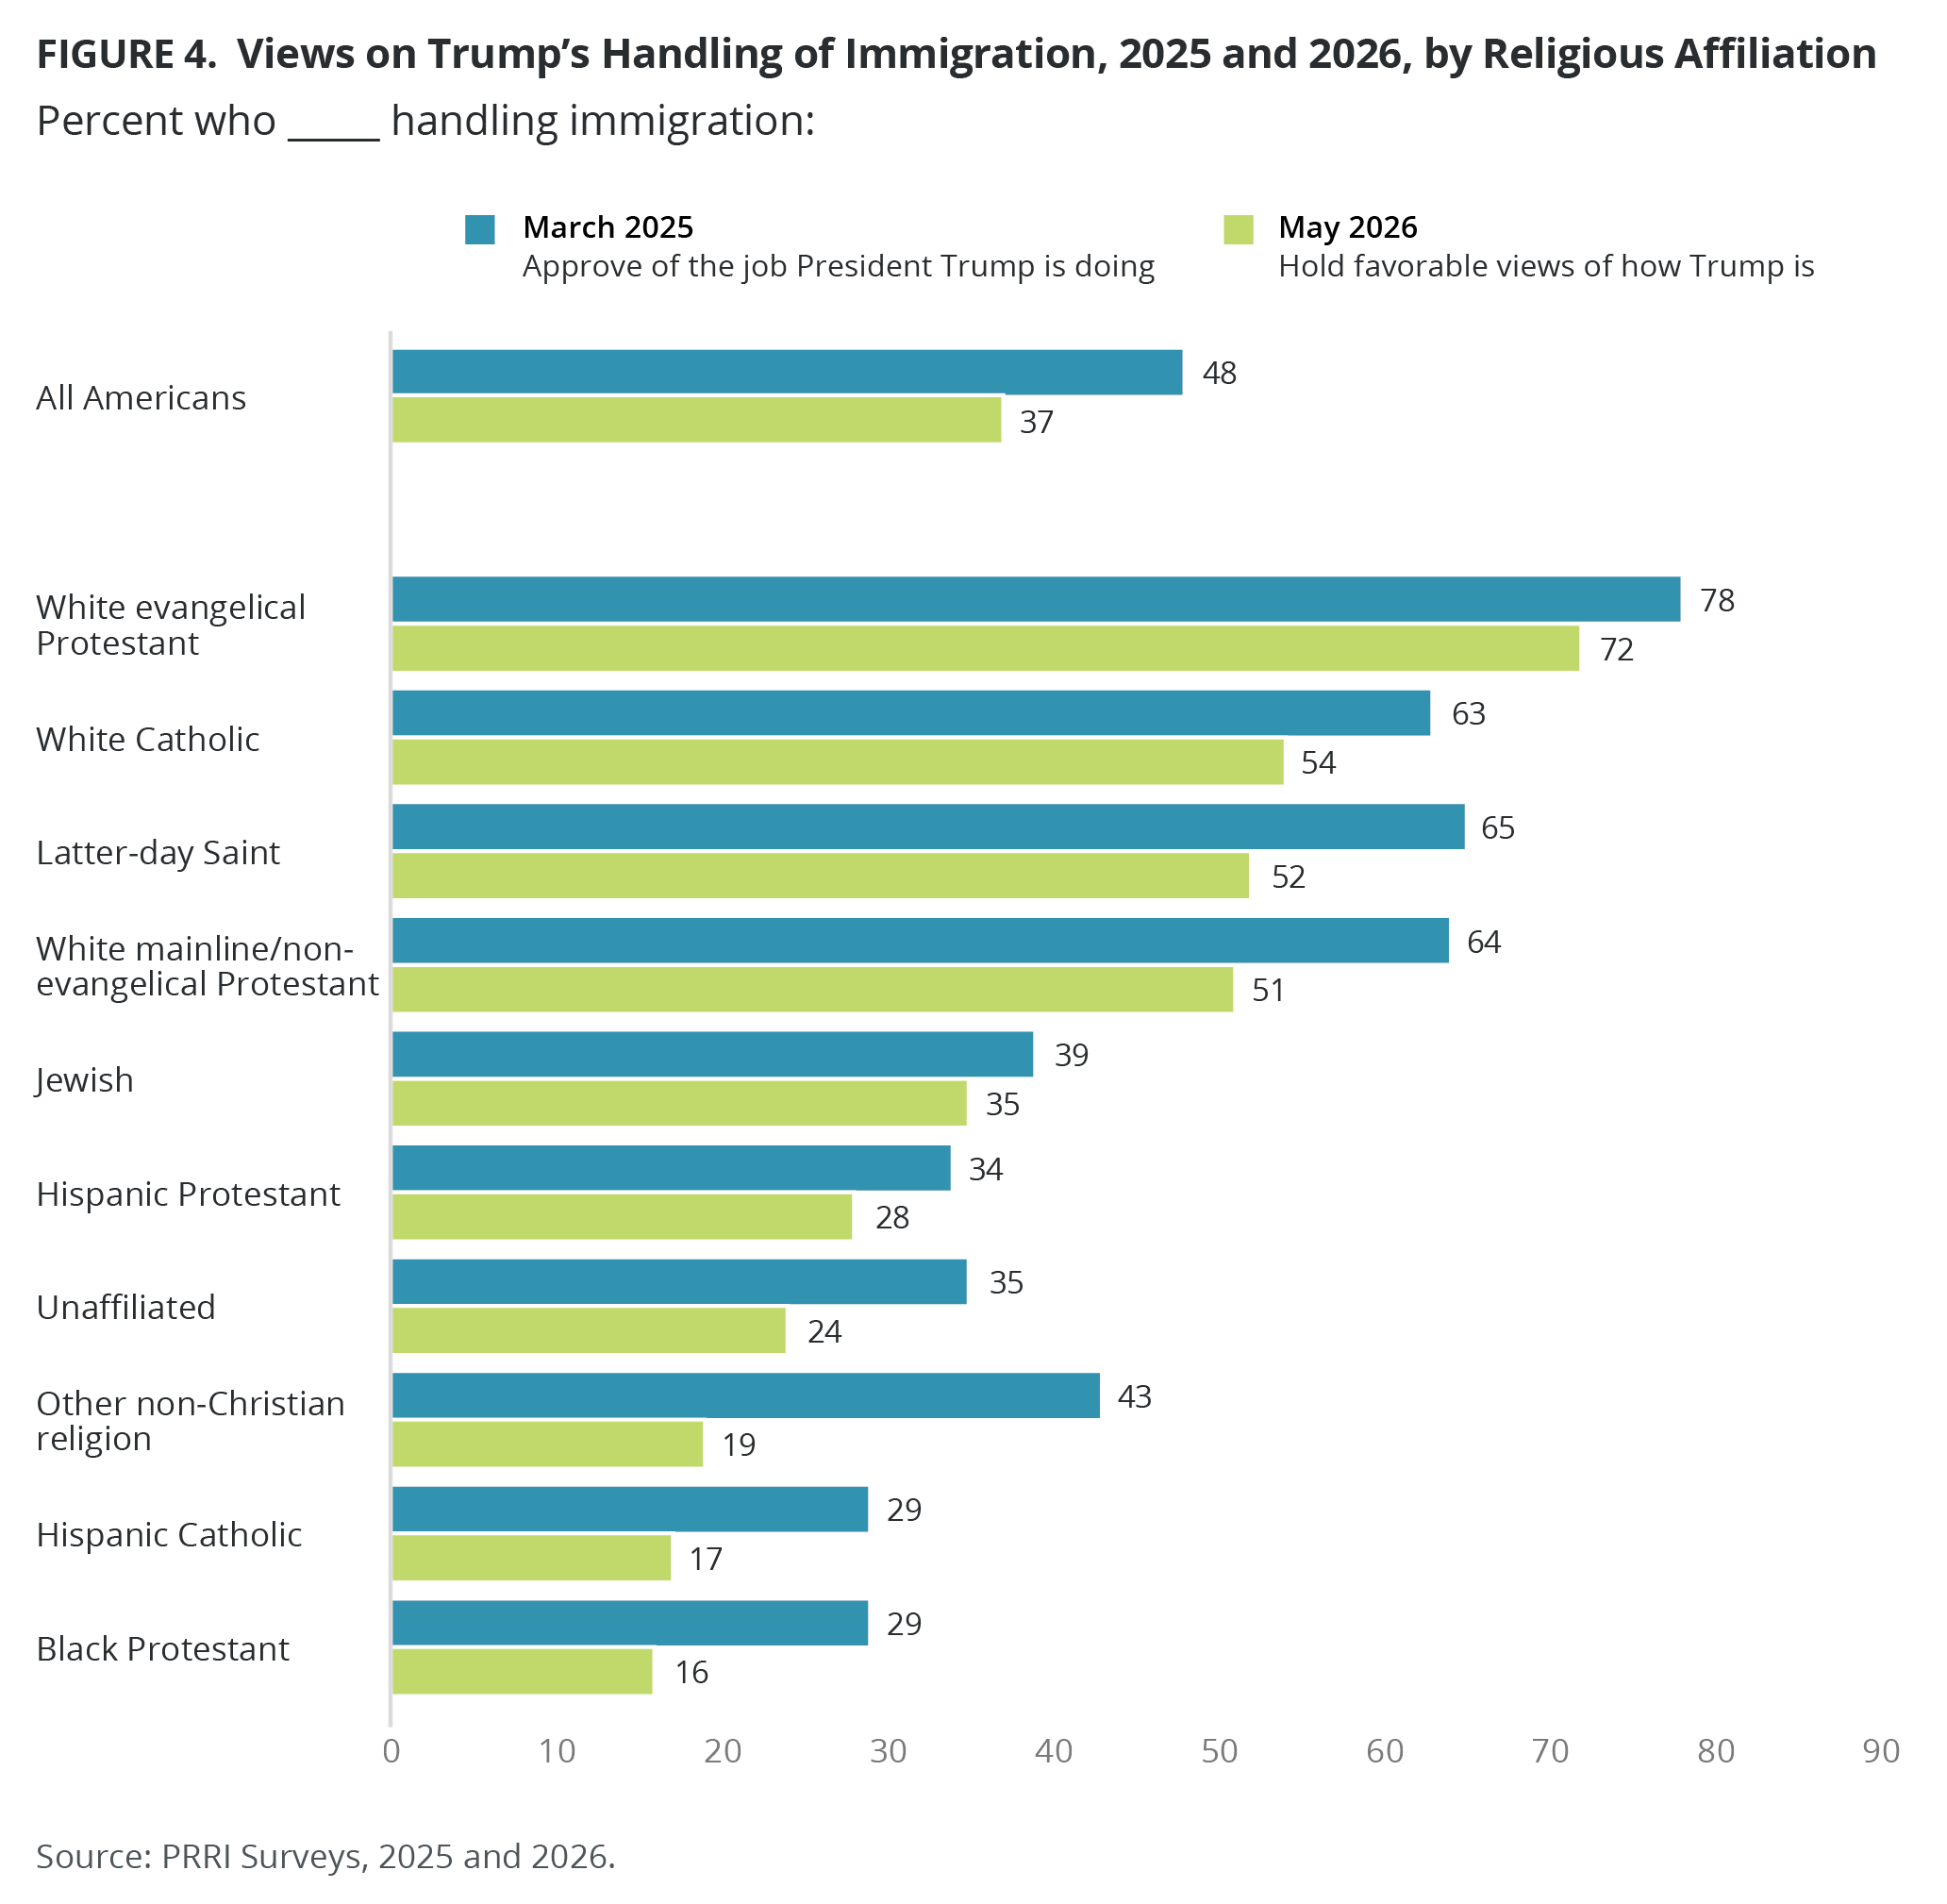
More than one-third of Americans (37%) hold favorable views of how Trump is handling immigration, while 58% hold unfavorable views. These views have changed little since February (35% favorable views, 61% unfavorable views), but continue a downward trend from March 2025, when Americans were evenly divided (48% approved and 49% disapproved). Favorable views of Trump’s handling of immigration have dropped across all partisans since March 2025, with significant declines among Republicans (from 90% to 82%) and Democrats (from 13% to 6%). Notably, favorable views of Trump’s handling of immigration have dropped 17 points among independents, from 48% to 31%.
Across white religious groups, white evangelical Protestants are the most supportive, with 72% expressing favorable views of Trump’s handling of immigration, followed by white Catholics (54%), Latter-day Saints (52%), and white mainline/non-evangelical Protestants (51%). By contrast, only 35% of Jewish Americans, 28% of Hispanic Protestants, 24% of the religiously unaffiliated, 19% of members of other non-Christian religions, 17% of Hispanic Catholics, and 16% of Black Protestants hold favorable views of how Trump is handling immigration. Favorable views of Trump’s handling of immigration have declined across all religious groups since March 2025, with the steepest decline among members of non-Christian religions, from 43% to 19%.
Strong majorities of Christian nationalism Adherents (73%) and Sympathizers (62%) view Trump’s handling of immigration favorably, compared with 34% of Skeptics, and just 10% of Rejecters.[2]
White Americans (49%) are significantly more likely than AAPI (30%), multiracial (23%), Hispanic (19%), and Black (16%) Americans to favor Trump’s handling of immigration, and slightly more likely to do so since February (45%). White Americans without a college education have become particularly more favorable, from 50% to 55%, while those without a college education have remained stable (39% vs. 40%).
Older Americans are more likely than younger Americans to hold favorable views of Trump’s handling of immigration, as are non-college graduates and men, compared with college graduates and women.
Trump’s Handling of the War in Iran
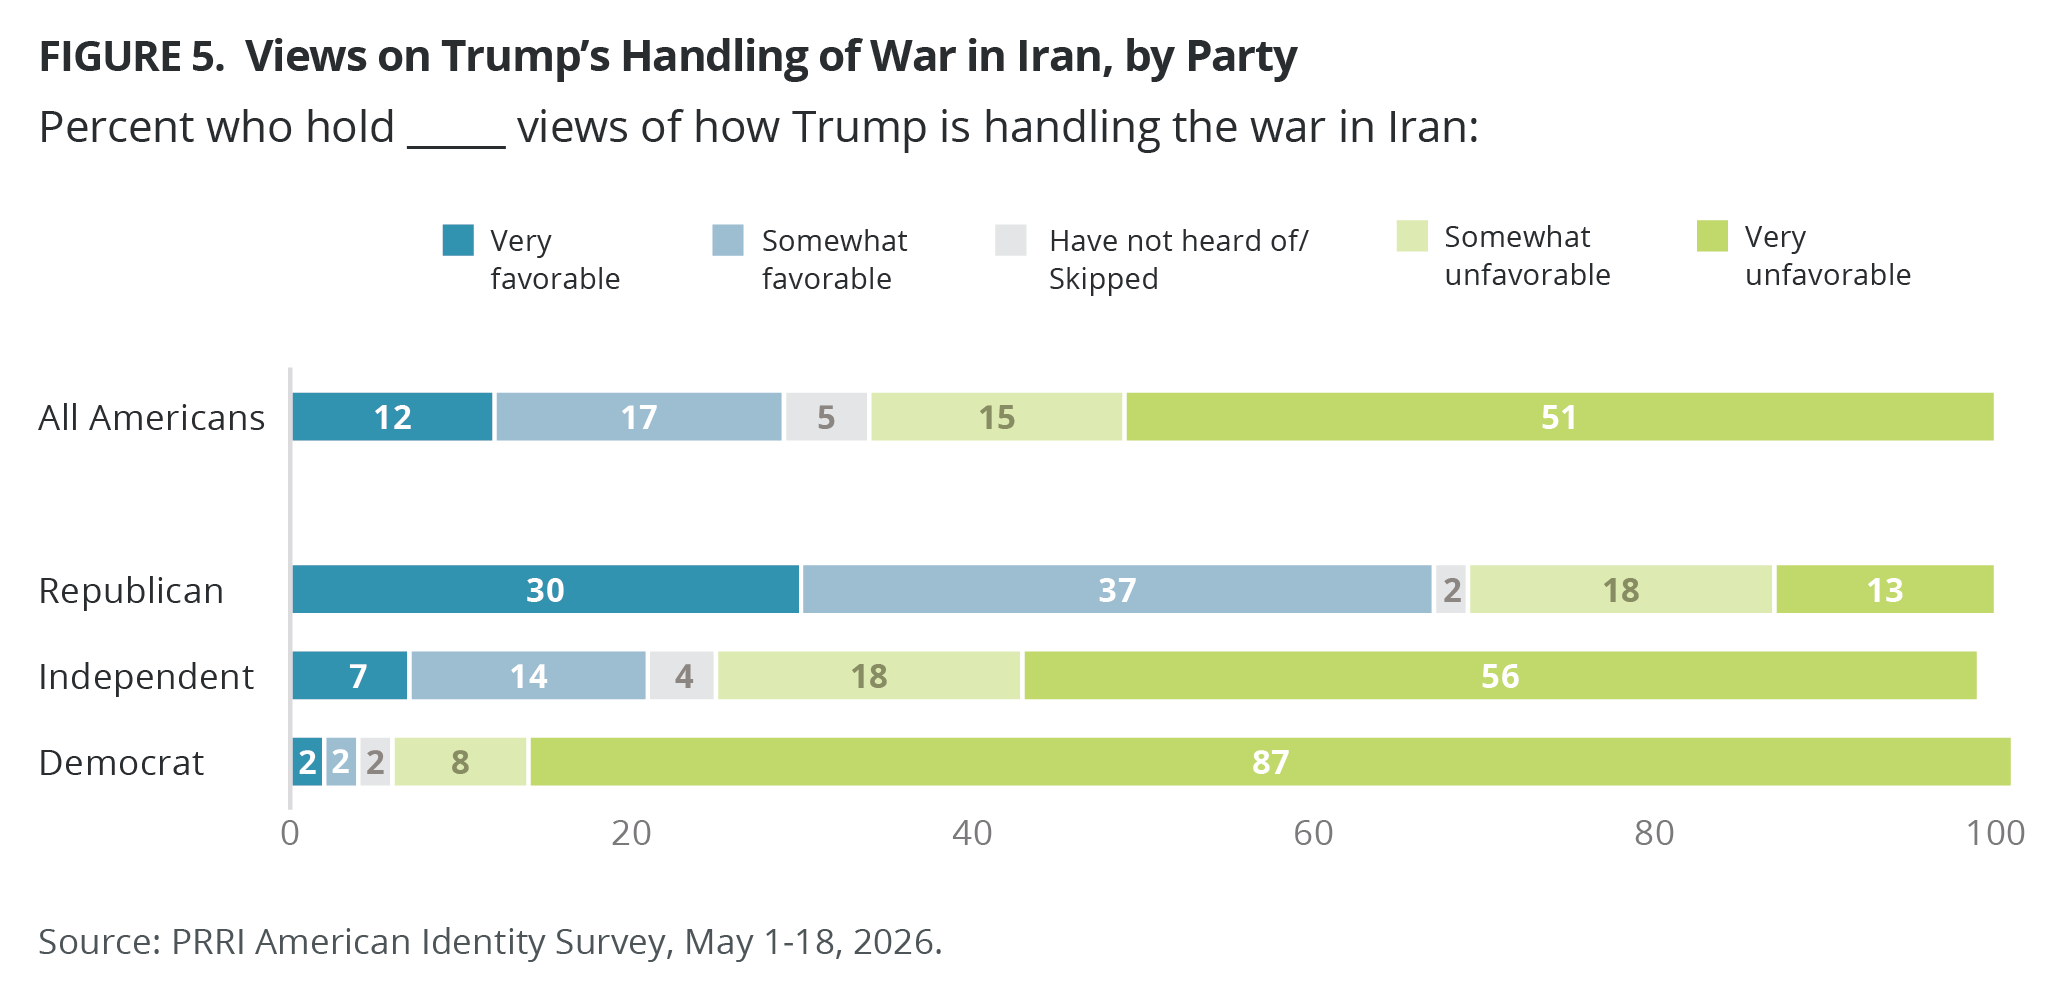
Americans largely disagree with how Trump is handling the war in Iran. Two-thirds hold unfavorable views (66%), compared with 29% of Americans who hold favorable views. Republicans are the most supportive, with 67% expressing favorable views, compared with 21% of independents and just 4% of Democrats.
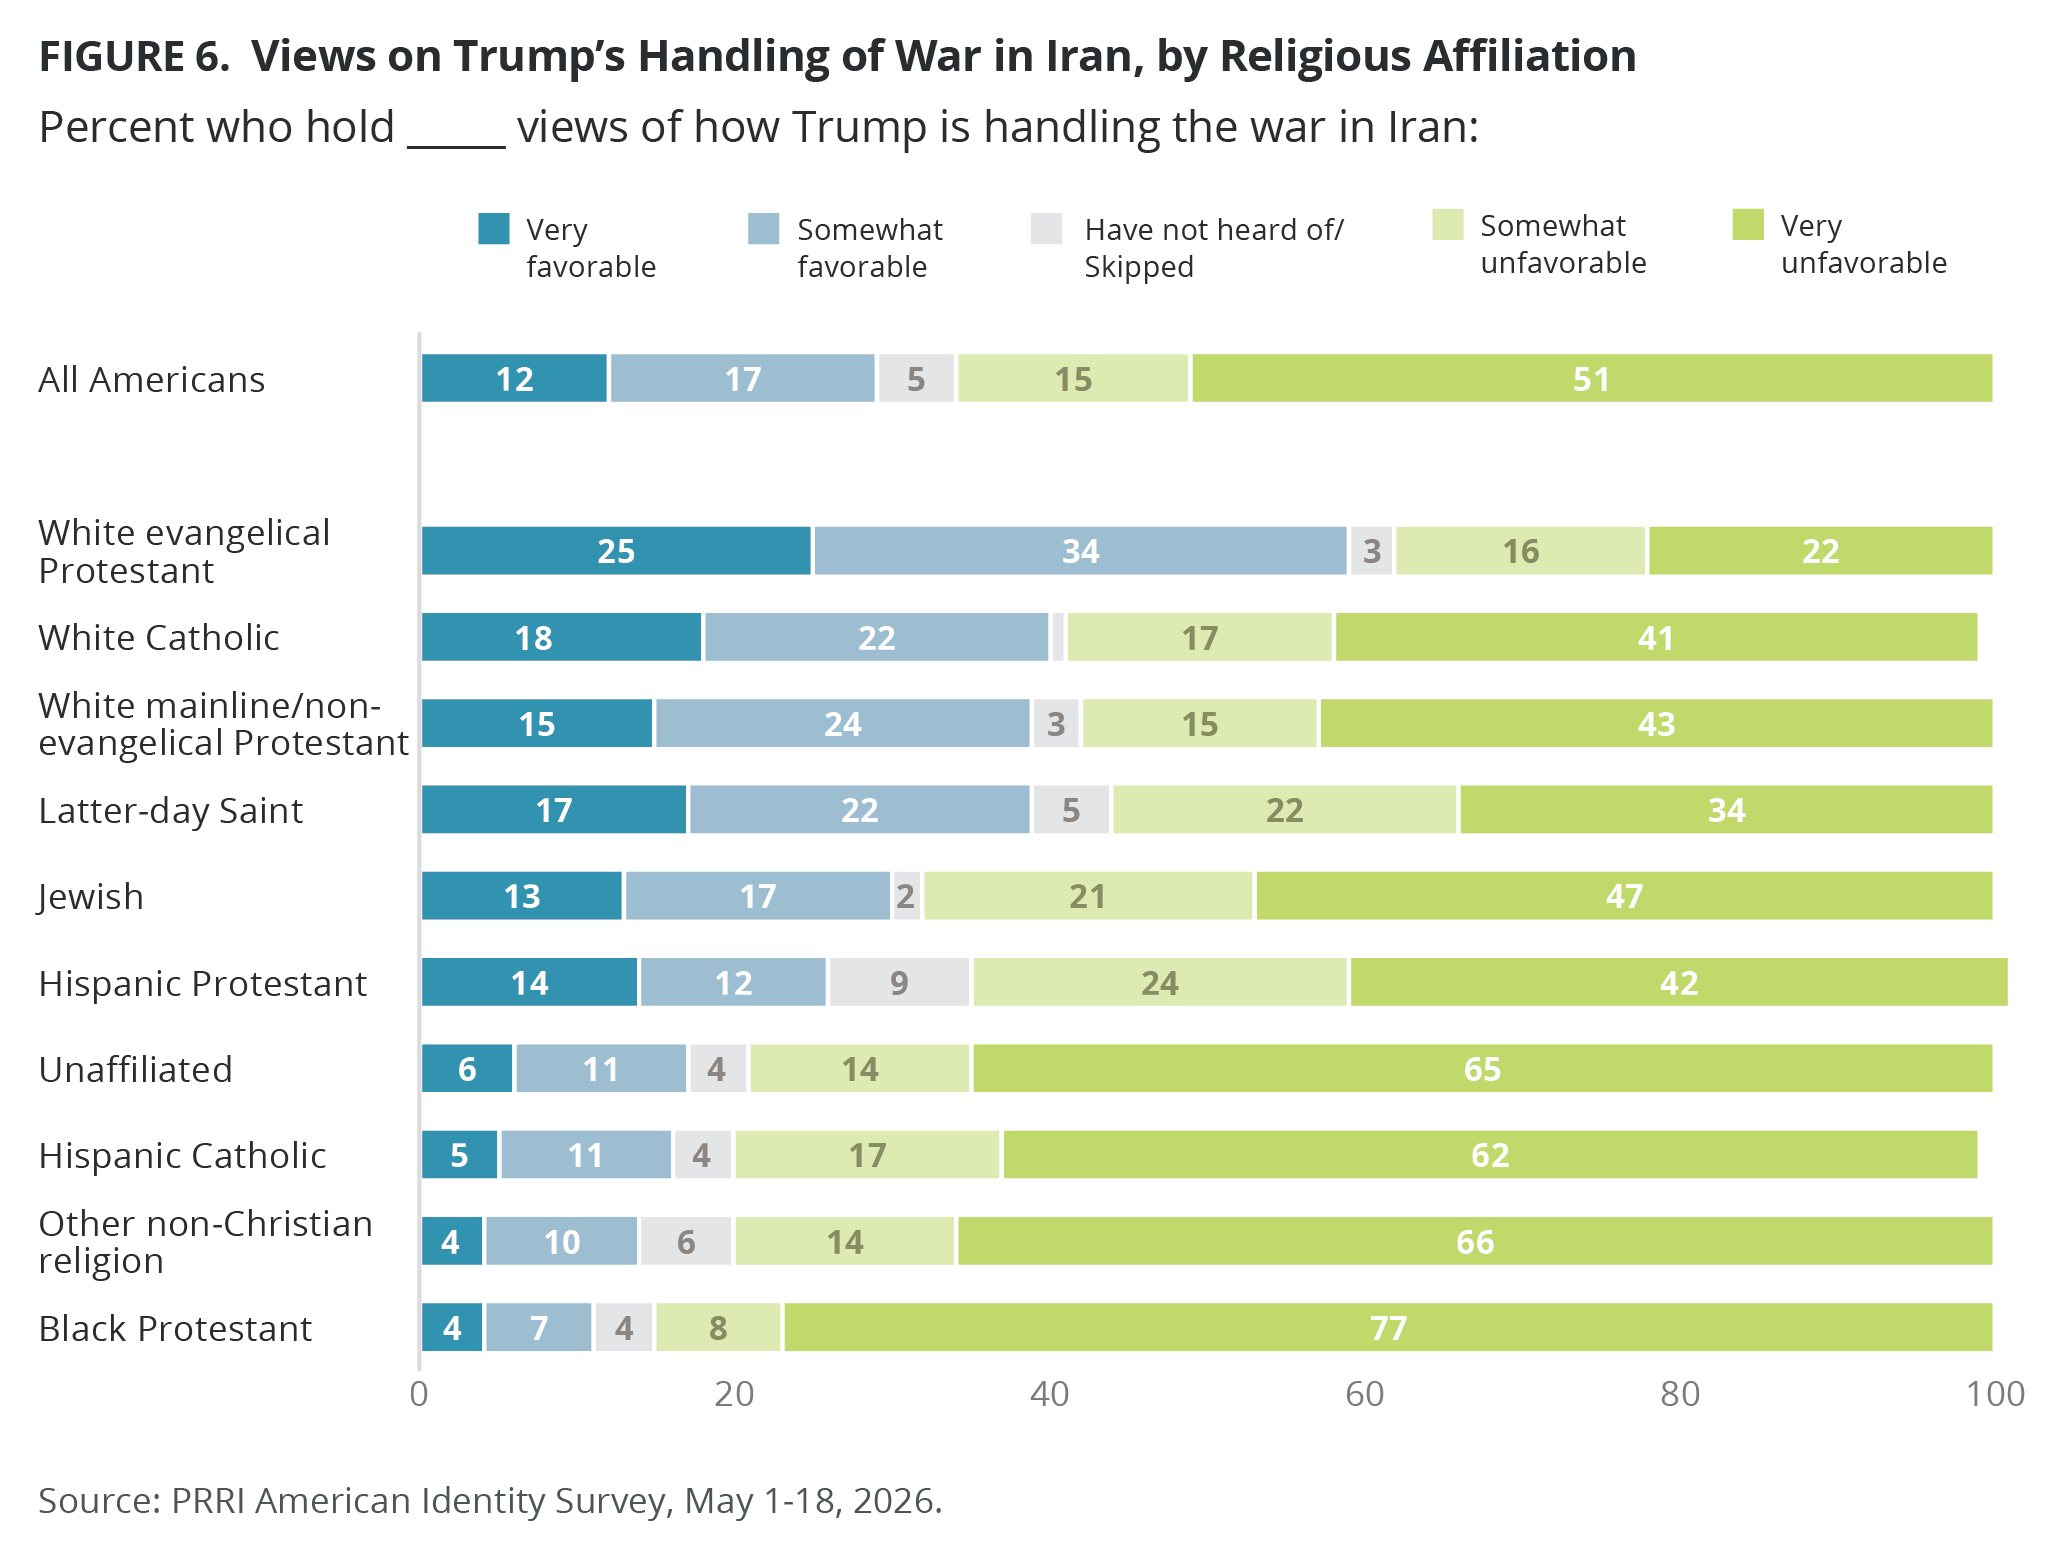
White evangelical Protestants (59%) are the only religious group where a majority holds favorable views of Trump’s handling of the war in Iran. Just four in ten or fewer members of all other religious groups hold favorable views, including white Catholics (40%), white mainline/ non-evangelical Protestants (39%), Latter-day Saints (39%), Jewish Americans (30%), and Hispanic Protestants (26%). Religiously unaffiliated Americans (17%), Hispanic Catholics (16%), other non-Christians (14%), and Black Protestants (11%) are the least likely to hold favorable views.
Most Christian nationalism Adherents (60%) hold favorable views of Trump’s handling of the war in Iran, compared with 51% of Sympathizers, 24% of Skeptics, and just 5% of Rejecters.
Few Americans across all demographic groups hold favorable views of Trump’s handling of the war in Iran, including 37% of white Americans and under two in ten multiracial (18%), Hispanic (17%), AAPI (17%), and Black (12%) Americans. Men (33%) are more likely than women (26%) to hold favorable views, as are Americans over 50 (37%) than Americans under 50 (21%). While there are little differences by education, white Americans without a college degree are more likely than those with a college degree to share these views (42% vs. 30%).
Trump Is a Strong Leader or a Dangerous Dictator?
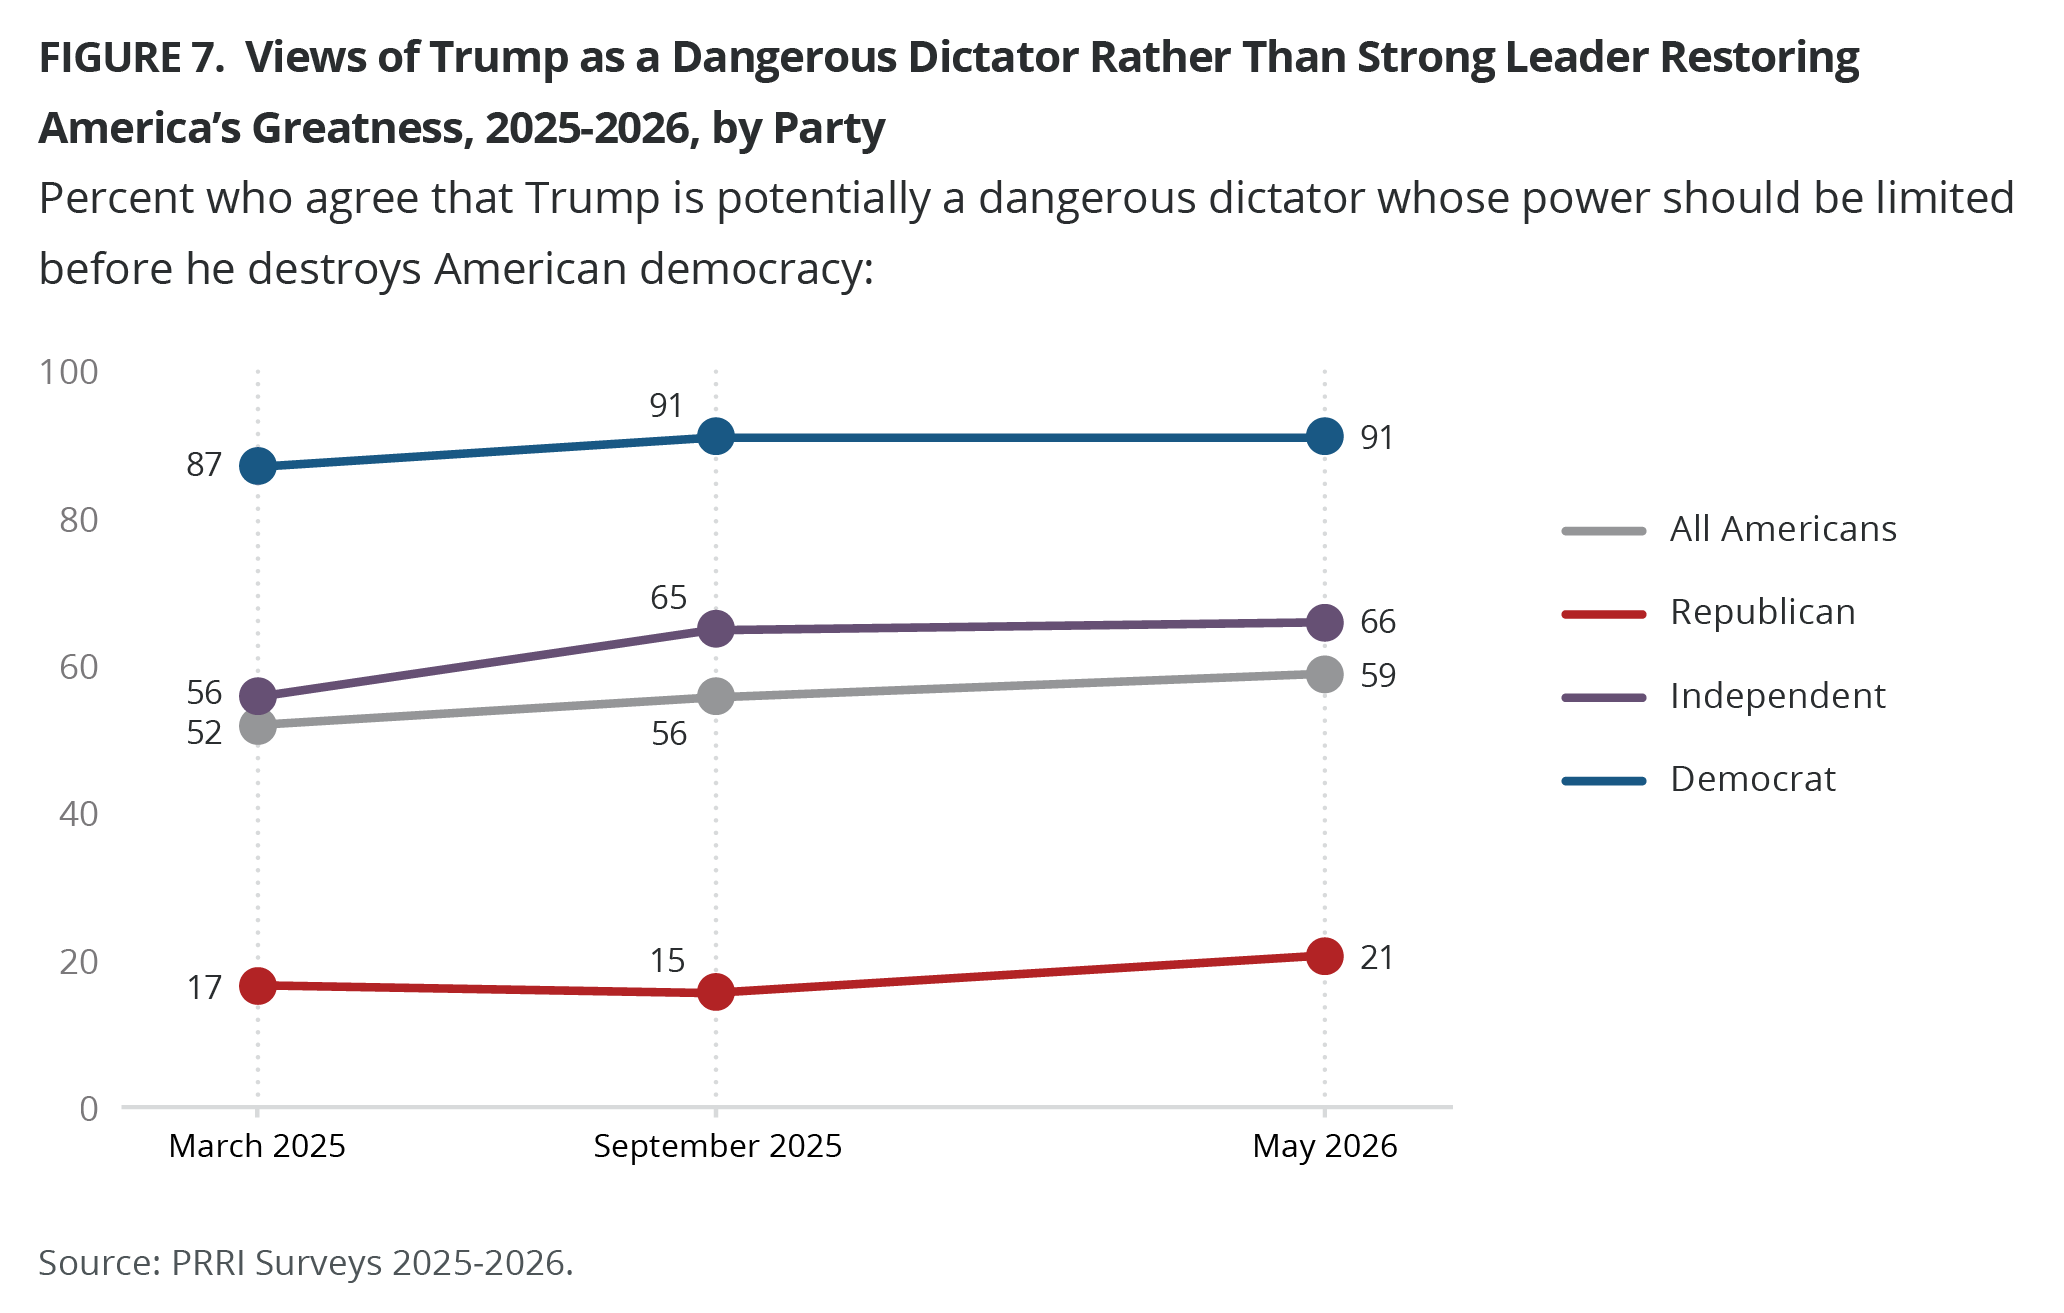
A majority of Americans are more likely to agree with the statement “President Trump is a potentially dangerous dictator whose power should be limited before he destroys American democracy” (59%) than with the statement “President Trump is a strong leader who should be given the power he needs to restore America’s greatness” (38%). The percentage of Americans who see Trump as a potentially dangerous dictator continues to grow, from 52% in March 2025 to 56% in September 2025 to 59% today. Nine in ten Democrats (91%, up from 87% in March 2025) agree with the first statement, while nearly eight in ten Republicans agree with the second statement (78%, down from 81% in March 2025). Two-thirds of independents (66%) now agree that Trump is a potentially dangerous dictator, up 10 percentage points from 56% in March 2025.
White evangelical Protestants (68%, down from 73% in March 2025) and Latter-day Saints (56%) are the most likely religious groups to view Trump as a strong leader who should be given the power to restore America’s greatness. By contrast, white Catholics and white mainline/non-evangelical Protestants are now evenly divided between viewing Trump as a strong leader and as a potentially dangerous dictator, with both white Catholics (from 42% to 49%) and mainline/non-evangelical Protestants (from 44% to 50%) becoming more likely to view Trump as a potentially dangerous dictator since March 2025. Majorities of Black Protestants (80%), unaffiliated Americans (75%), other non-Christians (75%), Hispanic Catholics (80%), Hispanic Protestants (58%), and Jewish Americans (56%) view Trump as a potentially dangerous dictator whose power should be limited. Since March 2025, Black Protestants, unaffiliated Americans, and other non-Christians have become more likely to share this view.
Most Christian nationalism Rejecters (89%) and Skeptics (65%) agree that Trump is a potentially dangerous dictator, compared with just 35% of Sympathizers and 27% of Adherents. By contrast, most Adherents (71%) and Sympathizers (64%) view Trump as a strong leader who should be given the power to restore America’s greatness, compared with 34% of Skeptics and just 9% of Rejecters. Except for Christian nationalism Adherents, all other groups have grown more likely to view Trump as a potentially dangerous dictator since March 2025.
How Do Americans View the Term Christian Nationalism?
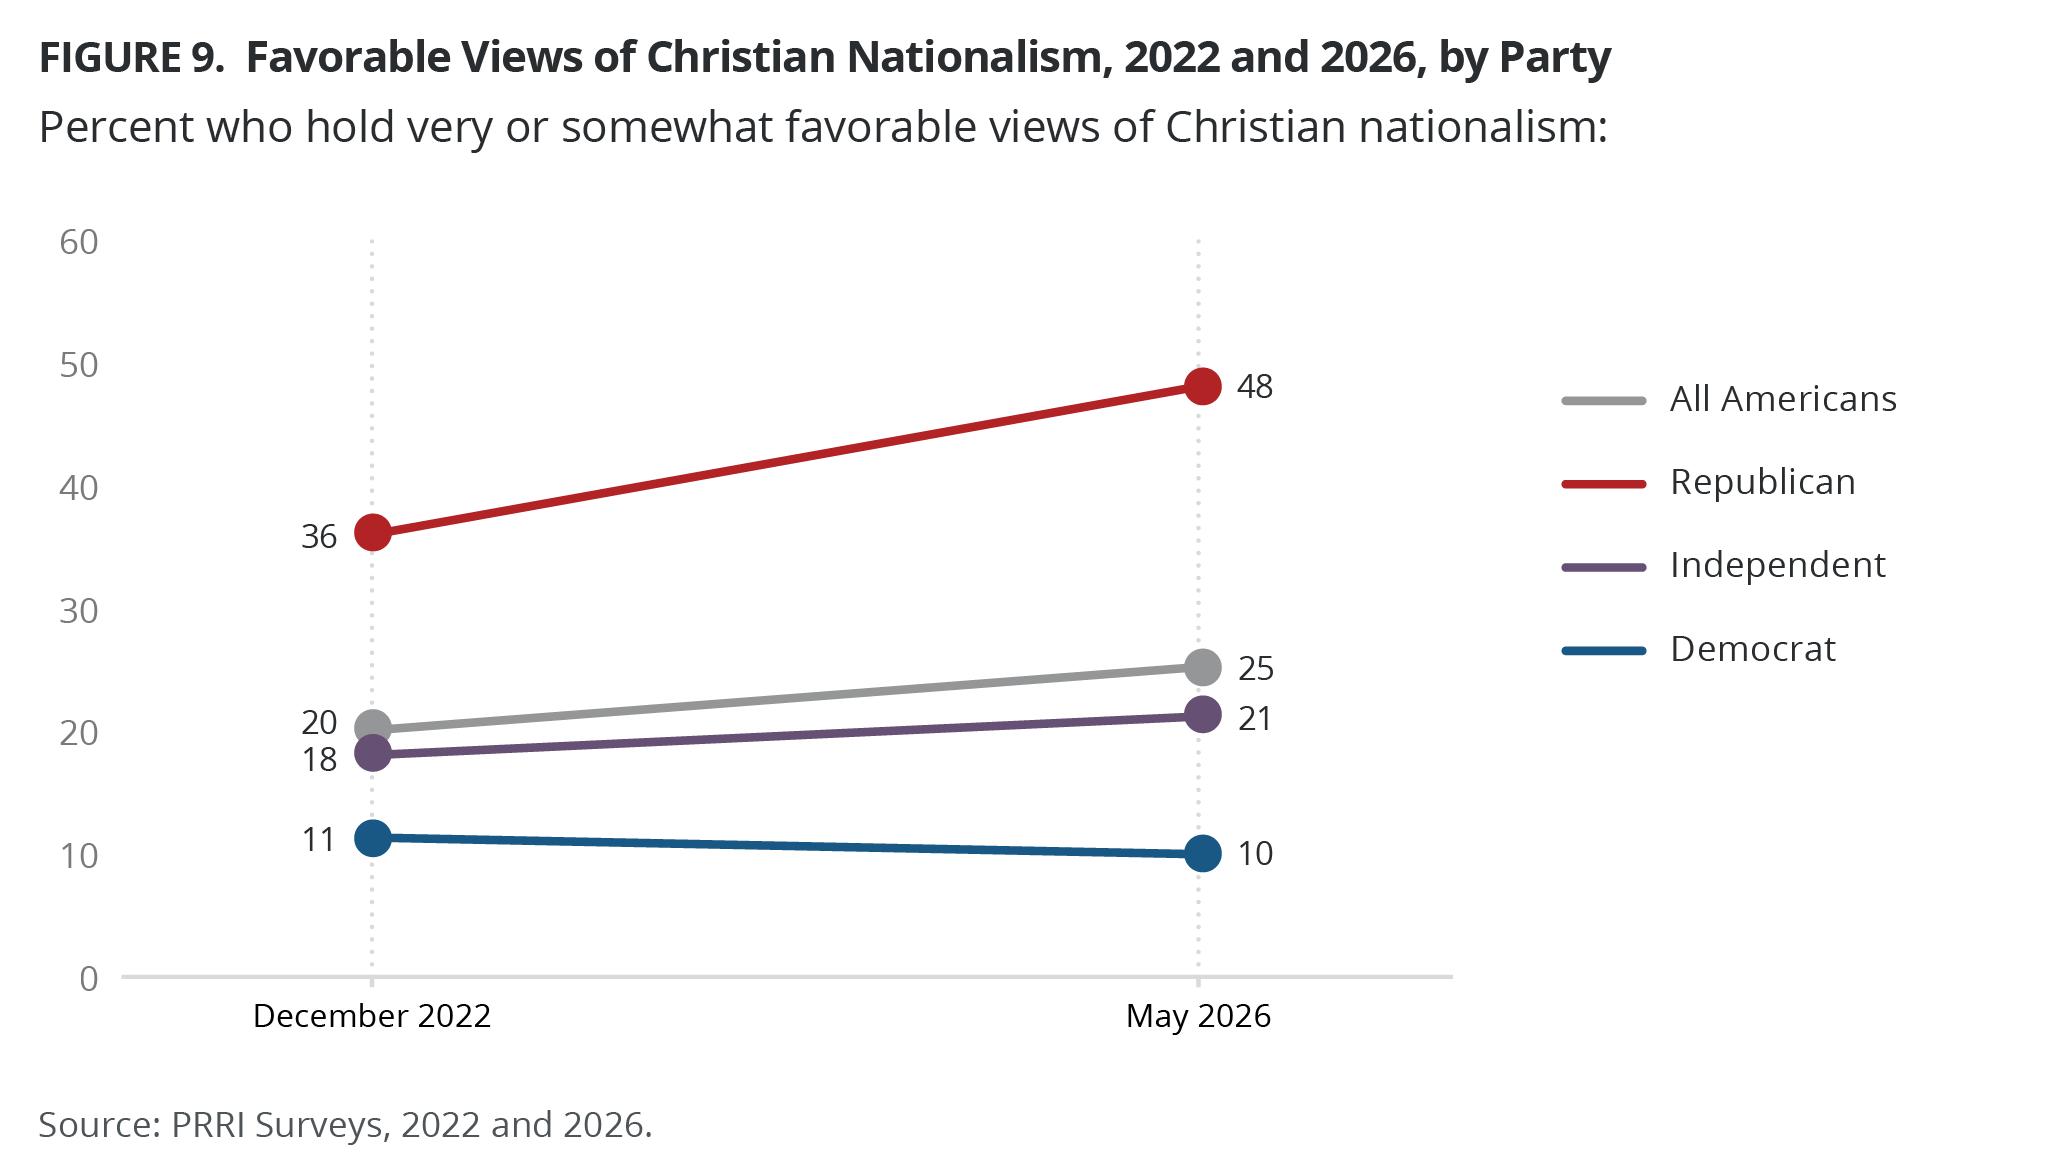
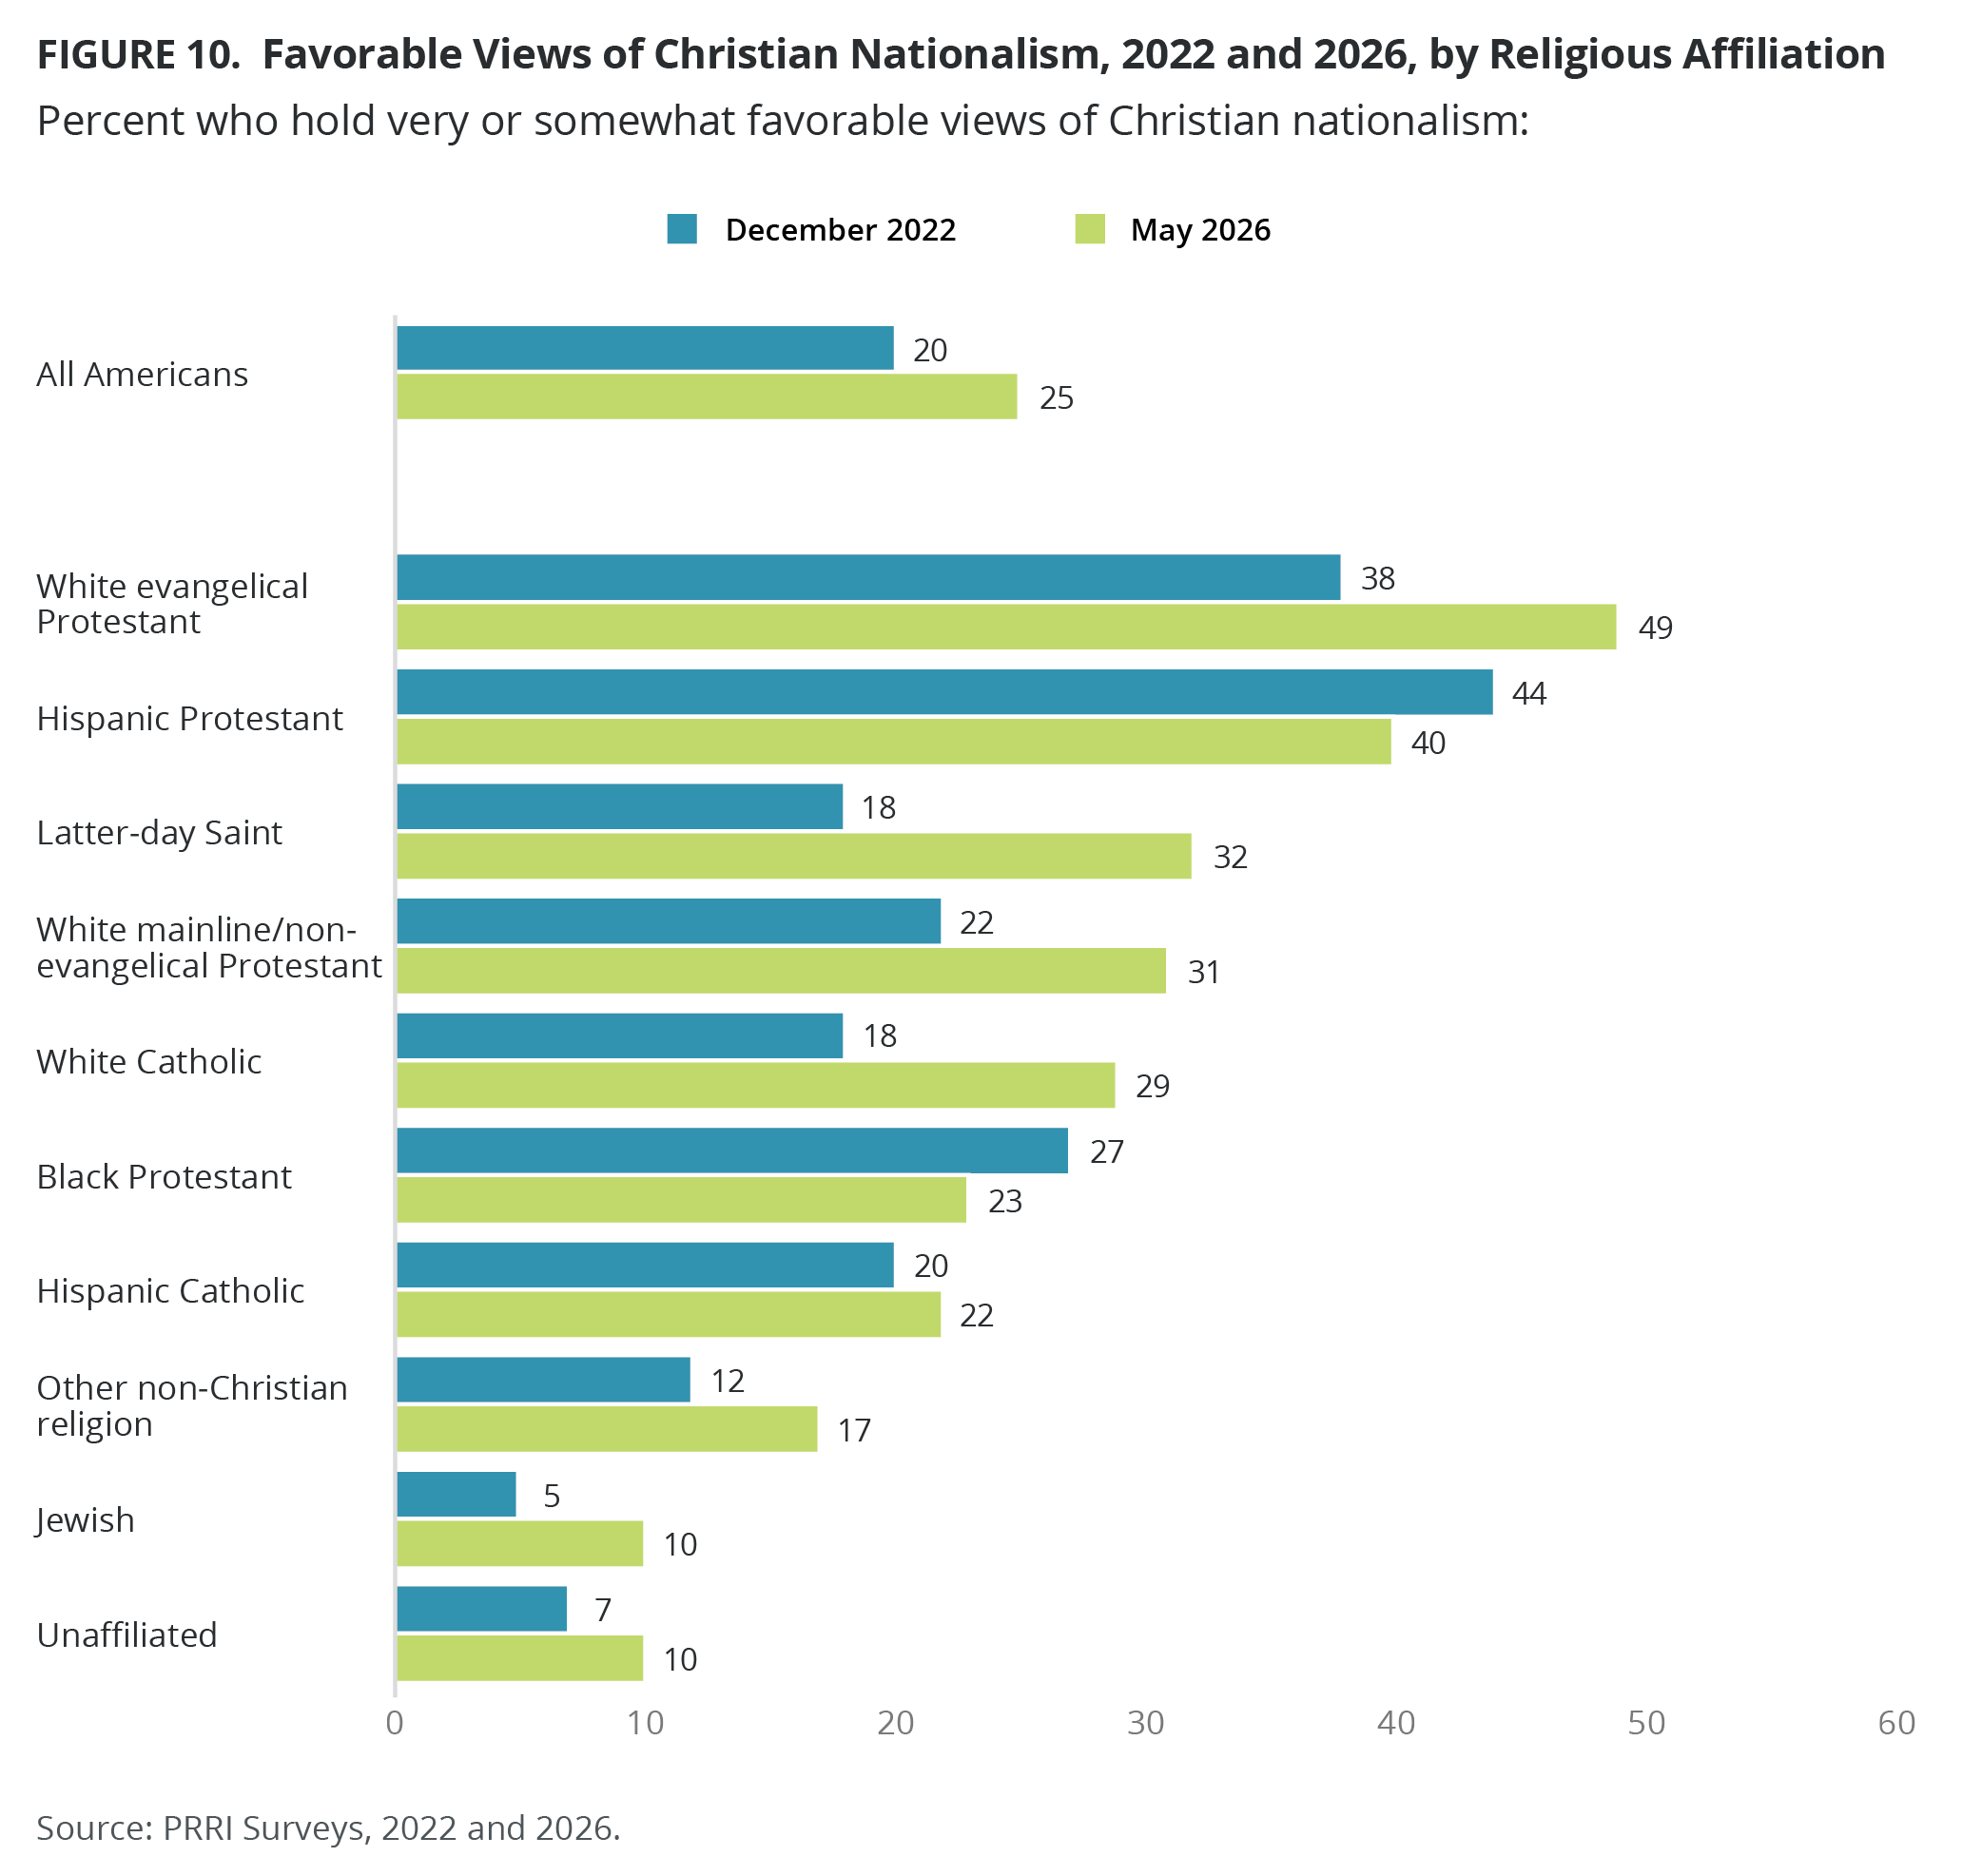
Just 25% of Americans hold favorable views of the term Christian nationalism, compared with 45% who hold unfavorable views. More than one in four Americans (27%) have not heard of this term. While views have remained largely unchanged since February, favorable views of Christian nationalism have increased since 2022 from 20%, largely due to increased embracing of the term by Republicans and white evangelical Protestants. At the same time, the share of Americans who say they have not heard of the term has dropped, from 35% to 27%.
Nearly half of Republicans (48%) view Christian nationalism favorably, compared with 21% of independents and only 10% of Democrats. While support among independents and Democrats has remained relatively stable since 2022, Republicans are increasingly embracing the term, with favorable views rising 12 points, from 36% to 48%.
Half of white evangelical Protestants (49%) hold favorable views of the term Christian nationalism, followed by 40% of Hispanic Protestants. Christian nationalism favorability declines among Latter-day Saints (32%), white mainline/non-evangelical Protestants (31%), white Catholics (29%), Black Protestants (23%), and Hispanic Catholics (22%), and is much lower among members of other non-Christian religions (17%), Jewish Americans (10%), and religiously unaffiliated Americans (10%). White evangelical Protestants are significantly more likely to hold favorable views of Christian nationalism today than they did in 2022 (38%).
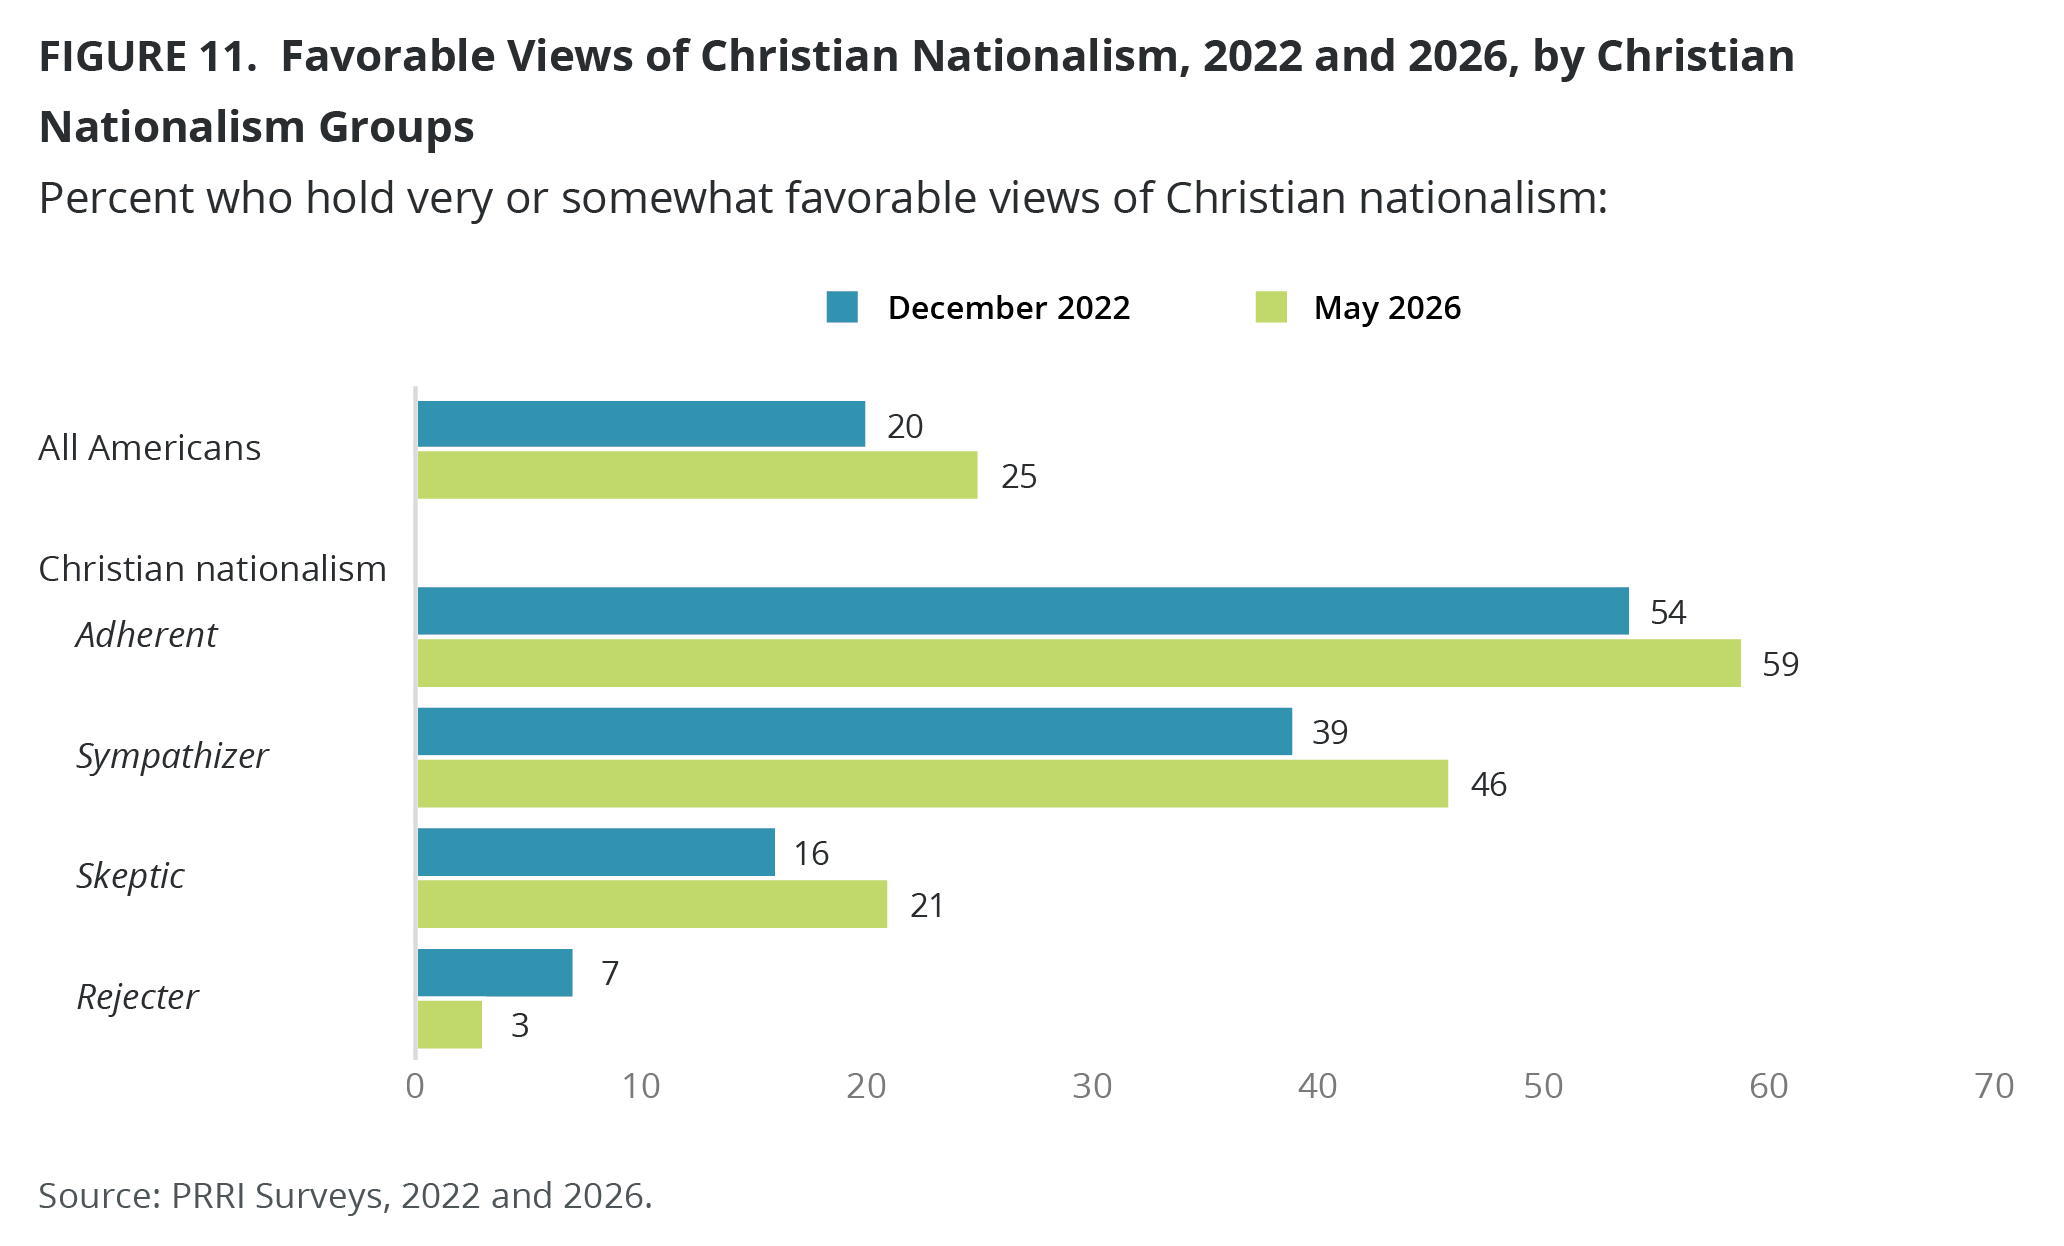
Nearly six in ten Christian nationalism Adherents (59%), as well as nearly half of Sympathizers (46%), hold favorable views of the term Christian nationalism. By contrast, Christian nationalism Skeptics (21%) and Rejecters (3%) are far less likely to do so.
Democracy and U.S. National Identity
American Pride
Pride in Being an American
Americans are evenly split in their national pride. Half say they are extremely or very proud of being an American (51%), while half say they are either moderately (23%), a little (14%), or not at all proud (11%). American pride has declined sharply since 2013, when 82% said they were extremely or very proud. Most Republicans (83%) are proud of being an American, compared with 43% of independents and 31% of Democrats.
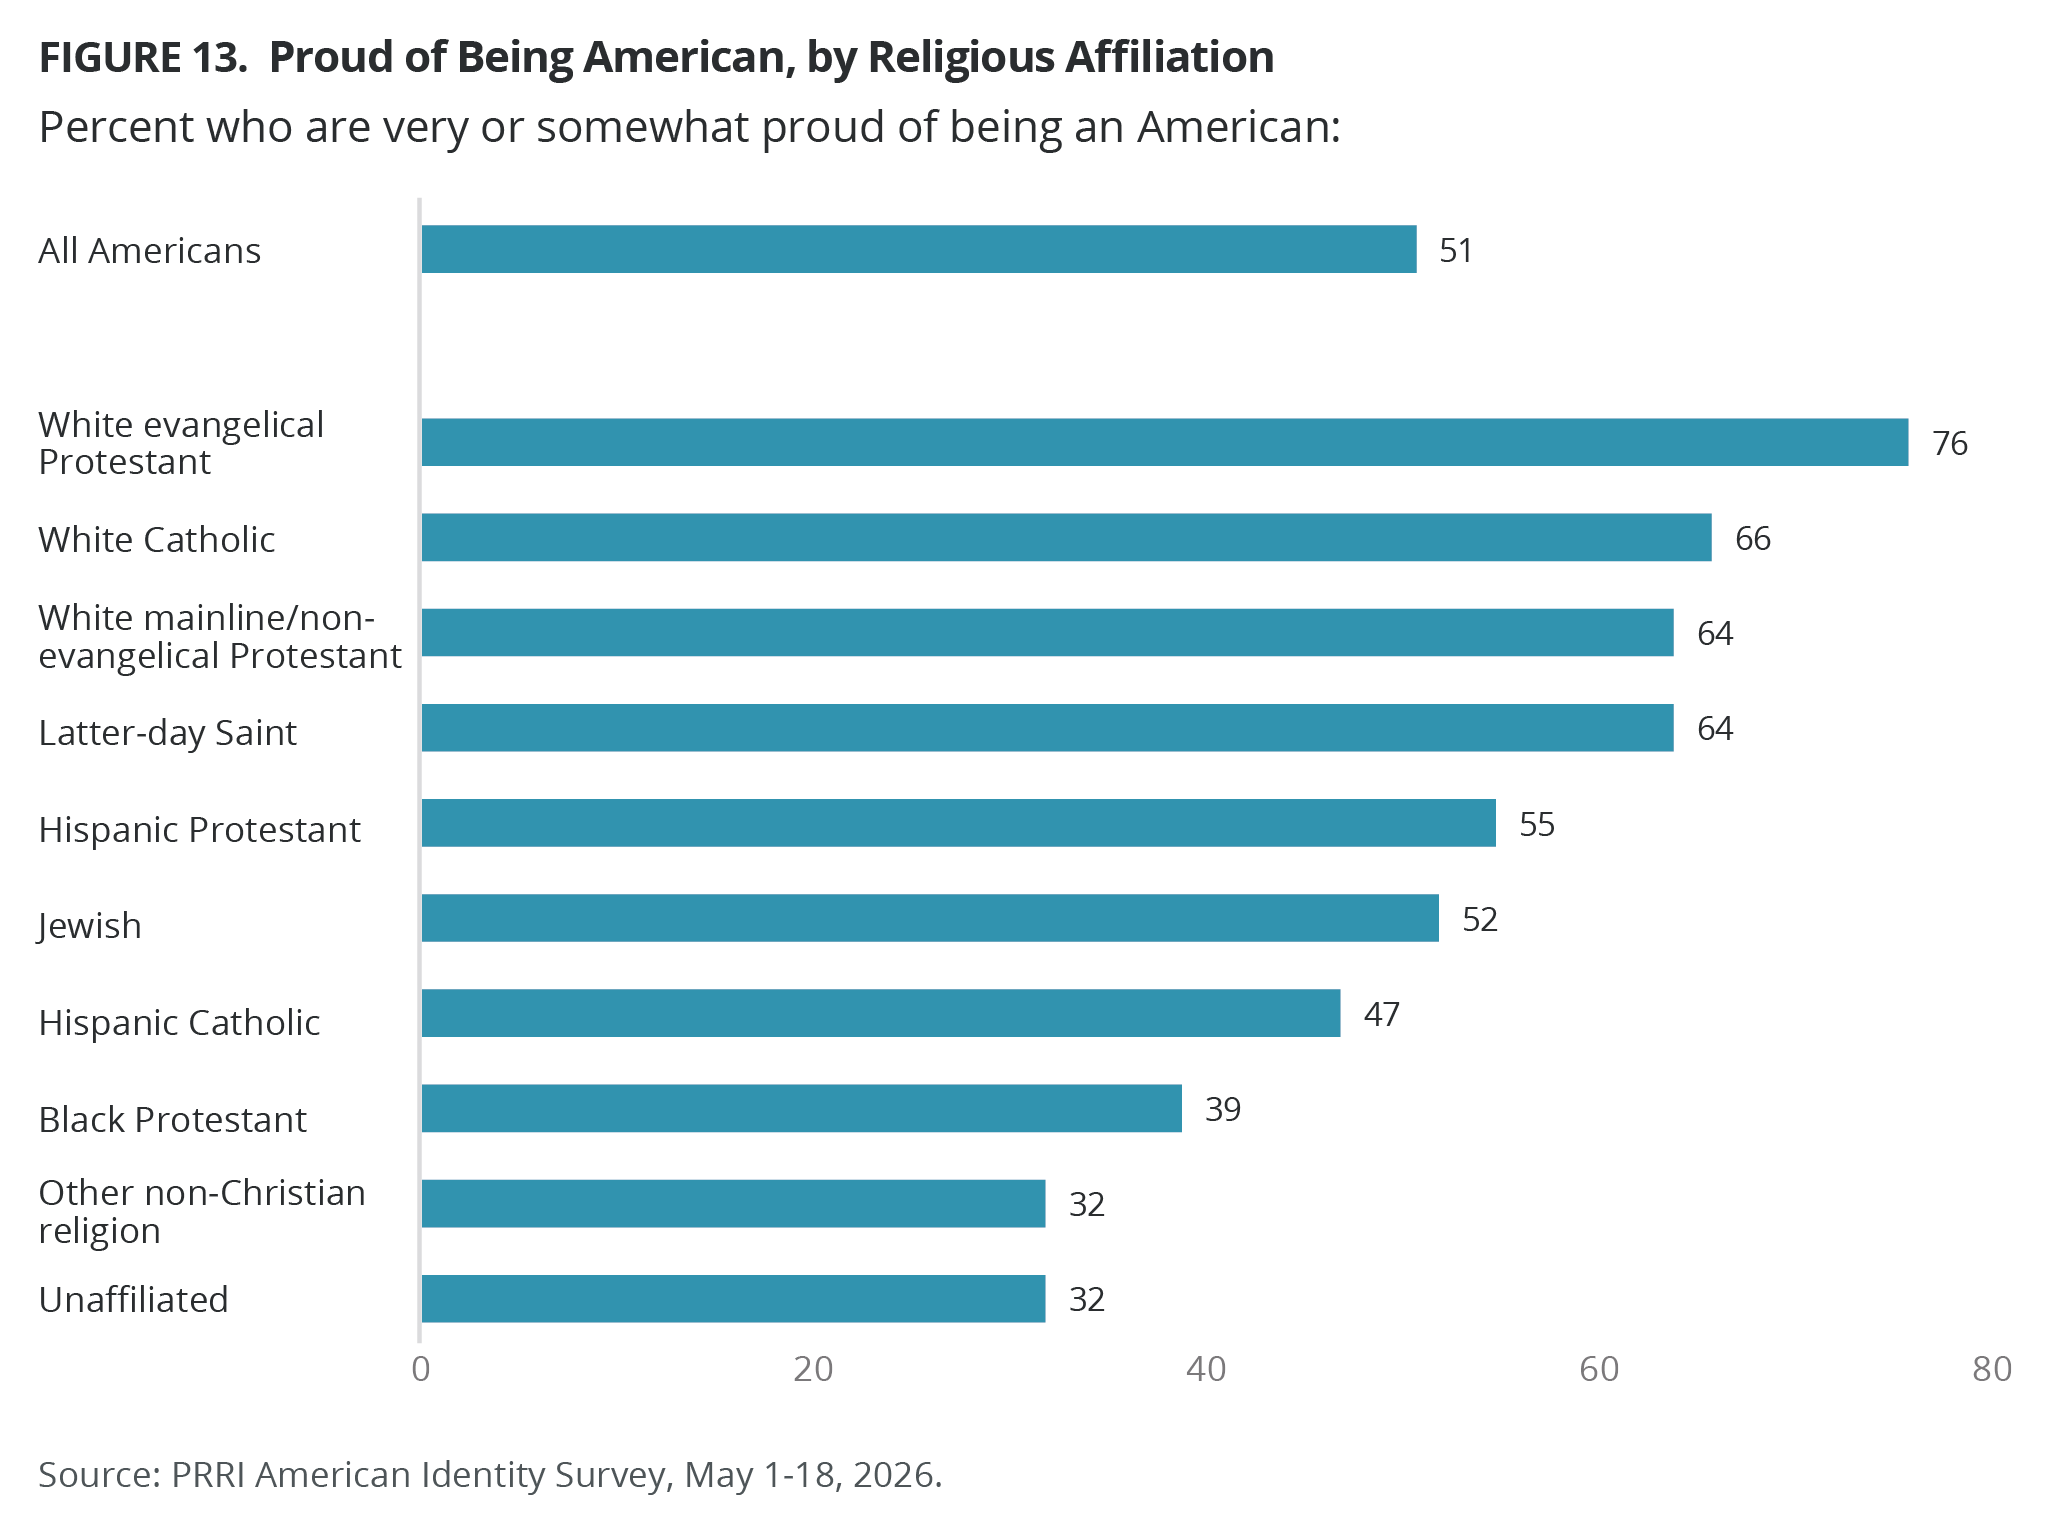
Solid majorities of white Christian groups and Hispanic Protestants say they are proud of being an American, including 76% of white evangelical Protestants, 66% of white Catholics, and 64% of both white mainline/non-evangelical Protestants and Latter-day Saints. By contrast, a slim majority of Hispanic Protestants (55%) and Jewish Americans (52%), 47% of Hispanic Catholics, 39% of Black Protestants, and 32% of both other non-Christians and religiously unaffiliated Americans say they are proud of being an American.
Most Americans who qualify as Christian nationalism Adherents (83%) and Sympathizers (71%), as well as nearly half of Skeptics (49%), say they are proud of being an American, compared with 23% of Rejecters.
Most white Americans (57%) say they are extremely or very proud of being an American, followed by around four in ten Hispanic (42%), multiracial (42%), and AAPI (41%) Americans, as well as around one-third of Black Americans (35%, down from 43% since September 2025). White Americans without a college education are more likely than those with a college education to be proud of being an American (64% vs. 48%).
The majority of Americans ages 65 and older (66%) and ages 50-64 (59%), as well as men (54%) and Americans without a four-year college degree (54%), say they are proud of being an American, compared with 46% of women, 45% of Americans with a college degree, and 43% of Americans ages 30-49. Young Americans ages 18-29 are the least likely to be proud of being an American (34%).
Pride in America’s 250-Year History
Americans are evenly split in their pride of America’s 250-year history, which we will celebrate on July 4, 2026. Half say they are extremely or very proud (49%), compared with half who are either moderately (22%), a little (15%), or not at all proud (12%). In 1976, America’s bicentennial, the American National Election Studies (ANES) asked how proud Americans felt about the country’s 200-year history.[3] While the response options differed slightly from our current question, roughly half of Americans (48%) said they were very proud of the nation’s 200-year history in 1976.
Since 1976, Republicans have grown more likely to say they are proud, increasing from 61% to 82% today. By contrast, Democrats are less proud of the nation’s 250-year history today (28%) than they were in 1976 (46%). Independents have remained relatively stable (43% in 1976 vs. 44% in 2026).
Majorities of white Christian groups and Hispanic Protestants say they are very proud of America’s 250-year history, including 76% of white evangelical Protestants, 68% of white Catholics, 63% of Latter-day Saints, 62% of white mainline/non-evangelical Protestants, and 53% of Hispanic Protestants. Less than half of Jewish Americans (47%) and Hispanic Catholics (45%) say they are proud of America’s 250-year history, as do three in ten members of other non-Christian religions (31%) and religiously unaffiliated Americans (31%), and one-quarter of Black Protestants (24%).
Most Americans who qualify as Christian nationalism Adherents (79%) and Sympathizers (70%, up from 64% in 2025), as well as half of Skeptics (48%), say they are proud of America’s 250-year history, compared with 22% of Rejecters.
White Americans (58%) are the most likely to say they are proud of America’s 250-year history, followed by multiracial (45%), Hispanic (41%), AAPI (39%), and Black (22%) Americans. White Americans without a college education are more likely than those with a college education to be proud (62% vs. 51%). Two-thirds of Americans ages 65 and older (66%) are proud of America’s long history, compared with 56% of ages 50-64, 42% of ages 30-49, and 32% of ages 18-29. Men (53%) are more likely than women (45%) to say they are proud of America’s 250-year history.
America’s Economic Achievements
One-third of Americans (34%) say they are extremely or very proud of America’s economic achievements, followed by nearly half of those who are moderately or a little proud (46%), and two in ten who are not at all proud (17%). Most Republicans (63%) are very proud of America’s economic achievements, compared with 29% of independents and 17% of Democrats.
White evangelical Protestants (52%) are the only religious group where the majority say they are proud of America’s economic achievements. Far fewer white Catholics (47%), Latter-day Saints (46%), white mainline/non-evangelical Protestants (43%), Jewish Americans (39%), Hispanic Protestants (36%), Hispanic Catholics (33%), and other non-Christians (27%) say they are proud of the country’s economic accomplishments. Religiously unaffiliated Americans (22%) and Black Protestants (16%) are the least likely to be proud.
Nearly two-thirds of Christian nationalism Adherents (64%) say they are proud of America’s economic achievements, followed by 49% of Sympathizers, 33% of Skeptics, and 14% of Rejecters.
White (39%) and AAPI (38%) Americans are more likely than Hispanic (30%), multiracial (21%), and Black (17%) Americans to be proud of America’s economic achievements. Older Americans, men, and Americans with a four-year degree or higher are also more likely to be proud of the country’s economic achievements than younger Americans, women, and non-college graduates.
America’s Good Moral Example for the World
One-quarter of Americans (24%) say they are extremely or very proud of America’s good moral example for the world, compared with 50% who are only a little or not at all proud. More than two in ten say they are moderately proud (22%). Just 49% of Republicans say they are very proud of America’s good moral example for the world, compared with far fewer independents (18%) and Democrats (10%).
There is no religious group in which a majority say that they are very proud of America’s good moral example for the world. Less than four in ten Latter-day Saints (38%) and white evangelical Protestants (37%), one-third of white Catholics (36%) and Hispanic Protestants (33%), and three in ten white mainline/non-evangelical Protestants (30%) and Jewish Americans (29%) are proud of America’s good moral example. Other non-Christians (17%), religiously unaffiliated Americans (14%), and Black Protestants (14%) also are the least likely to be proud.
More than half of Christian nationalism Adherents (53%) say they are extremely or very proud of America’s good moral example for the world, followed by 40% of Sympathizers, 21% of Skeptics, and only 6% of Rejecters.
Nearly three in ten white Americans (28%) say they are proud of America as a good moral example for the world, followed by 23% of Hispanic, 22% of AAPI, 19% of multiracial, and 15% of Black Americans. White Americans without a college education are more likely than those with a college education to be proud of America’s good moral example (32% vs. 21%). Older Americans and men are more likely than college graduates, younger Americans, and women to say they are proud of America’s good moral example.
The Way Democracy is Working in America Today
Less than one in five Americans (18%) say they are extremely or very proud of the way democracy is working in America today. Republicans (34%) are more likely than independents (13%) and Democrats (8%) to say they are very proud of the way democracy is working in America today.
At least two in ten white evangelical Protestants (25%), Latter-day Saints (24%), white Catholics (23%), Jewish Americans (23%), white mainline/non-evangelical Protestants (22%), Hispanic Protestants (21%), and Hispanic Catholics (20%) say they are proud of the way democracy is working in America today. Only one in ten members of other non-Christian religions (12%), Black Protestants (11%), and religiously unaffiliated Americans (10%) say they are proud of the way democracy is working in the country.
Nearly four in ten Christian nationalism Adherents (38%) are extremely or very proud of the way democracy is working in America today, compared with 27% of Sympathizers, 16% of Skeptics, and only 4% of Rejecters.
Americans without a four-year degree, older Americans, and men are more likely than college graduates, younger Americans, and women to say they are proud of America’s good moral example.
Hopes and Fears About America’s Future
Belief That God Has a Special Role for America
Just 44% of Americans agree with the idea that God has granted America a special role in human history, compared with a slim majority who disagree (52%). Agreement with this idea was relatively high in the early and mid-2010s, around 60 percent. Beginning in 2020, however, agreement dropped significantly to 40% and has since remained relatively stable in the low-to-mid 40s through 2026.
The partisan gap on American exceptionalism has widened sharply over the past decade. While Republican agreement that God has granted America a special role has remained relatively stable — dipping from 75% in 2012 to 63% in 2022, with about seven in ten agreeing today — Democratic support has collapsed, falling from 60% to just 27%. Independents declined as well, hitting a low of 35% in 2020 before a modest recovery to 40% in 2026.
In 2012, majorities of nearly all religious groups agreed that God has granted America a special role in human history. Today, only four religious subgroups hold this view. Most Latter-day Saints (80%), white evangelical Protestants (75%), Hispanic Protestants (64%), and Black Protestants (52%) agree that God has a special role for America. By contrast, less than half of every other major religious group agrees with this statement, including 49% of white Catholics, 47% of white mainline/ non-evangelical Protestants, 44% of Hispanic Catholics, 34% of Jewish Americans, 32% of other non-Christians, and only 21% of religiously unaffiliated Americans. Since 2022, white evangelical Protestants (from 68%) and religiously unaffiliated Americans (from 16%) have become more likely to agree.
Most Christian nationalism Adherents (89%) and Sympathizers (74%) agree that God has granted America a special role in human history, compared with 41% of Skeptics and just 10% of Rejecters.
White Americans (45%) do not differ from Black Americans (48%) or Hispanic Americans (41%) in their view that God has granted America a special role in human history, but they do differ from AAPI (37%) and multiracial (34%) Americans. White Americans without a college education are more likely than those with a college education to agree (52% vs. 36%). Younger Americans, including those ages 18-29 (39%) and 30-49 (40%), as well as college graduates (36%), are notably less likely to agree than older Americans, including those ages 50-64 (47%) and 65 and older (52%), and Americans without a college degree (49%).
Does the American Dream Hold True Today?
Americans are divided whether the American Dream — that if you work hard, you’ll get ahead — still holds true today (49% agree vs. 50% disagree). These views have become more pessimistic since 2024 when 55% of Americans agreed. Republicans’ belief in the American Dream (76%) has remained largely stable since 2024, despite a slight decline in 2025. By contrast, Democrats (from 44% to 30%) and independents (55% to 46%) have consistently become less likely to agree that the American Dream still holds true over the same period.
White Americans remain the most likely to believe in the American Dream, though agreement declined from 59% in 2024 to 53% in both 2025 and 2026. While Black Americans are consistently the least likely to agree, declining from 39% in 2024 to 33% in 2026, the sharpest declines occurred among Hispanic and AAPI Americans. Agreement among Hispanic Americans dropped from 52% in 2024 to 40% in 2026, while among AAPI Americans, it fell from 60% in both 2024 and 2025 to 47% in 2026. There are no differences in the American Dream by education levels.
Women (43%, down from 48% in 2025) and younger generations are less likely than men (53%) and older generations to believe in the American Dream. About four in ten Americans ages 18-29 (36%) and ages 30-49 (40%) share this belief, compared with a majority of Americans ages 50-64 (54%) and 65 and older (65%). Since 2024, the belief in the American Dream has declined across all age groups, with the deepest decline among young Americans ages 18-29 (from 50% to 36%).
Views on Whether Democratic Rights and Freedoms Are at Risk
A solid majority of Americans are more likely to agree with the statement “Today we are in real danger of losing important democratic rights and freedoms we have had in this country” (68%) than with the statement “The important democratic rights and freedoms we have in this country will remain protected into the future” (29%). Most Democrats (96%) and independents (70%) agree with the first statement, while Republicans are equally divided between the first and second statement (51% vs. 47%).
Majorities across all religious groups share this sense that we are in real danger of losing our democratic rights and freedoms. Majorities across all religious groups believe democratic rights and freedoms are in danger rather than secure. Even white evangelical Protestants — the least likely religious group to agree — still lean toward concern about losing such rights as opposed to believing their rights will be protected by a notable margin (59% vs. 39%).
The same pattern holds across all Christian nationalism groups, including Christian nationalism Adherents (58% vs. 41%) and Sympathizers (59% vs. 40%), who are among the least likely groups to agree with the first statement.
Majorities across all demographic groups, including racial groups, education levels, gender, and age groups, agree more with the statement “Today we are in real danger of losing important democratic rights and freedoms we have had in this country” than with the statement “The important democratic rights and freedoms we have in this country will remain protected into the future.”
America is in Danger of Losing its Culture and Identity
A majority of Americans (60%) agree that America is in danger of losing its culture and identity, compared with 37% who disagree. This share has increased since the question was first asked in 2016, when 55% agreed. Republicans (69%) are more likely than independents (59%) and Democrats (54%) to hold this view. However, since 2016, Republicans have become less likely to agree, declining from 80%, while independents and Democrats remained relatively stable until 2024, before increasing from 54% and 38%, respectively.
White evangelical Protestants (74%) are the most likely religious group to agree that America is in danger of losing its culture and identity, followed by nearly two-thirds of white Catholics (65%) and white mainline/non-evangelical Protestants (64%), and about six in ten Hispanic Catholics (62%), Black Protestants (61%), Hispanic Protestants (57%), Jewish Americans (57%), and other non-Christians (52%), and Latter-day Saints (56%). Religiously unaffiliated Americans and Hispanic Catholics have grown more likely to agree, from 41% and 55% in 2024 to 52% and 62% in 2026, respectively.
Most Christian nationalism Adherents (75%, down from 84% in 2024), Sympathizers (72%, down from 81% in 2024), and Skeptics (62%) agree that America is in danger of losing its culture and identity, compared with 46% of Rejecters (up from 27% in 2024).
At least six in ten Americans ages 65 and over (66%) and ages 50-64 (62%) agree that America is in danger of losing its culture and identity, compared with under six in ten Americans ages 30-49 (57%, up from 50% in 2024) and 18-29 (55%, up from 48%).
Anti-Muslim Views
Americans are divided whether the values of Islam are at odds with American values and the American way of life (50% agree; 46% disagree). These views have remained stable since 2011, when 47% of Americans agreed, despite an uptick to 56% in 2015 and a brief decline to 39% in 2022.
Most Republicans (76%) agree that the values of Islam are at odds with American values and the American way of life, compared with 46% of independents, and 30% of Democrats. Since 2011, Republicans have increasingly become more likely to hold this view, rising from 63% to 76%, while Democrats have become less likely to agree, declining from 40% to 30%. Independents’ views have remained relatively stable over time, peaking in 2015 and reaching their lowest in 2022.
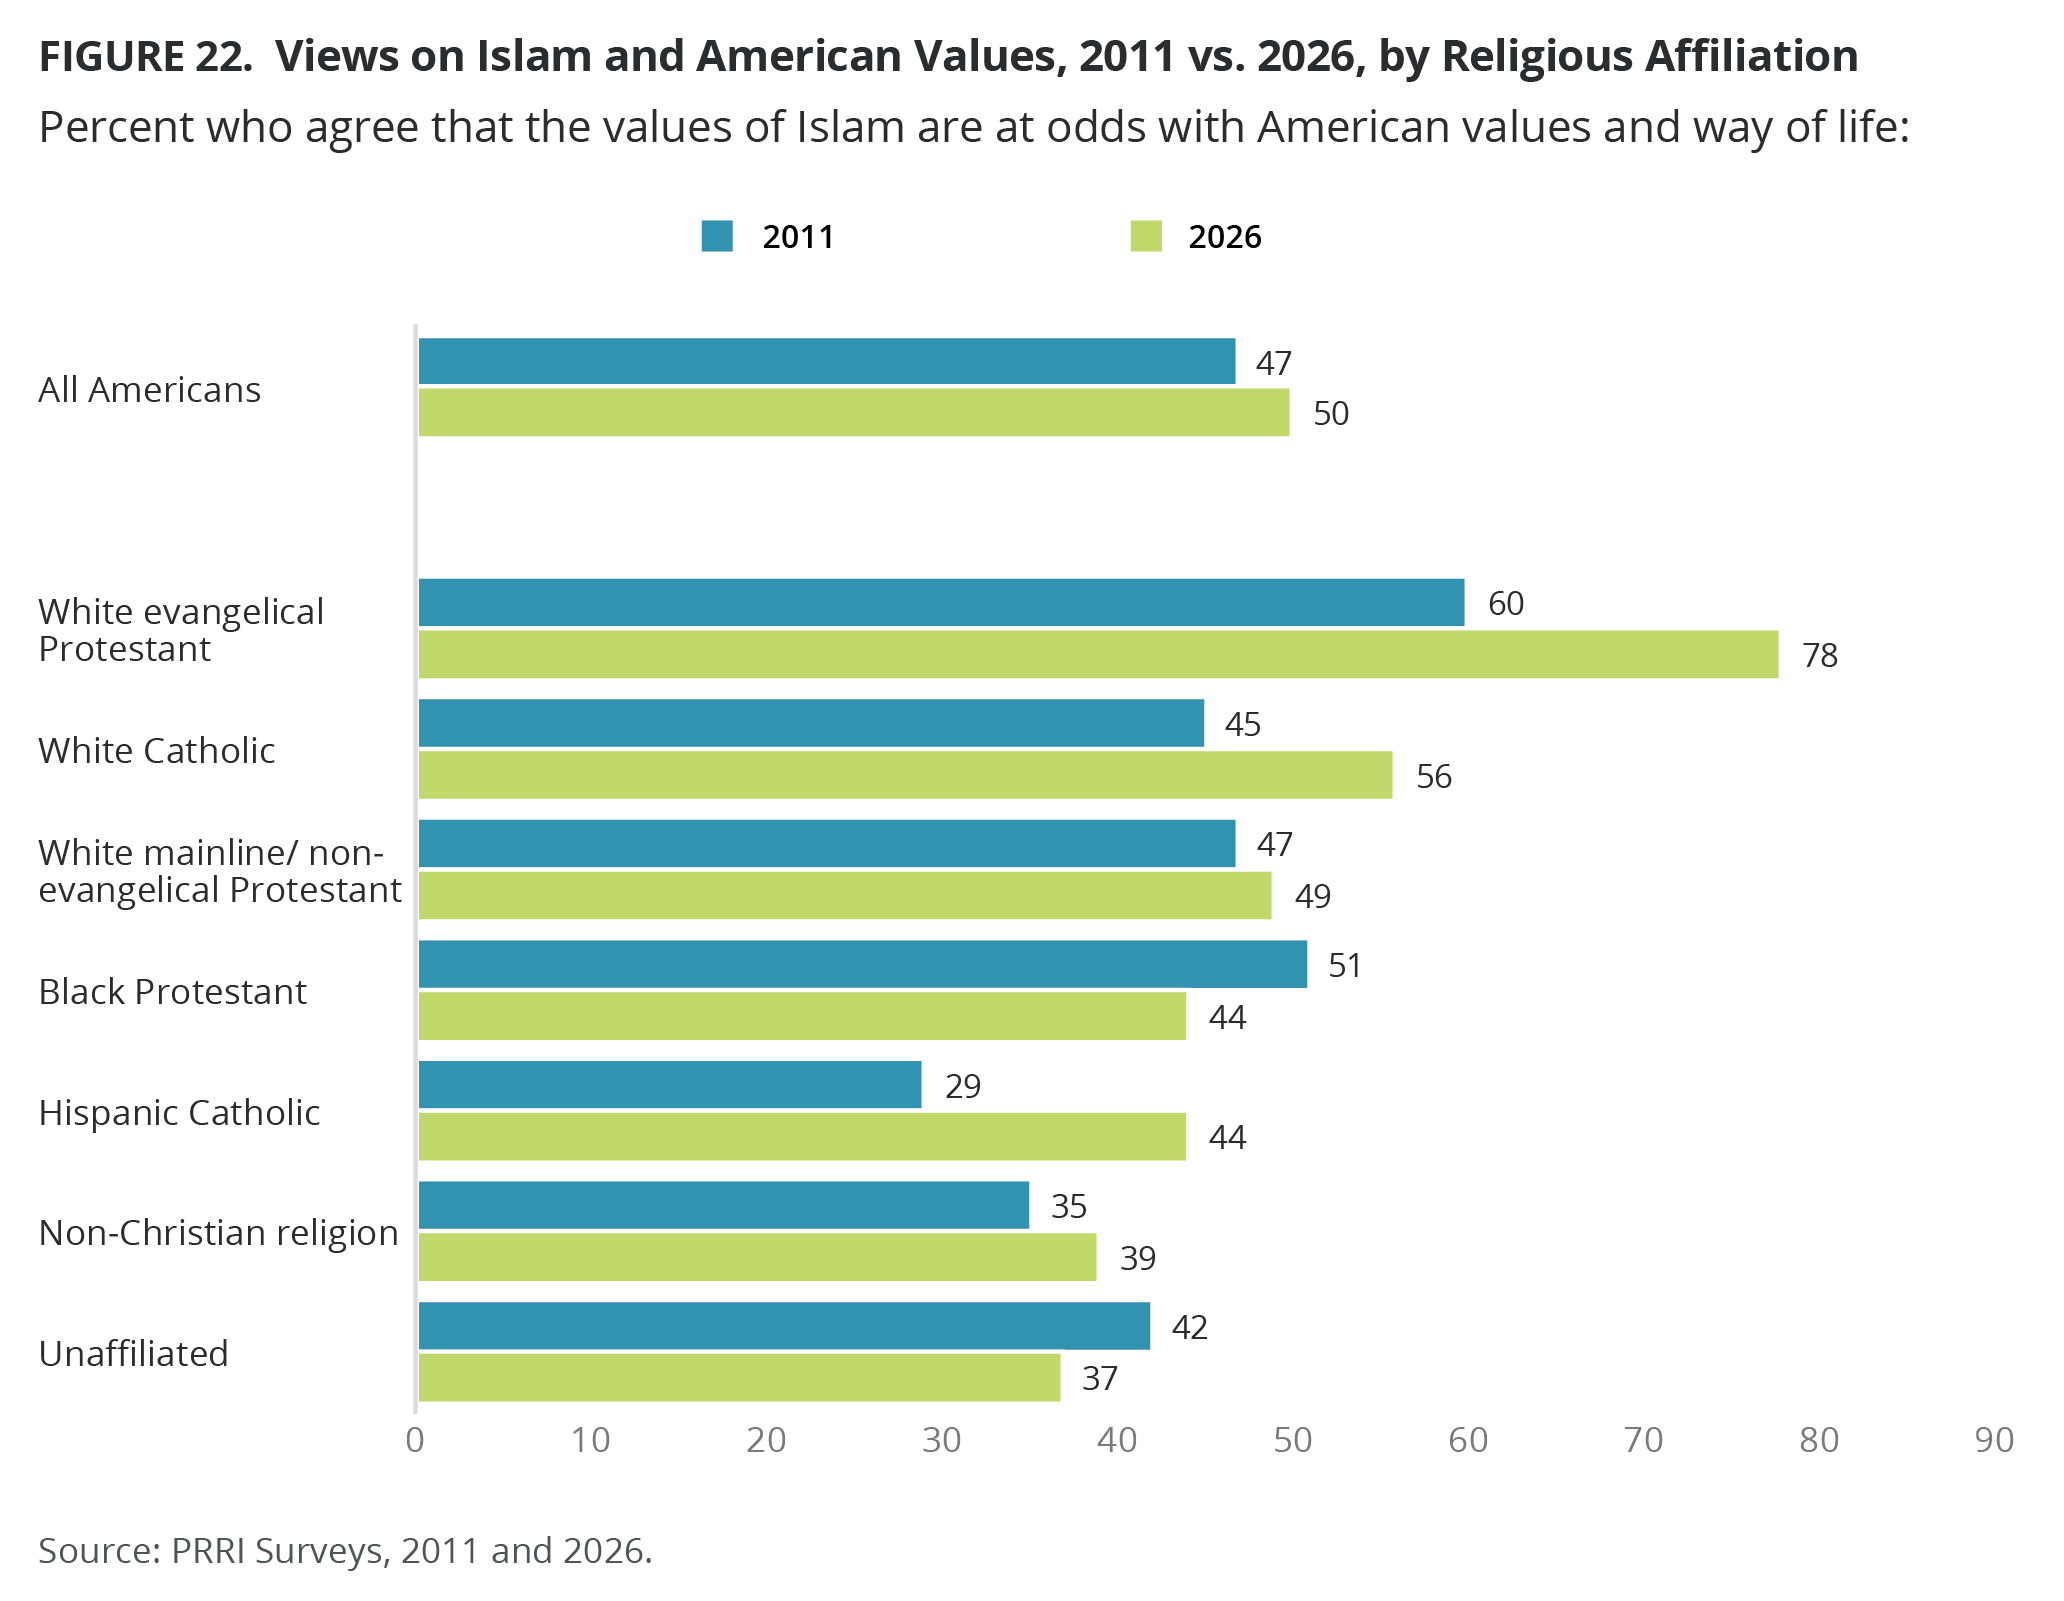
A majority of white evangelical Protestants (78%) and white Catholics (56%) agree that the values of Islam are at odds with American values and the American way of life, followed by nearly half of white mainline/non-evangelical Protestants (49%). Black Protestants (44%), Hispanic Catholics (44%), non-Christians (39%), and religiously unaffiliated Americans (37%) are less likely to hold this view. Since 2011, agreement has increased among white evangelical Protestants (from 60%), white Catholics (from 45%), and Hispanic Catholics (from 29%), and declined among Black Protestants (from 51%).[4]
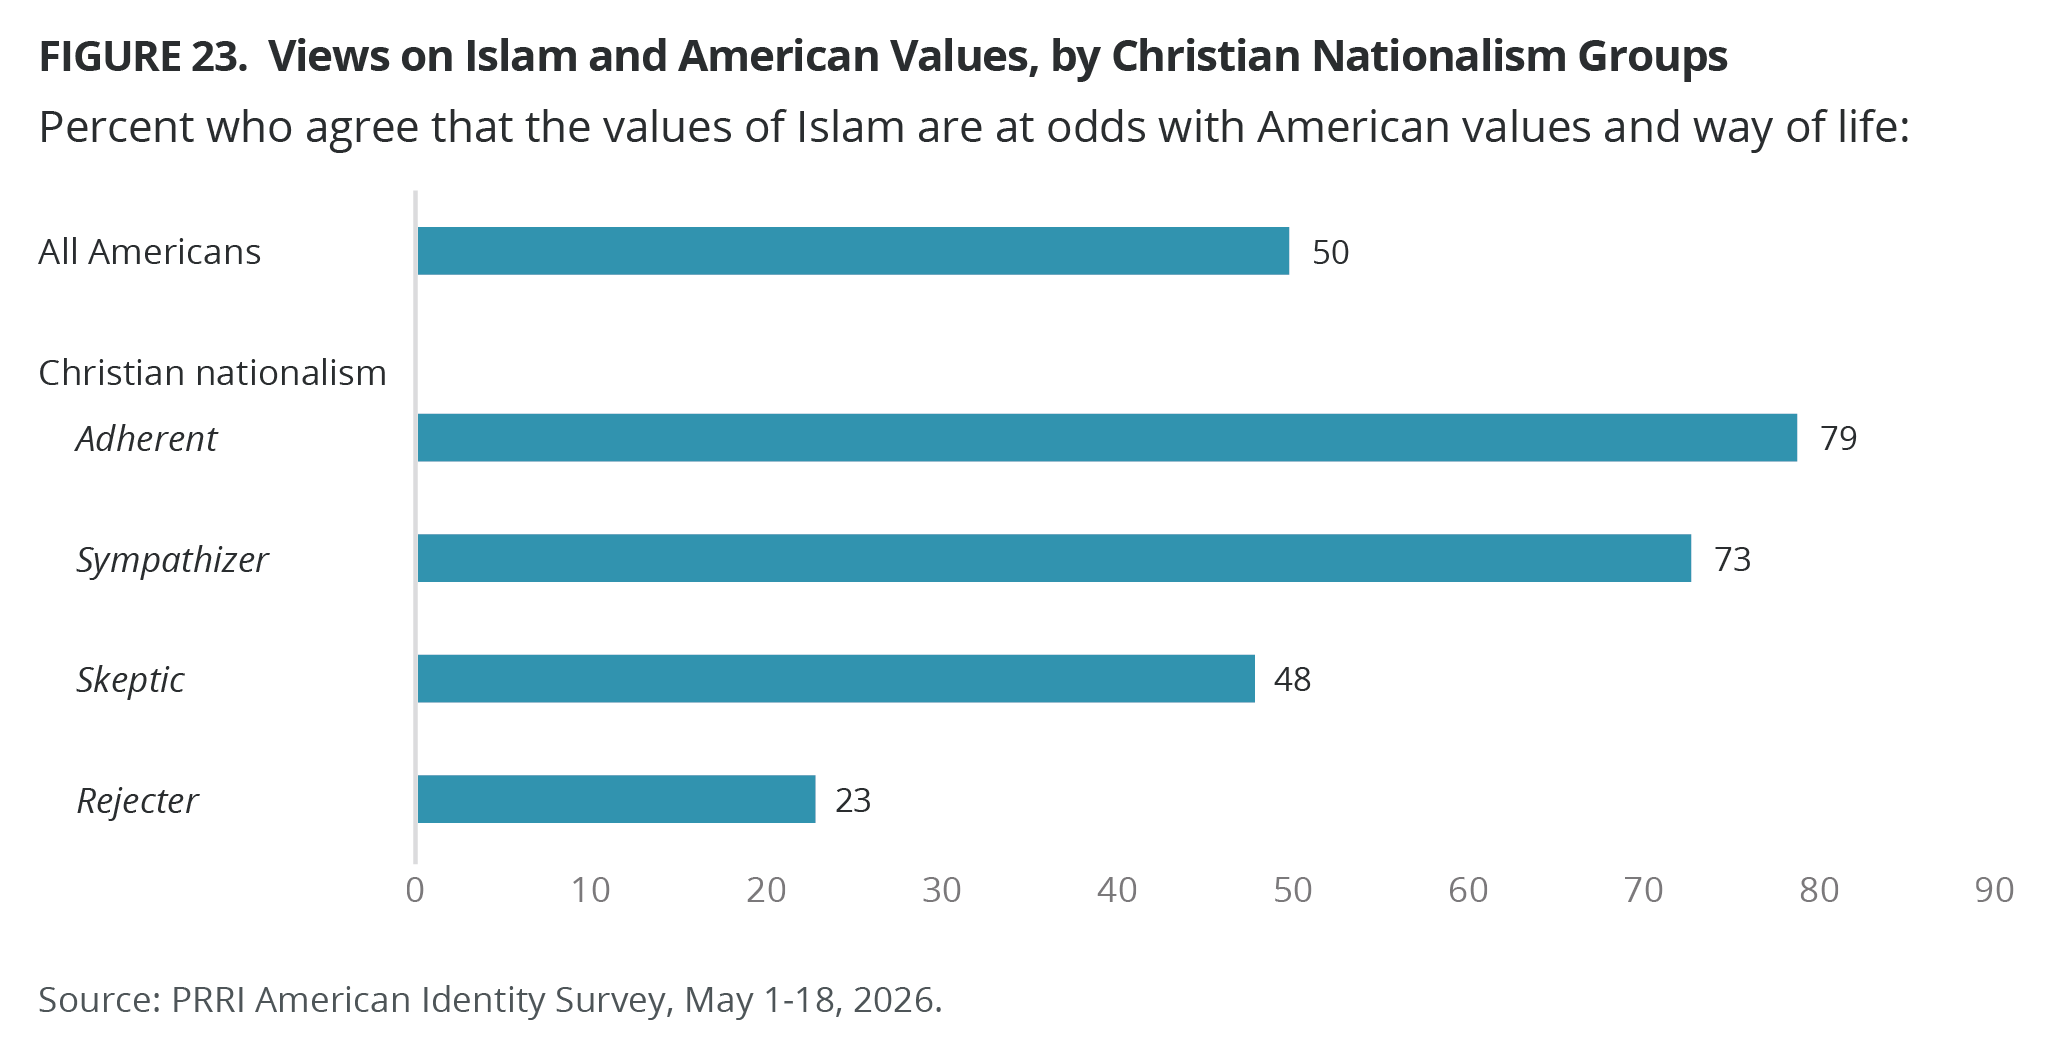
A solid majority of Christian nationalism Adherents (79%) and Sympathizers (73%) agree with this anti-Muslim view, compared with 48% of Skeptics and 23% of Rejecters.
White Americans (54%) is the only racial group in which the majority agree that the values of Islam are at odds with American values and the American way of life, followed by four in ten Hispanic (44%), multiracial (41%), AAPI (41%), and Black (39%) Americans. White Americans without a college degree are more likely than those with a college degree to agree (59% vs. 46%). Women, those without a college education, and older Americans are more likely to agree than men, those with a college degree, and younger Americans.
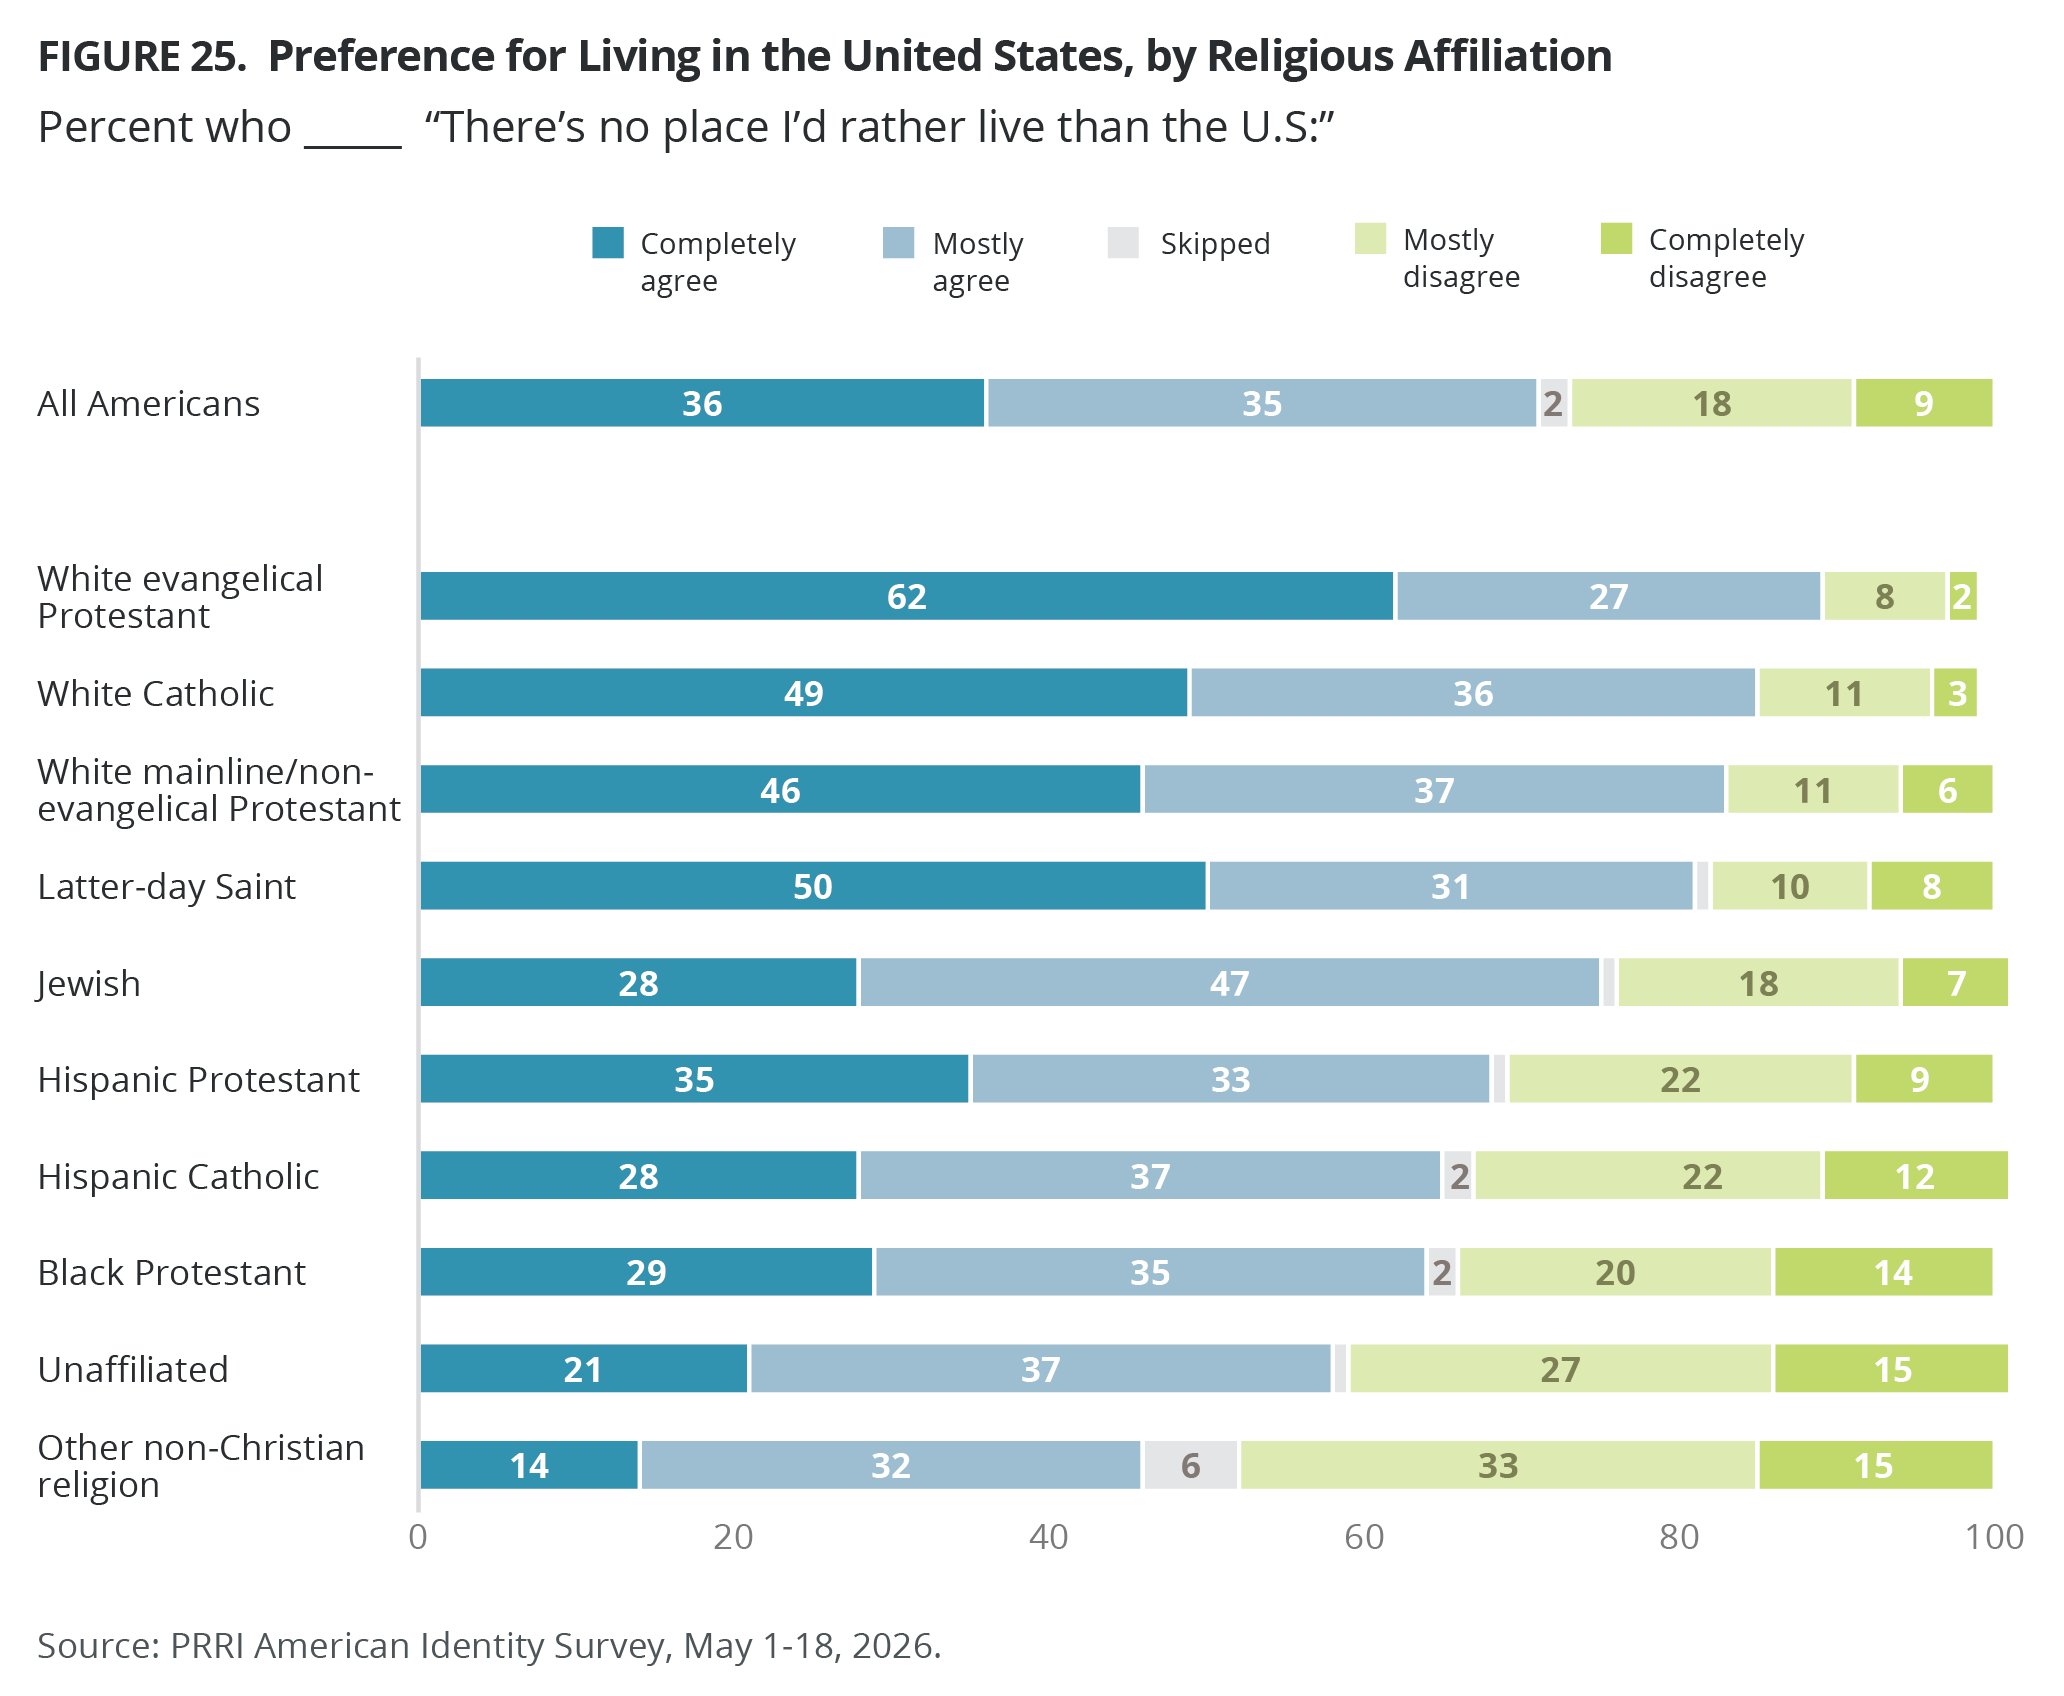
Preference for Living in the United States
Over seven in ten Americans (71%) agree that “there’s no place I’d rather live than the U.S,” compared with 27% who disagree. Nearly all Republicans (91%) agree, followed by independents (68%), and Democrats (59%).
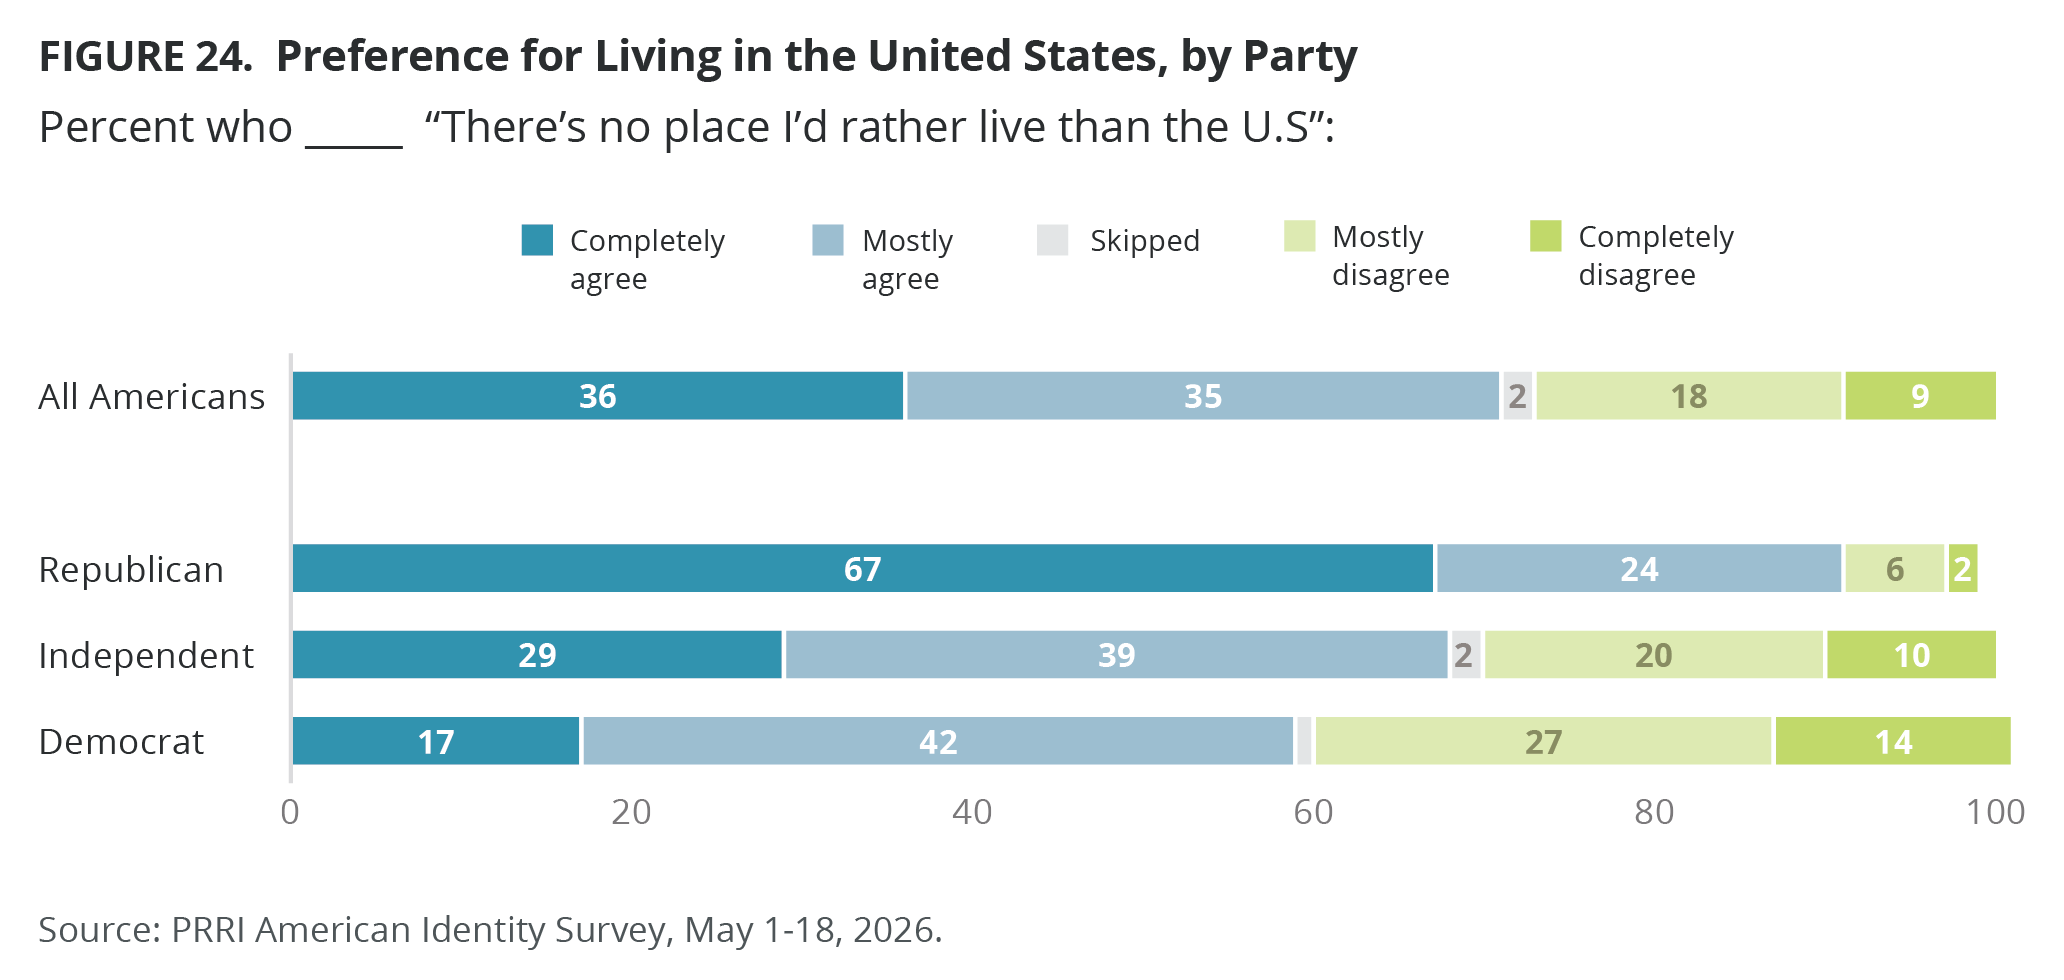
Except for members of non-Christian religions (46%), Christian nationalism Rejecters (51%), and Americans ages 18-29 (55%), at least six in ten of all other religious and demographic groups agree that “there’s no place I’d rather live than the U.S.”
What Kind of a Nation Do We Want to Be?
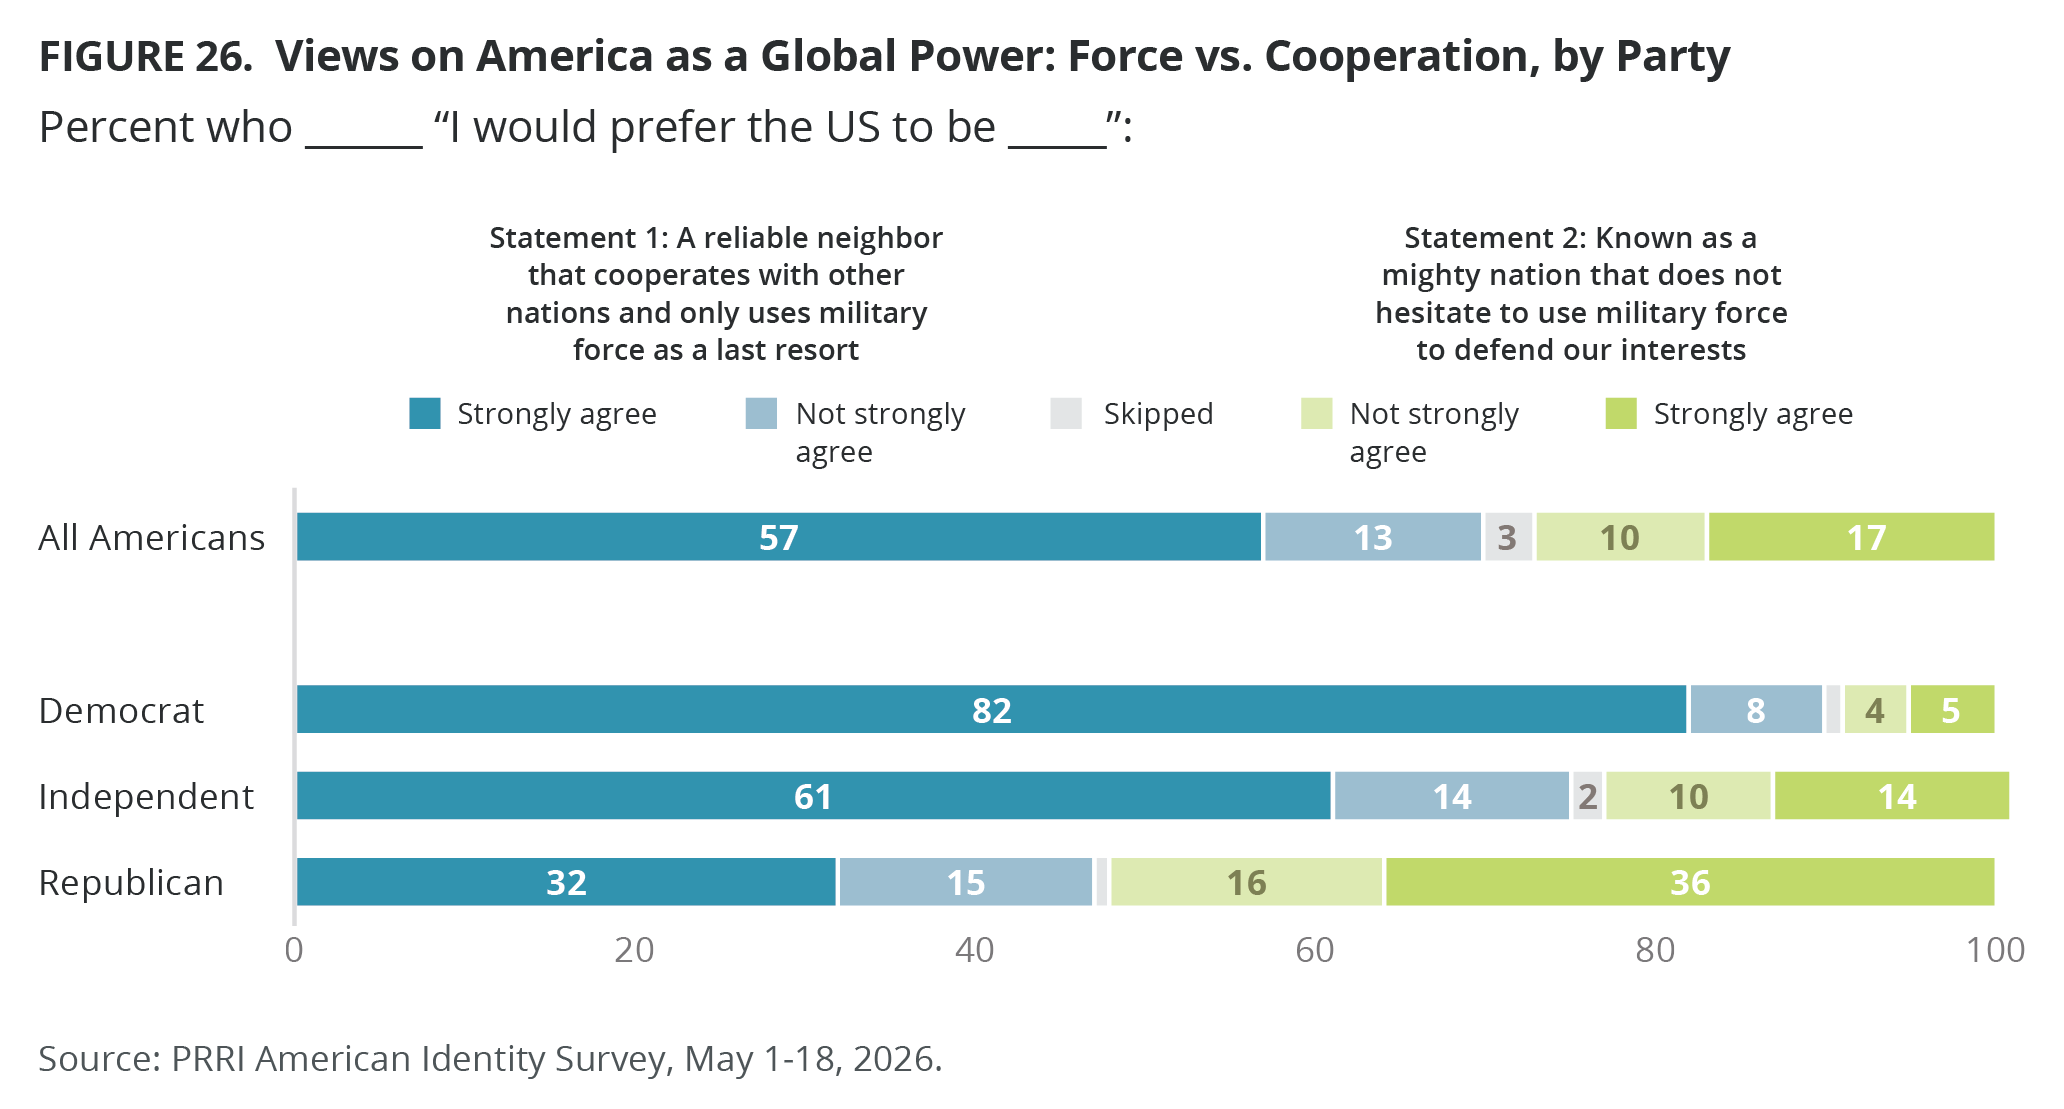
America as a Global Power: Force vs. Cooperation
A solid majority of Americans are more likely to agree with the statement “I would prefer the U.S. to be a reliable neighbor that cooperates with other nations and only uses military force as a last resort” (70%) than with the statement “I would prefer the U.S. to be known as a mighty nation that does not hesitate to use military force to defend our interests” (27%). Most Democrats (90%) and independents (75%) agree with the first statement, while a slim majority of Republicans agree with the second statement (52%).
Except for white evangelical Protestants, who are evenly divided (52% vs. 47%), solid majorities across all religious groups prefer the cooperative neighbor over the mighty nation framing.
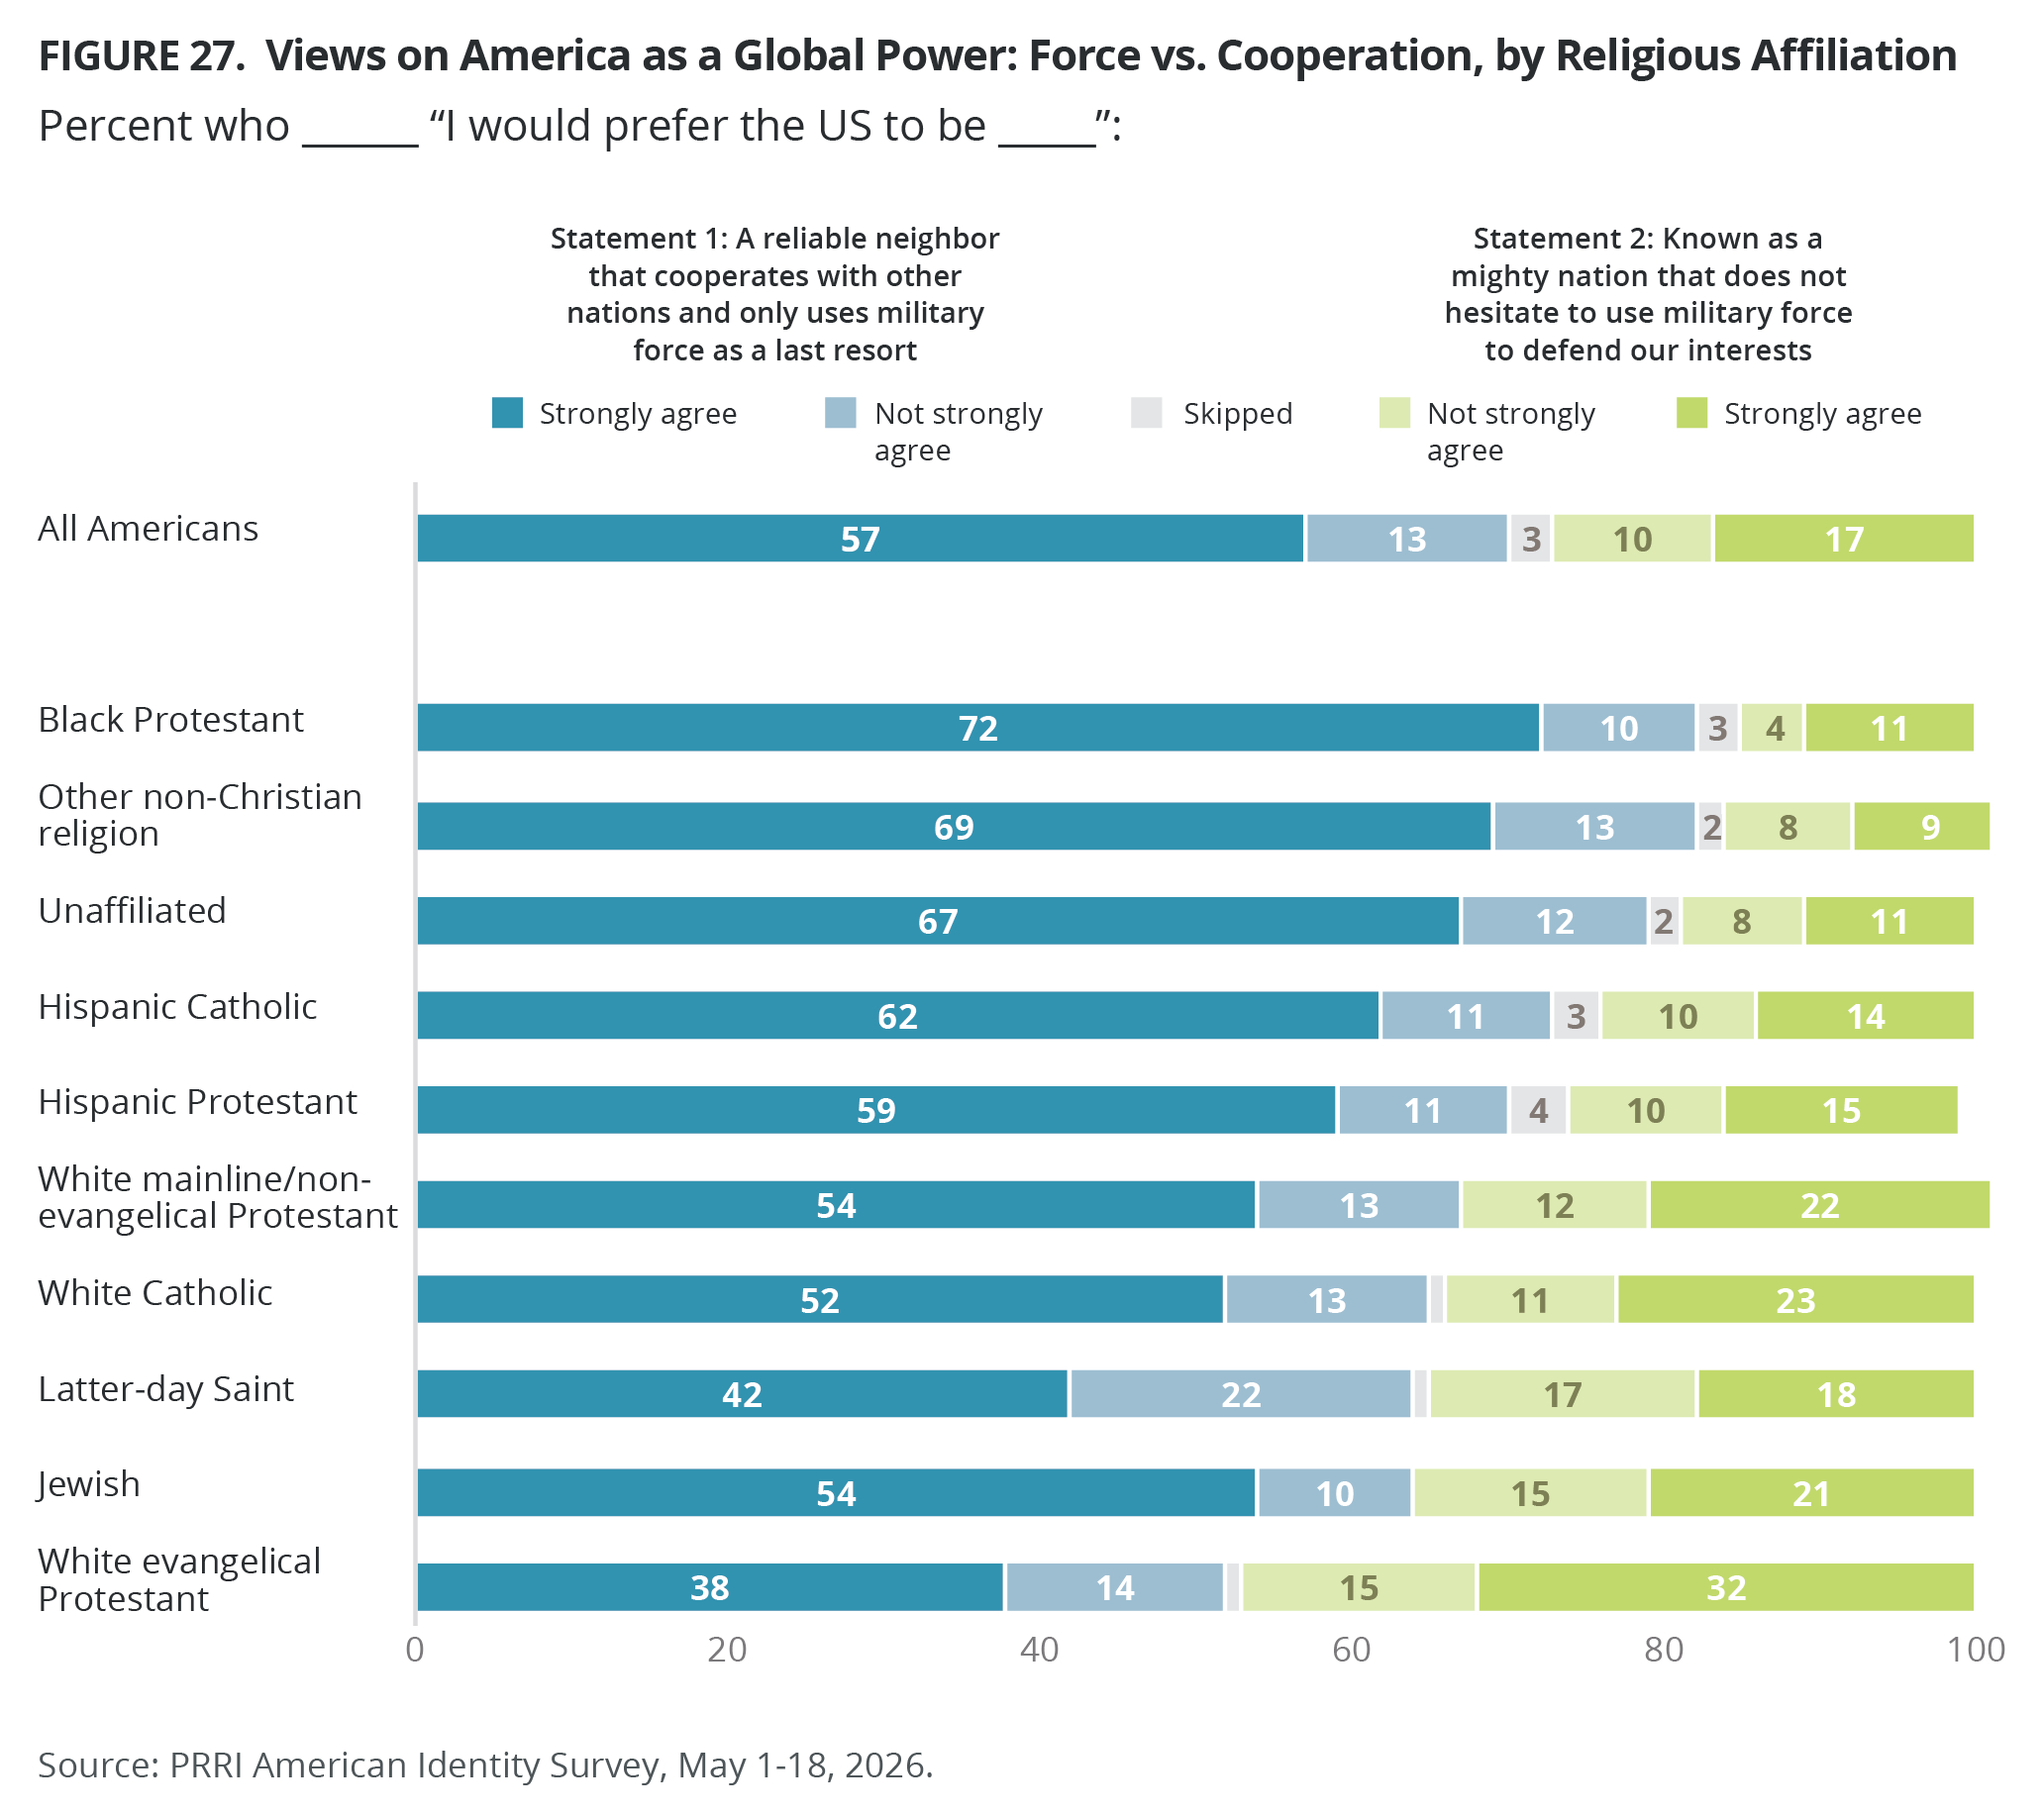
The same pattern holds across Christian nationalism groups, with one exception: Adherents. Most Christian nationalism Rejecters (91%), Skeptics (74%), and Sympathizers (55%) favor the cooperative neighbor statement, compared with just 45% of Adherents — the only group where a majority (54%) prefers the mighty nation framing.
Majorities across all demographic groups, including racial groups, education levels, gender, and age groups, agree more with the cooperation statement rather than the use of force statement.
Religious Pluralism or Christian Faith?
Nearly two-thirds of Americans (64%) would prefer “the U.S. to be a nation made up of people belonging to a wide variety of religions,” compared with 34% who prefer “the U.S. to be a nation primarily made up of people who follow the Christian faith.” Preference for a nation made up of people belonging to a wide variety of religions has declined from 73% in 2022 when the question was first asked but has remained stable since September 2025.
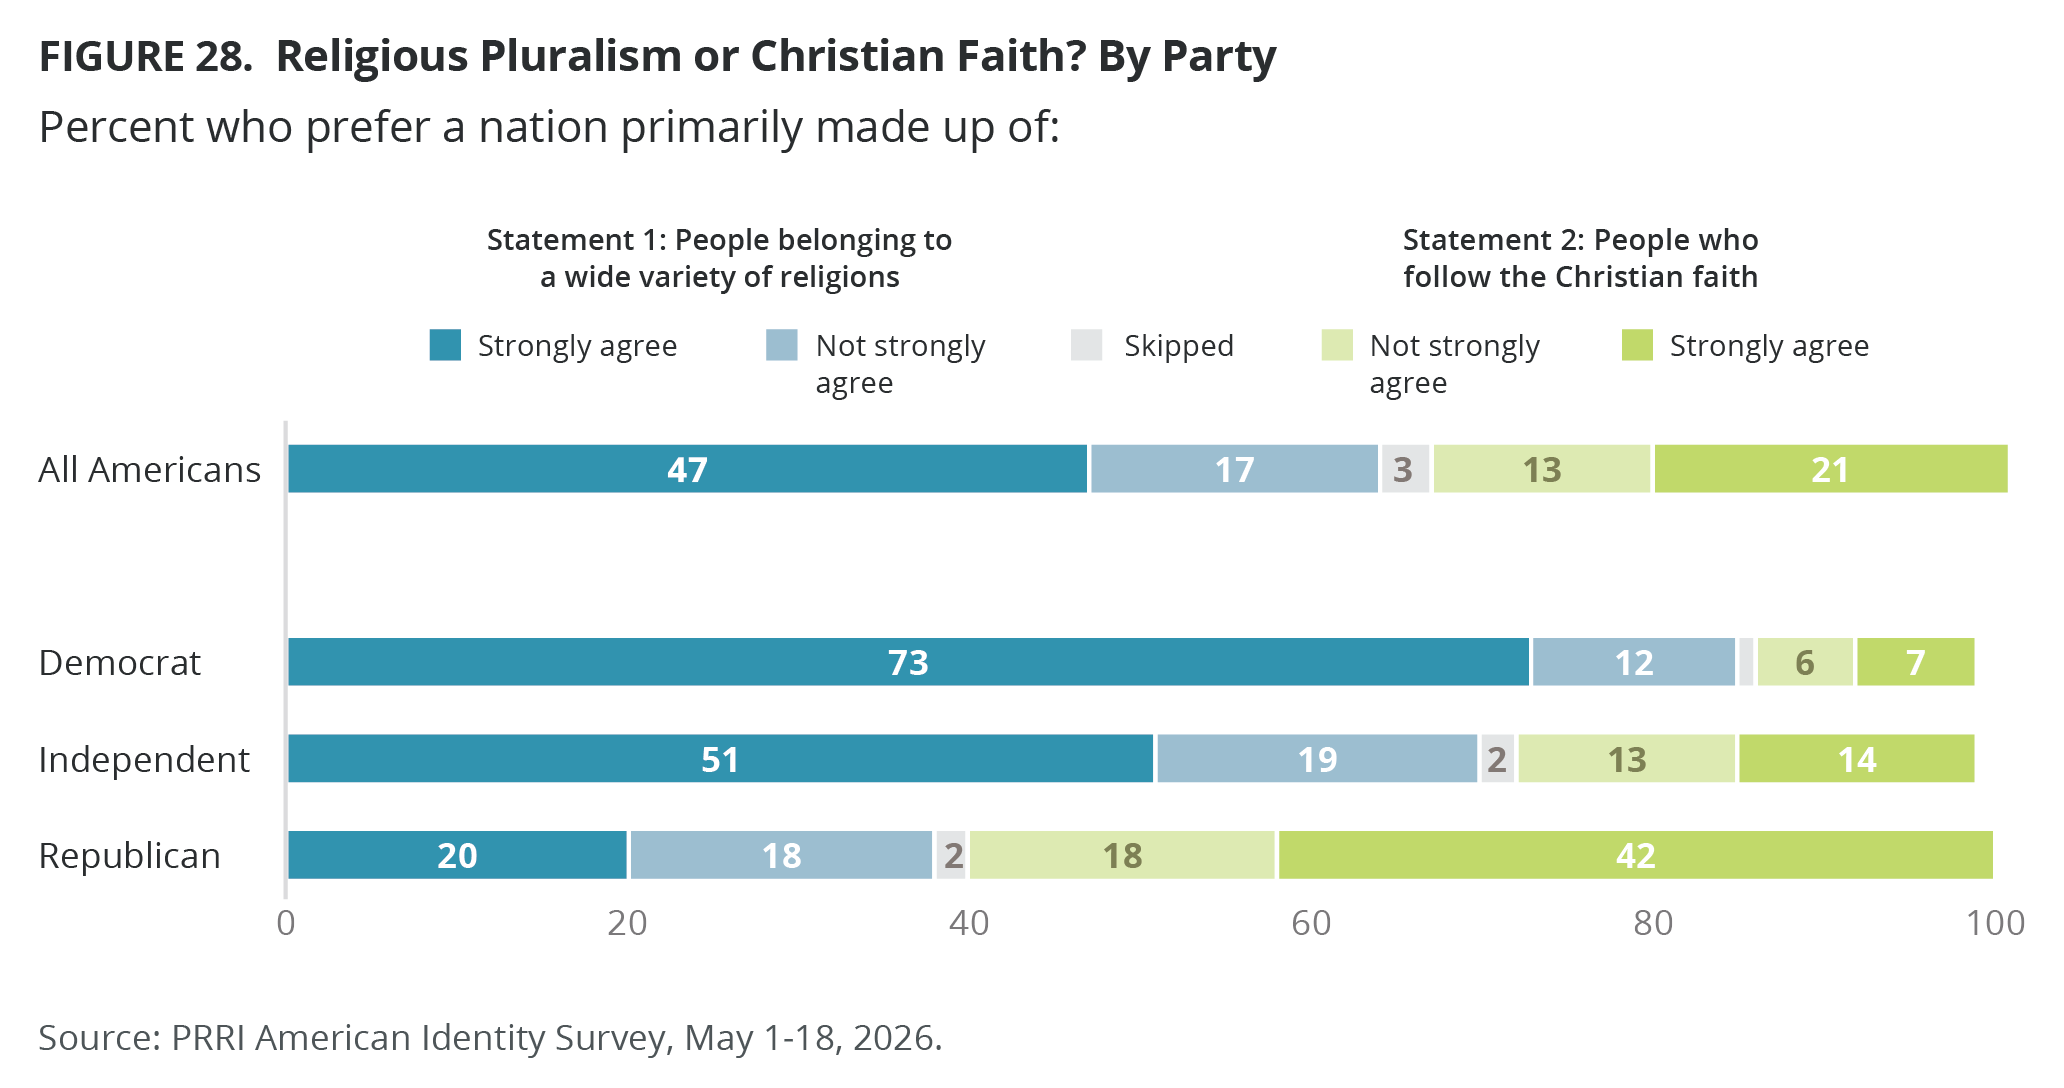
Six in ten Republicans (60%) prefer the U.S. to be primarily made up of Christians (up from 52% in 2022), while 38% prefer the country to have a diverse religious makeup (down from 49%). By contrast, the vast majority of Democrats (85%) and independents (70%, down from 79%) prefer a nation made up of a wide variety of religions, compared with just 13% and 27%, respectively, who prefer the U.S. to be mostly Christian.
Along religious lines, two-thirds of white evangelical Protestants (68%) prefer the United States to be composed of people who are primarily Christian. By contrast, solid majorities of all other religious groups prefer the U.S. to be made up of people belonging to a wide variety of religions. Latter-day Saints (51% vs. 46%) and Hispanic Protestants (48% vs. 51%) are equally divided.
Not surprisingly, most Christian nationalism Adherents (80%) and Sympathizers (62%) prefer the United States to be composed of people who are primarily Christians, while most Rejecters (94%) and Skeptics (75%) prefer the U.S. to be made up of people belonging to a wide variety of religions.
Racial Diversity or Western European Heritage?
Nearly eight in ten Americans (77%, slightly down from 80% in March 2025) say they would prefer the U.S. to be a nation made up of people from all over the world, while just 20% say they would prefer the U.S. to be a nation primarily made up of people of Western European heritage (up from 15% in March 2025.) Most Democrats (92%), independents (82%), and Republicans (62%) would prefer a racially diverse country, but Republicans have become significantly less likely to agree with this statement over the past year (down from 73% in March 2025).
Most Americans across religious affiliation, race, gender, education levels, and age say they would prefer a racially diverse nation. While still majorities, Christian nationalism Adherents (55%) and Sympathizers (68%) are less likely to prefer a racially diverse nation over a nation primarily made up of people of Western European heritage, compared with Christianism nationalism Skeptics and (82%) and Rejecters (93%).
What It Means to Be “Truly American”
PRRI’s 2025 American Values Survey included a number of questions exploring what it means to be truly American. When asked about how important the following traits are to being “truly American,” most Americans say that believing in individual freedoms, such as freedom of speech (93%), believing in the Constitution (91%), accepting people of diverse racial and religious backgrounds (89%), believing in the Declaration of Independence (88%), respecting American political institutions and laws (88%), and being able to speak English (75%) are very or somewhat important.
Smaller majorities of Americans say believing in God (57%) and being born in America (54%) are very or somewhat important to being truly American. Americans are less likely to say that being a Christian (43%) or having ancestors who served in the military in previous wars, such as the world wars and the Civil War (42%), are important. Just 23% of Americans say that being of Western European heritage is important to being truly American.
With the exception of Western European heritage, where only one-third say this trait is important (33%), majorities of Republicans believe every other trait is important to being truly American. Conversely, fewer than half of Democrats say that being born in America (42%), believing in God (41%), having ancestors who served in the military in previous wars, such as the world wars and the Civil War (34%), and being a Christian (29%) are important to being truly American. Majorities of Democrats say all other traits are important. Though independents mirror all Americans very closely, they are 8 percentage points less likely to say believing in God (49% vs. 57%) or being Christian (35% vs. 43%) are very important to being truly American.
There are also differences between Christian and non-Christian groups on key aspects of being truly American. Most notably, white Christians and Christians of color are also more likely than non-Christians and unaffiliated Americans to say that believing in God, being born in America, being a Christian, and having ancestors who served in the military in previous wars are important to being truly American.
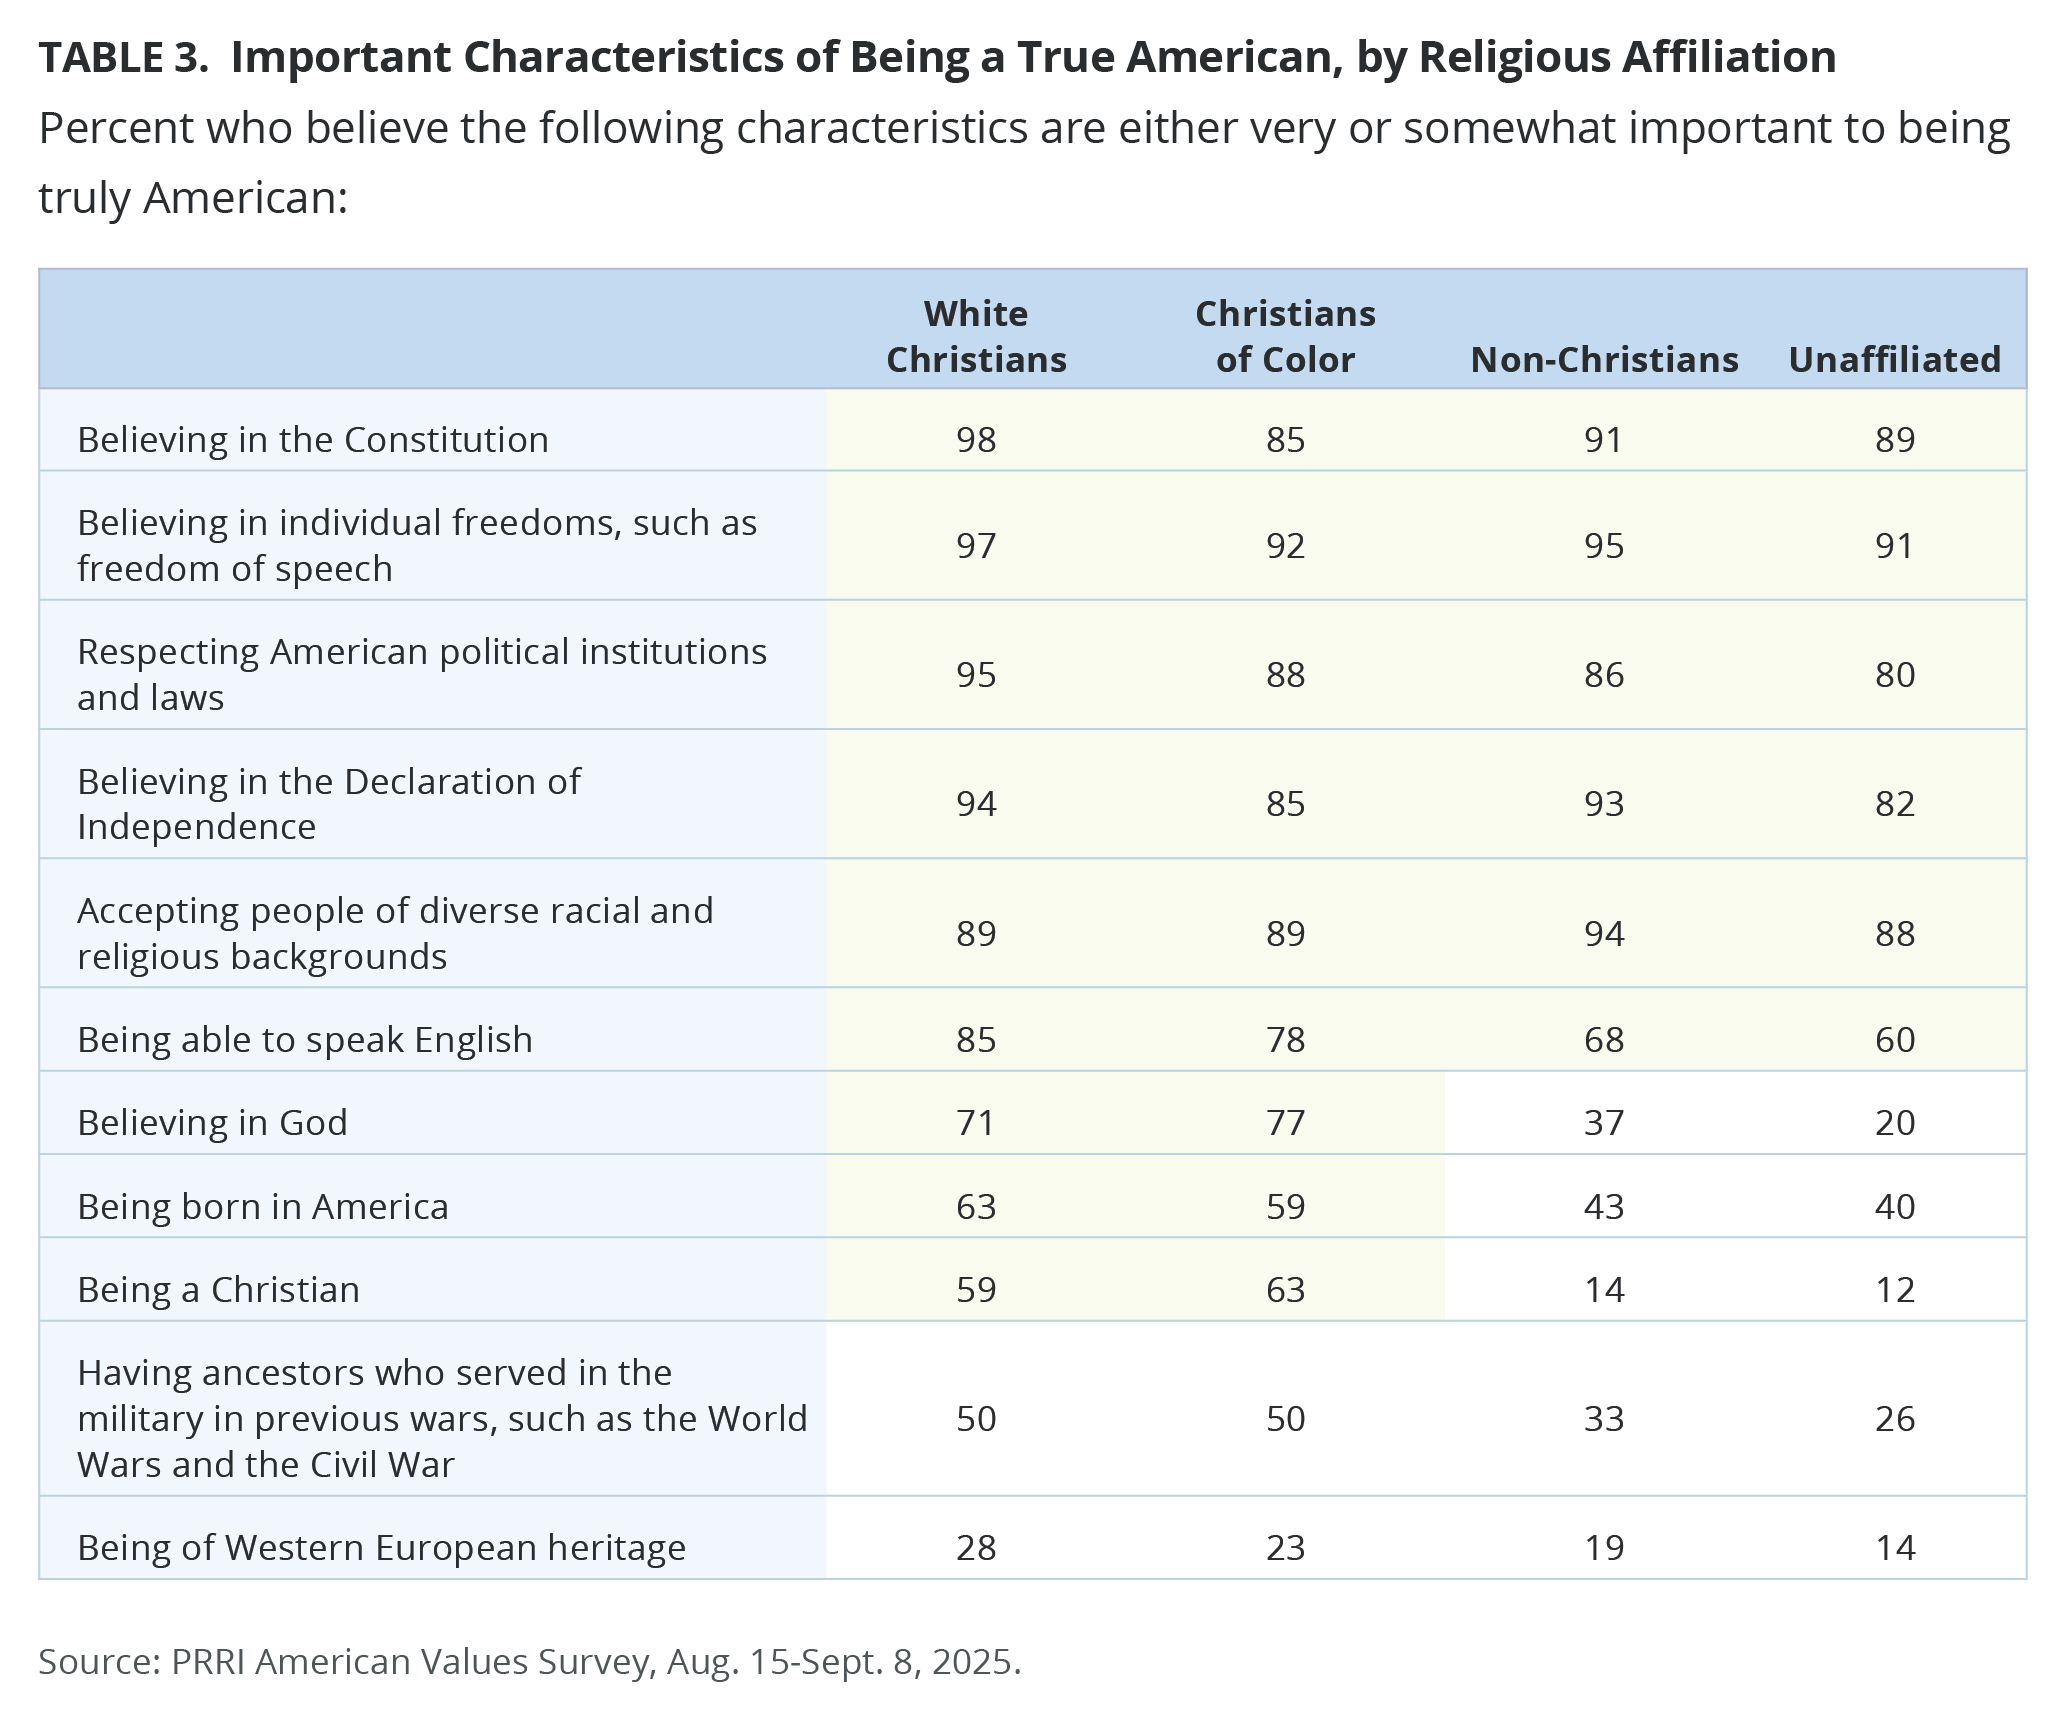
Unsurprisingly, most Christian nationalism Adherents (94%) and Sympathizers (80%) say being a Christian is somewhat or very important to being truly American, followed by 37% of Skeptics, and only 5% of Rejecters. A similar trend among Christian nationalism groups emerges when they refer to believing in God, being born in America, having ancestors who served in the military in previous wars, and being of Western European heritage as important to being truly American.
Survey Methodology
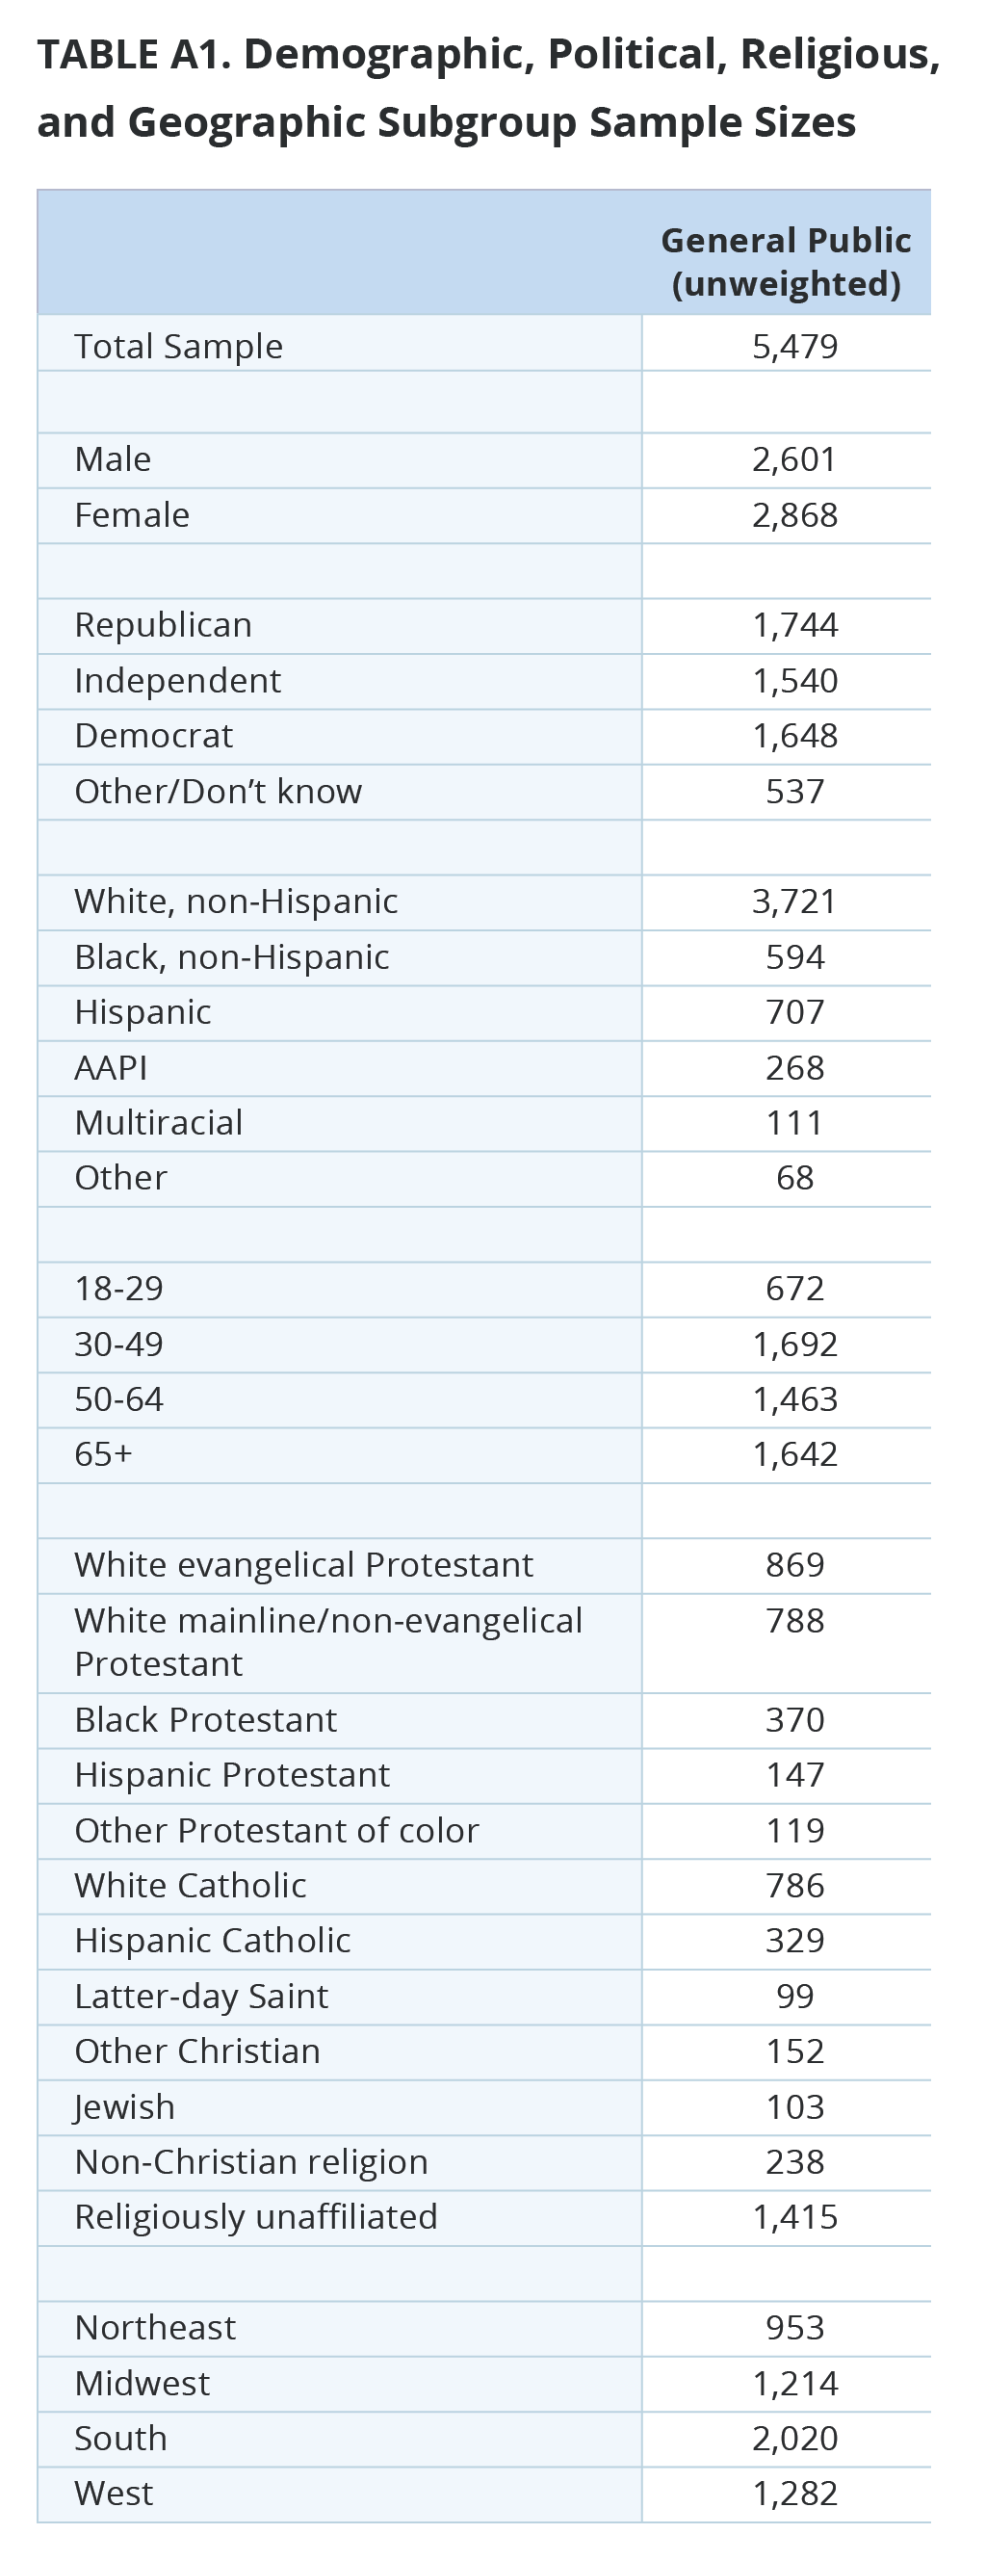
The survey was designed and conducted by PRRI. The survey was made possible through the generous support of the Ford Foundation, the William and Flora Hewlett Foundation, and the Unitarian Universalist Veatch Program at Shelter Rock. The survey was conducted among a representative sample of 5,469 adults (age 18 and up) living in all 50 states in the United States. Of those respondents, 5,140 were part of Ipsos’s Knowledge Panel and an additional 329 who were recruited by Ipsos using opt-in survey panels to increase the sample sizes in smaller states. Interviews were conducted online between May 1-18, 2026.
Respondents are recruited to the KnowledgePanel using an addressed-based sampling methodology from the Delivery Sequence File of the USPS – a database with full coverage of all delivery addresses in the U.S. As such, it covers all households regardless of their phone status, providing a representative online sample. Unlike opt-in panels, households are not permitted to “self-select” into the panel; and are generally limited to how many surveys they can take within a given time period.
The initial sample drawn from the KnowledgePanel was adjusted using pre-stratification weights so that it approximates the adult U.S. population. Next, a probability proportional to size (PPS) sampling scheme was used to select a representative sample.
To reduce the effects of any non-response bias, a post-stratification adjustment was applied. The needed benchmarks were obtained from the latest 2025 March supplement of the Current Population Survey (CPS), except language proficiency, which is not available from CPS, and was obtained from the 2023 American Community Survey (ACS). Additionally, the 2024 vote choice benchmark was obtained from the Associated Press Tabulation of Certified Results. The post-stratification weight rebalanced the sample based on the following benchmarks: gender by age, race/ethnicity, education, income, language proficiency, Census region by metropolitan status, party affiliation, and 2024 presidential vote choice. Additionally, we included individual states (50 states plus D.C.) to account for the oversampling of some states.
The margin of error for the national survey is +/- 1.53 percentage points at the 95% level of confidence, including the design effect for the survey of 1.34. In addition to sampling error, surveys may also be subject to error or bias due to question wording, context, and order effects. Additional details about the KnowledgePanel can be found on the Ipsos website: https://www.ipsos.com/en-us/solution/knowledgepanel
[1] For more information on Trump favorability, see: https://prri.org/spotlight/new-poll-amid-ongoing-war-in-iran-trump-support-drops-among-independents-and-republican-leaners/
[2] To measure Christian nationalism, PRRI used a battery of five questions based on respondents’ answers to (1) The U.S. government should declare America a Christian nation, (2) U.S. laws should be based on Christian values, (3) If the U.S. moves away from our Christian foundations, we will not have a country anymore, (4) Being Christian is an important part of being truly American, and (5) God has called Christians to exercise dominion over all areas of American society. Each respondent receives a composite score on the Christian nationalism scale (with a range of 0 to 1) and is then assigned to one of the four groups. For more information about how measures are constructed and Christian nationalism more generally, please see our previous reports: A Christian Nation? Understanding the Threat of Christian Nationalism to American Democracy and Culture, Support for Christian Nationalism in All 50 States: Findings from PRRI’s 2023 American Values Atlas, and Christian Nationalism Across All 50 States: Insights from PRRI’s 2024 American Values Atlas.
[3] The ANES survey question and response options are as follows: “During this year the United States has been celebrating its 200th birthday. Does the thought of America’s 200-year history make you feel very proud, somewhat proud, not very proud, or doesn’t really make much difference to you.”
[4] Although the sample of Hispanic Catholics in 2011 is small (n = 92), the observed changes over time are statistically significant at the 95% confidence level.


