Abortion Attitudes in a Post-Roe World: Findings From the 50-State 2022 American Values Atlas
To see the latest data on this topic, see PRRI’s April 2025 report: “Abortion Views Across All 50 States: Key Insights from PRRI’s 2024 American Values Atlas.”
To view a PDF of slides presented during PRRI’s February 23, 2023, webinar on this report, please click here. For a replay of the PRRI webinar via YouTube, please click here.
The End of Roe
In late June 2022, the Supreme Court’s decision in Dobbs v. Jackson overturned Roe v. Wade, reversing nearly five decades of precedent that had established a national right to abortion access. Republican-majority legislatures in several states had been chipping away at abortion rights for the past several years through increasingly strict regulations, but the Dobbs decision suddenly changed the policy landscape regarding reproductive rights, catapulting abortion to the forefront of American politics.
The immediate impact of repealing Roe v. Wade was that control over abortion law reverted to the states. Some states had “trigger laws” in place to immediately impose abortion restrictions in the event that Roe was overturned, while others had protections in place to keep abortion policy as it was under Roe. In other states, lawmakers went to work crafting legislation in response to Dobbs. As of January 2023, the New York Times reports, 13 states have full abortion bans, some of which allow for exceptions if the life of the mother is in danger and in cases of rape or incest, and Georgia has a 6-week ban in place.[1] According to the Guttmacher Institute, abortion-access laws vary widely in the rest of the country, but all other states allow abortions at least up to 15 weeks into pregnancy.[2]
Some state abortion laws have been challenged in court, and access has changed as court orders blocking or allowing restrictions have been put in place or lifted. Republicans in some states have made efforts to restrict reproductive rights a step further, pushing legislation that would limit people’s ability to receive abortion pills by mail or cross state lines to get abortion services, and would even label some forms of birth control as abortifacients.[3]
Beginning in March 2022 and throughout the rest of the year, PRRI surveyed Americans about their views on abortion legality and related issues as part of our American Values Atlas. The scope of the project allows us to report results on some questions for all 50 states and the District of Columbia. In general, we found that most Americans support abortion legality in most or all cases and oppose the overturn of Roe. This report delves into the political, religious, and demographic correlates of various opinions on abortion access.
The Big Picture: Attitudes Toward Abortion Legality
Just under two-thirds of Americans (64%) say that abortion should be legal in most or all cases, while roughly one-third (34%) say it should be illegal in most or all cases. More granularly, 30% say abortion should be legal in all cases, 34% say it should be legal in most cases, 25% say it should be illegal in most cases, and just 9% say it should be illegal in all cases.
The share of Americans who say abortion should be legal in most or all cases has continued to increase since PRRI began tracking abortion legality in 2010, when it was at 55%. The share of those who say abortion should be illegal in most or all cases has shrunk (from 42% in 2010 to 34% now), with the proportion who say abortion should be illegal in all cases seeing the largest decline (from 15% in 2010 to 9% now).
However, there has been little movement in attitudes about abortion’s legality in the wake of the Supreme Court’s Dobbs decision in June 2022. In March 2022, 64% of Americans felt that abortion should be legal, as did a similar share in June (65%). After Dobbs, support for abortion’s legality remained fairly constant in August (64%), September (62%), and December (65%).
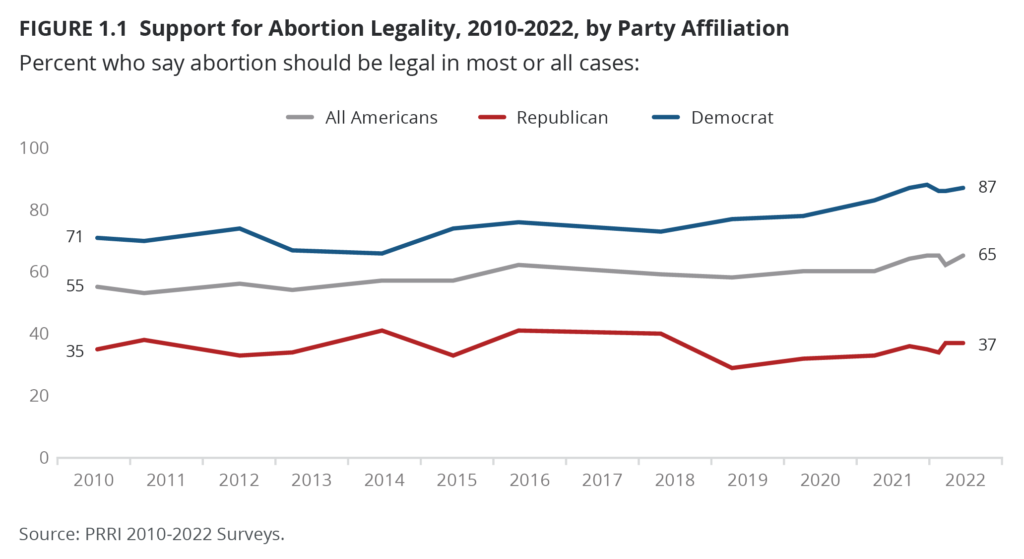
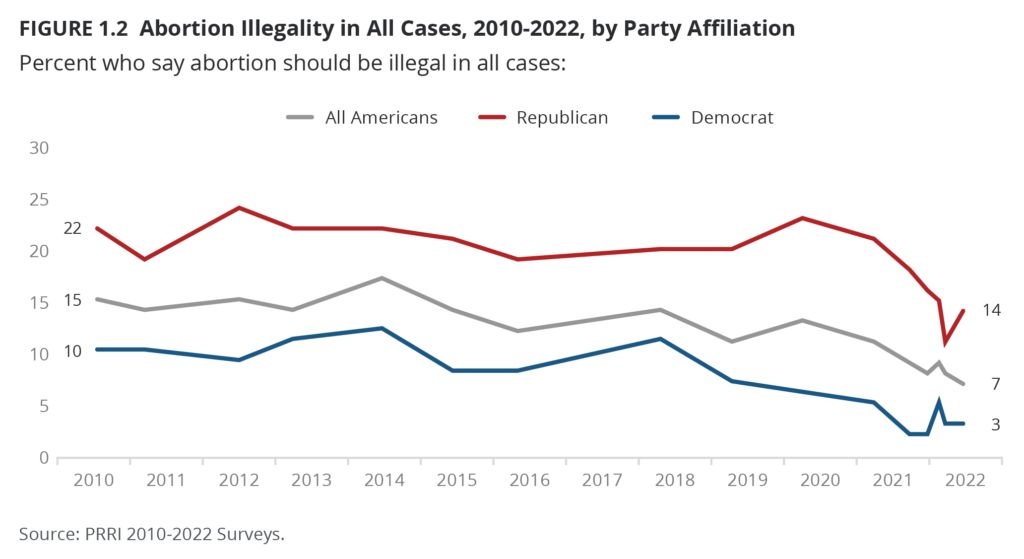
Looking at the opposing viewpoint, the share of Americans who say abortion should be illegal in most cases has been stable, but the share who say it should be illegal in all cases has declined slightly over the past year: from 11% in September 2021 to 7% in December 2022.
Shifts in Abortion Attitudes in 2022
Party Affiliation
Just under four in ten Republicans say that abortion should be legal in most or all cases (36% across 2022), while 63% say it should be illegal in most or all cases. Support for legal abortion among Republicans has mostly wavered between 30% and 40% since 2010, while support for abortion being illegal has mostly wavered between 60% and 70% since 2010.
Among Republicans, belief that abortion should be illegal in all cases has declined: in September 2021, 21% of Republicans said abortion should be illegal in all cases, compared to 14% who said the same in December 2022, after the Dobbs decision. Prior to 2022, roughly two in ten Republicans opposed abortion in all cases, a share that had held steady since at least 2010.
Republican women (17%) are about as likely as Republican men (14%) to say abortion should be illegal in all cases. However, in March 2022, 20% of Republican women believed abortion should be illegal in all cases, compared to 15% who said the same in December. Republican men’s attitudes did not shift significantly during the same time period (15% in March, 13% in December).
Nearly nine in ten Democrats want abortion to be legal in most or all cases (86% across 2022), including nearly half of Democrats (48%) who say abortion should be legal in all cases. Notably, however, support for abortion’s legality in most or all cases has gone up among Democrats, from 71% in 2010.
Throughout 2022, attitudes among Democrats overall remained relatively steady. However, the share of Democratic women who said abortion should be legal in all cases increased slightly, from 46% in March to 52% in December, while the share of Democratic men who said the same remained steady throughout 2022.
Views on abortion among independents generally mirror those of the country as a whole. Across 2022, 68% of independents said abortion should be legal in most or all cases, while 30% said it should be illegal in most or all cases. Views about abortion legality among both independent men and women remained relatively steady through the year.
Religious Tradition
Majorities of most religious groups say that abortion should be legal in most or all cases. White evangelical Protestants (27%), Jehovah’s Witnesses (27%) Latter-day Saints (32%), and Hispanic Protestants (44%) are the only major religious groups in which less than half of adherents say that abortion should be legal in most or all cases. By contrast, majorities of religiously unaffiliated Americans (85%), Unitarian Universalists (85%), Jewish Americans (79%), Buddhists (78%), Black Protestants (72%), other Catholics of color (71%), Hindus (69%), white mainline Protestants (68%), Muslims (66%), white Catholics (62%), Hispanic Catholics (61%), and other Protestants of color (53%) say that abortion should be legal in most or all cases.[4]
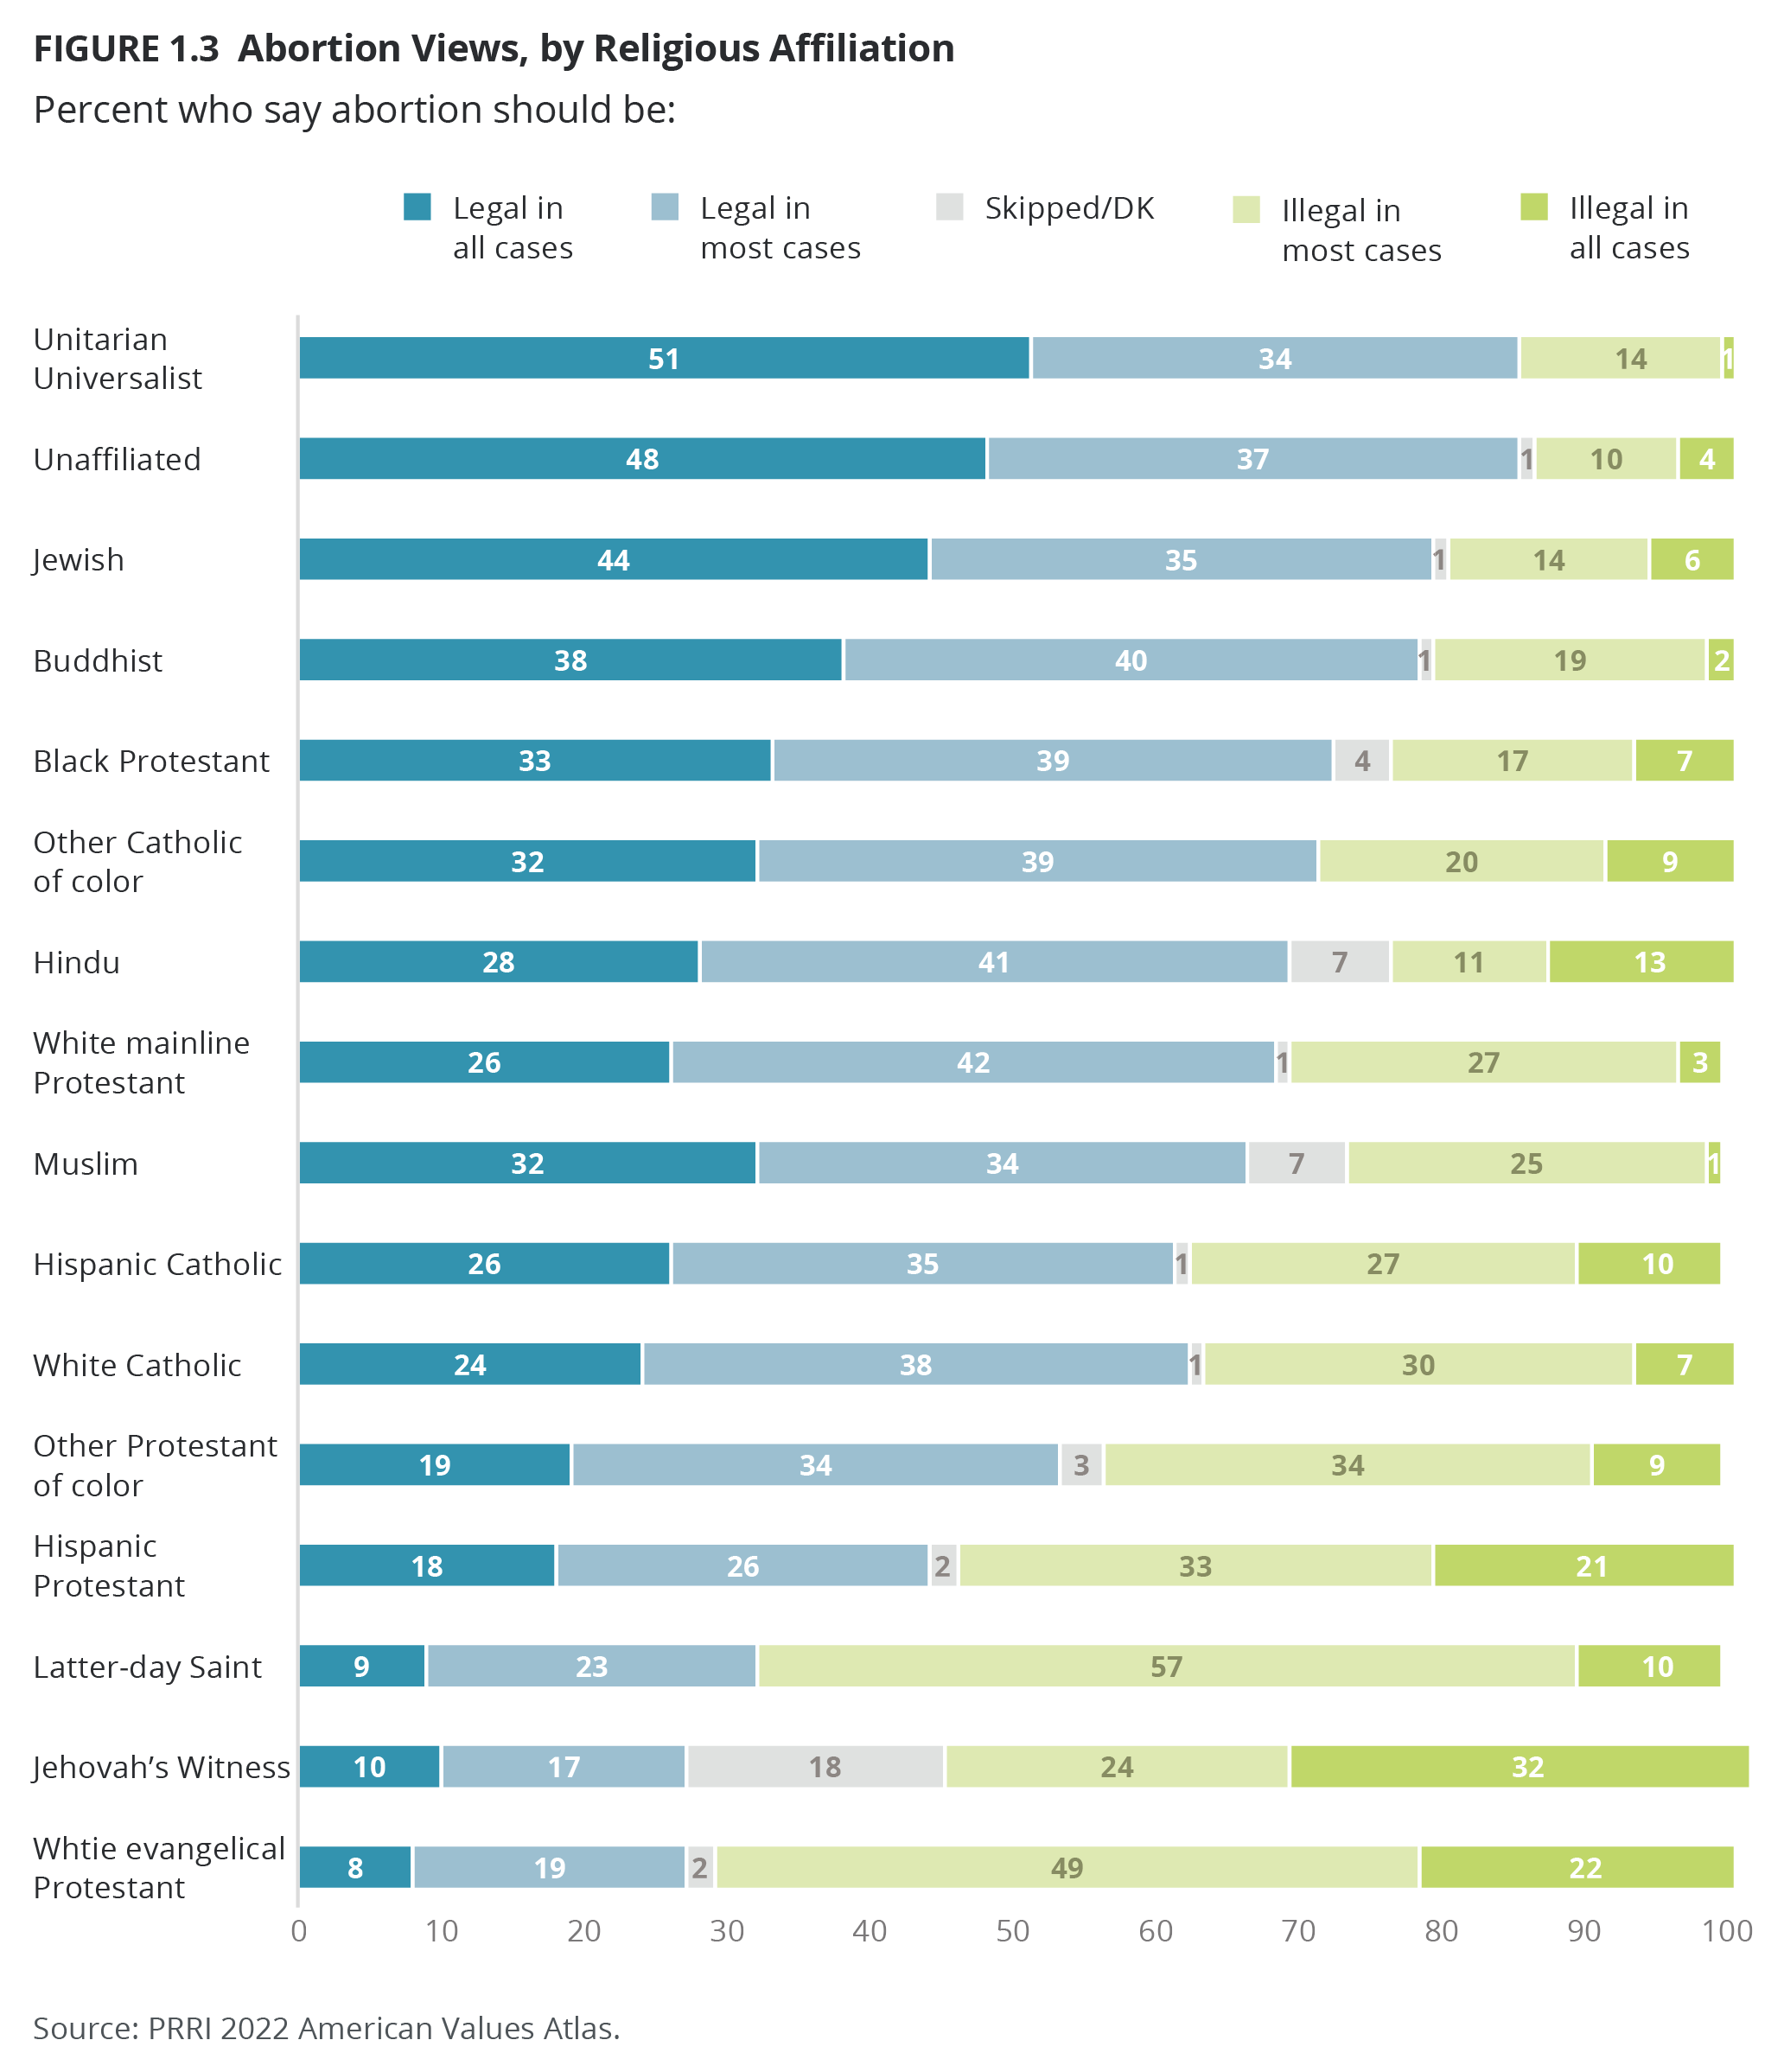
Throughout 2022, attitudes toward abortion remained relatively steady within most major religious groups, with two key exceptions: Hispanic Catholics and Black Protestants. Both of these groups grew more likely to support legal abortion in the latter half of the year. Among Hispanic Catholics, support for legal abortion in all cases nearly doubled, from 16% in March to 26% in June and 27% in August, reaching a peak of 31% in December. The share of Hispanic Catholics who say abortion should be legal in most cases decreased, from 41% in March to 32% in December. Similarly, support among Black Protestants for abortion being legal in all cases grew from 28% in March and 27% in June to 38% in August and 37% in December. The share of Black Protestants who say abortion should be legal in most cases declined, from 45% in March to 38% in December. For both groups, this pattern appears to be similar among both men and women.
Race and Ethnicity
Majorities of Asian American Pacific Islander (AAPI) (75%), Black (73%), multiracial (66%), white (62%), and Hispanic Americans (60%), and Americans of other races (58%) say that abortion should be legal in most or all cases. Views among racial and ethnic groups remained relatively steady throughout 2022.
Education
Majorities of Americans of all levels of formal education believe that abortion should be legal in most or all cases. This includes 55% of those with a high school degree or less, 64% of those with some college experience but no four-year degree, 71% of those with a four-year degree, and 75% of those with a postgraduate degree. Throughout 2022, there were only minimal shifts along education lines in attitudes toward abortion.
Gender and Sexual Orientation
Roughly similar shares of men (62%) and women (65%) say that abortion should be legal in most or all cases. Women are slightly more likely than men to say that abortion should be legal in all cases (32% vs. 27%). Fewer than one in ten men (8%) or women (9%) say that abortion should be illegal in all cases.
LGBTQ Americans have one of the highest levels of support for legal abortion. More than eight in ten LGBTQ Americans (83%) say abortion should be legal in most or all cases, including a slim majority (51%) who say abortion should be legal in all cases. Cisgender heterosexual Americans are less likely to say abortion should be legal in most or all cases (63%) and are almost half as likely as LGBTQ Americans to say it should be legal in all cases (28%).
Age
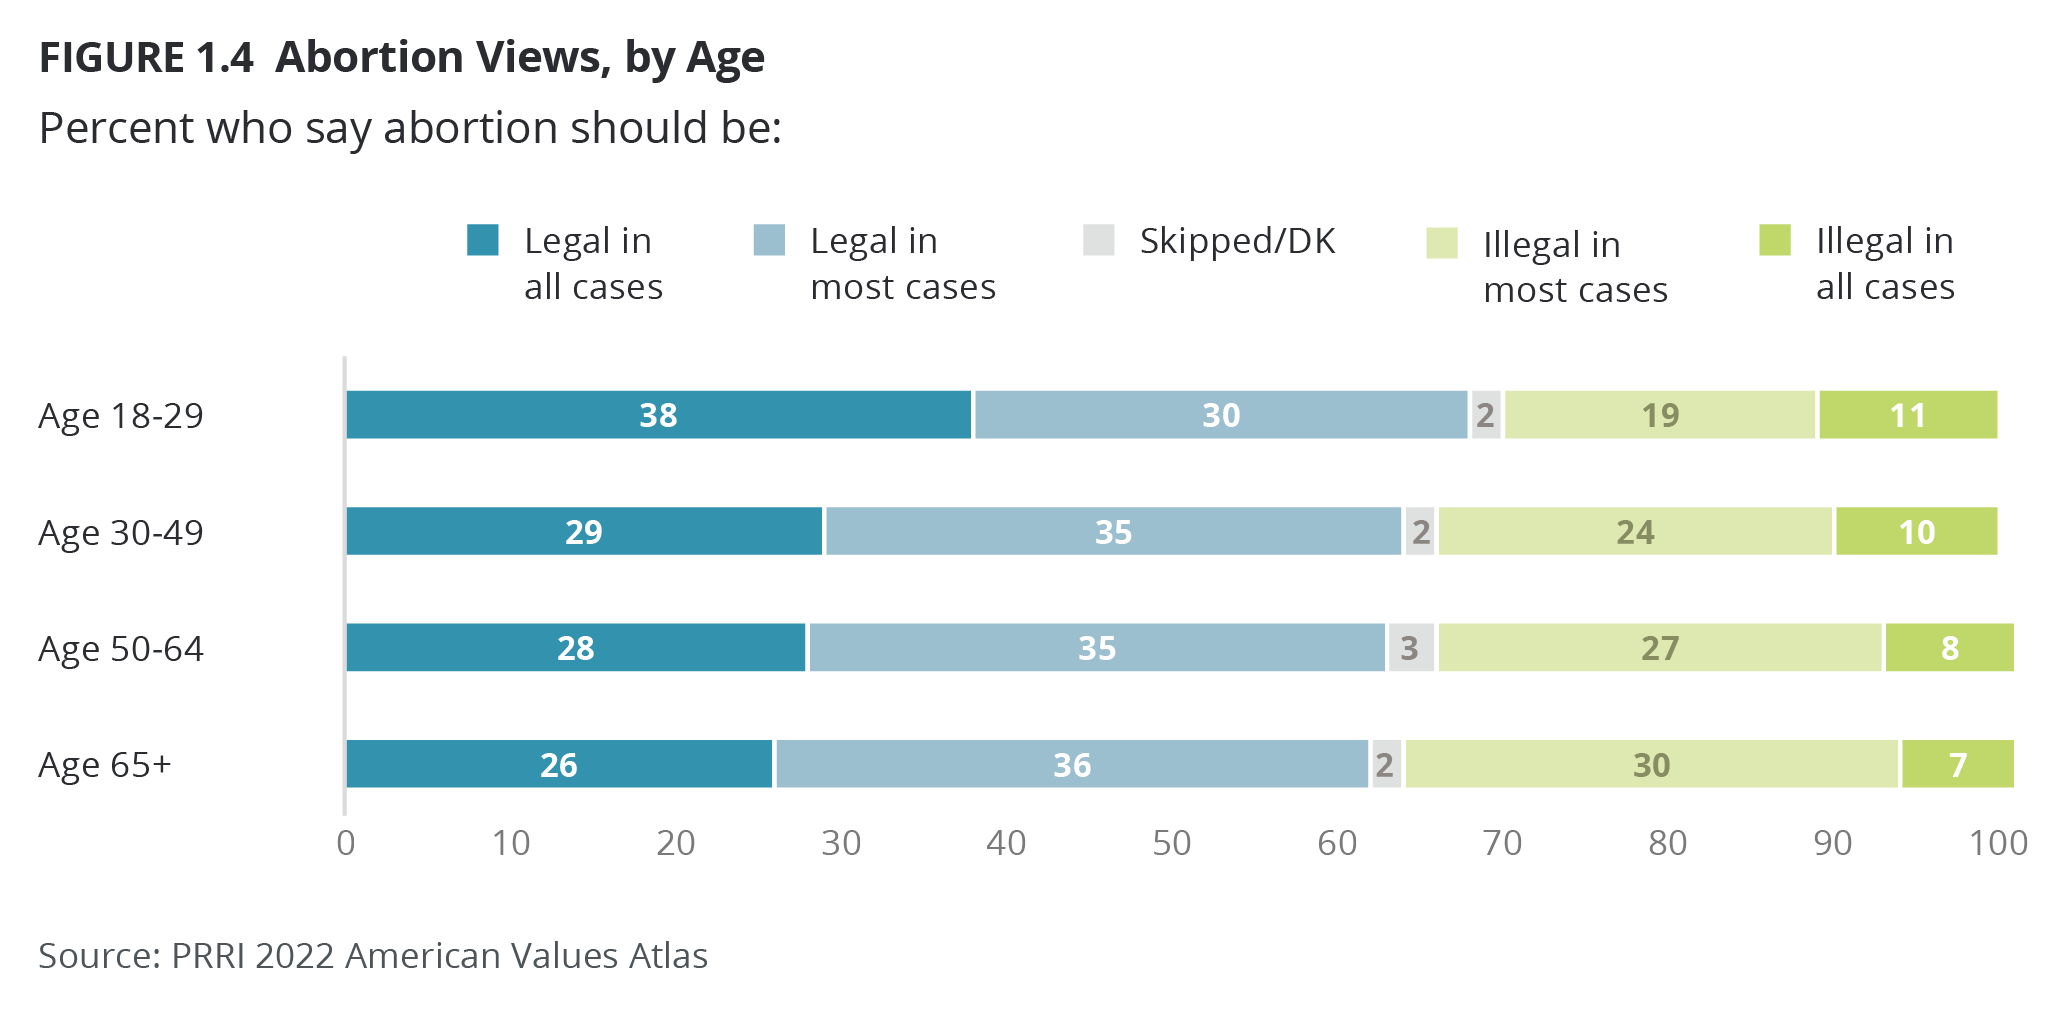
At least six in ten Americans of all age groups say that abortion should be legal in most or all cases, including 68% of young Americans ages 18 to 29, 64% of those ages 30 to 49, 63% of those ages 50 to 64, and 62% of those age 65 and over. Young women are more likely than young men to say that abortion should be legal in most or all cases (71% vs. 65%), whereas there are not large gender differences in other age groups.
Interestingly, younger Americans are more polarized on the topic of abortion. Americans ages 18 to 29 are the age group most likely both to say that abortion should be legal in all cases (38%) and that it should be illegal in all cases (11%).
Geography
Majorities of residents in 43 states and the District of Columbia say that abortion should be legal in most or all cases, and in 13 of those states and in DC, more than seven in ten residents support legal abortion. There are only seven states in which less than half of residents say abortion should be legal in most or all cases: South Dakota (42%), Utah (42%), Arkansas (43%), Oklahoma (45%), Idaho (49%), Mississippi (49%), and Tennessee (49%). Residents of nearly all states have become more likely to say abortion should be legal in most or all cases since PRRI’s last state-level data analysis, in 2018.
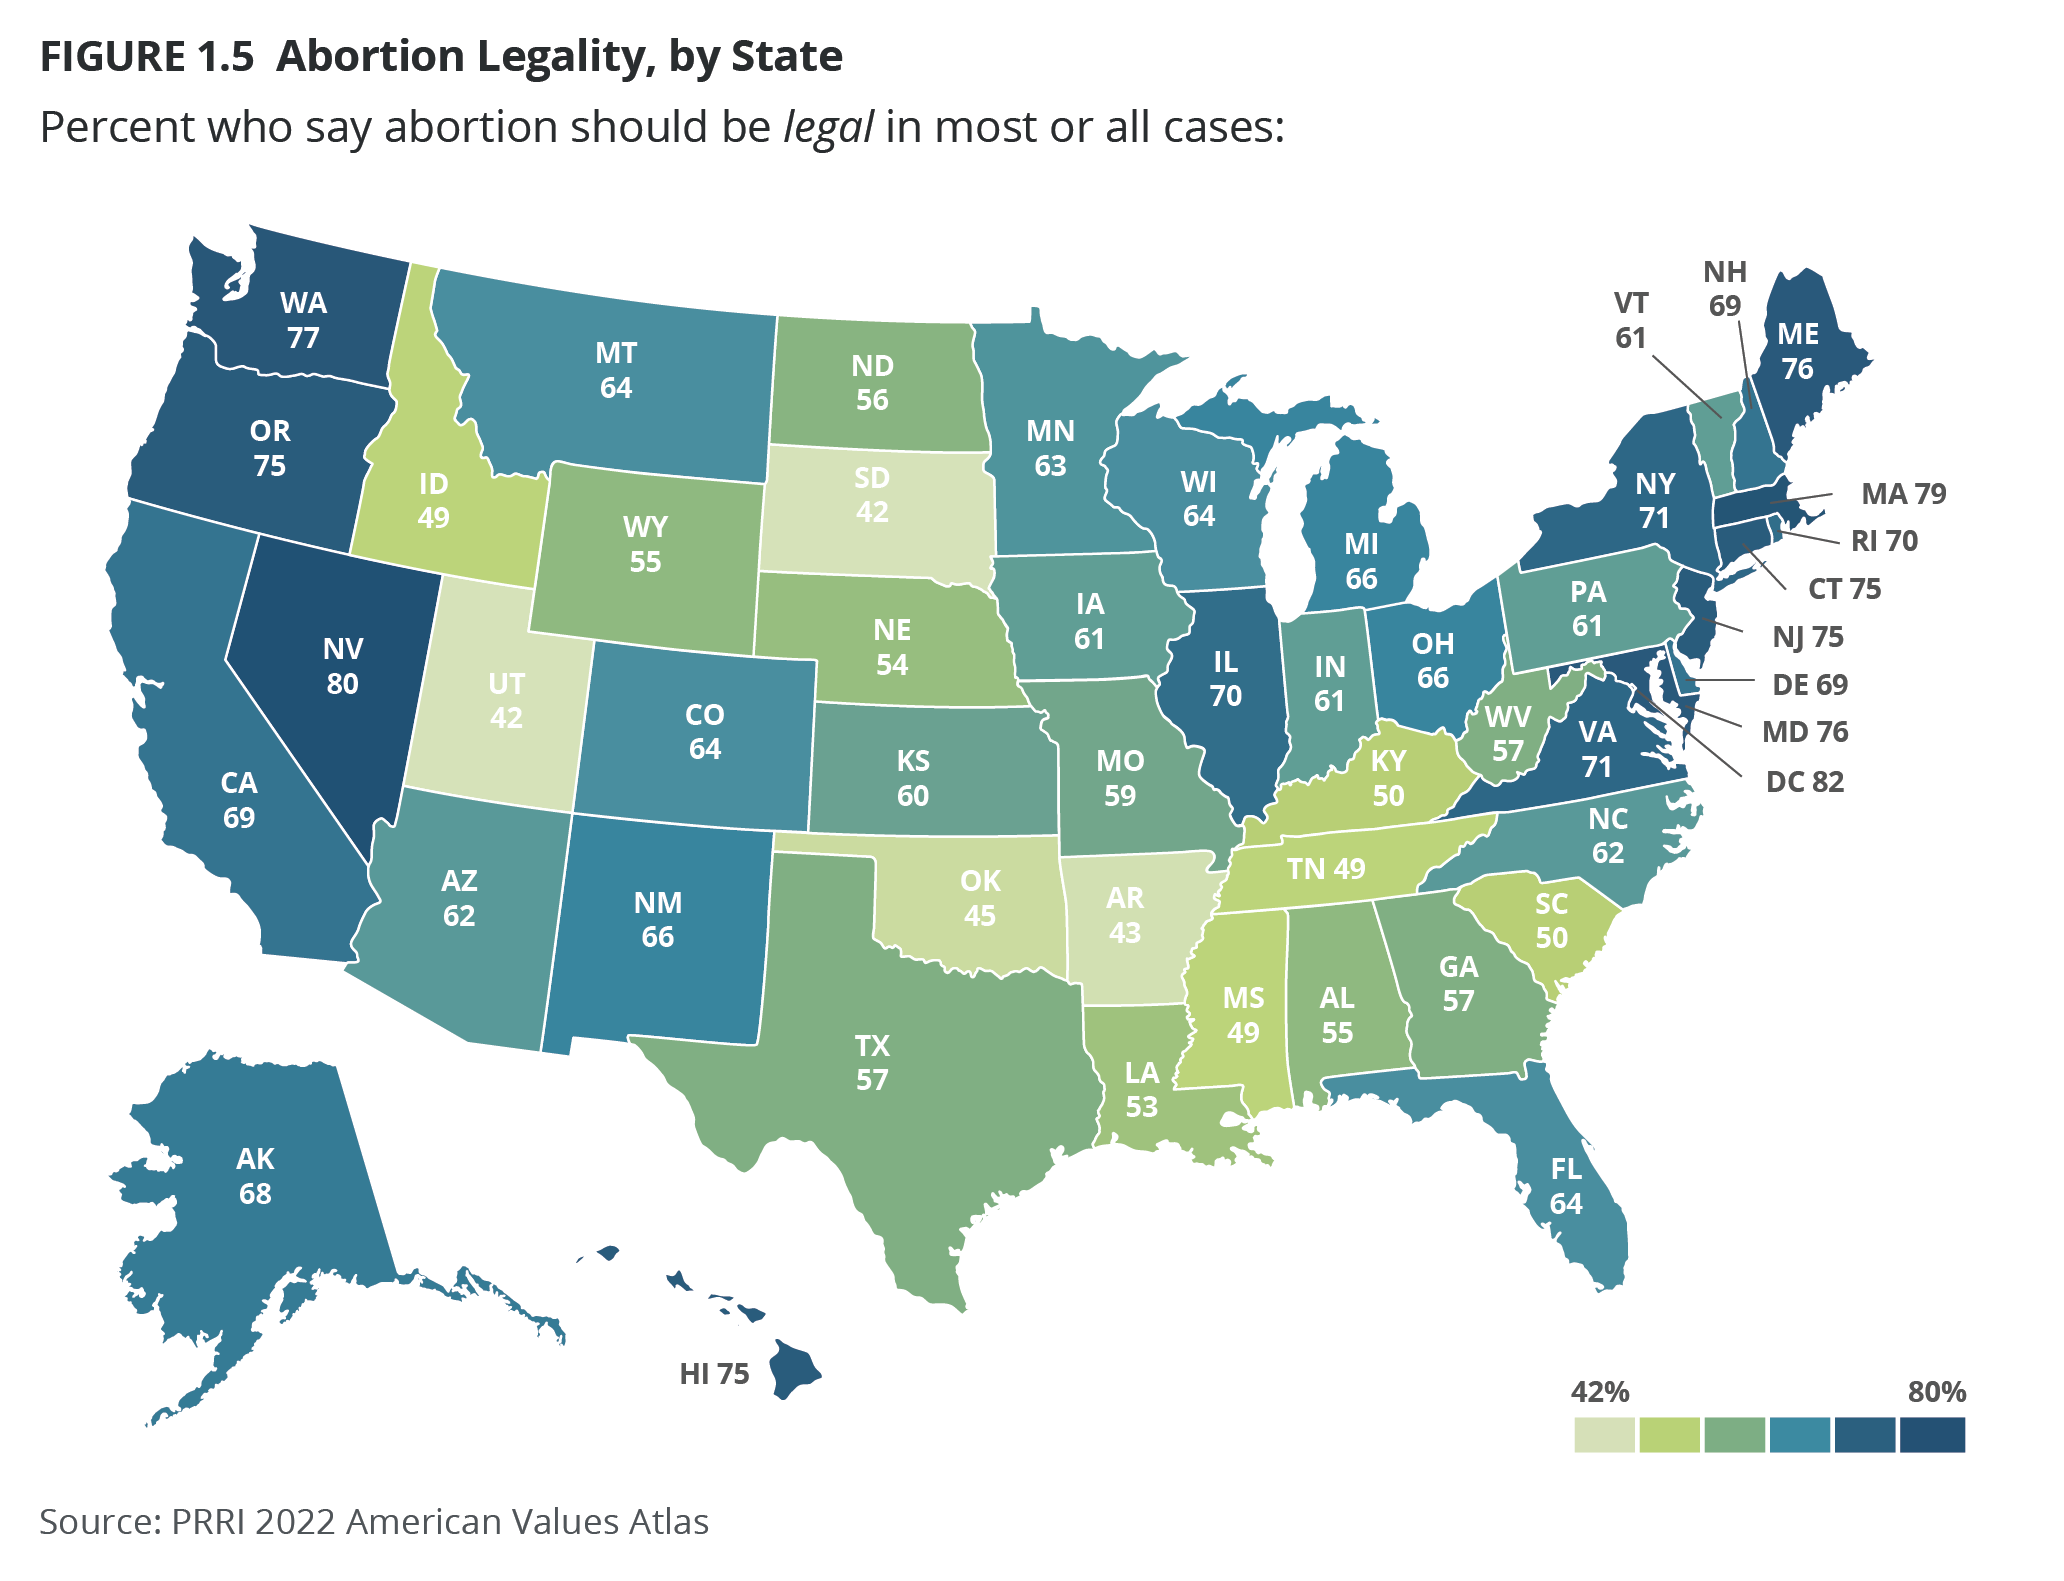
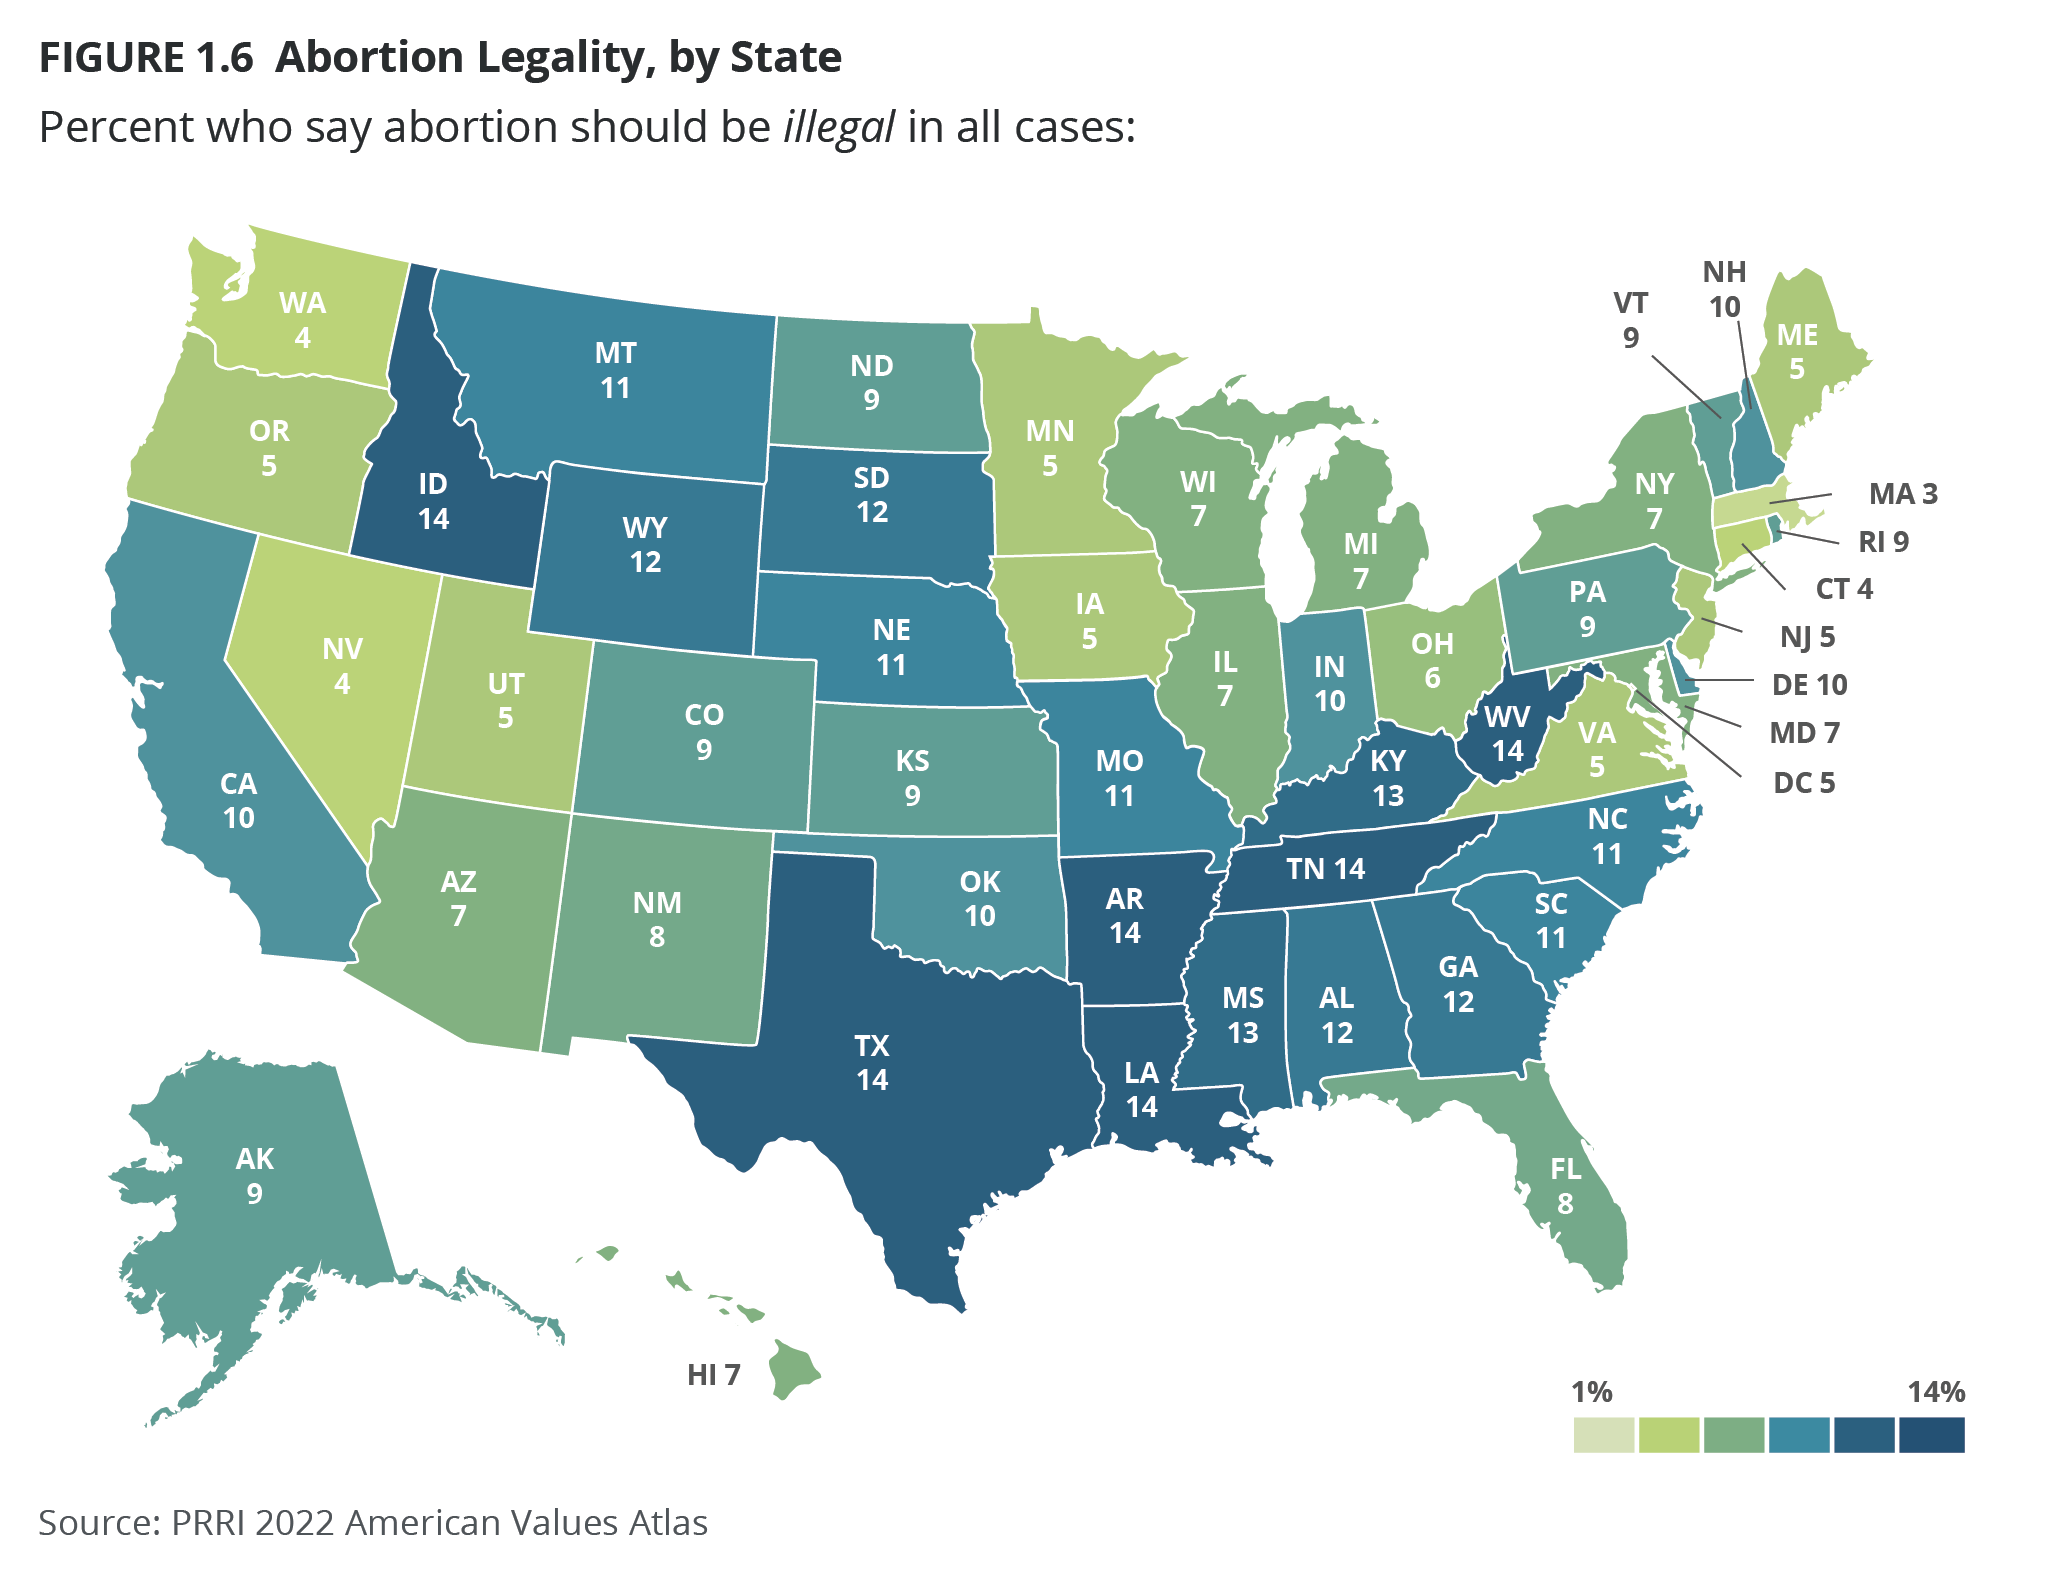
Roughly one in ten residents in most states say abortion should be illegal in all cases, and this belief is most common in Texas, West Virginia, Louisiana, Idaho, Tennessee, and Arkansas (14% for all).
Views of Overturning Roe v. Wade
In 2022, just one-third of Americans (34%) favored overturning Roe v. Wade, while 63% opposed it, including a 44% plurality who strongly opposed overturning the ruling.[5] Strong opposition to overturning Roe increased throughout 2022, going from 39% in March to 42% in June and 50% in August before receding slightly, to 46%, in December.
Party Affiliation
A majority of Republicans (58%) favor overturning Roe, compared to significantly smaller shares of independents (32%) and Democrats (18%). Just over one-third of Republicans (35%) say they strongly favor overturning Roe, compared to just 15% of independents and 8% of Democrats who say the same.
Through the year, the share of Republicans who strongly favored overturning Roe grew, particularly after the release of the Dobbs decision. In March, 26% of Republicans strongly favored an overturn, compared to 30% in June, 44% in August, and 40% in December.
The opposite pattern exists among Democrats. In March, 56% of Democrats strongly opposed overturning Roe, which increased to 62% in June and 74% in August before declining slightly, to 69%, in December. A similar but less pronounced pattern exists among independents. In March, 37% of independents strongly opposed overturning Roe, which increased slightly in June (43%) and August (51%) before dropping slightly in December (47%).
Religious Tradition
With the notable exception of white evangelical Protestants (61%) and Latter-day Saints (52%), less than half of all major religious groups support overturning Roe v. Wade. This includes 41% of other Protestants of color, 37% of Hispanic Protestants, 37% of Hispanic Catholics, 36% of white Catholics, 35% of other Catholics of color, 34% of white mainline Protestants, 28% of Black Protestants, 28% of Jehovah’s Witnesses, 28% of Buddhists, 25% of Hindus, 24% of Muslims, 23% of Jewish Americans, 21% of religiously unaffiliated Americans, and 16% of Unitarian Universalists. These shares remained relatively steady across 2022.
Race and Ethnicity
Roughly one-third of white Americans (36%), multiracial Americans (36%), and Hispanic Americans (33%) and around a quarter of AAPI (29%) and Black Americans (26%) favor overturning Roe. For white, Black, Hispanic, and AAPI groups, strong opposition generally increased between March and August before declining or leveling out by December.
Education
Americans with a postgraduate degree (27%) and those with a four-year college degree (29%) are somewhat less likely than those with some college experience but no degree (37%) or a high school degree or less (38%) to favor overturning Roe.
Men with at least a four-year college degree (33%) are much more likely than women with at least four-year college degree (23%) to favor overturning Roe. Differences between men (41%) and women (34%) without four-year degrees are much smaller.
Gender and Sexual Orientation
Men (37%) are more likely than women (30%) to favor overturning Roe. Women are correspondingly more likely to oppose overturning the ruling (66% vs. 60%) and to strongly oppose the overturn (48% vs. 40%).
LGBTQ Americans are significantly less likely than cisgender heterosexual Americans to favor overturning Roe (19% vs. 35%), and nearly two-thirds of LGBTQ Americans strongly oppose overturning Roe (65%), compared to four in ten heterosexual Americans (42%).
Age
Fewer than four in ten Americans of all age cohorts support overturning Roe, though support increases slightly with age. Support for overturning the decision is at 30% among Americans ages 18 to 29, 33% among those ages 30 to 49, 35% among those ages 50 to 64, and 37% among Americans over age 65.
Geography
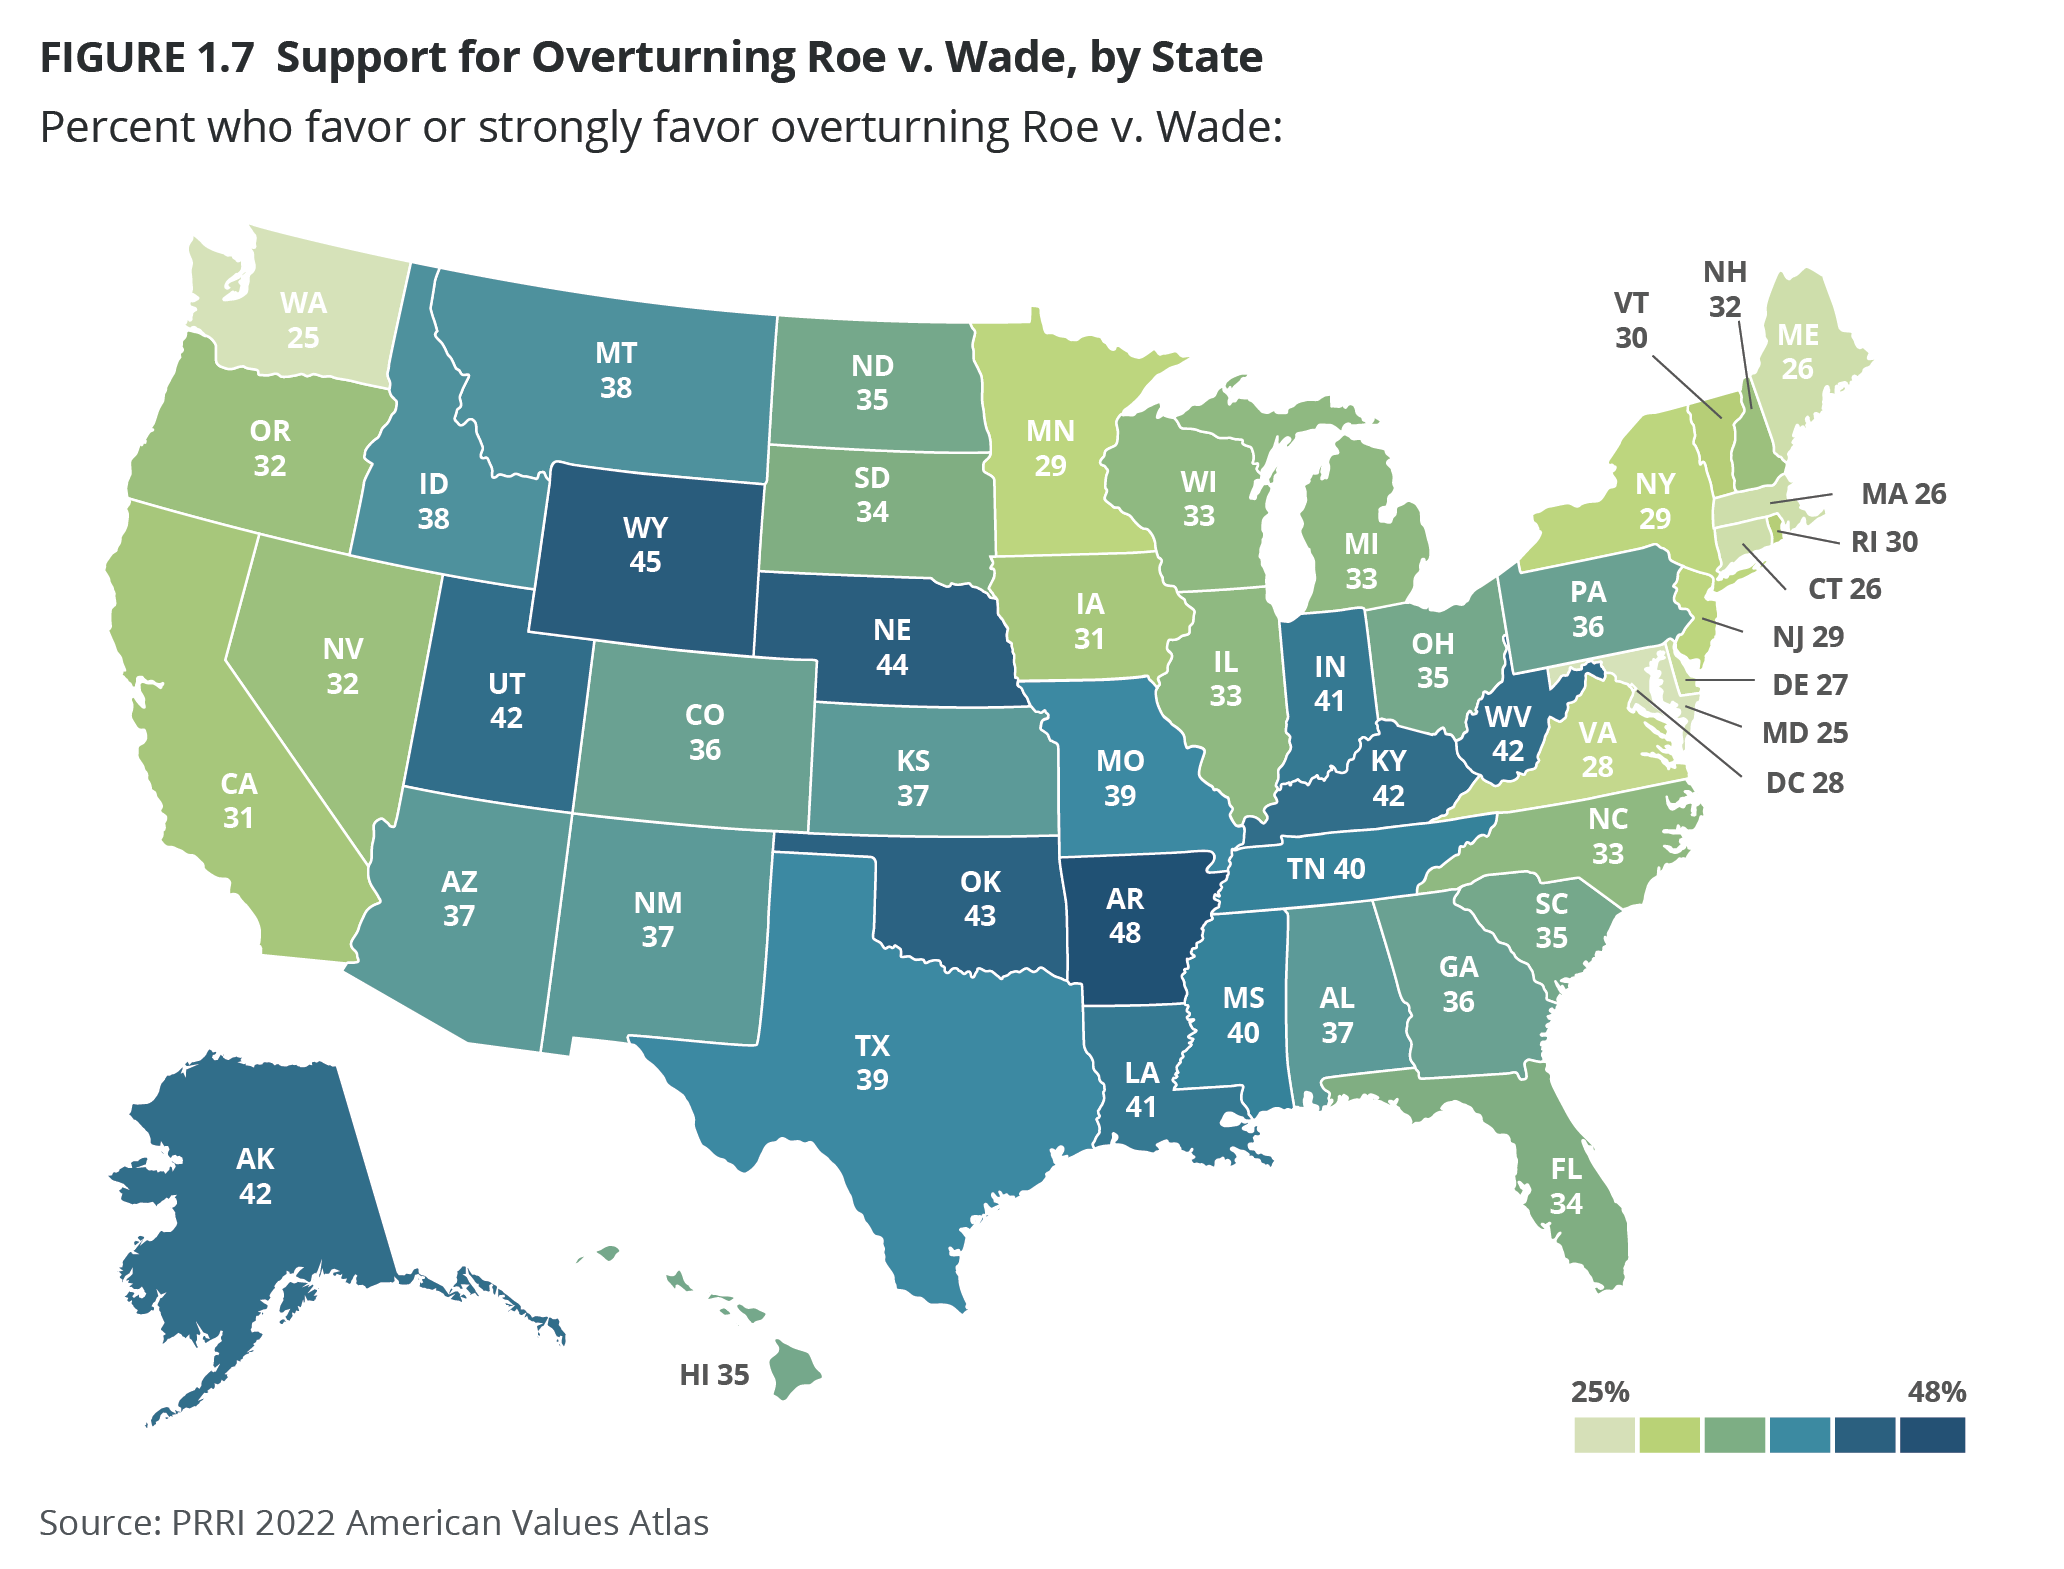
Less than half of the residents of every state and the District of Columbia support overturning Roe v. Wade. Support for overturning Roe is lowest in states in the northeast and mid-Atlantic, and highest in midwestern and southern states.
Knowledge of State-Level Abortion Policy Post-Roe
Overturning Roe effectively sent policy-making power on abortion back to the states. Before the Dobbs decision PRRI started tracking whether Americans knew what would happen in their state if Roe was overturned. After the Dobbs decision, the survey wording was changed to “Now that the Supreme Court has overturned Roe v. Wade, the 1973 Supreme Court decision that affirmed a constitutional right to abortion, to the best your knowledge, is abortion still legal in your state, now illegal in your state, or are you not sure?”
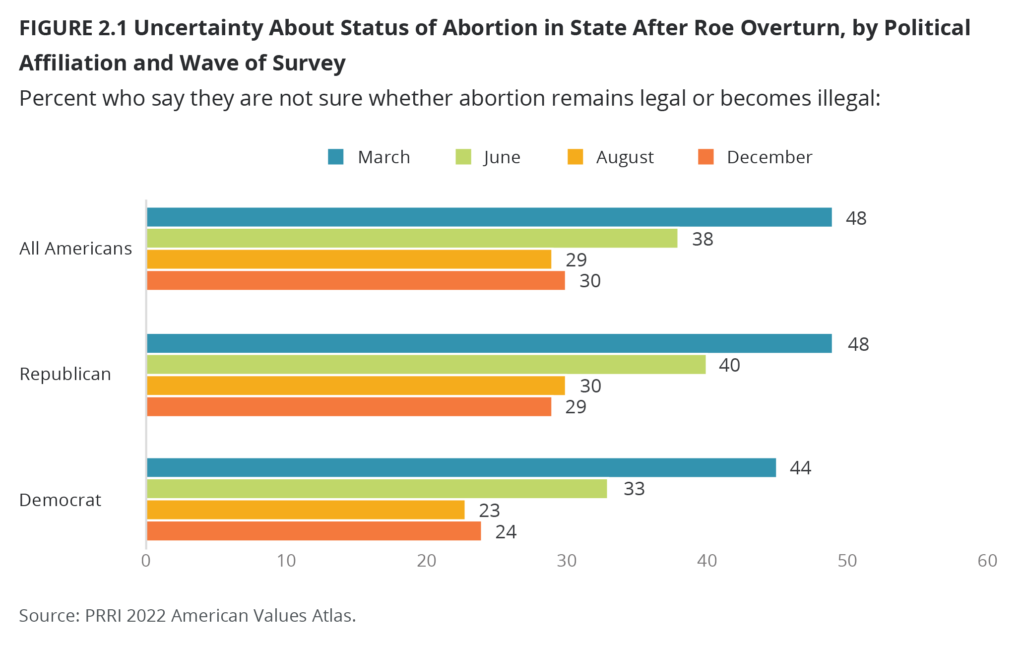
Americans’ uncertainty about what would happen regarding abortion’s legality in their state decreased after the Dobbs decision. In the March wave of the American Values Atlas, nearly half of respondents (48%) said they did not know what the status of abortion law in their state would be in a post-Roe world. That declined to 38% in the June wave, and then dropped to 29% in August and 30% in December.
Since the legal status of abortion differs by state, demographic splits on whether Americans know if abortion is legal in their state largely correlate with where people live. Across the entire year, Republicans went from 48% unsure in March to 29% unsure in December, while independents went from 50% to 31% unsure and Democrats went from 44% to 24% unsure over the same time period.
There are also pronounced differences by religious affiliation. Interestingly, nearly half of Jehovah’s Witnesses (49%) and Hispanic Catholics (46%) say they are not sure if abortion is still legal in their state, as do 41% of Black Protestants, 40% of Latter-day Saints, 39% of Hispanic Protestants, 38% of members of other non-Christian religions, 38% of other Catholics of color, 36% of white evangelical Protestants, 34% of white mainline Protestants, 31% of the religiously unaffiliated, 31% of white Catholics, 30% of Buddhists, 27% of other Protestants of color, 24% of Jewish Americans, and only 18% of Unitarians. Religious groups also followed the general pattern of becoming less uncertain about the post-Roe status of abortion in their state over the course of the year.
Hispanic Americans (43%) and Black Americans (41%) are more likely than white Americans (32%), AAPI (28%), and multiracial Americans (27%) to report that they are not sure if abortion is legal or illegal in their state. Whites without a college degree are notably more likely than whites with a college degree to report that they are not sure if abortion is still legal in their state (39% vs. 21%). As with the other demographic groups, there was less uncertainty about the post-Roe status of abortion at the state level by the end of the year among Americans across racial/ethnic backgrounds and education levels.
There are not notable differences by age on this question, but there are by gender, as well as by age among women. Women are more likely than men to say that they are not sure if abortion is legal or illegal in their state (37% vs. 32%). The effect was much more pronounced in the early part of the year, when 52% of women and 44% of men reported not knowing. By June, 42% of women and 34% of men still said they were not sure, and in August the numbers dropped further, to 31% of women and 27% of men. In the December wave of the survey, the gap nearly disappeared: 31% of women and 29% of men said they did not know the legal status of abortion in their state. Notably, in the March wave young women (ages 18-29) were 20 percentage points less likely than women 65 and over to say they didn’t know the post-Roe status of abortion (41% vs. 61%), but by the end of the year there was not a difference in knowledge levels among women by age.
Voting: Impact of a Candidate’s View on Abortion
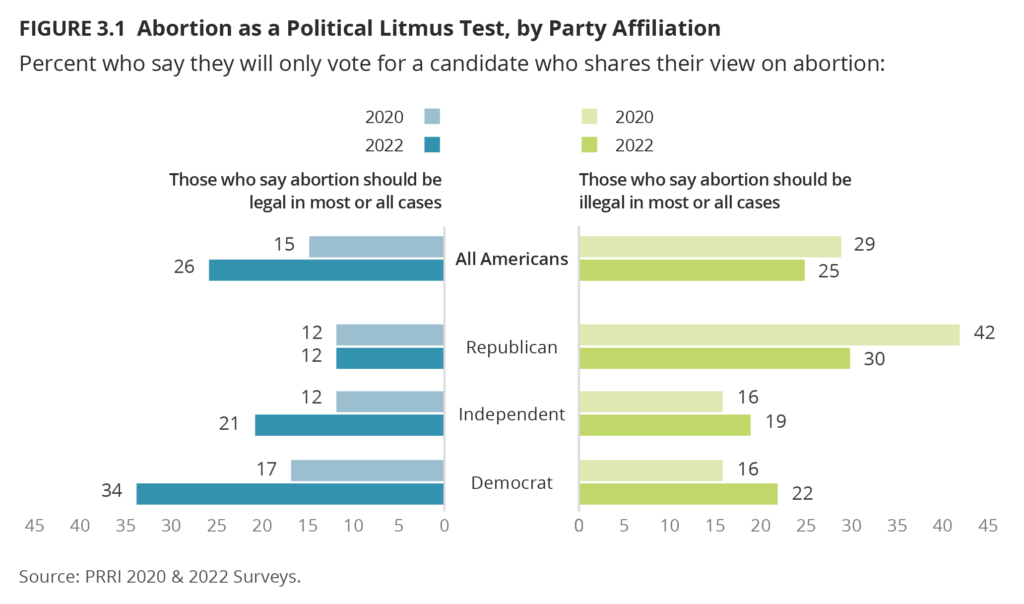
One in four Americans (25%) say they will only vote for a candidate who shares their views on abortion, compared with a slim majority of Americans (52%) who say a candidate’s position on abortion is just one of many important factors and 20% who do not see abortion as a major issue when voting. There were not significant changes in these numbers throughout the year, though the question was not included on the March wave. The proportion of Americans who say a candidate must share their views has increased from 18% in 2012 and 20% in 2020. The proportion who do not see abortion as a major issue went down, from 33% in 2012 to 26% in 2020 and 20% in 2022.
Among Americans who say that abortion should be legal in most or all cases, 26% say they will only vote for candidates who share their views on abortion. Notably, among this group, Democrats (34%) are nearly three times as likely as Republicans (12%) and significantly more likely than independents (21%) to say that they will only vote for candidates who share their views on abortion. Republicans in this group have remained steady compared to 2020 (12%), but Democrats have doubled in this opinion (17% in 2020). Independents in this group have become nine percentage points more likely to say they will only vote for a candidate who shares their abortion views (21% vs. 12% in 2020).
On the other side of the issue, 25% of Americans who say that abortion should be illegal in most or all cases say they will only vote for candidates who share their views on abortion. In this group, however, Republicans (30%) are more likely than Democrats (22%) and independents (19%) to say that they will only vote for candidates who share their views on abortion. In 2020, these numbers were significantly higher among Republicans (42%), but slightly lower among independents and Democrats (both 16%).
When looking at these trends by religious affiliation, among Americans who say that abortion should be legal in most or all cases, Jewish Americans (38%) are the most likely to say that they will only vote for candidates who share their views on abortion, while 32% of religiously unaffiliated Americans, 29% of Hispanic Protestants, 29% of members of other non-Christian religions, 27% of Hispanic Catholics, and 26% of Black Protestants say the same. By contrast, white Christians in this group are less likely to express this view, including white Catholics (22%), white mainline Protestants (20%), white evangelical Protestants (15%), other Catholics (21%), and other Protestants of color (16%).
Among those who say abortion should be illegal in most or all cases, Hispanic Protestants (36%) and white evangelical Protestants (34%) are the most likely to say that they will only vote for candidates who share their views on abortion. Nearly three in ten other Protestants of color (28%) say the same, as do 24% of Black Protestants, 23% of Latter-day Saints, 23% of white Catholics, and 22% of Hispanic Catholics. Less than one in five religiously unaffiliated Americans (17%) and white mainline Protestants (15%) who say abortion should be illegal in most or all cases say a candidate must share that view.[6]
Demographics
Among those who say abortion should be legal, 32% of multiracial Americans, 27% of Hispanic Americans, 26% of Black Americans, 26% of white Americans, and 19% of AAPI say they will only vote for candidates who share their views on abortion. Whites with a college degree are significantly more likely than whites without a college degree to express this view (30% vs. 23%).
Among those who say abortion should be illegal, 34% of multiracial Americans, 25% of Hispanic Americans, 25% of Black Americans, 25% of white Americans, and 18% of AAPI say they will only vote for candidates who share their views on abortion. Whites with a college degree are significantly more likely than whites without a college degree to express this view (27% vs. 22%).
Among those who say abortion should be legal, young Americans ages 18-29 (31%) are notably more likely than older Americans ages 50-64 (24%) and ages 65 or over (22%) to say that they will only vote for candidates who share their views on abortion, but they do not differ significantly from Americans ages 30-49 (28%). Women are notably more likely than men to say that they will only vote for candidates who share their views on abortion (29% vs. 22%). This is true across all ages, but young women are particularly likely to express this view: women ages 18-29 (34%) and ages 30-49 (32%) are more likely than women ages 50-64 (27%), and 65 and over (24%) to say this. Among men who say that abortion should be legal, young men ages 18-29 (28%) are more likely than men ages 30-49 (23%), ages 50-64 (20%), and ages 65 and over (20%) to say that they will only vote for candidates who share their views on abortion.
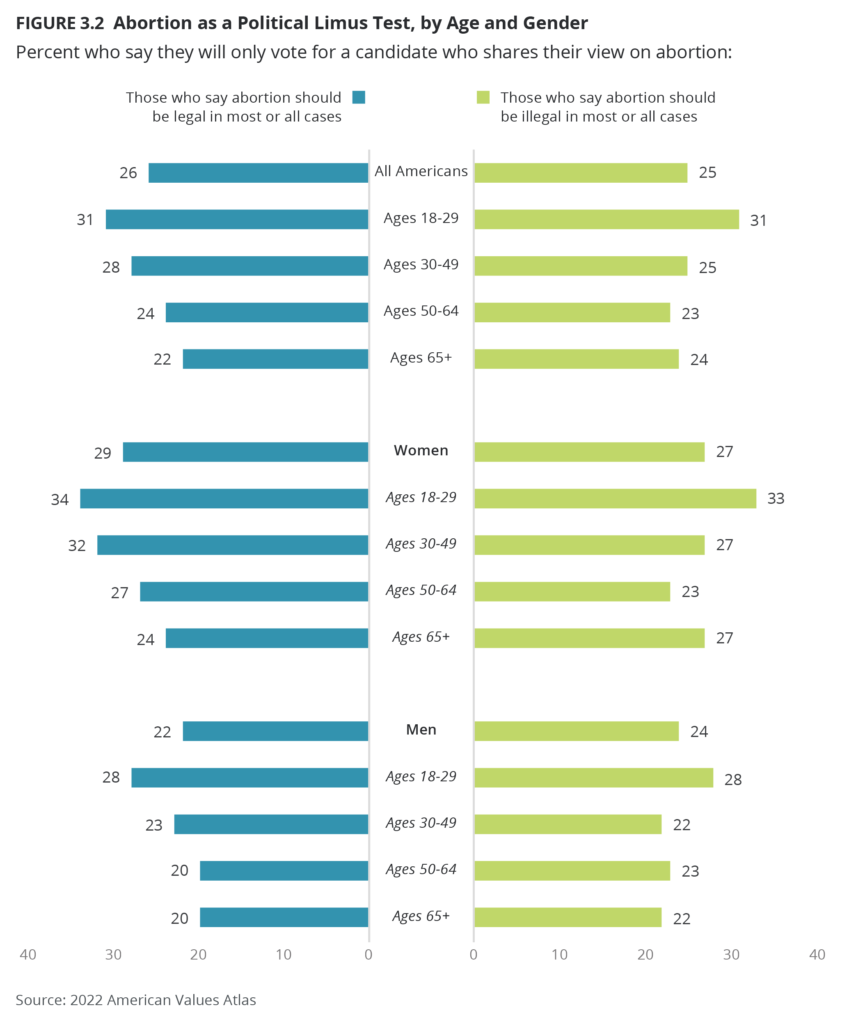
Among those who say abortion should be illegal, young Americans ages 18-29 (31%) are notably more likely than Americans ages 30-49 (25%), ages 50-64 (23%) and ages 65 or over (24%) to say that they will only vote for candidates who share their views on abortion. Women in this group are slightly more likely than men to say that they will only vote for candidates who share their views on abortion (27% vs. 24%). This is true across all ages, but young women are particularly likely to express this view: women ages 18-29 (33%) and ages 30-49 (27%) are more likely than women ages 50-64 (23%), and women ages 65 and over (27%) to say this. Among men who say that abortion should be illegal, those ages 18-29 (28%) are more likely than men ages 30-49 (22%), ages 50-64 (23%), and ages 65 and over (22%) to say that they will only vote for candidates who share their views on abortion.
Views on Abortion Policies
In addition to asking Americans questions related to abortion legality, the overturn of Roe, knowledge about the status of abortion laws in their state, and the role of abortion in voting decisions, PRRI also commissioned a stand-alone survey in late June, right after the Dobbs decision was handed down, in which 2,523 Americans were asked about specific abortion policies. State-level analysis is not available for these questions, as they were only included one time.
Views On Congress Making Abortion Policy
A majority of Americans (53%) say Congress should pass a national law preserving a right to abortion, compared with 12% who say Congress should pass a national law banning abortion. About one-third (32%) say abortion law should be left to the states.
The vast majority of Democrats (78%), a slim majority of independents (54%), and 21% of Republicans say Congress should pass a national law preserving a right to abortion, compared with 22% of Republicans, 10% of independents, and just 5% of Democrats who say Congress should pass a national law banning abortion. Republicans (54%) are notably more likely than independents (34%) and Democrats (16%) to say abortion laws should be left to the states.
At least half of most religious groups say Congress should pass a national law preserving a right to abortion, including 73% of members of non-Christian religions, 72% of religiously unaffiliated Americans, 60% of Black Protestants, 56% of white mainline Protestants, 55% of Hispanic Catholics, and 50% of white Catholics. One-third of other Christians (34%) and only 16% of white evangelical Protestants express the same opinion. By contrast, white evangelical Protestants (28%) and other Christians (21%) are the religious groups most likely to say Congress should pass a national law banning abortion, compared with 12% of Hispanic Catholics, 11% of Black Protestants, 10% of white Catholics, 5% of white mainline Protestants, 5% of members of non-Christian religions, and 4% of unaffiliated Americans. White evangelical Protestants (52%) stand as the only religious group in which a majority say abortion law should be left to the states.
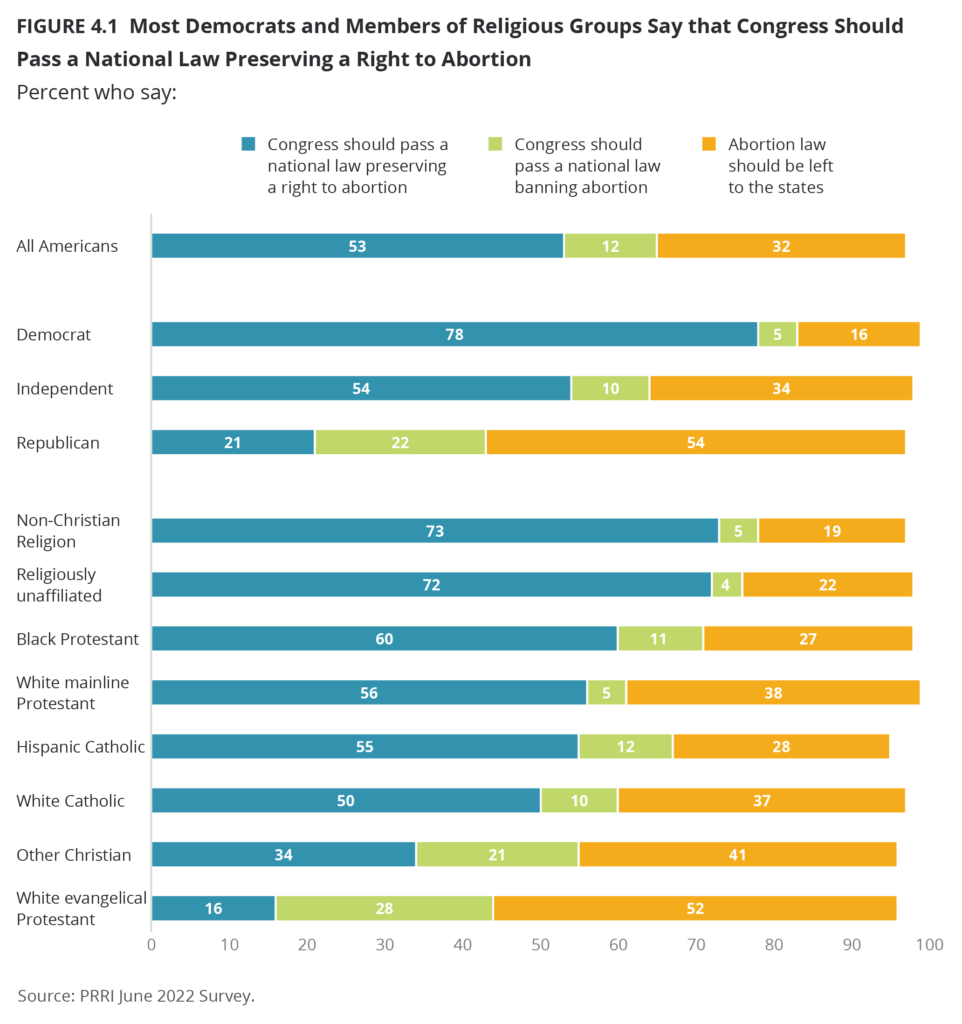
There are modest differences across racial groups on whether Congress should pass a national law preserving a right to abortion, with narrow majorities of Black Americans (58%), multiracial and other-race Americans (56%), white Americans (51%), and Hispanic Americans (51%) supporting such a law. Hispanic Americans (15%) are about twice as likely as multiracial and other-race Americans (8%) to say that Congress should pass a national law banning abortion, but they don’t differ meaningfully from white Americans (12%) and Black Americans (11%) on this question. About one-third of white Americans (34%) and multiracial and other-race Americans (32%), along with about three in ten Black Americans (28%) and Hispanic Americans (28%), say abortion law should be left to the states.
White Americans with a college degree are more likely than white Americans without a college degree to say that Congress should pass a national law preserving a right to abortion (60% vs. 46%). And they are less likely to say that Congress should pass a national law banning abortion (7% vs. 14%) or that abortion law should be left to the states (31% vs. 36%).
Americans under 50, including Americans ages 18-29 and ages 30-49 (both 56%), are more likely than Americans over 50, including Americans ages 50-64 (47%) and 65 and over (51%), to say Congress should pass a national law preserving a right to abortion. Meanwhile, less than two in ten Americans ages 18-29 (16%) and about one in ten Americans ages 30-49 (11%), ages 50-64 (11%) and 65 and over (10%) say Congress should pass a national law banning abortion. Americans over 50, including Americans ages 50-64 (39%) and 65 and older (37%), are more likely than Americans under 50, including those ages 18-29 (25%) and ages 30-49 (29%), to say that abortion law should be left to the states.
While women are more likely than men to say that Congress should pass a national law preserving a right to abortion (55% vs. 50%), and less likely to say that abortion law should be left to the states (29% vs. 36%), equal percentages of men and women (12% each) say that say Congress should pass a national law banning abortion.
Abortion Pills
About one in four Americans (26%) favor laws that make it illegal to use or receive through the mail FDA-approved drugs for a medical abortion, also known as the abortion pill. About seven in ten Americans (72%) oppose such laws.
Republicans (43%) are notably more likely than independents (21%) and Democrats (15%) to favor laws that make it illegal to use abortion pills or receive them through the mail.
With the exception of white evangelical Protestants (50%), less than half of all groups across race, gender, education, and age categories favor making it illegal to use or receive through the mail FDA-approved drugs for a medical abortion.
Support for Abortion Ban Policies
Majorities of Americans support abortion access in a variety of situations.
- A majority of Americans favor ensuring that at least some health care professionals in their community provide legal abortions (70% favor vs. 26% oppose).
- A slim majority of Americans oppose restrictions that make it illegal to obtain an abortion after 15 weeks of pregnancy (44% favor vs. 52% oppose).
- Six in ten oppose laws that do not allow abortion except in cases of rape, incest, or to save the life of the mother (36% favor vs. 60% oppose).
- More than six in ten oppose laws that ban abortion after a fetal heartbeat can be detected, usually around the sixth week of pregnancy (34% favor vs. 63% oppose).[7]
- More than seven in ten oppose laws that make it illegal to use or receive through the mail FDA-approved drugs for a medical abortion, also known as the abortion pill (26% favor vs. 72% oppose).
- A similar number oppose laws that do not allow abortion in any case except to save the life of the mother (25% favor vs. 72% oppose).
- Nearly three in four oppose laws that make it a felony crime to perform an abortion (23% favor vs. 74% oppose).
- More than three in four oppose laws that make it illegal to cross state lines to obtain an abortion in a state where it is legal (20% favor vs. 77% oppose).
- Eight in ten oppose laws that make it a felony crime to seek an abortion (17% favor vs. 80% oppose).
- The vast majority oppose laws that restrict what types of birth control can be used to prevent pregnancy (14% favor vs. 84% oppose).
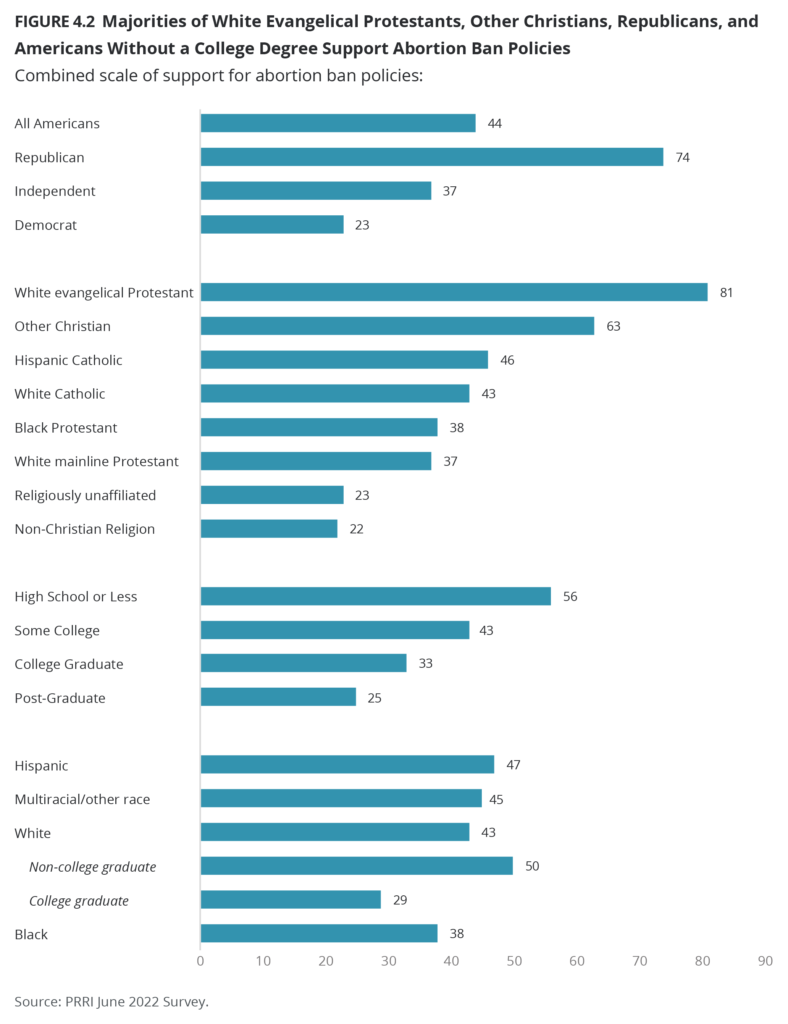
Using these ten questions, a four-point composite index was developed to measure where each respondent stands in their overall views on abortion ban policies, from strongly favor to strongly oppose.[8] According to this index, the majority of Americans oppose abortion bans, with 57% opposing and 44% favoring these policies. This includes 19% who strongly oppose and 12% who strongly favor such laws.
Not surprisingly, most Republicans (74%) favor abortion ban policies, compared with 37% of independents and 23% of Democrats.
White evangelical Protestants (81%) and other Christians (63%) are the only religious groups in which overwhelming majorities support ban policies on abortion. No other Christian group reaches majority support, including Hispanic Catholics (46%), white Catholics (43%), Black Protestants (38%), and white mainline Protestants (37%). Also, more than one in five religiously unaffiliated Americans (23%) and members of non-Christian religions (22%) support abortion ban policies.
Men and women do not differ meaningfully in their support for abortion ban policies (44% and 42%, respectively). There are also no notable differences across racial groups, including Hispanic Americans (47%), multiracial and other-race Americans (45%), white Americans (43%), and Black Americans (38%). The same is true across age groups, including young Americans ages 18-29 (40%), Americans 30-49 (41%), Americans 50-64 (46%), and Americans 65 and over (44%). However, there are notable differences by education. Support for abortion ban policies declines with higher levels of education. Support is at 56% among those with a high school degree or less, 43% among those with some college, 33% among college graduates, and 25% among those with a postgraduate degree (25%). There is similarly a notable difference between whites with a college degree (29% support) and whites without a college degree (50% support).
Religious Institutions, Leaders, and Members and Views on Abortion
Religious Beliefs and Religious Leaders’ Opinions and Their Effects on Abortion Opinions
Although many of the arguments about abortion revolve around religion, less than a third of Americans overall (31%) agree with the statement “my religious faith dictates my views on abortion.” The majority of Republicans (52%) say their opinions on abortion are dictated by their religious faith, which is much higher than both independents and Democrats (26% and 20%, respectively).
Nearly three-fourths of white evangelical Protestants (73%) use their religious beliefs to determine their opinions on abortion, which is drastically higher than any other religious group. Less than half of other Christians (47%) and one-third or less of white Catholics, Hispanic Catholics, Black Protestants, white mainline Protestants, and those who practice a non-Christian religion agree that their views on abortion are dictated by their religious faith (33%, 33%, 32%, 26%, and 20%, respectively). There is also a distinct difference between those who believe abortion should be legal and those that believe it should be illegal. Almost two-thirds (65%) of Americans who think abortion should be illegal say their religious beliefs determine that opinion, whereas only 14% of Americans that think abortion should be legal say the same.
Only 16% of Americans agree with the statement “I look to religious leaders for guidance on how to think about abortion.” Republicans are more likely than both independents and Democrats to agree with this statement (30% vs. 14% and 10%, respectively).
Nearly four in ten white evangelical Protestants (38%) and three in ten other Christians (30%) look to religious leaders for guidance on abortion issues. These religious groups are more likely than others to say this is the case, including white Catholics (20%), Black Protestants (15%), Hispanic Catholics (13%), white mainline Protestants (11%), and those who practice non-Christian religions (6%). Those who believe that abortion should be illegal are much more likely than those that believe it should be legal to say they look to religious leaders on this issue (36% vs. 7%, respectively).
Views on Whether Aligned Religious Beliefs Would Prevent Debates on Abortion
Despite the vast amount of political discourse about abortion, the majority of Americans do not believe that their own religion is the solution to these arguments. Only 31% of Americans agree with the statement “there would be no debate about abortion if everyone held my religious beliefs.” Independents and Democrats are less likely than Republicans to believe that their religious beliefs would solve the debate on abortion (26% and 25% vs. 43%, respectively).
White evangelical Protestants are the only religious group in which the majority agree that the debate on abortion would not be an issue if everyone else had the same religious beliefs, with 58% expressing this view. More than four in ten other Christians (42%) and less than three in ten white Catholics, non-Christian religious, Hispanic Catholics, Black Protestants, and white mainline Protestants (29%, 27%, 23%, 22%, and 21%, respectively) think their religious beliefs would solve the issue of abortion.
A slim majority of Americans who hold the idea that abortion should be illegal (51%) believe that there would not be a debate on abortion if their religious beliefs were held by everyone. Only 21% of those who believe that abortion should be legal say the same.
Survey Methodology
The survey was designed and conducted by PRRI. The survey was made possible through the generous support of the David and Lucile Packard Foundation, as well as Michelle Mercer and Bruce Golden. The survey was conducted among a random sample of 22,984 adults (age 18 and up) living in all 50 states and the District of Columbia in the United States. Among those, 20,603 are part of Ipsos’s Knowledge Panel and an additional 2,381 were recruited by Ipsos using opt-in survey panels to increase the sample sizes in smaller states. Interviews were conducted online between March 11 and December 14, 2022.
The June survey was designed and conducted by PRRI among a random sample of 2,038 adults (age 18 and up) living in all 50 states and the District of Columbia in the United States who are part of Ipsos’s Knowledge Panel. Interviews were conducted online between June 24 and 26, 2022. The margin of error for that national survey is +/- 2.3 percentage points at the 95% level of confidence, including the design effect for the survey of 1.1.
Respondents are recruited to the KnowledgePanel using an addressed-based sampling methodology from the Delivery Sequence File of the USPS – a database with full coverage of all delivery addresses in the U.S. As such, it covers all households regardless of their phone status, providing a representative online sample. Unlike opt-in panels, households are not permitted to “self-select” into the panel; and are generally limited to how many surveys they can take within a given time period.
The initial sample drawn from the KnowledgePanel was adjusted using pre-stratification weights so that it approximates the adult U.S. population defined by the 2019 American Community Survey (ACS). Next, a probability proportional to size (PPS) sampling scheme was used to select a representative sample.
To reduce the effects of any non-response bias, a post-stratification adjustment was applied based on demographic distributions from the ACS. The post-stratification weight rebalanced the sample based on the following benchmarks: age, race and ethnicity, gender, Census division, metro area, education, and income. The sample weighting was accomplished using an iterative proportional fitting (IFP) process that simultaneously balances the distributions of all variables. Weights were trimmed to prevent individual interviews from having too much influence on the final results. In addition to an overall national weight, separate weights were computed for each state to ensure that the demographic characteristics of the sample closely approximate the demographic characteristics of the target populations. The state-level post-stratification weights rebalanced the sample based on the following benchmarks: age, race and ethnicity, gender, education, and income.
These weights from the KnowledgePanel cases were then used as the benchmarks for the additional opt-in sample in a process called “calibration.” This calibration process is used to correct for inherent biases associated with nonprobability opt-in panels. The calibration methodology aims to realign respondents from nonprobability samples with respect to a multidimensional set of measures to improve their representation.
The margin of error for the national survey is +/- 0.8 percentage points at the 95% level of confidence, including the design effect for the survey of 1.7. In addition to sampling error, surveys may also be subject to error or bias due to question wording, context, and order effects. Additional details about the KnowledgePanel can be found on the Ipsos website: https://www.ipsos.com/en-us/solution/knowledgepanel
Endnotes
[1] https://www.nytimes.com/interactive/2022/us/abortion-laws-roe-v-wade.html
[2] https://states.guttmacher.org/policies/wisconsin/abortion-policies
[3] https://www.pewtrusts.org/en/research-and-analysis/blogs/stateline/2022/05/19/some-states-already-are-targeting-birth-control
[4] Other Catholics of color includes all Catholics who are not white or Hispanic. Other Protestants of color includes all non-Catholic Christians who are not white, Black, Hispanic, or in another category.
[5] The question wording was tweaked to reflect that Roe had been overturned after the Dobbs decision in late June.
[6] Other religious groups do not have enough people in this category to report.
[7] PRRI did a question-wording test on this item, asking half of the sample about these laws as described here and asking the other half the same question but adding the statement “when many women are not even yet aware they are pregnant.” There was not a significant difference in responses: 62% oppose the first, and 64% oppose the second, compared with about one-third who favor such laws (35% and 32%, respectively). To maximize the number of cases, we combined the responses for both samples in this report.
[8] Each question was combined using an additive scale that was converted into a 4-point scale where a score of 1 indicates strongly favor, 2 indicates favor, 3 indicates oppose, and 4 indicates strongly oppose. The question related to favoring or opposing ensuring that at least some health care professionals in their community provide legal abortions was reversed in order to have all questions load positively on the same factor. The Cronbach’s alpha for all these questions is 0.94, confirming high internal consistency across all these questions.


