When Americans Voted, or Why They Didn’t
Consistent with reported voting patterns in 2012, more than six in ten (63%) voters said they voted on Election Day, compared to 37% who reported voting earlier. There were no significant voting pattern differences between supporters of Hillary Clinton and Donald Trump.
Among eligible voters who did not cast a ballot, the most frequently reported reason was negative feelings about the candidates (36%). Nearly one-quarter (23%) of eligible nonvoters said they did not have enough time to get to a polling location, and a similar number (21%) reported they did not vote because they were not registered. Roughly one in ten (11%) eligible nonvoters said they did not vote because they believe the election system is rigged.
Clinton had less success than Trump in converting supporters into actual voters. Only about three-quarters (76%) of registered voters who reported that they were supporting or leaning towards Clinton in late September and early October reported actually casting a ballot for her. In contrast, 84% of those who reported they were supporting Trump ahead of the election said they voted for him.1 There were few defections on either side, with only 2% of early Clinton supporters turning to vote for Trump and 2% of early Trump supporters casting a ballot for Clinton. However, voters who supported Clinton ahead of the election were nearly twice as likely as those supporting Trump ahead of the election to report that they did not cast a ballot in the 2016 election (13% vs. 7%, respectively).
Did Clinton Voters’ Husbands Sit Out the Election?
About two-thirds (66%) of female Clinton voters said their spouses or partners also supported Clinton, and one in ten said their spouses or partners voted for Trump (5%) or another candidate (5%). Notably, however, about one in five (19%) women who voted for Clinton reported their husband or partner did not vote in the 2016 election.
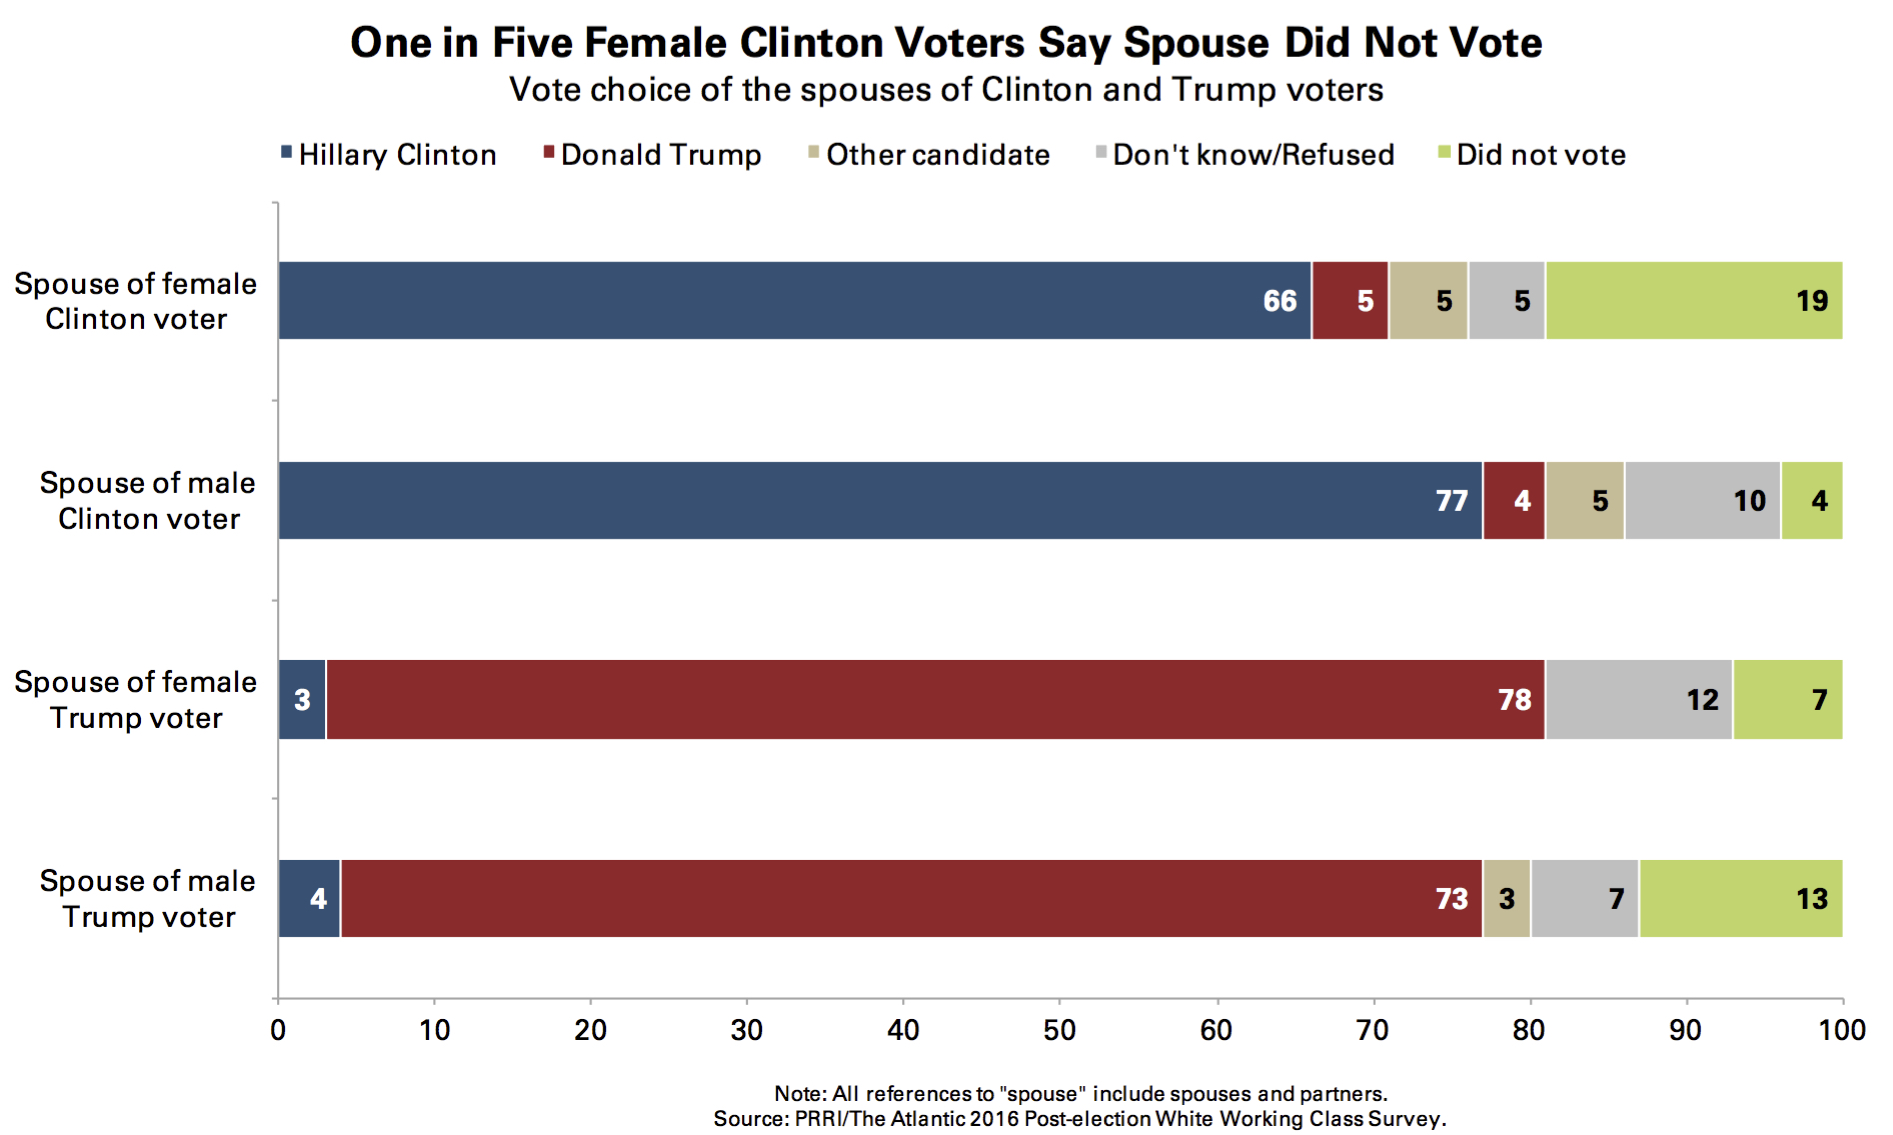
In contrast, nearly three-quarters (73%) of male Trump supporters said their wife or partner was also supporting the GOP nominee, and few said their spouses or partners voted for Clinton (4%) or another candidate (3%). Thirteen percent of male Trump supporters reported that their wife or partner did not vote.
How Divided Are We?
By a margin of two to one, Americans are more likely to say the 2016 election “shows just how divided our country has become” than they are to say “elections always make the country seem more divided than it really is” (63% vs. 32%, respectively). There are yawning partisan gaps in views about what the election signifies.
Approximately eight in ten (79%) Democrats say the election shows just how divided the country has become. Republicans (54%) are substantially less likely to say the election demonstrates the division within the country today. More than four in ten (43%) Republicans say elections make the country seem more divided than it is.
Consistent with previous research, partisan enmity appears to be a significant factor in political polarization. A majority (56%) of Republicans and 61% of Trump voters say that the policies of the Democratic Party constitute a dangerous threat to the country. About four in ten (38%) Republicans believe that Democratic policies are misguided but not dangerous. Conversely, a slim majority (51%) of Democrats and half (50%) of Clinton supporters believe that the GOP’s platform represents a threat the country.
Roughly two-thirds (66%) of Republicans and a majority (56%) of Democrats say their respective party’s policies move the country in the right direction. Approximately one-quarter (26%) of Republicans and three in ten (30%) Democrats say the policies of their own party are misguided.
Americans Feel More Negative than Positive about Election Outcome
Overall, more Americans report feeling disappointed, worried, or angry about the election outcome than express feelings of satisfaction or excitement. Half of all Americans report feeling worried (26%), disappointed (19%), or angry (5%). More than four in ten say they feel satisfied (23%) or excited (19%) about the election’s outcome. In 2012, a majority of Americans reported feeling satisfied (31%) or excited (22%) about the outcome of the election, and fewer than half said they were worried (23%), disappointed (20%), or angry (2%).
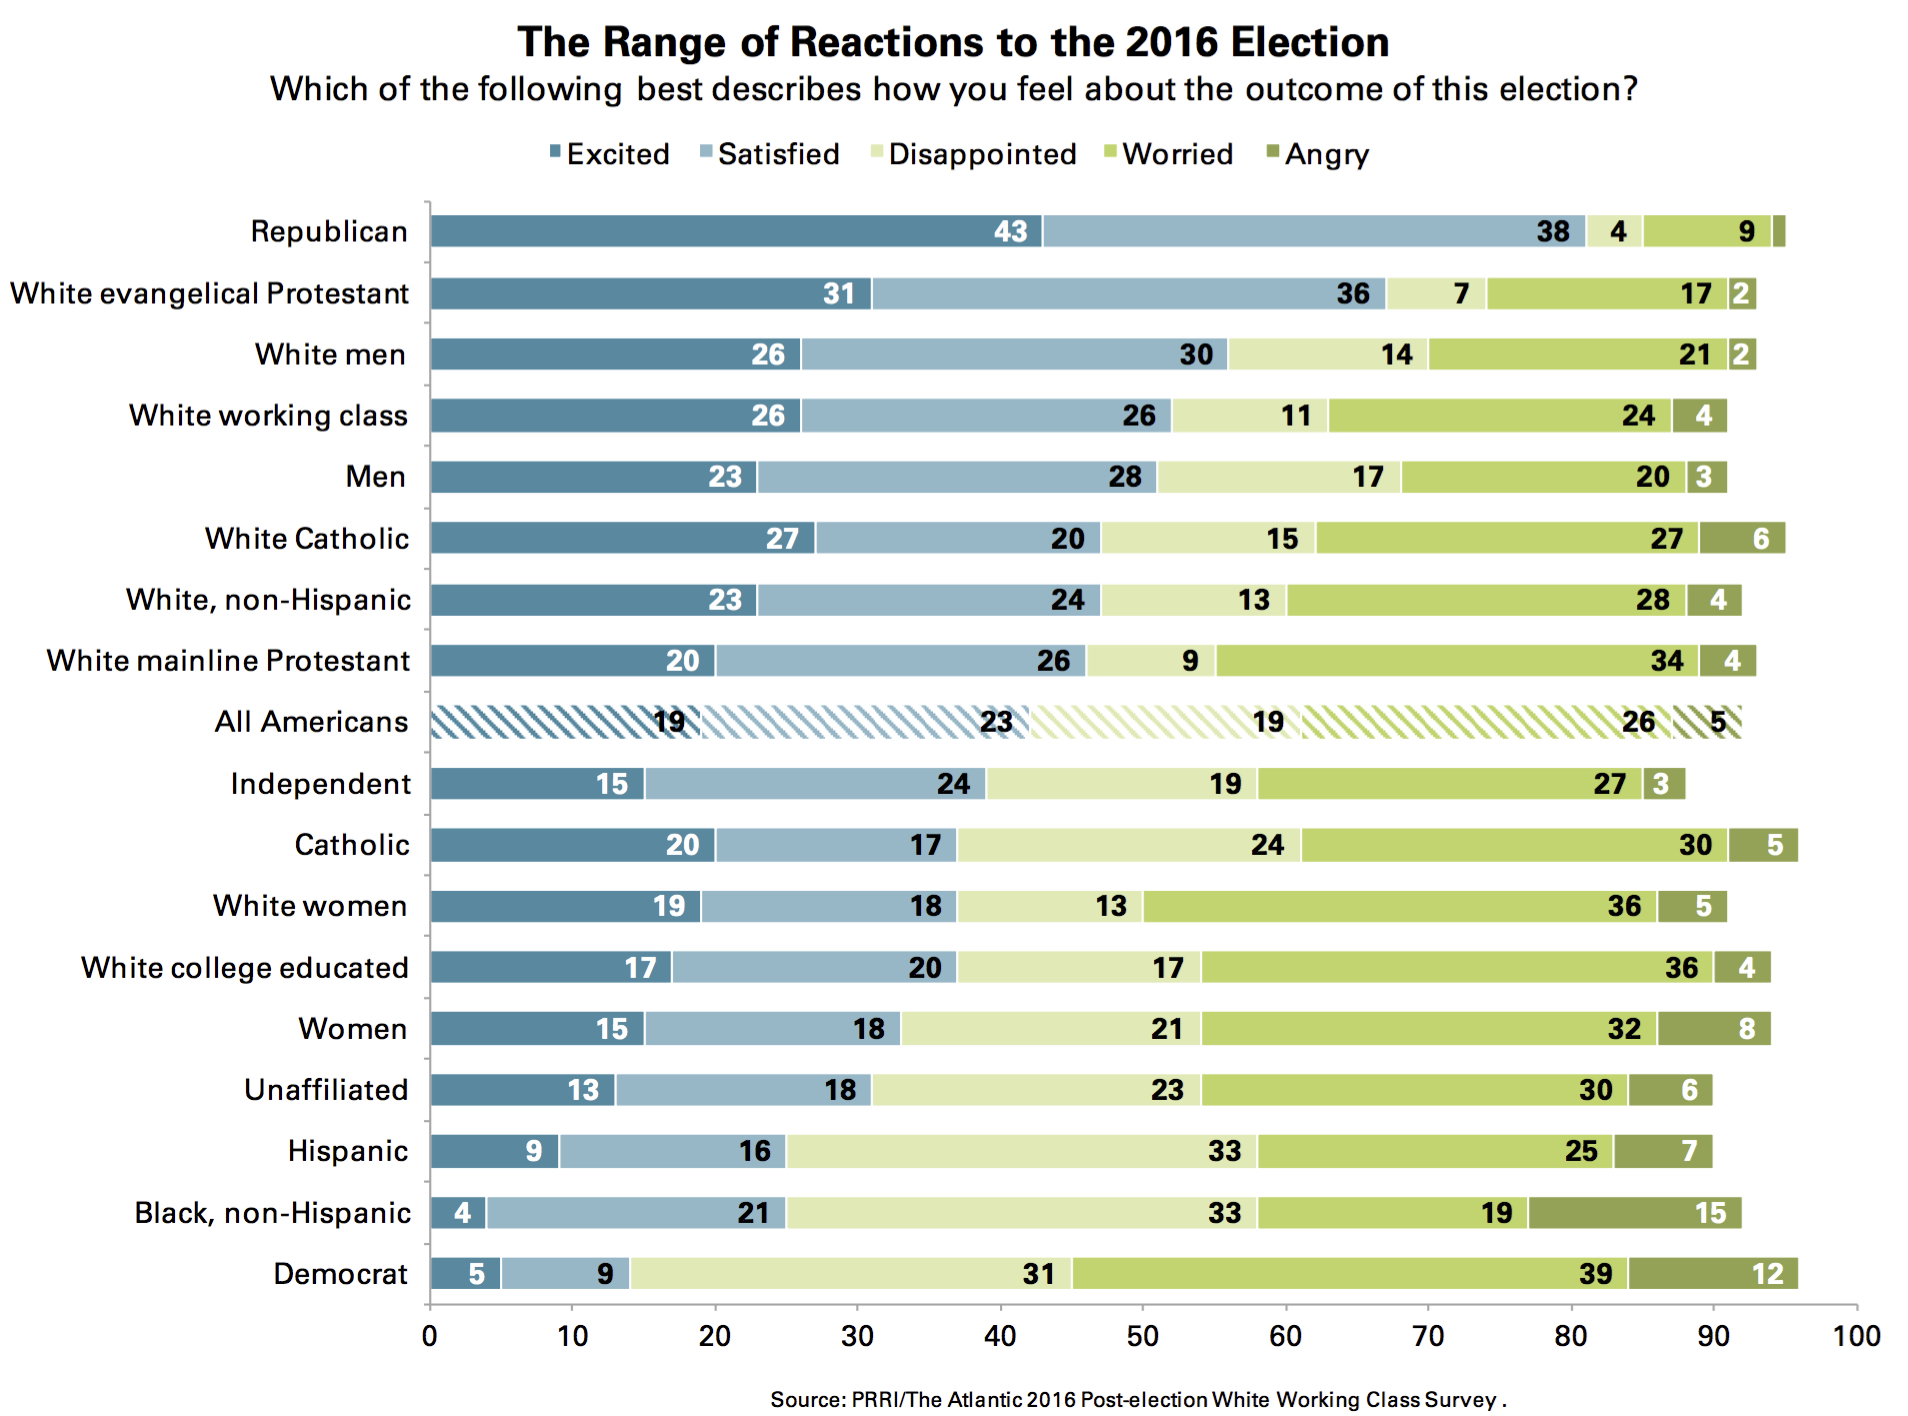
The reactions of Republicans in 2012 after Mitt Romney’s loss were somewhat more negative than Democrats’ reactions to Clinton’s defeat in 2016, although Democrats remain angrier about the 2016 result. More than nine in ten Republicans said they felt disappointed (38%), worried (49%), or angry (4%) about President Obama’s reelection in 2012. In 2016, roughly eight in ten Democrats report feeling disappointed (31%), worried (39%), or angry (12%) about Trump’s win. Conversely, Republicans are less positive about Trump’s victory this year than Democrats were in 2012 after Obama’s reelection. More than eight in ten (81%) Republicans feel satisfied or excited about Trump’s recent win while more than nine in ten (91%) Democrats said the same in 2012.
Stark racial, ethnic, and class divisions in election sentiments are also apparent. Less than half of whites say they are either satisfied (24%) or excited (23%) about Trump winning the election, while a similar number say they are disappointed (13%), worried (28%), or angry (4%). There are notable class divisions among whites. A majority of white working-class Americans say they feel satisfied (26%) or excited (26%) about Trump’s electoral victory. In contrast, fewer than four in ten white college-educated Americans say they feel satisfied (20%) or excited (17%). In 2012, only about one in three white working-class Americans reported feeling either excited (12%) or satisfied (23%) about Obama’s reelection. More than six in ten said they were disappointed (29%), worried (29%), or angry (4%).
Majorities of black and Hispanic Americans report generally negative feelings about the election outcome, expressing feelings of disappointment (33% and 33%, respectively), worry (19% and 25%, respectively) or anger (15% and 7%, respectively).
Men and women also express quite different reactions. A slim majority of men report feeling satisfied (28%) or excited (23%) about the prospect of a Trump presidency, while only about one-third of women share these feelings—18% are satisfied and 15% are excited. Roughly one-third (32%) of women say they are worried, 21% say they are disappointed, and eight percent are angry about the election outcome. Negative feelings among non-white women are even more pronounced; 35% of non-white women say they are disappointed, 26% say they are worried, and 12% say they are angry.
Among religious groups, white evangelical Protestants view Trump’s election most positively. Two-thirds of white evangelical Protestants report being excited (31%) or satisfied (36%) with the election result. Despite winning a majority of white Catholic and white mainline Protestant votes, fewer than half of each group feel positively about Trump’s win. Fewer than half of white Catholics report feeling excited (27%) or satisfied (20%) by Trump’s victory while similar numbers of white mainline Protestants say they feel excited (20%) or satisfied (26%).
The 2016 Election: The Last Chance to Stop America’s Decline?
Roughly four in ten (41%) Americans believe the 2016 election represented the last chance to stop America’s decline. A majority (57%) of the public reject this characterization of the election.
This sentiment is much more common among Republicans than Democrats. Six in ten (60%) Republicans and 66% of Trump voters believe the election represented the last opportunity to arrest America’s decline, while only 29% of Democrats and 22% of Clinton voters embrace this view. More than two-thirds (68%) of Democrats and 76% of Clinton voters reject this idea. The views of political independents closely resemble those of the public overall.
Importantly, white working-class Americans are divided about what the election represented. Nearly half (49%) of white working-class Americans believe the election was the last chance to stop America’s decline, while about as many (50%) disagree. Fewer than three in ten (27%) white college-educated Americans believe the election was the last chance to stop America’s decline.
Few Cite Voter Fraud as Most Serious Problem Facing the Election System
Americans are divided about what constitutes the most serious problem in our current election system, but few cite the issue of voter fraud. One in three (33%) Americans say media bias against particular candidates is the most serious problem with the election system. Nearly one-quarter (24%) of Americans believe the disproportionate influence of wealthy individuals and corporations in elections is the most serious problem, while 16% say low voter participation is the most problematic issue. Fewer than one in ten Americans cite voter fraud (6%) or laws that make it difficult for people to vote (7%) as the most serious problems.
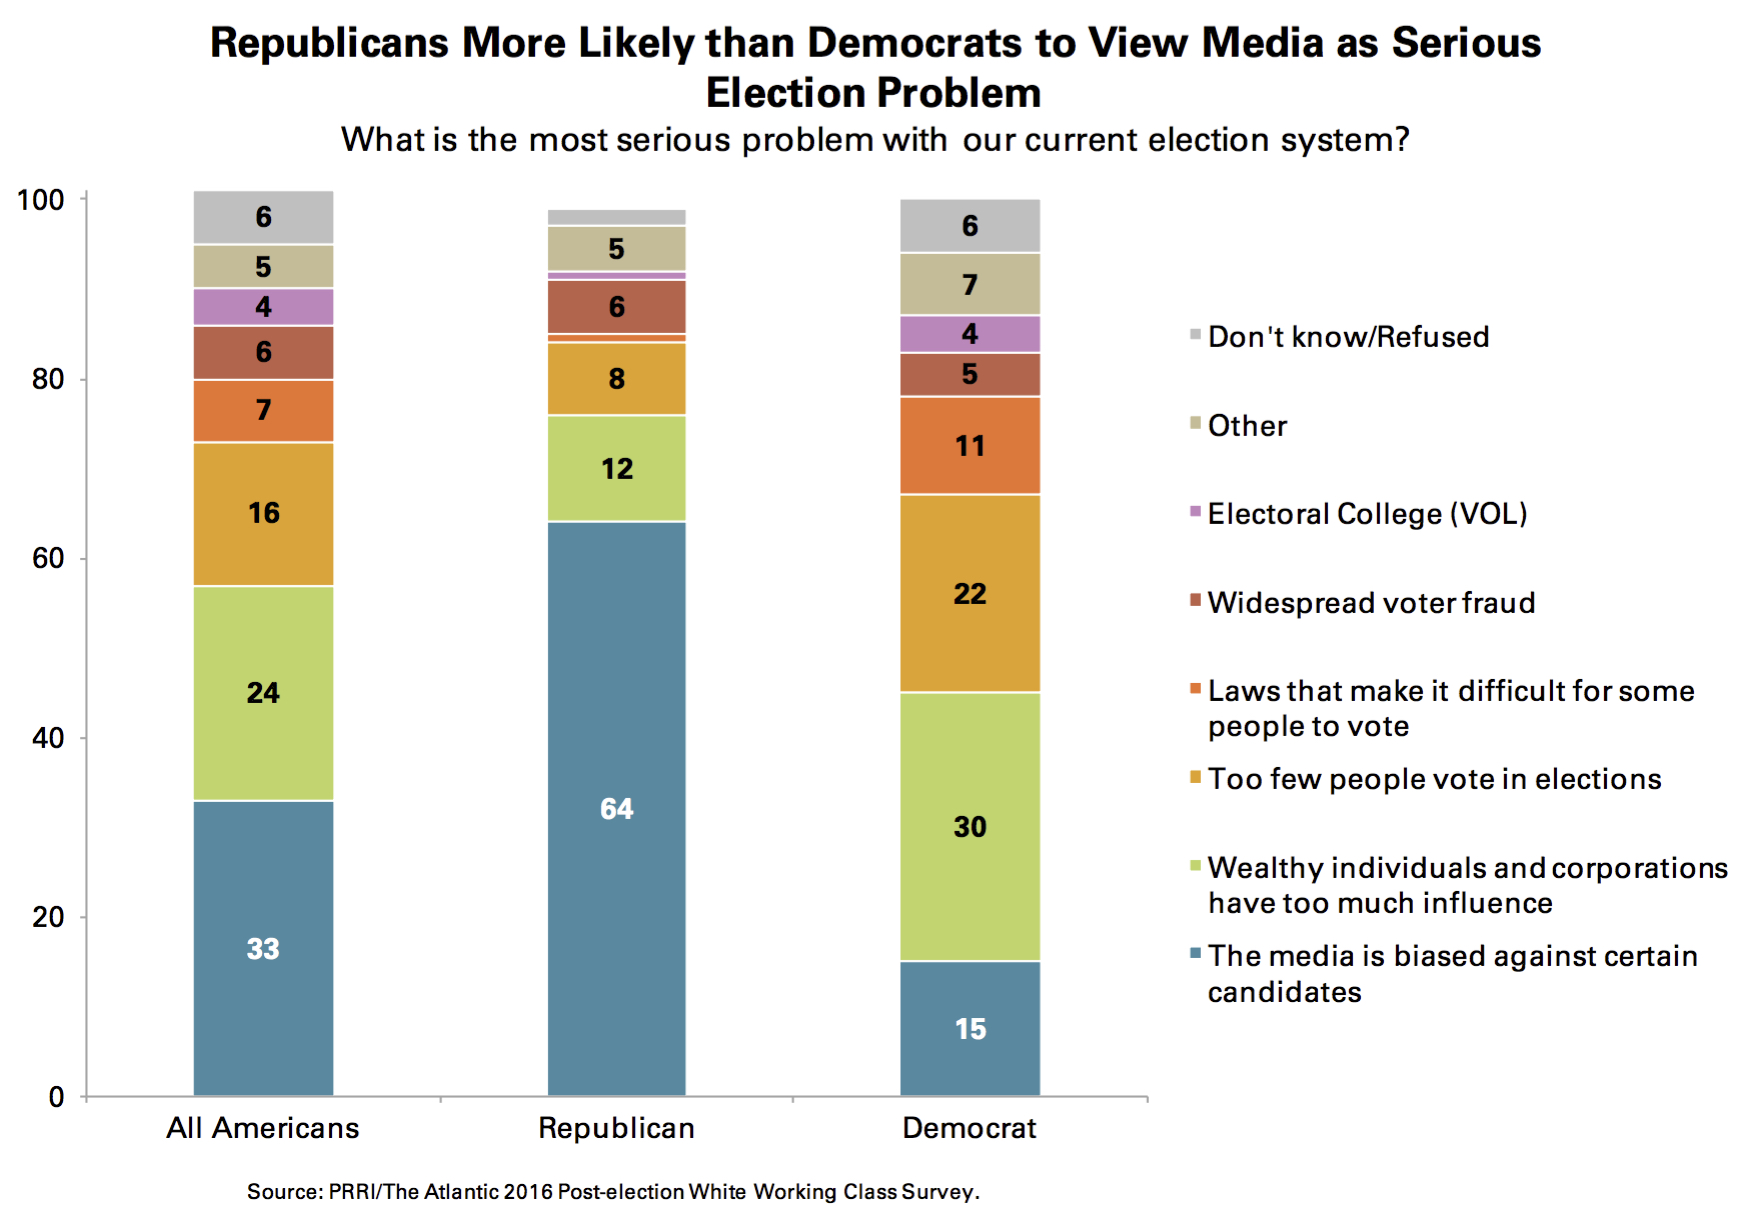
Perceptions of the most pressing problems with the election system diverge sharply by partisan identity. Nearly two-thirds (64%) of Republicans say the most serious problem with the U.S. election system is that the media is not balanced in its treatment of candidates. Only 15% of Democrats share this view. Democrats are much more likely than Republicans to say the influence of the wealthy and corporations (30% vs. 12%, respectively), low voter participation (22% vs. 8%, respectively) and laws that prevent certain types of people from voting (11% vs. 1%, respectively) are their most serious concerns. The views of political independents mirror those of the general public. Notably, only six percent of Republicans and five percent of Democrats say voter fraud is the most serious issue with the election system.
Did Trump’s Rhetoric on Immigrants Hurt His Campaign?
Americans generally believe that Trump’s controversial remarks about immigrants and hardline positions on immigration reform benefitted him more than it hurt his election prospects. Nearly half (48%) of the public says Trump’s position on immigration and immigrants helped him during the 2016 election, while only 13% said it hurt him. Roughly one-third (32%) say it did not make a difference either way.
Whites (54%) are considerably more likely than Hispanics (40%) and blacks (28%) to believe Trump’s position on immigration was a boon to his campaign. Notably, white college-educated Americans are more likely than white working-class Americans to believe Trump’s rhetoric on this topic helped him (62% vs. 51%, respectively).
There are few differences in views by party with a majority of Democrats (54%) and nearly half (49%) of Republicans in agreement that Trump’s immigration positions aided his campaign.
Looking Toward the Future
After the election, most Americans have modest expectations for change in their local communities. A slim majority (51%) of the public say that the quality of life in their community will probably stay about the same while 28% believe it will improve and 18% say things will get worse. There are stark differences between the views of Americans by political affiliation.
A slim majority (51%) of Republicans say that the quality of life in their community will get better while only 16% of Democrats share this view. However, only 27% of Democrats say the quality of life in their local community is likely to decline while most (55%) say it will probably remain about the same.
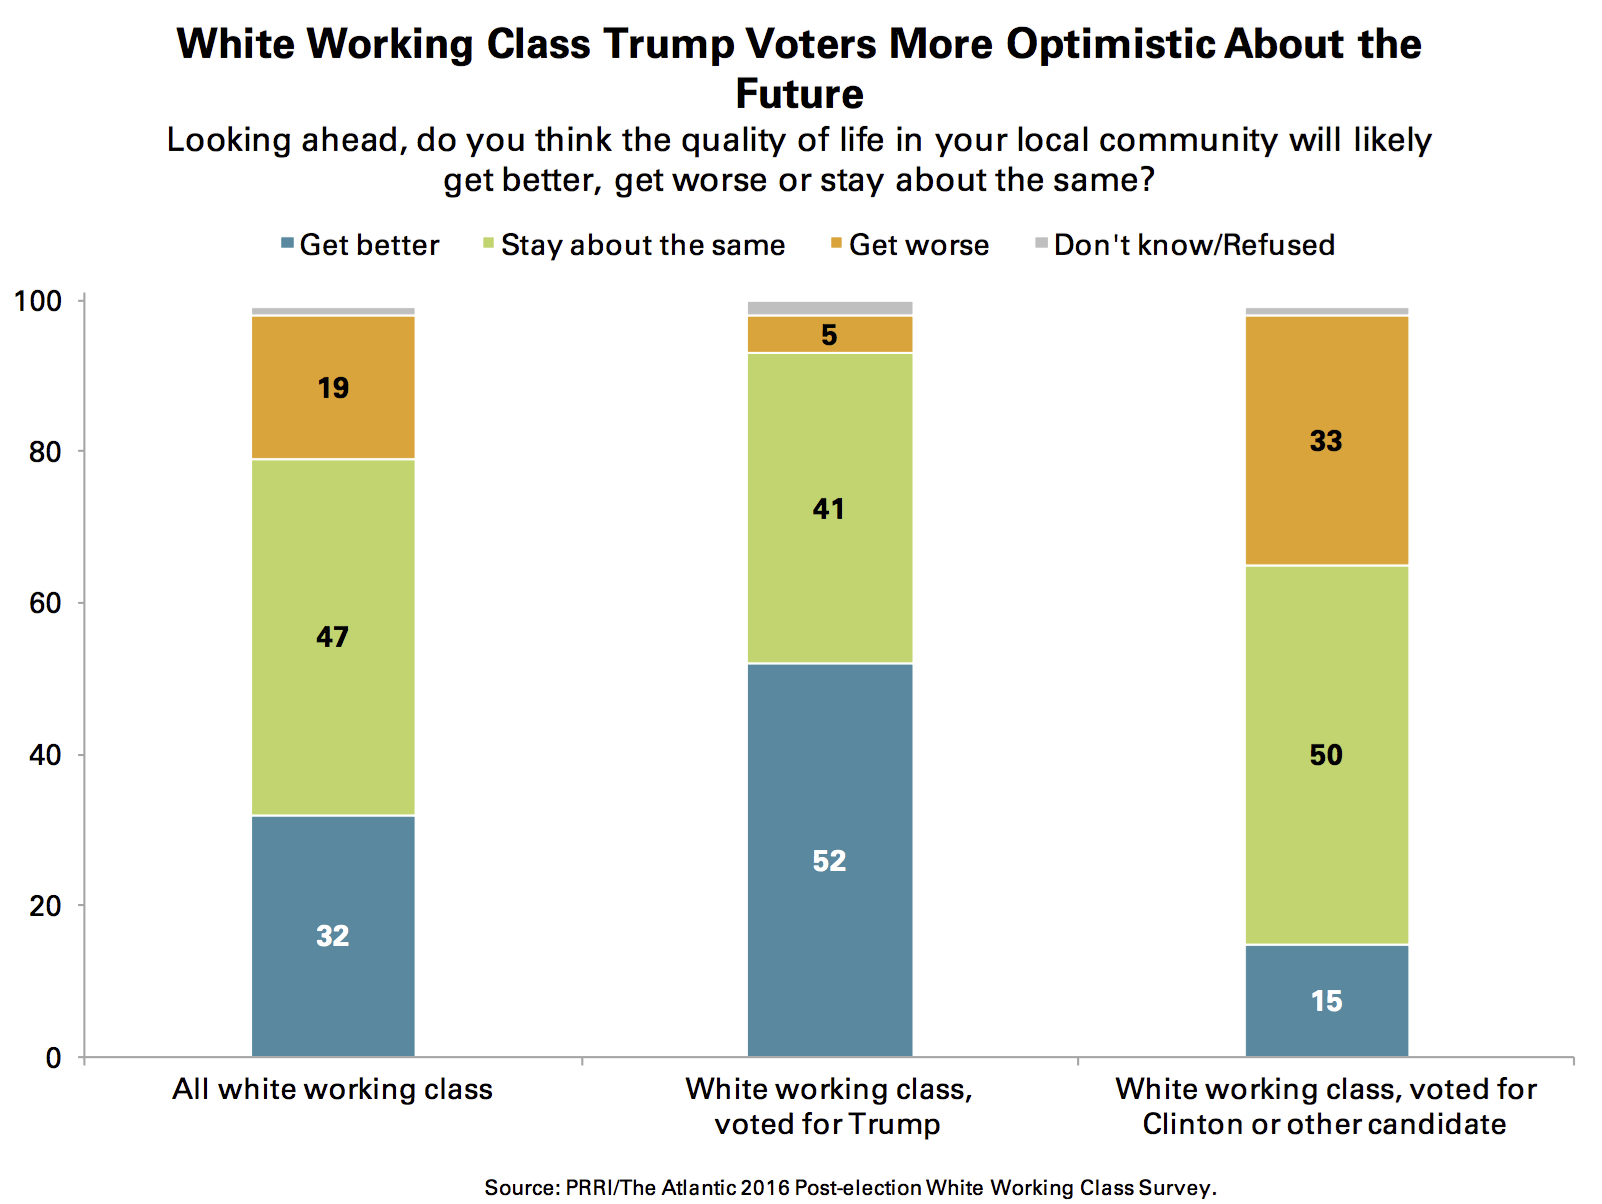
Notably, there are no significant differences in the views of whites, blacks and Hispanics and no differences by social class. Only about one-third (32%) of white working-class Americans say the quality of life in their community will improve, 19% say things will get worse and nearly half (47%) say they will remain the same. However, a majority (52%) of white working-class Americans who voted for Trump believe that the quality of life in their community is set to improve in the future. In contrast, only 15% of white working class voters who supported Clinton or a third-party candidate believe things in their community are likely to improve.
Endnotes:
1The current survey re-contacted respondents originally interviewed from September 22 to October 9, 2016.
Recommended citation:
Jones, Robert P., Daniel Cox, Betsy Cooper, and Rachel Lienesch. “Nearly One in Five Female Clinton Voters Say Husband or Partner Didn’t Vote.” PRRI. 2016. http://www.prri.org/research/prri-atlantic-poll-post-election-white-working-class/.
Featured image by nshepard.